Comparative Analysis Financial Performance of INDUSIND BANK With Other Four Banks
131
A summer Project On: “Comparative Analysis: Financial performance of INDUSIND BANK with other four Banks In In partial fulfillment of MBA Degree Summer Training Project SUBMITTED BY:
-
Upload
kawalpreetyahoo -
Category
Documents
-
view
70 -
download
1
description
Comparative Analysis Financial performance of INDUSIND BANK with other four Banks
Transcript of Comparative Analysis Financial Performance of INDUSIND BANK With Other Four Banks
A summer Project On:
“Comparative Analysis: Financial performance of INDUSIND BANK
with other four Banks
In
In partial fulfillment of MBA Degree Summer Training Project
SUBMITTED BY:
Objective
The project was conducted with following objective.
To know about different services and facilities provided by banking companies other than that of INDUSIND Bank.
To discover the significant changes that the Indian banking sector has gone and at what par INDUSIND Bank is able to cope with these Changes.
To get insight over current situation and its prospects by studying, comparing, analyzing and interpreting the reports of their annual performance during last few years.
This report provides sufficient Research and rational analysis on performance of INDUSIND Bank and other four banks.
It has been made to help in evaluating the opportunities, challenges and driving critical to the growth of INDUSIND BANK.
INTRODUCTION
IndusInd Bank Ltd is the new generation Indian bank based at Mumbai - the financial capital of the nation. Founded in 1994, IndusInd Bank Ltd provides a range of products and services to its customers, which include transactional, commercial and electronic banking products and services. It is also one of the foremost new generation private banks in India.
Business overview
IndusInd Bank derives its name and inspiration from the Indus Valley civilisation - a culture described by National Geographic as 'one of the greatest of the ancient world' combining a spirit of innovation with sound business and trade practices.
Mr. Srichand P. Hinduja, a leading Non-Resident Indian businessman and head of the Hinduja Group, conceived the vision of IndusInd Bank - the first of the new-generation private banks in India - and through collective contributions from the NRI community towards India's economic and social development, brought our Bank into being.
The Bank, formally inaugurated in April 1994 by Dr. Manmohan Singh, Honourable Prime Minister of India who was then the country’s Finance Minister, started with a capital base of Rs.1,000 million (USD 32 million at the prevailing exchange rate), of which Rs.600 million was raised through private placement from Indian Residents while the balance Rs.400 million (USD 13 million) was contributed by Non-Resident Indians.
A NEW ERA
IndusInd Bank is one of the new generation private-sector banks in India, which commenced its operations in 1994. The Bank caters to the needs of both Consumer & Corporate Clients and has a robust technology platform supporting multi – channel delivery capabilities. The Bank enjoys a patronage of 2 million customers and has a network of 209 branches and 427 ATMs spread over 168 geographical locations in 28 states and union territories across the country. The Bank also has a Representative Office in Dubai and London.
The Bank’s total business (deposits plus advances) as on December 31, 2009 crossed Rs. 43,000 crore. The Bank is driven by state-of-the-art technology since its inception. It has multi-lateral tie-ups with other banks providing access to more than 21000 ATMs for its customers. It enjoys clearing bank status for both major stock exchanges - BSE and NSE - and three major commodity exchanges in the country – MCX, NCDEX, and NMCE. The Bank has been bestowed with the mandate of being a Settlement Banker for tea auctions at Kolkata, Siliguri, Coonoor, Coimbatore and Guwahati.
During the quarter, in a pioneering initiative in ‘Green Banking’ the Bank became the first bank in Maharashtra to open a solar-power ATM. Subjects like sustainable development, social responsibility and climate change are fast becoming part of the corporate vocabulary and IndusInd is at the forefront of this change in the Indian banking sector.
The Bank has been awarded the highest P1+ rating for its Fixed Deposits and Certificates of Deposit by CRISIL. Recently, CRISIL has reaffirmed its P1+ rating of IndusInd Bank’s fixed deposits and certificates of deposit program. The rating continues to reflect the Bank’s established presence in the Commercial Vehicle (CV) financing business and the significant improvement in its asset quality. The rating also features in the Bank’s modest resource and earnings profile, and average capitalisation levels.
Products and Services
IndusInd Bank Ltd offers a wide array of transactional, commercial and electronic banking products and services.
Personal Banking Accounts
o Indus classic Savings Account o Indus Easy Savings Account o Demat Account o RFC Account o Current Account o Specialized Account o Indus Privilege
Savings Account o Indus Young Saver
Deposits o Flexi Term Deposit o Sweep -In / Seep-
Out Deposit o Young Saver
Deposit o Senior Citizen
Scheme o Regular Recurring Deposit o Flexi Recurring Deposit
Loans o Home Loans o Small Business Loan o Commercial Vehicle Loan o Car Loan o Two-wheeler Loano Construction Equipment Loan o Loan Against Shares o Loan Against Property o Loan Against Rent Receivables o Loan Against Mutual Funds
Cards
o Regular Debit Card
o Gold Debit Card
o Indus Money o Summer
Swipe Special Wealth Management
Services o Portfolio
Management o Investments o Insurance o Survana
Mudra Corporate Banking
o Large Indian Companies
o Small & Medium Enterprises
o Supply Chain Management International Banking
o Correspondent Banking o SWIFT o Advisory Services o Facilities to Exporters o Trade Finance o RFC Account for Residents o Gold Banking
Investment Banking Treasury
o Foreign Exchange Desk o Money Market Desk o Derivatives Desk
Capital & Commodities Markets o Stock Exchange Cell o Commodities Exchange Cell o Banker to Public / Rights o Debenture Trustee o IPO Funding o Loan Against Demat Shares o Depository Services

NRI Services o Deposit Schemes o Value Added Services o Returning NRIs o Remittances o Investments o Taxation
Online Banking o IndusNet - Internet Banking o Indus Pay - e-wallet o VISA Money Transfer o ATMs o Indus Billpayo Mobile Top-Ups o Mobile Banking
RTGS / NEFT
Listed in Stock Exchange
The Bank has authorised share capital of Rs. 500.00 crores comprising 50,00,00,000 equity share of Rs. 10/- each. Ason 31st March 2010, the Bank has issued, subscribed and paid-up capital of Rs. 410.65 crores, constituting 41,08,38,840shares of Rs. 10/- each. The Bank’s shares are listed on the National Stock Exchange and the Bombay Stock Exchange.The GDRs issued by the Bank are listed on the Luxembourg Stock Exchange.
Associates and subsidiaries
Associates: IndusInd Information Technology LimitedIndusInd Marketing and Financial Services Private LimitedIBL Services & Solutions Private LimitedSubsidiaries: ALF Insurance Services Private Limited

Registered Office Corporate Office Secretarial & Investor Services 2401, Gen. Thimmayya Road
8th Floor, Tower 1, One Indiabulls Centre731, Solitaire Corporate Park
(Cantonment) 841, SenapatiBapatMarg 167, Guru HargovindjiMargPune-411001 Elphinstone Road (W) Andheri (E), Mumbai - 400 093
Mumbai-400013
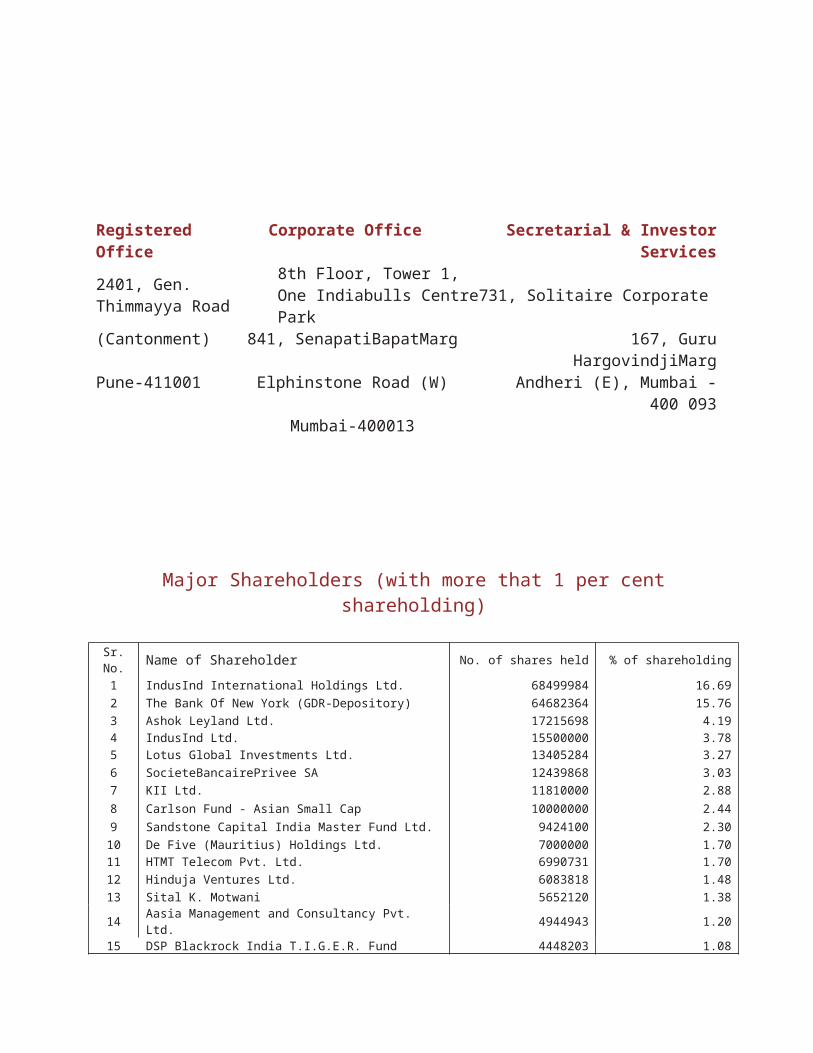
Major Shareholders (with more that 1 per cent shareholding)
Sr. No. Name of Shareholder No. of shares held % of shareholding
1 IndusInd International Holdings Ltd. 68499984 16.69
2 The Bank Of New York (GDR-Depository) 64682364 15.76
3 Ashok Leyland Ltd. 17215698 4.19 4 IndusInd Ltd. 15500000 3.78 5 Lotus Global Investments Ltd. 13405284 3.27
6 SocieteBancairePrivee SA 12439868 3.03
7 KII Ltd. 11810000 2.88
8 Carlson Fund - Asian Small Cap 10000000 2.44
9 Sandstone Capital India Master Fund Ltd. 9424100 2.30
10 De Five (Mauritius) Holdings Ltd. 7000000 1.70 11 HTMT Telecom Pvt. Ltd. 6990731 1.70
12 Hinduja Ventures Ltd. 6083818 1.48
13 Sital K. Motwani 5652120 1.38
14 Aasia Management and Consultancy Pvt. Ltd. 4944943 1.20 15 DSP Blackrock India T.I.G.E.R. Fund 4448203 1.08
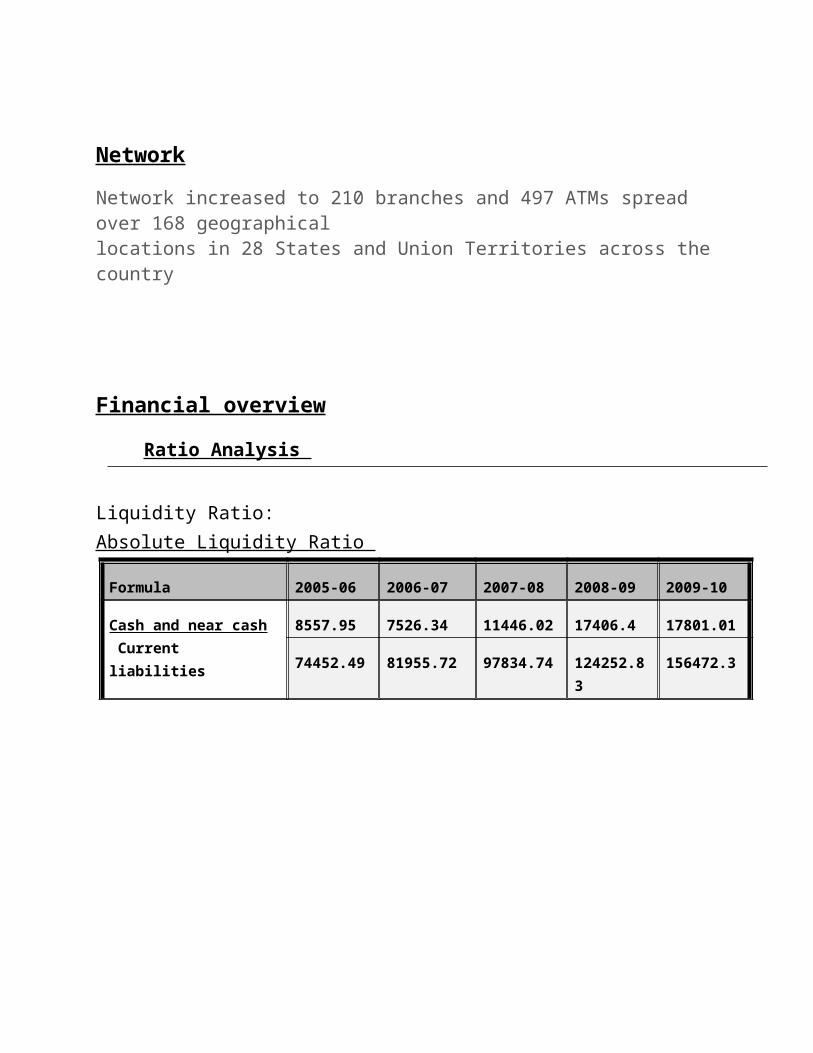
Network
Network increased to 210 branches and 497 ATMs spread over 168 geographicallocations in 28 States and Union Territories across the country
Financial overview
Ratio Analysis
Liquidity Ratio:Absolute Liquidity Ratio
Formula 2005-06 2006-07 2007-08 2008-09 2009-10
Cash and near cash Current liabilities
8557.95 7526.34 11446.02 17406.4 17801.01
74452.49 81955.72 97834.74 124252.83 156472.3
Ratio 0.115 0.092 0.117 1.398 0.114
The absolute liquidity ratio of the bank seems to be very inconsistent during the period , although the starting ratio is the same . The liquidity of the company has been mainly influenced by the mount in cash and balance with RBI.
Solvency ratio:
Debt equity ratio
Formula 2005-06 2006-07 2007-08 2008-09 2009-10
Long term debtShareholder Fund
6250.07 8308.67 9190.63 11379.8 12088.4
4161.13 4600.53 5133.62 6030.39 10695.56
Ratio 1.502 1.806 1.790 1.887 1.130
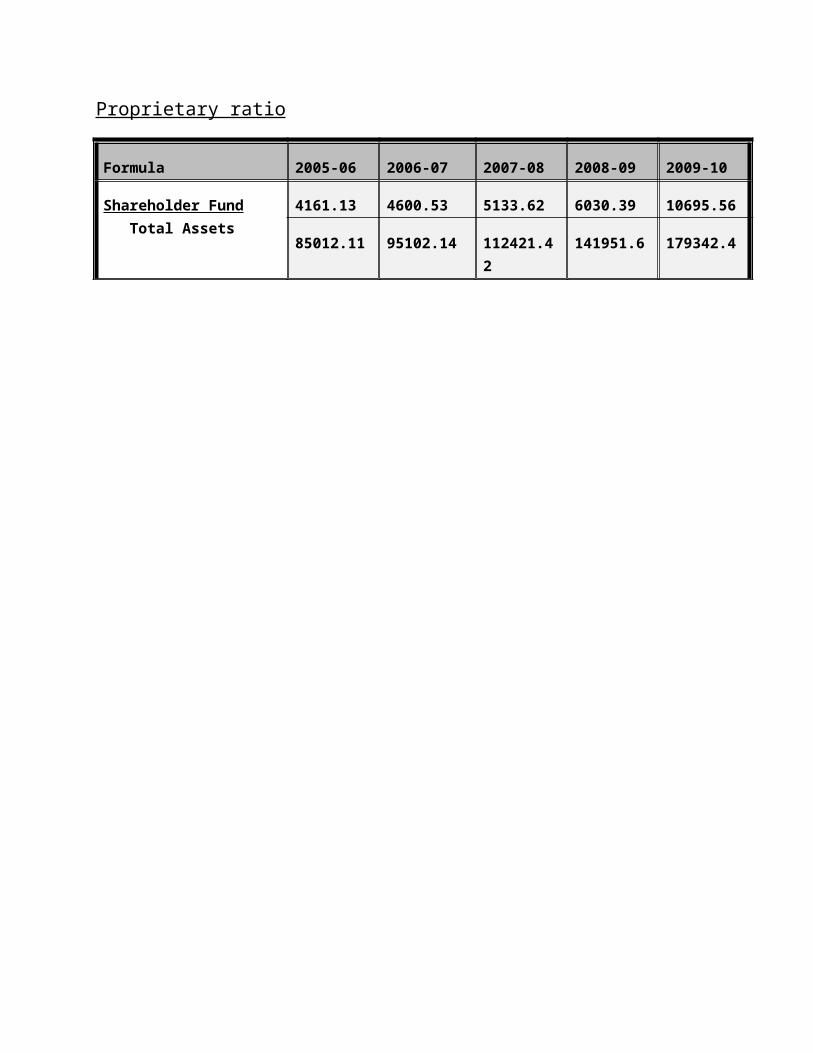
Proprietary ratio
2005-06 2006-07 2007-08 2008-09 2009-100.000
0.020
0.040
0.060
0.080
0.100
0.120
0.140
0.160
Absolute liquidity Ratio
Absolute liquidity Ratio
Formula 2005-06 2006-07 2007-08 2008-09 2009-10
Shareholder Fund Total Assets
4161.13 4600.53 5133.62 6030.39 10695.56
85012.11 95102.14 112421.42 141951.6 179342.4
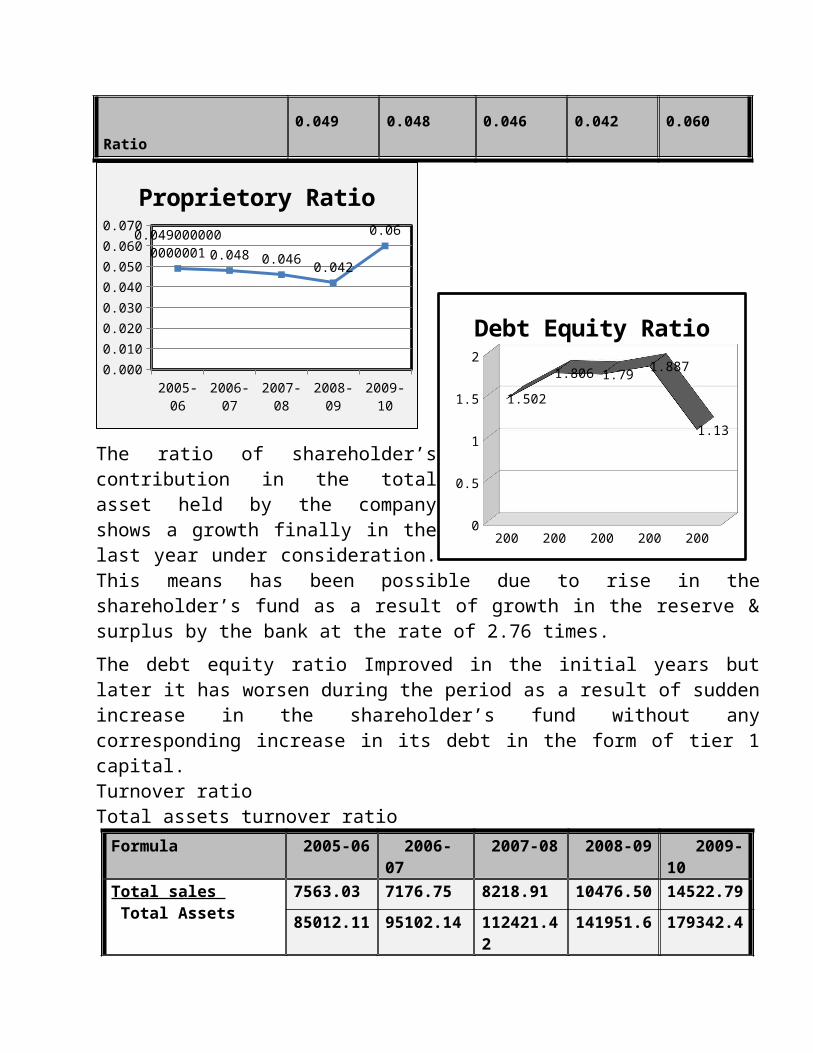
Ratio 0.049 0.048 0.046 0.042 0.060
2005-06 2006-07 2007-08 2008-09 2009-100.000
0.010
0.020
0.030
0.040
0.050
0.060
0.070
0.0490000000000001 0.048 0.046
0.042
0.06
Proprietory Ratio
The ratio of shareholder’s contribution in the total asset held by the company shows a growth finally in the last year under consideration. This means has been possible due to rise in the shareholder’s fund as a result of growth in the reserve & surplus by the bank at the rate of 2.76 times.
The debt equity ratio Improved in the initial years but later it has worsen during the period as a result of sudden increase in the shareholder’s fund without any corresponding increase in its debt in the form of tier 1 capital.Turnover ratioTotal assets turnover ratio
Formula 2005-06 2006-07 2007-08 2008-09 2009-10Total sales Total Assets
7563.03 7176.75 8218.91 10476.50 14522.79
85012.11 95102.14 112421.42 141951.6 179342.4
Ratio 0.089 0.075 0.073 0.074 0.081
2005-06 2006-07 2007-08 2008-09 2009-100
0.2
0.4
0.6
0.8
1
1.2
1.4
1.6
1.8
2
1.502
1.806 1.791.887
1.13
Debt Equity Ratio
Turnover on total assets has been consistent on an average. There is not much variation in the ratio. This is because the bank has been unbeaten in growing its sales with the level of assets being utilized maintaining the ratio.
Fixed Assets Turnover Ratio
Formula 2005-06 2006-07 2007-08 2008-09 2009-10
Total Sales Fixed Assets
7563.03 7176.75 8218.91 10476.50 14522.79
798.78 814.34 810.07 789.55 2433.32
Ratio 9.468 8.813 10.146 13.269 5.968
The turnover on fixed assets has shown some variations on account of huge variations in the fixed assets held by the bank from time to time. The major role in this variation has been played by premises which have grown 4 times within 2 years between FY06 and FY08 bringing down the ratio for the final year.
2005-06 2006-07 2007-08 2008-09 2009-10
0.0890000000000001
0.075 0.073 0.0740.081
Total assets Turn over Ratio
2005-06 2006-07 2007-08 2008-09 2009-10
9.4688.813
10.146
13.269
5.968
Fixed Assets turnover Ratio

Profitability Ratio:
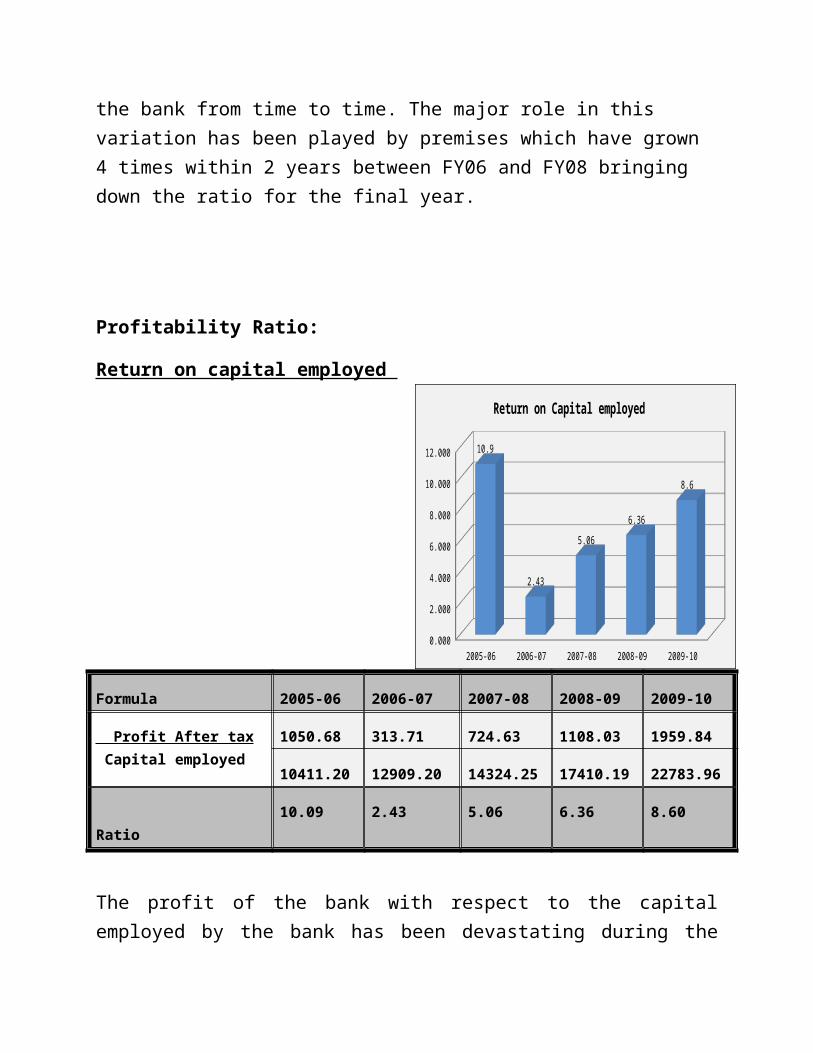
Return on capital employed
Formula 2005-06 2006-07 2007-08 2008-09 2009-10
Profit After tax Capital employed
1050.68 313.71 724.63 1108.03 1959.84
10411.20 12909.20 14324.25 17410.19 22783.96
Ratio 10.09 2.43 5.06 6.36 8.60
The profit of the bank with respect to the capital employed by the bank has been devastating during the period. The respective ratio bad curtailed down to one-fifth of the initial return in the second year due to excessive fall in PAT . The bank gradually improved the return but without any remarkable growth.
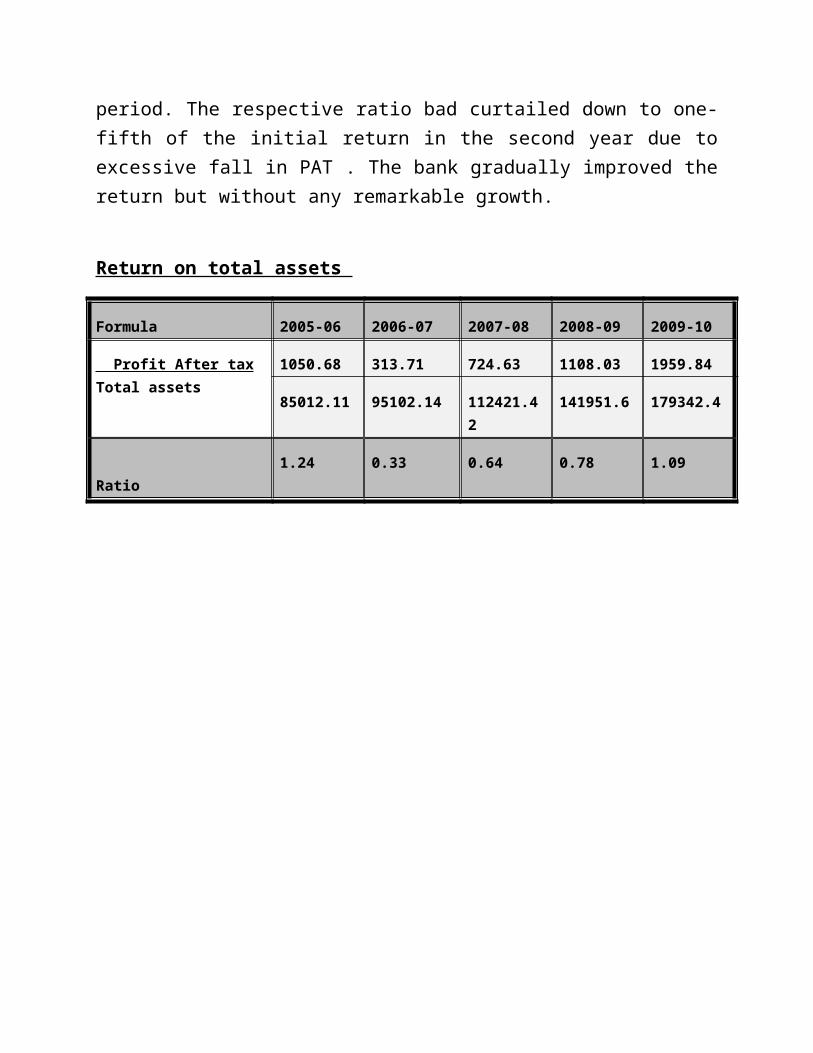
Return on total assets
Formula 2005-06 2006-07 2007-08 2008-09 2009-10
Profit After taxTotal assets
1050.68 313.71 724.63 1108.03 1959.84
85012.11 95102.14 112421.42 141951.6 179342.4
Ratio 1.24 0.33 0.64 0.78 1.09
2005-06 2006-07 2007-08 2008-09 2009-100.000
2.000
4.000
6.000
8.000
10.000
12.000 10.9
2.43
5.06
6.36
8.6
Return on Capital employed
2005-06 2006-07 2007-08 2008-09 2009-100.000
0.200
0.400
0.600
0.800
1.000
1.200
1.4001.24
0.330000000000001
0.640000000000002
0.78
1.09
Return on Total Assets
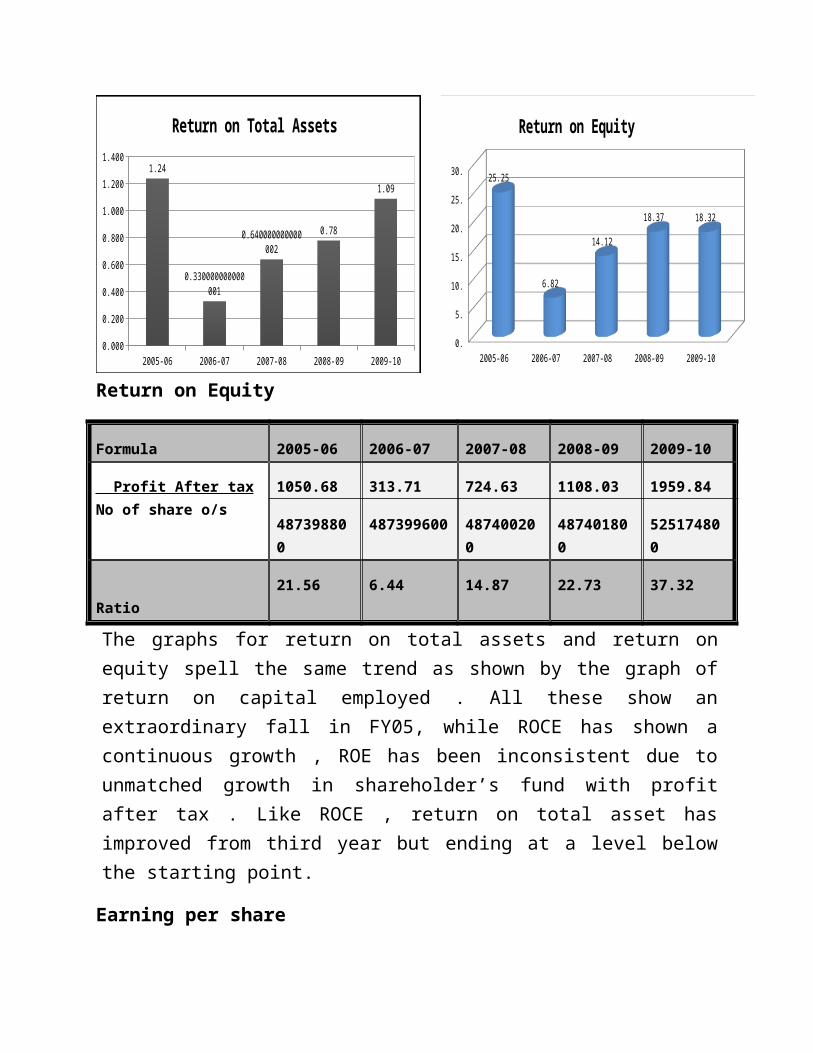
Return on Equity
Formula 2005-06 2006-07 2007-08 2008-09 2009-10
Profit After taxNo of share o/s
1050.68 313.71 724.63 1108.03 1959.84
487398800 487399600 487400200 487401800 525174800
Ratio 21.56 6.44 14.87 22.73 37.32
The graphs for return on total assets and return on equity spell the same trend as shown by the graph of return on capital employed . All these show an extraordinary fall in FY05, while ROCE has shown a continuous growth , ROE has been inconsistent due to unmatched growth in shareholder’s fund with profit after tax . Like ROCE , return on total asset has improved from third year but ending at a level below the starting point.
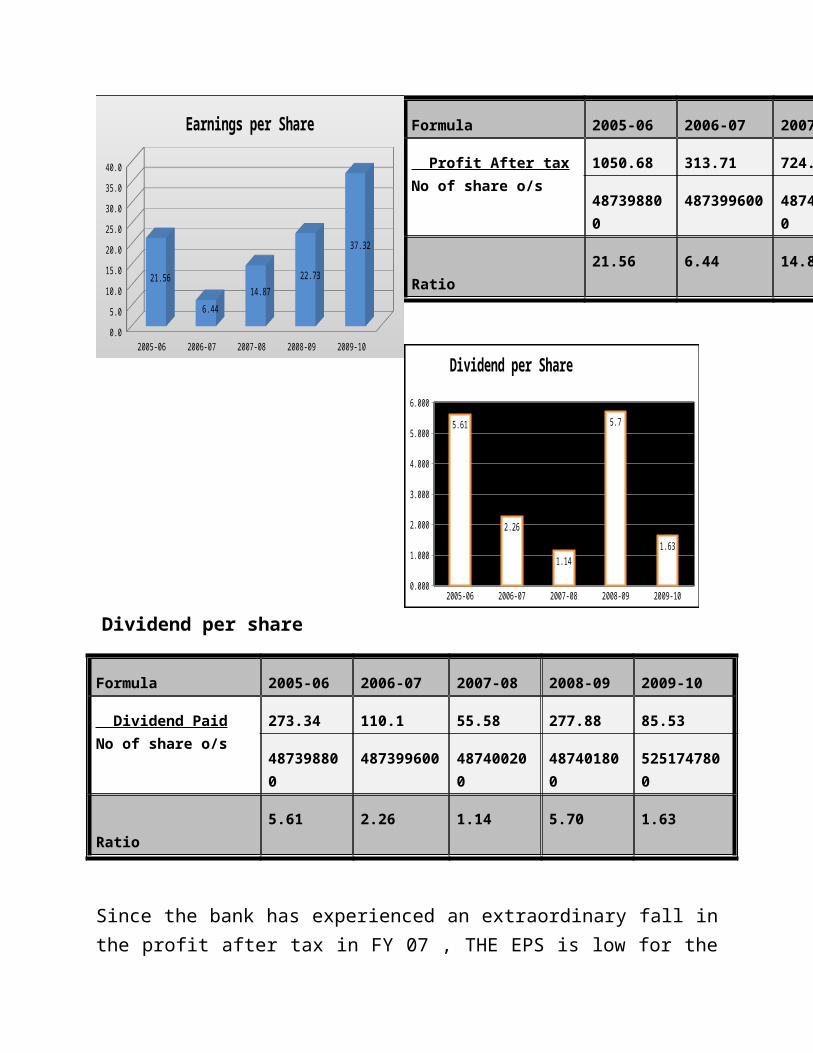
Earning per share
Formula 2005-06 2006-07 2007-08 2008-09 2009-10
Profit After taxNo of share o/s
1050.68 313.71 724.63 1108.03 1959.84
487398800 487399600 487400200 487401800 525174800
Ratio 21.56 6.44 14.87 22.73 37.32
2005-06 2006-07 2007-08 2008-09 2009-100.
5.
10.
15.
20.
25.
30.25.25
6.82
14.12
18.37 18.32
Return on Equity
2005-06 2006-07 2007-08 2008-09 2009-100.000
1.000
2.000
3.000
4.000
5.000
6.000
5.61
2.26
1.14
5.7
1.63
Dividend per Share
Dividend per share
Formula 2005-06 2006-07 2007-08 2008-09 2009-10
Dividend PaidNo of share o/s
273.34 110.1 55.58 277.88 85.53
487398800 487399600 487400200 487401800 5251747800
Ratio 5.61 2.26 1.14 5.70 1.63
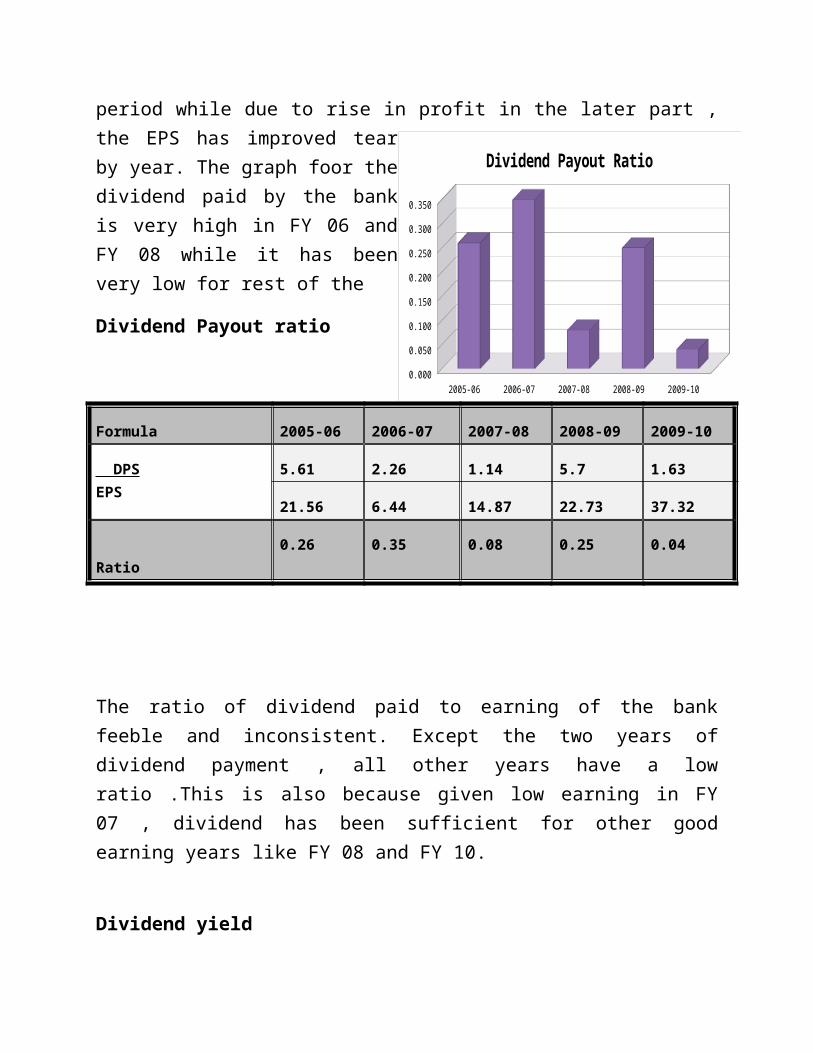
Since the bank has experienced an extraordinary fall in the profit after tax in FY 07 , THE EPS is low for the period while due to rise in profit in the later part , the EPS has improved tear by year. The graph foor the dividend paid by the bank is very high in FY 06 and FY 08 while it has been very low for rest of the
Dividend Payout ratio
Formula 2005-06 2006-07 2007-08 2008-09 2009-10
DPSEPS
5.61 2.26 1.14 5.7 1.63
21.56 6.44 14.87 22.73 37.32
Ratio 0.26 0.35 0.08 0.25 0.04
2005-06 2006-07 2007-08 2008-09 2009-100.0
5.0
10.0
15.0
20.0
25.0
30.0
35.0
40.0
21.56
6.44
14.87
22.73
37.32
Earnings per Share

The ratio of dividend paid to earning of the bank feeble and inconsistent. Except the two years of dividend payment , all other years have a low ratio .This is also because given low earning in FY 07 , dividend has been sufficient for other good earning years like FY 08 and FY 10.
Dividend yield
Formula 2005-06 2006-07 2007-08 2008-09 2009-10
Dividend per share Market price of share
5.61 2.26 1.14 5.7 1.63
58.90 103.50 132.00 167.80 252.90
Ratio 9.52 2.18 0.86 3.40 0.64
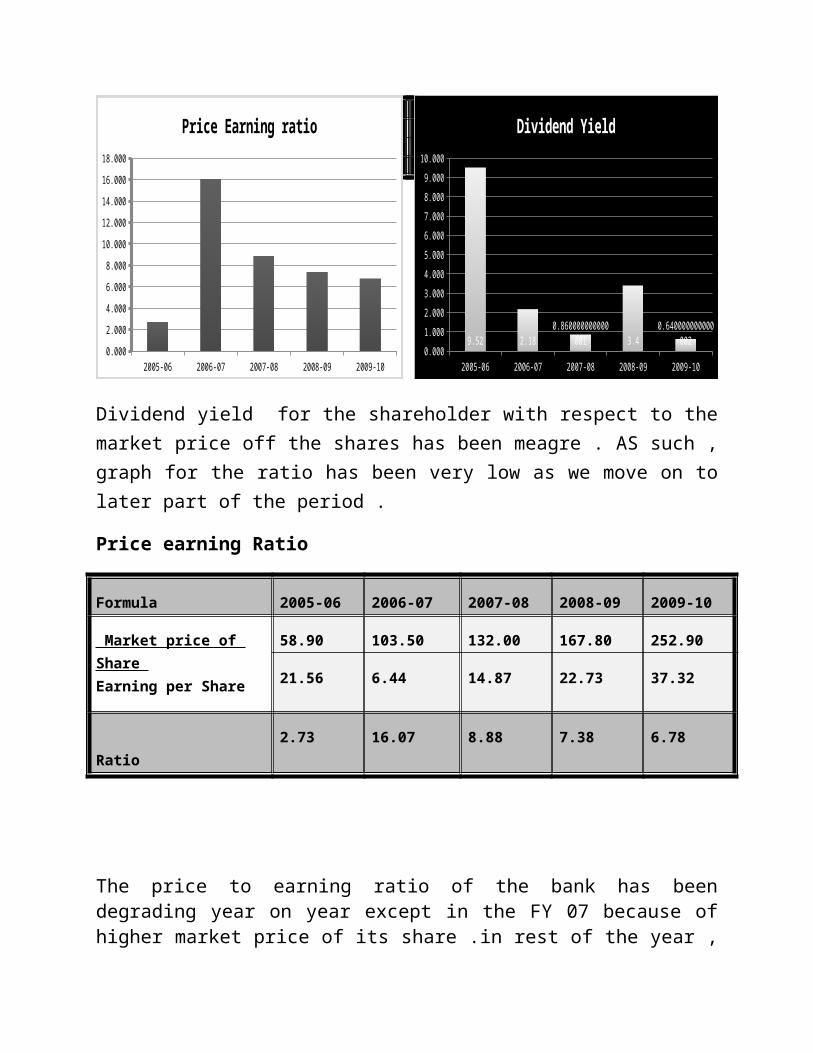
Dividend yield for the shareholder with respect to the market price off the shares has been meagre . AS such , graph for the ratio has been very low as we move on to later part of the period .
Price earning Ratio
Formula 2005-06 2006-07 2007-08 2008-09 2009-10
Market price of Share Earning per Share
58.90 103.50 132.00 167.80 252.90
21.56 6.44 14.87 22.73 37.32
Ratio 2.73 16.07 8.88 7.38 6.78
2005-06 2006-07 2007-08 2008-09 2009-100.000
0.050
0.100
0.150
0.200
0.250
0.300
0.350
Dividend Payout Ratio
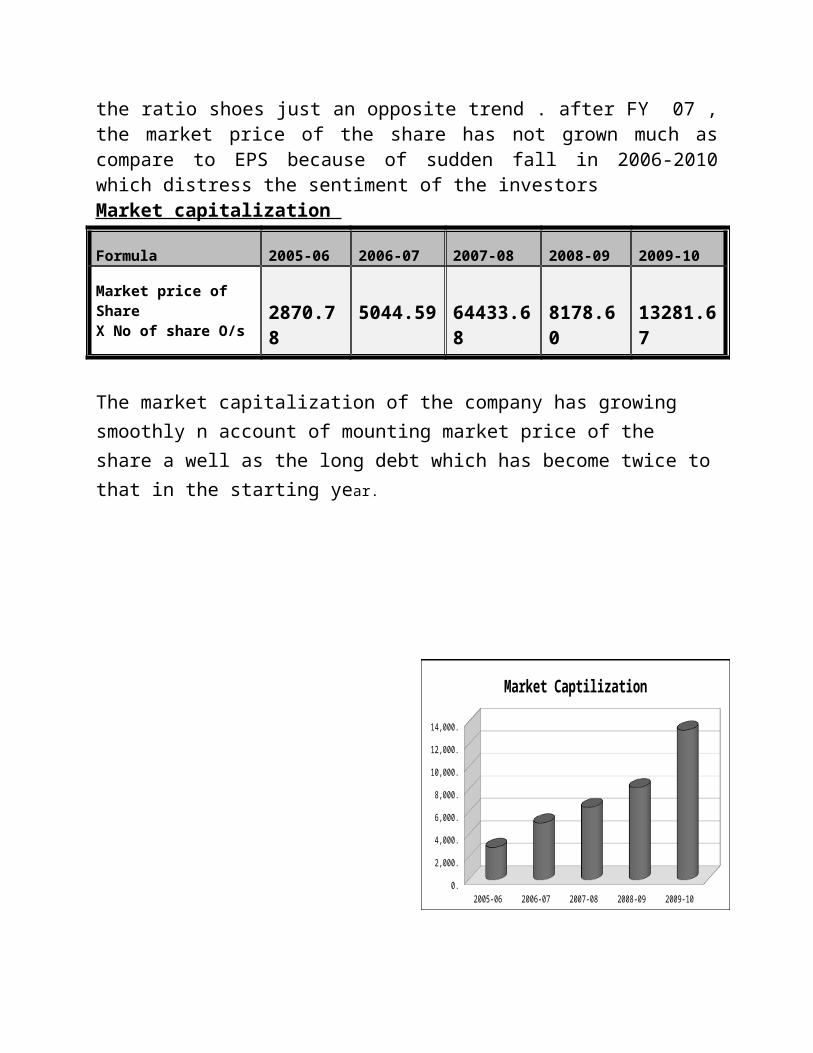
The price to earning ratio of the bank has been degrading year on year except in the FY 07 because of higher market price of its share .in rest of the year , the ratio shoes just an opposite trend . after FY 07 , the market price of the share has not grown much as compare to EPS because of sudden fall in 2006-2010 which distress the sentiment of the investorsMarket capitalization
Formula 2005-06 2006-07 2007-08 2008-09 2009-10
Market price of Share X No of share O/s 2870.78 5044.59 64433.68 8178.60 13281.67
The market capitalization of the company has growing smoothly n account of mounting market price of the share a well as the long debt which has become twice to that in the starting year.
2005-06 2006-07 2007-08 2008-09 2009-100.000
1.000
2.000
3.000
4.000
5.000
6.000
7.000
8.000
9.000
10.000
9.52 2.180.86000000000000
1 3.40.64000000000000
2
Dividend Yield
2005-06 2006-07 2007-08 2008-09 2009-100.000
2.000
4.000
6.000
8.000
10.000
12.000
14.000
16.000
18.000
Price Earning ratio
2005-06 2006-07 2007-08 2008-09 2009-100.
2,000.
4,000.
6,000.
8,000.
10,000.
12,000.
14,000.
Market Captilization
Trend Analysis Figure in crore
Summarized consolidated Balance Sheet
Capital and Liabilities 2005-06 2006-07 2007-08 2008-09 2009-10
Capital 488.14 488.14 488.14 488.14 488.14
Growth (%) 100.00 100.00 100.00 100.00 100.00
Reserve and Surplus 3671.65 4110.44 4642.49 5538.61 10145.12
Growth (%) 100.00 111.95 126.44 150.85 276.31
Deposits 71479.75 78181.88 93927.71 119876.82 150405.32
Growth (%) 100 .00 110.27 131.40 167.71 210.42
Borrowings 4041.47 5961.95 5893.91 6620.83 7172.45
Growth (%) 100.00 147.52 145.84 163.82 177.47
Assets 2005-06 2006-07 2007-08 2008-09 2009-10
Cash n Balance with RBI 4230.94 3904.72 5588.42 7196.89 11775.69
Growth (%) 100.00 92.29 132.08 170.10 278.32
Investment 27311.61 28324.30 31925.38 35620.35 41925.58
Growth (%) 100.00 103.71 116.89 130.42 153.50
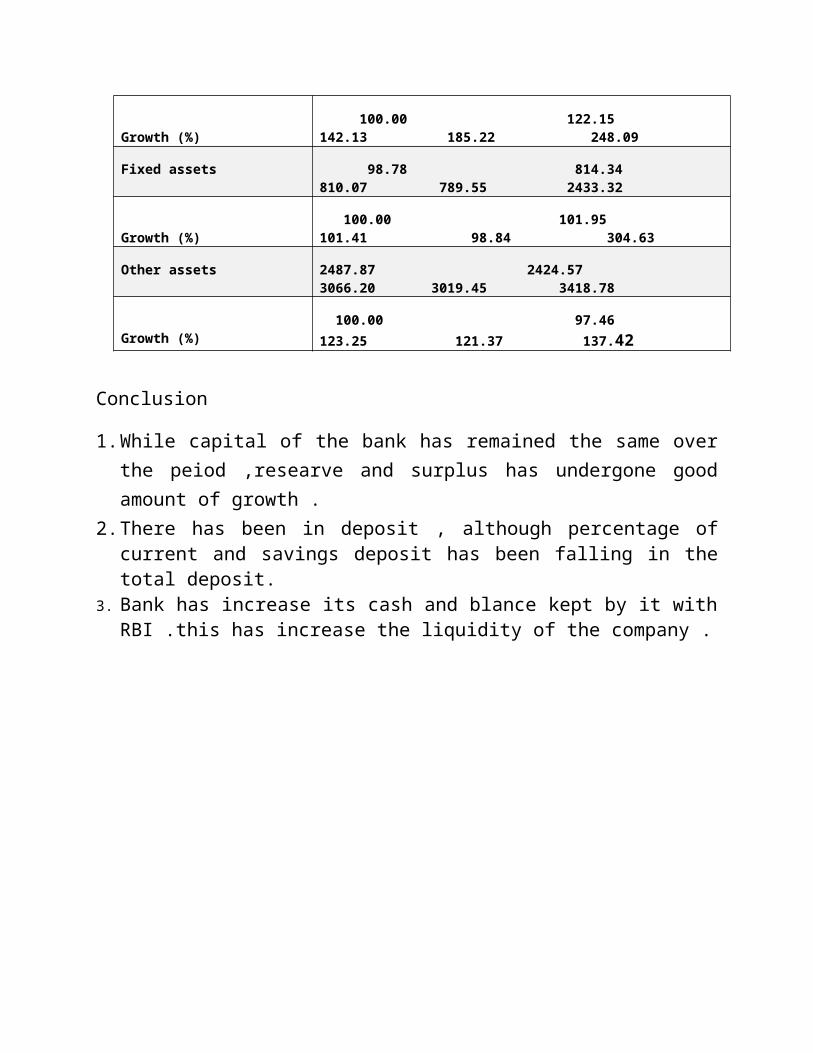
Advance 45855.90 56012.58 65173.74 84935.89 113764.69
Growth (%) 100.00 122.15 142.13 185.22 248.09
Fixed assets 98.78 814.34 810.07 789.55 2433.32
Growth (%) 100.00 101.95 101.41 98.84 304.63
Other assets 2487.87 2424.57 3066.20 3019.45 3418.78
Growth (%) 100.00 97.46 123.25 121.37 137.42
Conclusion
1. While capital of the bank has remained the same over the peiod ,researve and surplus has undergone good amount of growth .
2. There has been in deposit , although percentage of current and savings deposit has been falling in the total deposit.
3. Bank has increase its cash and blance kept by it with RBI .this has increase the liquidity of the company .
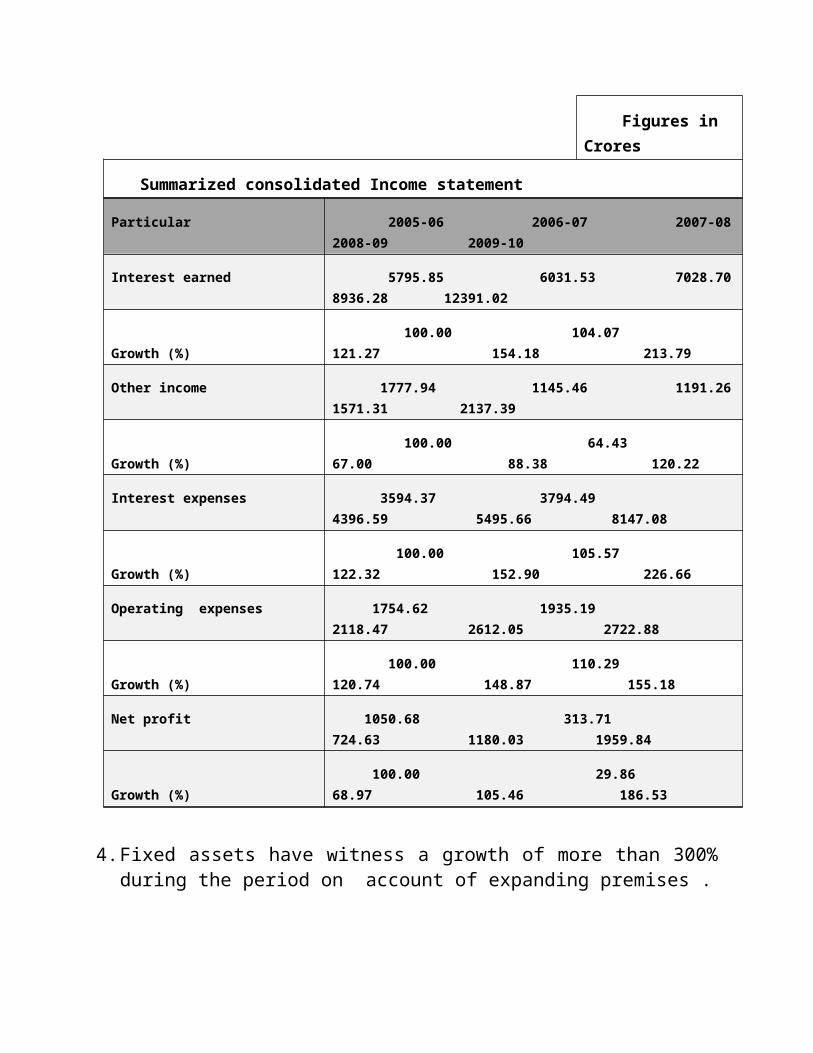
Figures in Crores
Summarized consolidated Income statement
Particular 2005-06 2006-07 2007-08 2008-09 2009-10
Interest earned 5795.85 6031.53 7028.70 8936.28 12391.02
Growth (%) 100.00 104.07 121.27 154.18 213.79
Other income 1777.94 1145.46 1191.26 1571.31 2137.39
Growth (%) 100.00 64.43 67.00 88.38 120.22
Interest expenses 3594.37 3794.49 4396.59 5495.66 8147.08
Growth (%) 100.00 105.57 122.32 152.90 226.66
Operating expenses 1754.62 1935.19 2118.47 2612.05 2722.88
Growth (%) 100.00 110.29 120.74 148.87 155.18
Net profit 1050.68 313.71 724.63 1180.03 1959.84
Growth (%) 100.00 29.86 68.97 105.46 186.53
4. Fixed assets have witness a growth of more than 300% during the period on account of expanding premises .
5. Interest income of the bank has improved over years ; especially in the last year while other income have been without any such growth .
6. Operating expenses of the bank has increased to some exent due to rise in payment and provision to employees .
7. Althouugh market capitalization and enterprises value of the company have grown , the PE ratio is quite low
8. The dividend payment policy of the bank reveals the conservative nature of the bank .the bank is looking towards creating immense researve for future operation .
Introduction Axis Bank was the first of the new private banks to have begun operations in 1994, after the Government of India allowed new private banks to be established. The Bank was promoted jointly by the Administrator of the specified undertaking of the Unit Trust of India (UTI - I), Life Insurance Corporation of India (LIC) and General Insurance Corporation of India (GIC) and other four PSU insurance companies, i.e. National Insurance Company Ltd., The New India Assurance Company Ltd., The Oriental Insurance Company Ltd. and United India Insurance Company Ltd.
The Bank today is capitalized to the extent of Rs. 407.44 crores with the public holding (other than promoters and GDRs) at 54.51%.
The Bank's Registered Office is at Ahmedabad and its Central Office is located at Mumbai. The Bank has a very wide network of more than 1042 branches (including 56 Service Branches/CPCs as on 30th June 2010). The Bank has a network of over 4474 ATMs (as on 30th June 2010) providing 24 hrs a day banking convenience to its customers. This is one of the largest ATM networks in the country.
The Bank has strengths in both retail and corporate banking and is committed to adopting the best industry practices internationally in order to achieve excellence.
Business overviewIn a difficult year for the financial sector, the Bank has delivered a very strong performance with a net profit of Rs. 2,514.53 crores(38.51% higher than the net profit of Rs. 1,815.36 crores last year), Basic Earnings per Share (EPS) of Rs. 65.78 (29.97% higher than theEPS of Rs. 50.61 in 2008-09) and a Return on Equity (ROE) of 19.89% compared to 19.93% last year.In 2009-10, the total income was Rs. 15,583.80 crores, increasing byRs. 1,851.44 crores or 13.48% over last year. During the period the
operating revenue rose 35.96% to Rs. 8,950.27 crores, whileoperating profit increased by 40.69% to Rs. 5,240.55 crores, due to arobust growth of core income streams. The Net Interest Income (NII)grew by Rs. 1,318.28 crores to Rs. 5,004.49 crores, rising 35.76%, duein large measure, to lower cost of deposits supported by the solid andsustained growth of the low-cost current account and savings bank(CASA) deposits as well as a sharp fall in the cost of term deposits.NII also grew on the back of strong asset growth across businesssegments and on a daily average basis, the total earning assets ofthe Bank increased by 20.46% to Rs. 133,308.75 crores fromRs. 110,663.96 crores last year.
Product and servicesAxis Bank offers a range of financial products and services to its clients throughout the country. It also has special strength in retail and corporate banking. Axis Bank offers following services:
Personal Banking Corporate Banking NRI Priority Banking
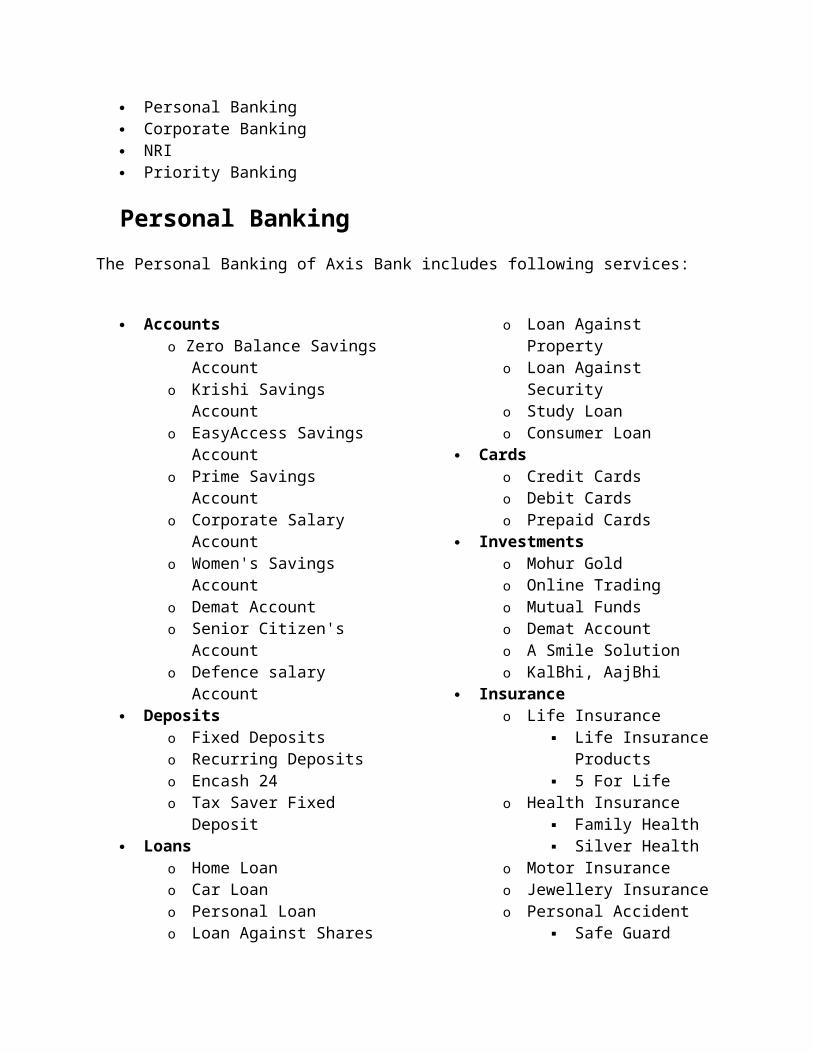
Personal Banking
The Personal Banking of Axis Bank includes following services:
Accountso Zero Balance Savings
Account o Krishi Savings Account o EasyAccess Savings Account o Prime Savings Account o Corporate Salary Account o Women's Savings Account o Demat Account o Senior Citizen's Account o Defence salary Account
Depositso Fixed Deposits o Recurring Deposits o Encash 24 o Tax Saver Fixed Deposit
Loanso Home Loan o Car Loan o Personal Loan o Loan Against Shares o Loan Against Property o Loan Against Security o Study Loan o Consumer Loan
Cardso Credit Cards o Debit Cards o Prepaid Cards
Investmentso Mohur Gold
o Online Trading o Mutual Funds o Demat Account o A Smile Solution o KalBhi, AajBhi
Insuranceo Life Insurance
Life Insurance Products
5 For Lifeo Health Insurance
Family Health Silver Health
o Motor Insurance o Jewellery Insurance o Personal Accident
Safe Guardo Home
Safe Home Safe Home Plus
o Travel Companion o Critical Illness o Business advantage
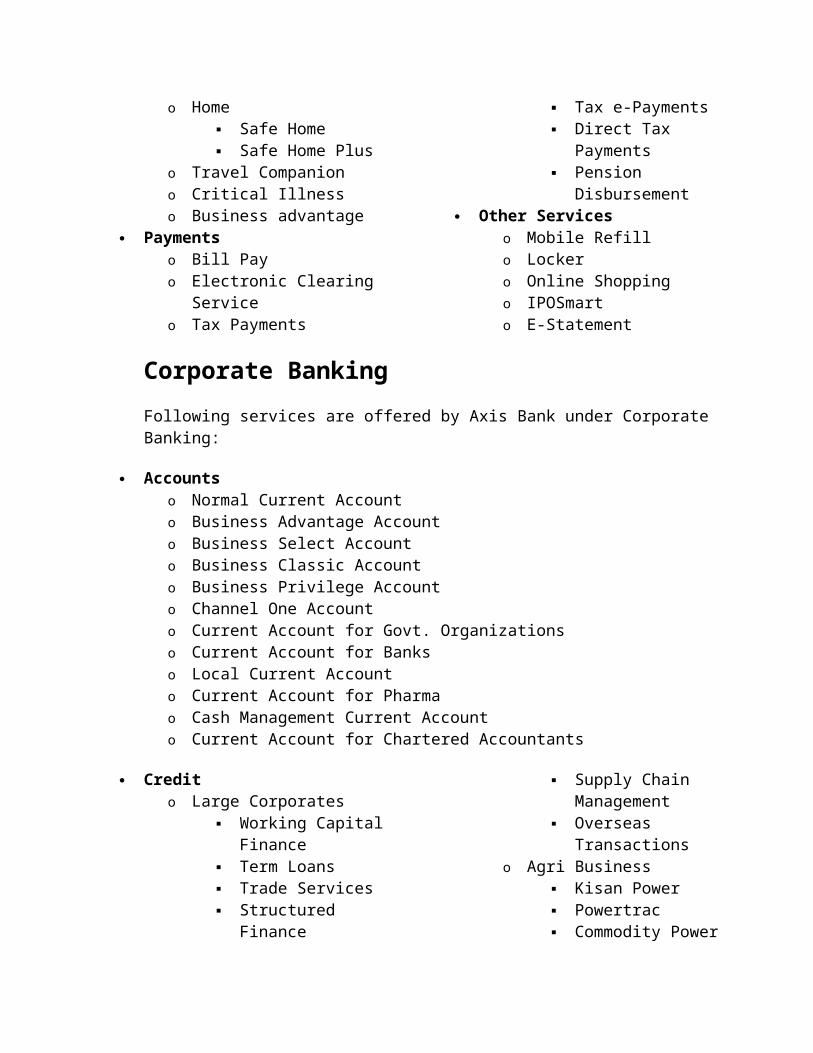
Paymentso Bill Pay o Electronic Clearing Service o Tax Payments
Tax e-Payments Direct Tax Payments Pension Disbursement
Other Services
o Mobile Refill o Locker o Online Shopping
o IPOSmarto E-Statement
Corporate Banking
Following services are offered by Axis Bank under Corporate Banking:
Accountso Normal Current Account o Business Advantage Account o Business Select Account o Business Classic Account o Business Privilege Account o Channel One Account o Current Account for Govt. Organizations o Current Account for Banks o Local Current Account o Current Account for Pharmao Cash Management Current Account o Current Account for Chartered Accountants
Credito Large Corporates
Working Capital Finance
Term Loans Trade Services Structured Finance Supply Chain
Management Overseas
Transactionso Agri Business
Kisan Power Powertrac Commodity Power Contract Farming Arthia Power
o SME Standard o SME Fast Track o Microfinance
Capital Marketo Debt Solutions o Equity Solutions
o Private Equity, Mergers & Acquisitions
o Advisory Services o Trusteeship Services o Custodial Services o e-Broking
Treasuryo Forexo International Business o Money Market o Constituent SGL Facilities o Retailing of Government
Securities Cash Management Services
o Payment Solutions o Collection Solutions
Govt. Businesso Authorisationo Direct Tax Payment o Indirect Tax Payment o State Tax Payment o Pension Disbursement o Other Services
o e-Payments o e-Governance Tie-ups
o Online Tax Payment o New Pension System (NPS)
NRI
Axis Bank offers following services for the NRIs:
Accountso NRE Savings Account o NRO Savings Account o NRI Prime Account o NRI Priority o PIS Account o NRE Salary Account o RFC Account
Depositso NRE Rupee Deposit o NRO Rupee Deposit
o FCNR Deposit o RFC Term Deposit
Remittanceso AxisRemito SWIFT o Partner Banks o Exchange House Tie-ups o NRI Connect
Serviceso PAN Assistance o Locker
o NRI Local Post Box
Subsidiary Companies• Axis Securities and Sales Limited (formerly Axis Sales Limited)• Axis Private Equity Limited• Axis Trustee Services Limited• Axis Asset Management Company Limited• Axis Mutual Fund Trustee Limited
Joint Venture• Bussan Auto Finance India Private Limited
Share holding pattern
Sr. No.
Name of Shareholders % of Paid Up Capital
i. Administrator of the Specified Undertaking of the Unit Trust of India (UTI-I)
24.00
ii. Life Insurance Corporation of India 10.27
iii. General Insurance Corporation and four PSU Insurance Companies
4.27
iv. Overseas Investors including FIIs/ OCBs/ NRIs 33.68 v. Foreign Direct Investment (GDR issue) 8.37 vi. Other Indian Financial Institutions/ Mutual Funds/ Banks 7.07

vii. Others 12.34 Total 100.00
Network
Network of branches and extension counters increased from 835 to 1035Total number of ATMs went up from 3,595 to 4293
Financial overview
Ratio Analysis
Liquidity Ratio:
Absolute liquidity Ratio
Formula 2005-06 2006-07 2007-08 2008-09 2009-10
Cash and near cash Current liabilities
5663.21 4502.94 3641.85 6418.31 12505.52
21845.76 32752.08 42375.96 61161.54 91758.99
Ratio 0.259 0.137 0.086 0.105 0.136
From the graph, the liquidity of the bank does not seem to be very impressive. Initially , it has been decreasing year on year because of fall in cash and balance of
2005-06 2006-07 2007-08 2008-09 2009-100.000
0.050
0.100
0.150
0.200
0.250
0.300
Absolute liquidity Ratio
Absolute liquidity Ratio

the company with RBI while current liabilities on the other hand has been increasing continuously on account of deposit and others. Later, there has been tremendous increment in cash and balance with RBI and other banks along with the call short money which has doubled the current assets of the company.Solvency ratio:
Debt equity ratio
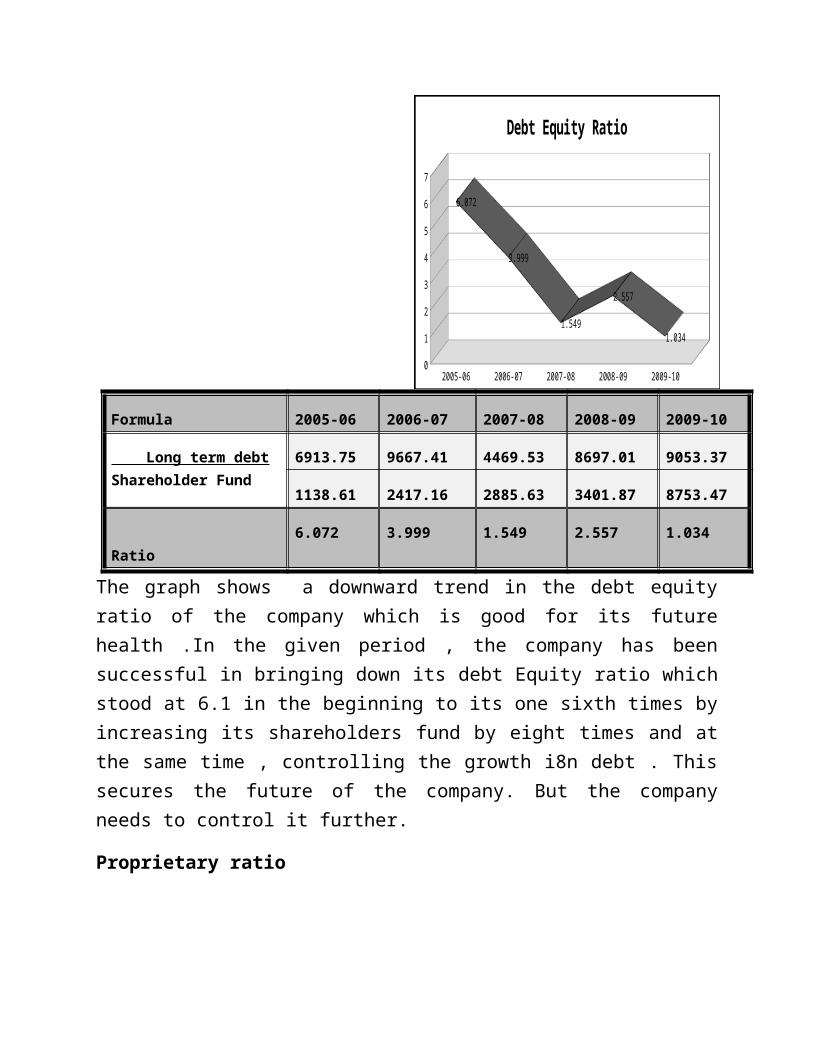
Formula 2005-06 2006-07 2007-08 2008-09 2009-10
Long term debtShareholder Fund
6913.75 9667.41 4469.53 8697.01 9053.37
1138.61 2417.16 2885.63 3401.87 8753.47
Ratio 6.072 3.999 1.549 2.557 1.034
The graph shows a downward trend in the debt equity ratio of the company which is good for its future health .In the given period , the company has been successful in bringing down its debt Equity ratio which stood at 6.1 in the beginning to its one sixth times by increasing its shareholders fund by eight times and at the same time , controlling the growth i8n debt . This secures the future of the company. But the company needs to control it further.
Proprietary ratio
Formula 2005-06 2006-07 2007-08 2008-09 2009-10
Shareholder Fund Total Assets
1138.61 2417.16 2885.63 3401.87 8753.47
24150.17 37743.69 49731.12 73255.98 109566.38
2005-06 2006-07 2007-08 2008-09 2009-100
1
2
3
4
5
6
7
6.072
3.999
1.549
2.557
1.034
Debt Equity Ratio
Ratio 0.047 0.064 0.058 0.046 0.080
The proprietary ratio of the company reveal that as the shareholders fund has increased ,the assets held by the company has grown in the same direction ,although the rate of growth in fund has been severe than that in assets .While assets have grown only to 4 times of the beginning year, fund has grown at the rate of 8 times.
Turnover Ratio:
Total assets turnover ratio
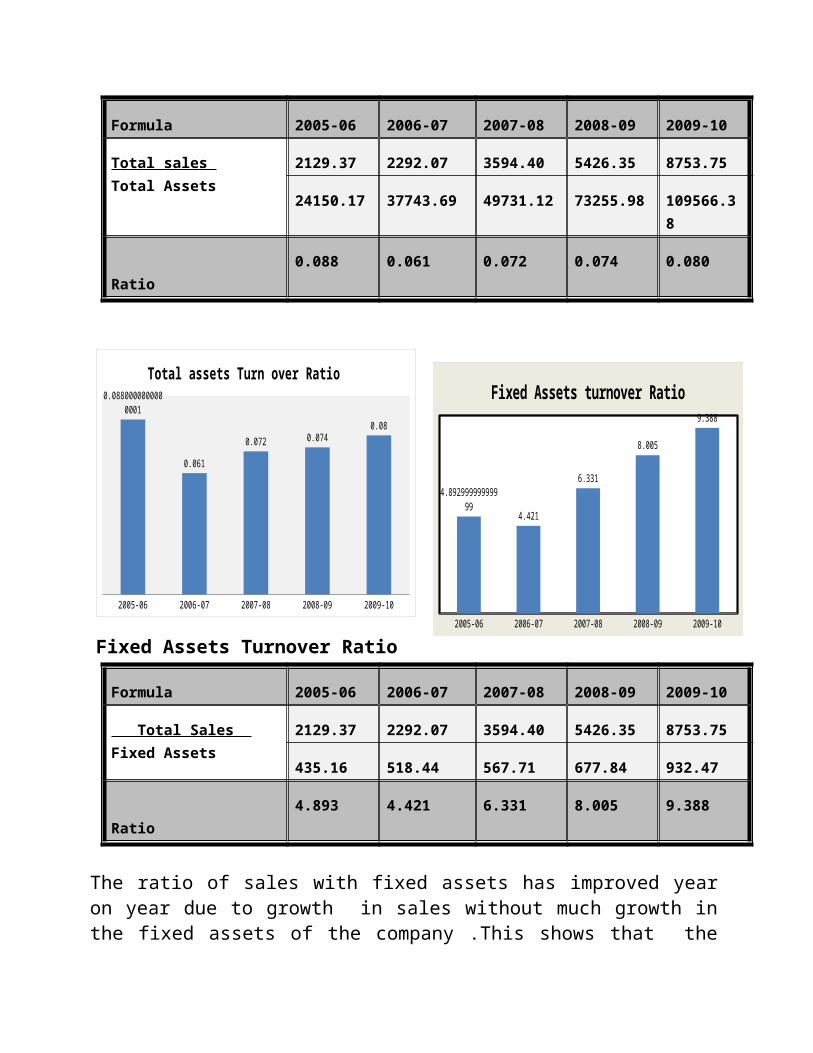
Formula 2005-06 2006-07 2007-08 2008-09 2009-10
Total sales Total Assets
2129.37 2292.07 3594.40 5426.35 8753.75
24150.17 37743.69 49731.12 73255.98 109566.38
Ratio 0.088 0.061 0.072 0.074 0.080
2005-06 2006-07 2007-08 2008-09 2009-100.000
0.010
0.020
0.030
0.040
0.050
0.060
0.070
0.080
0.090
0.047
0.0640000000000001
0.058
0.046
0.08
Proprietory Ratio
2005-06 2006-07 2007-08 2008-09 2009-10
0.0880000000000001
0.061
0.072 0.0740.08
Total assets Turn over Ratio
Fixed Assets Turnover Ratio
Formula 2005-06 2006-07 2007-08 2008-09 2009-10
Total Sales Fixed Assets
2129.37 2292.07 3594.40 5426.35 8753.75
435.16 518.44 567.71 677.84 932.47
Ratio 4.893 4.421 6.331 8.005 9.388
The ratio of sales with fixed assets has improved year on year due to growth in sales without much growth in the fixed assets of the company .This shows that the company has used its fixed assets very efficiently during the period.The total assets turnover ratios of the five years reveal that although the ratio was poor in the year 2004-05 due to low sales, overall ratio has been the same throughout the period as both sales and assets have grown in the similar fashion.
2005-06 2006-07 2007-08 2008-09 2009-10
4.892999999999994.421
6.331
8.005
9.388
Fixed Assets turnover Ratio
Profitability Ratio:Return on capital employed
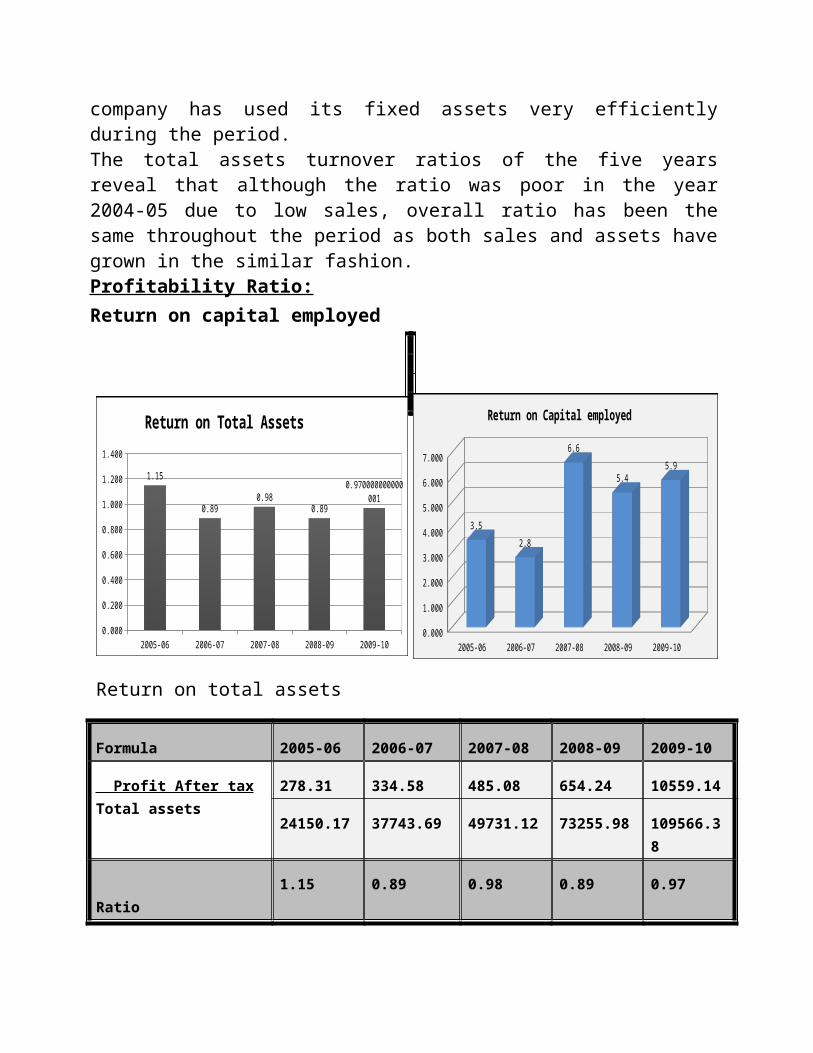
Formula 2005-06 2006-07 2007-08 2008-09 2009-10
Profit After tax Capital employed
278.31 334.58 485.08 654.24 1059.14
8052.36 12084.57 7355.16 12098.88 17806.84
Ratio 3.50 2.80 6.60 5.40 5.90
Return on total assets
The graph of ROCE shows that the company has gradually improved its return on the total capital employed by it proving that it has made efficient use of the funds available with it. The return has been very significant in the last three years although very low in the initial two years. This growth has been possible because on one hand capital employed has doubled; the profit of the company after tax has grown to almost 10 times as that in the first year under consideration.
The graph for return on total assets looks quite smooth as compared to that on capital employed and equity. Much variation cannot be seen in this case as both the profit after tax and assets of the company have grown exactly at the same pace during the period.
Return on Equity (ROE)
2005-06 2006-07 2007-08 2008-09 2009-100.000
0.200
0.400
0.600
0.800
1.000
1.200
1.400
1.15
0.890.98
0.89
0.970000000000001
Return on Total Assets
2005-06 2006-07 2007-08 2008-09 2009-100.000
1.000
2.000
3.000
4.000
5.000
6.000
7.000
3.5
2.8
6.6
5.45.9
Return on Capital employed

Formula 2005-06 2006-07 2007-08 2008-09 2009-10
Profit After taxShare holder Fund
278.31 334.58 485.08 654.24 1059.14
1138.61 2417.16 2885.63 3401.87 8753.47
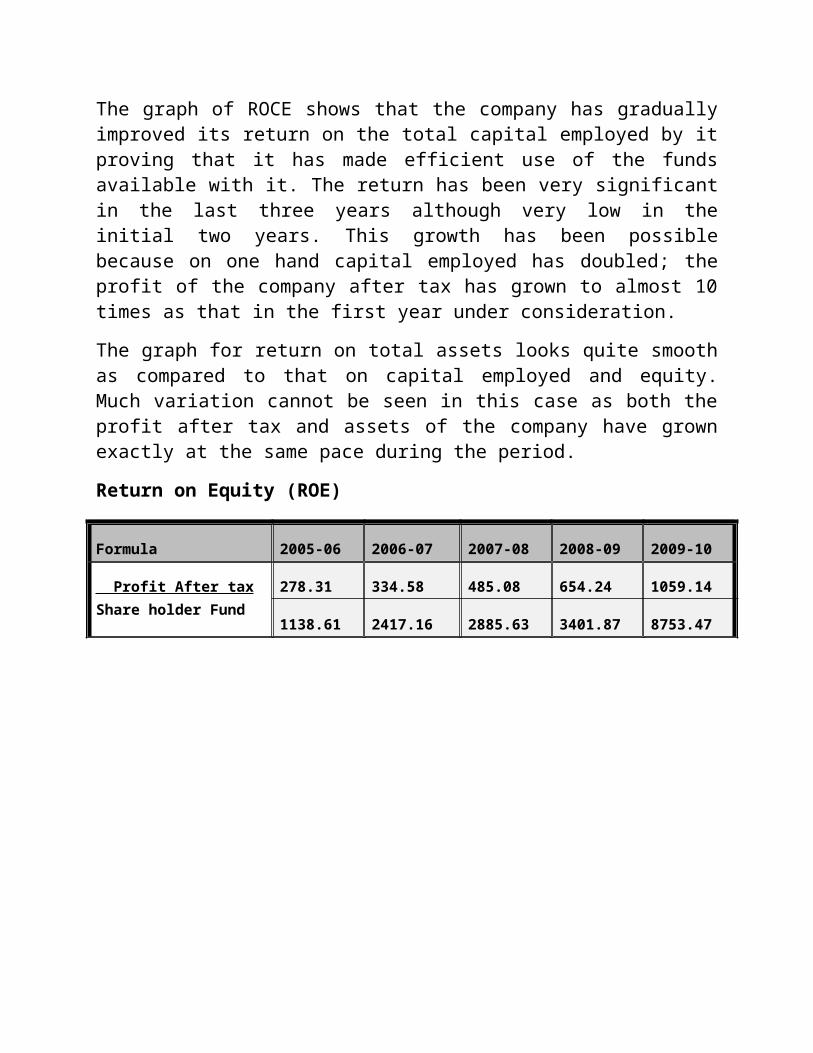
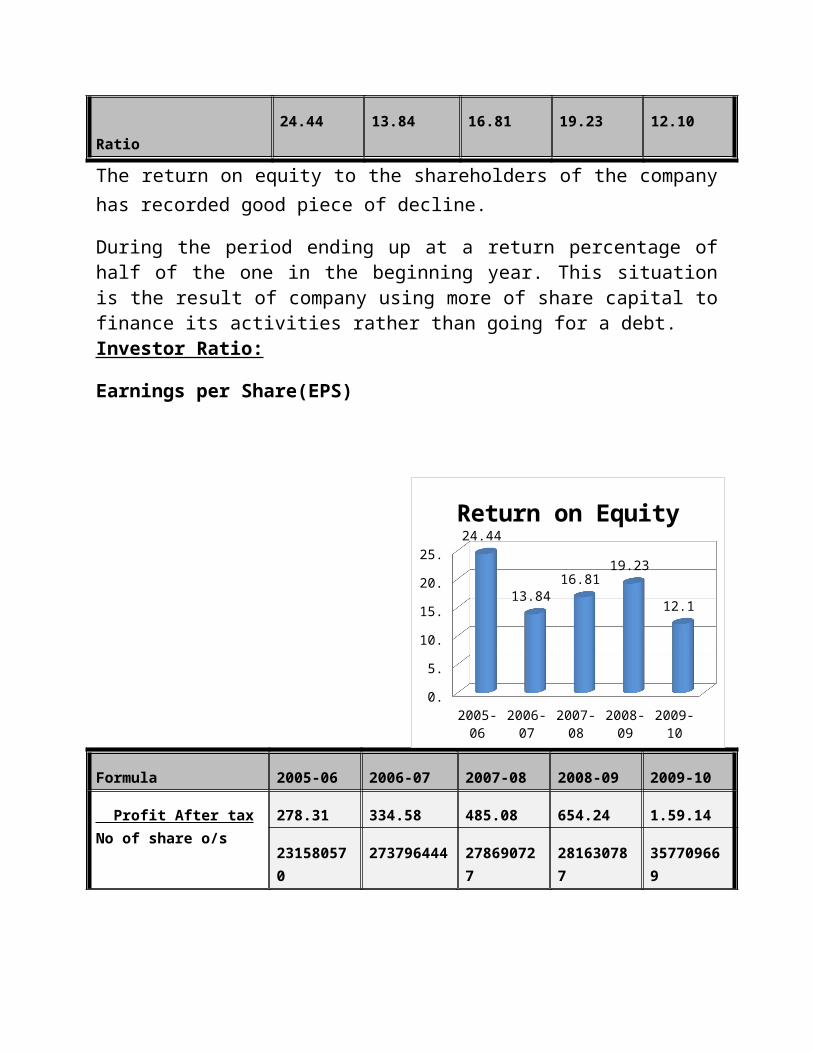
Ratio 24.44 13.84 16.81 19.23 12.10
The return on equity to the shareholders of the company has recorded good piece of decline.
During the period ending up at a return percentage of half of the one in the beginning year. This situation is the result of company using more of share capital to finance its activities rather than going for a debt.Investor Ratio:
Earnings per Share(EPS)
Formula 2005-06 2006-07 2007-08 2008-09 2009-10
Profit After taxNo of share o/s
278.31 334.58 485.08 654.24 1.59.14
231580570 273796444 278690727 281630787 357709669
Ratio 17.89 21.48 28.15 36.04 45.00
Dividend per share
2005-06 2006-07 2007-08 2008-09 2009-100.
5.
10.
15.
20.
25.24.44
13.84
16.81
19.23
12.1
Return on Equity
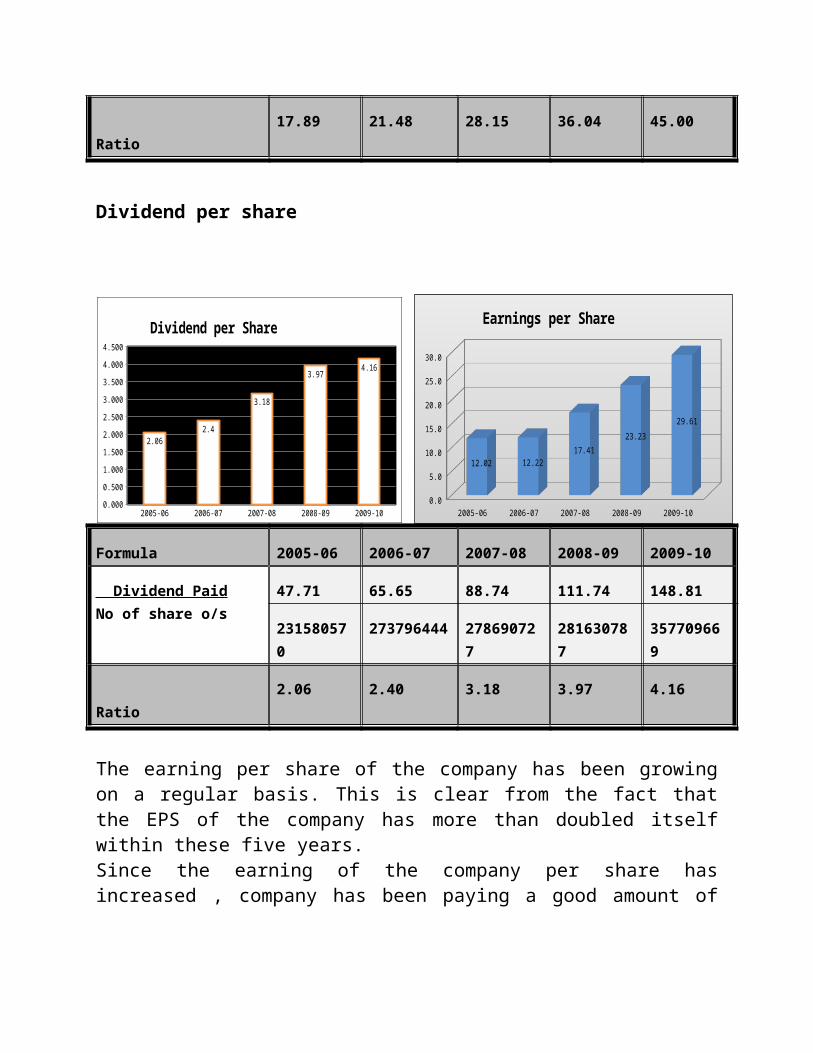
Formula 2005-06 2006-07 2007-08 2008-09 2009-10
Dividend PaidNo of share o/s
47.71 65.65 88.74 111.74 148.81
231580570 273796444 278690727 281630787 357709669
Ratio 2.06 2.40 3.18 3.97 4.16
The earning per share of the company has been growing on a regular basis. This is
clear from the fact that the EPS of the company has more than doubled itself within these five years.Since the earning of the company per share has increased , company has been paying a good amount of dividend to its shareholders . Similar to the EPS , The graph of DPS moves upwards smoothly.Dividend Payout ratio
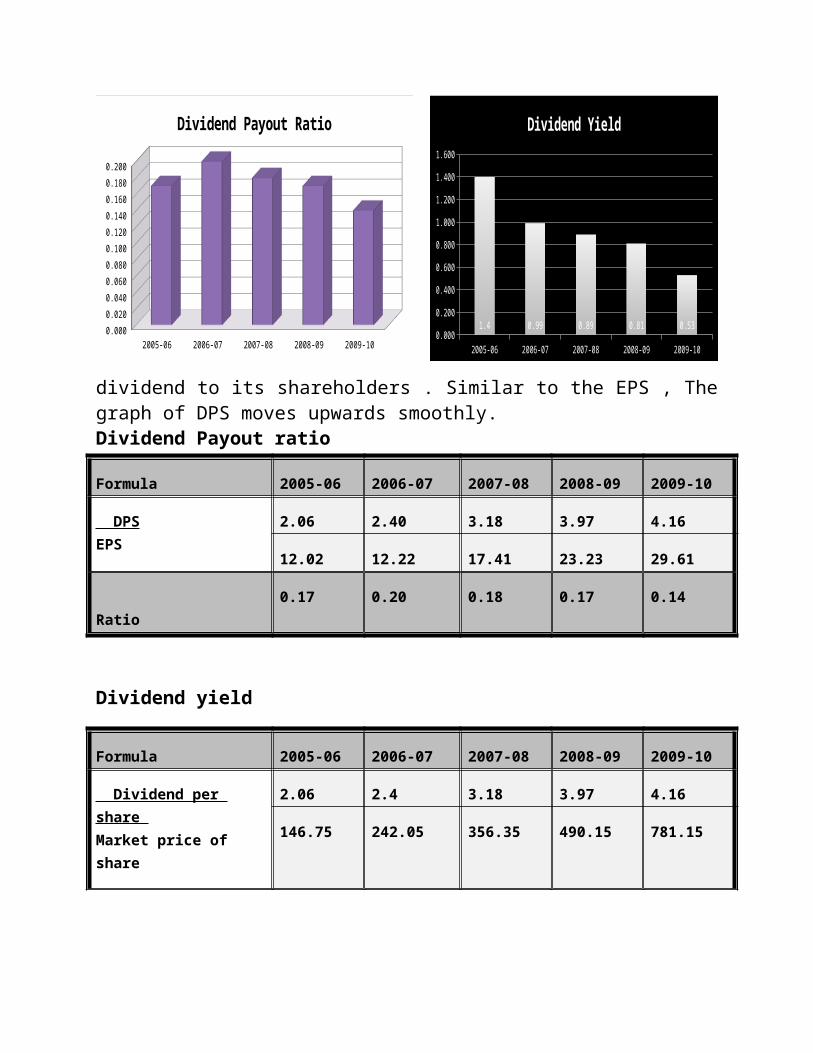
Formula 2005-06 2006-07 2007-08 2008-09 2009-10
DPSEPS
2.06 2.40 3.18 3.97 4.16
12.02 12.22 17.41 23.23 29.61
Ratio 0.17 0.20 0.18 0.17 0.14
2005-06 2006-07 2007-08 2008-09 2009-100.0
5.0
10.0
15.0
20.0
25.0
30.0
12.02 12.2217.41
23.23
29.61
Earnings per Share
2005-06 2006-07 2007-08 2008-09 2009-100.000
0.500
1.000
1.500
2.000
2.500
3.000
3.500
4.000
4.500
2.062.4
3.18
3.974.16
Dividend per Share
Dividend yield
Formula 2005-06 2006-07 2007-08 2008-09 2009-10
Dividend per share Market price of share
2.06 2.4 3.18 3.97 4.16
146.75 242.05 356.35 490.15 781.15
Ratio 1.40 0.99 0.89 0.81 0.53
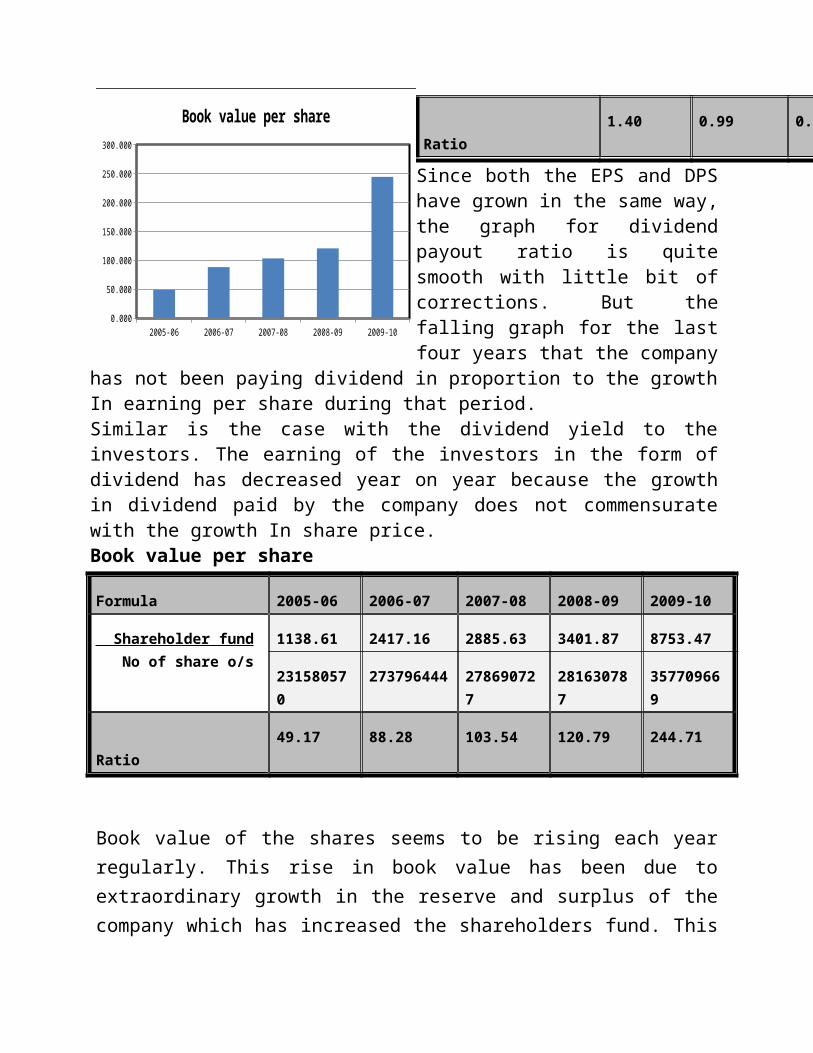
Since both the EPS and DPS have grown in the same way, the graph for dividend payout ratio is quite smooth with little bit of corrections. But the falling graph for the last four years that the company has not been paying dividend in proportion to the growth In earning per share during that period.Similar is the case with the dividend yield to the investors. The earning of the investors in the form of dividend has decreased year on year because the growth in dividend paid by the company does not commensurate with the growth In share price.Book value per share
Formula 2005-06 2006-07 2007-08 2008-09 2009-10
Shareholder fund No of share o/s
1138.61 2417.16 2885.63 3401.87 8753.47
231580570 273796444 278690727 281630787 357709669
Ratio 49.17 88.28 103.54 120.79 244.71
2005-06 2006-07 2007-08 2008-09 2009-100.000
0.020
0.040
0.060
0.080
0.100
0.120
0.140
0.160
0.180
0.200
Dividend Payout Ratio
2005-06 2006-07 2007-08 2008-09 2009-100.000
0.200
0.400
0.600
0.800
1.000
1.200
1.400
1.600
1.4 0.99 0.89 0.81 0.53
Dividend Yield

Book value of the shares seems to be rising each year regularly. This rise in book value has been due to extraordinary growth in the reserve and surplus of the company which has increased the shareholders fund. This growth hs been mainly in the last closing year when there in respect to the beginning year’s amount.
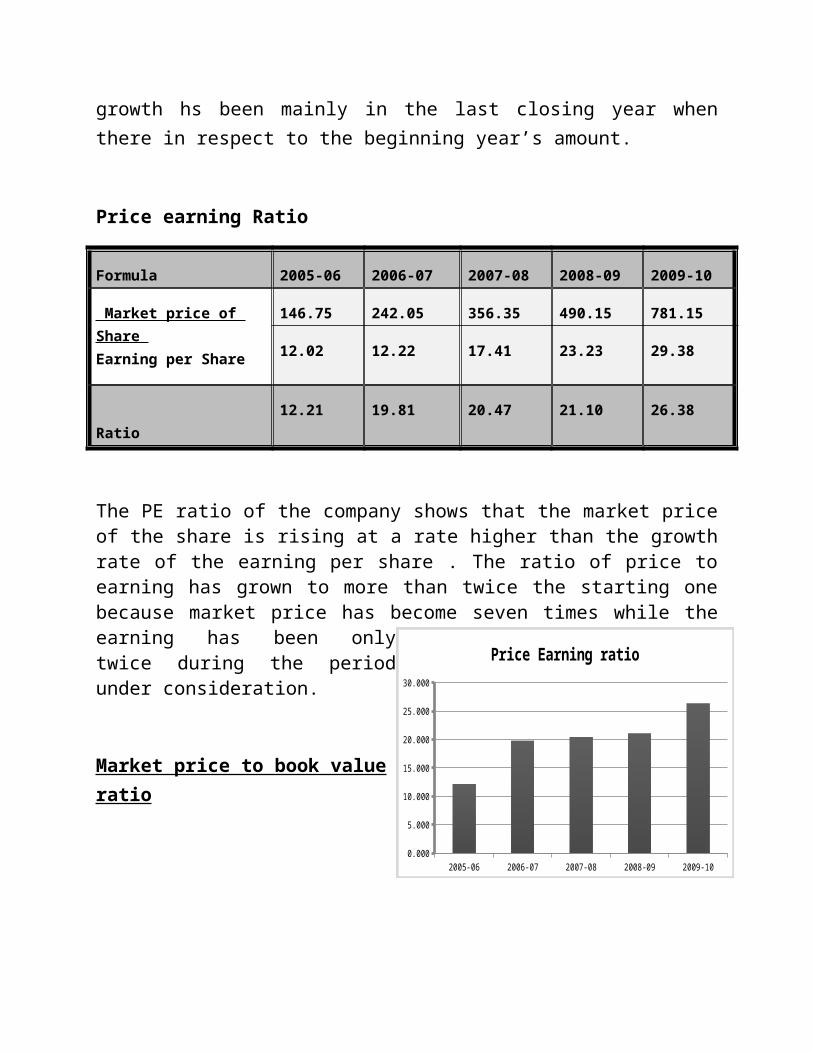
Price earning Ratio
Formula 2005-06 2006-07 2007-08 2008-09 2009-10
Market price of Share Earning per Share
146.75 242.05 356.35 490.15 781.15
12.02 12.22 17.41 23.23 29.38
Ratio 12.21 19.81 20.47 21.10 26.38
The PE ratio of the company shows that the market price of the share is rising at a rate higher than the growth rate of the earning per share . The ratio of price to earning has grown to more than twice the starting one because market price has become seven times while the earning has been only twice during the period under consideration.
Market price to book value ratio 2005-06 2006-07 2007-08 2008-09 2009-100.000
5.000
10.000
15.000
20.000
25.000
30.000
Price Earning ratio
2005-06 2006-07 2007-08 2008-09 2009-100.000
50.000
100.000
150.000
200.000
250.000
300.000
Book value per share
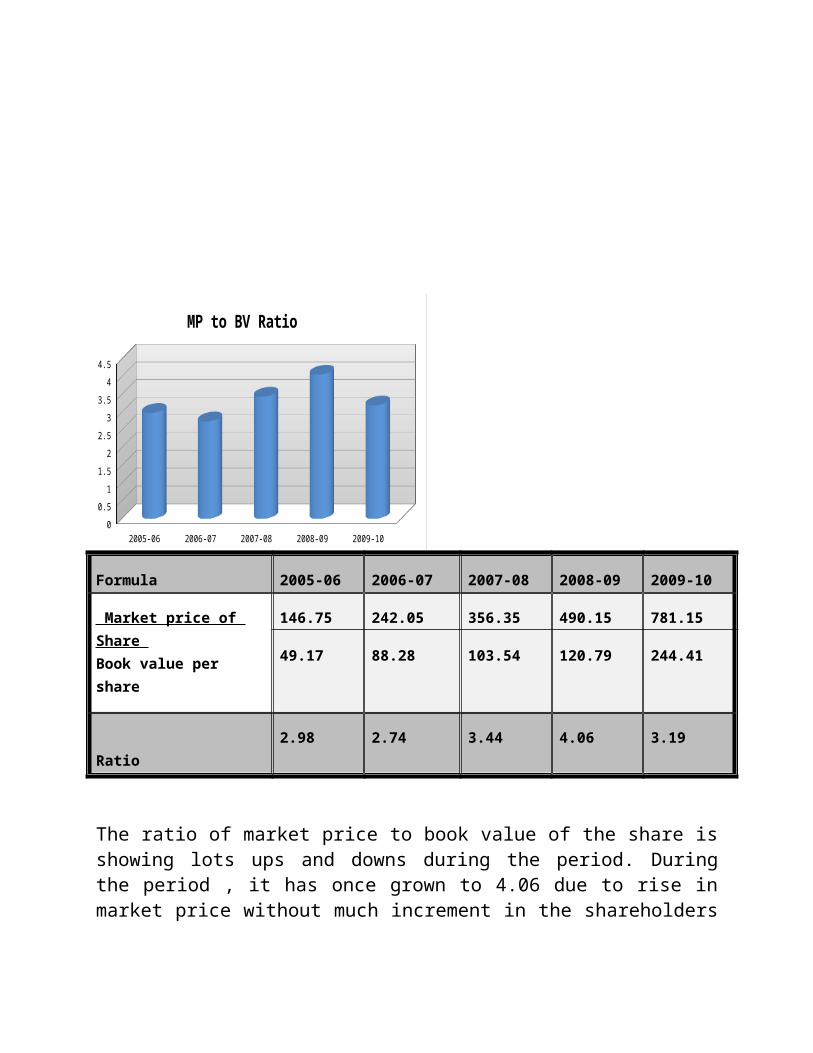
Formula 2005-06 2006-07 2007-08 2008-09 2009-10
Market price of Share Book value per share
146.75 242.05 356.35 490.15 781.15
49.17 88.28 103.54 120.79 244.41
Ratio 2.98 2.74 3.44 4.06 3.19
The ratio of market price to book value of the share is showing lots ups and downs during the period. During the period , it has once grown to 4.06 due to rise in market price without much increment in the shareholders fund. Both the market price and book value has shown tremendous growth of 7 and 5 times , respectively.
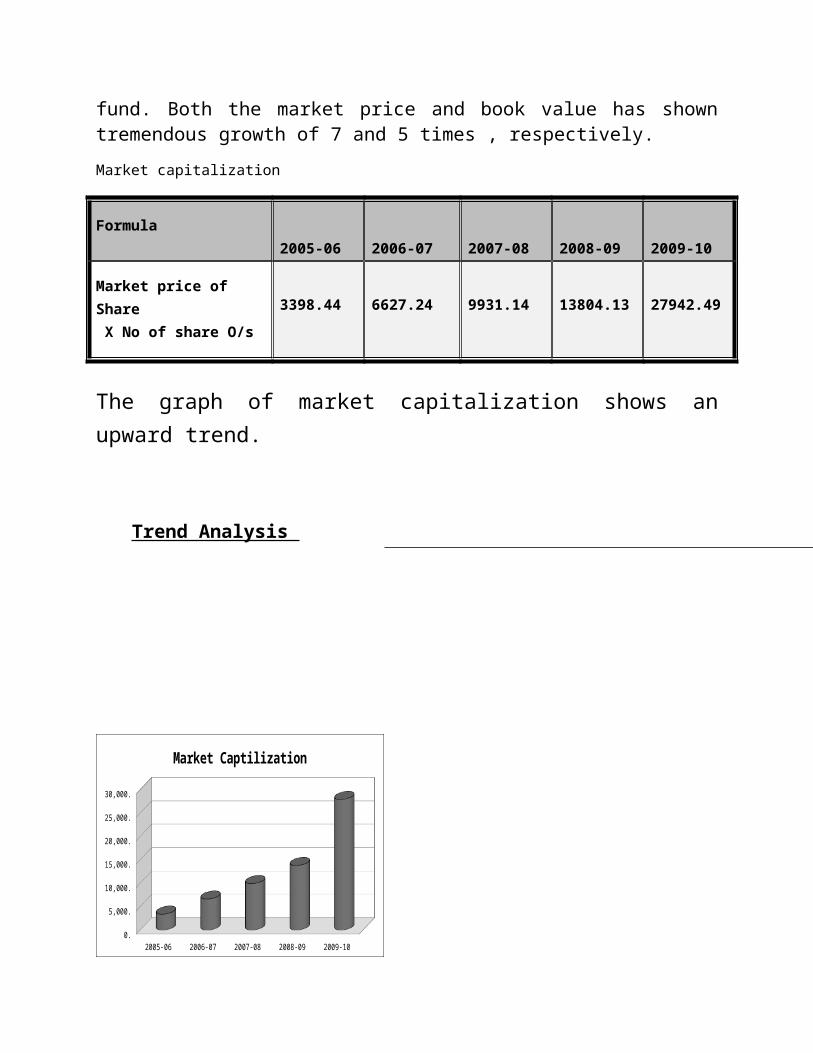
Market capitalization
Formula 2005-06 2006-07 2007-08 2008-09 2009-10
Market price of Share X No of share O/s 3398.44 6627.24 9931.14 13804.13 27942.49
The graph of market capitalization shows an upward trend.
Trend Analysis
2005-06 2006-07 2007-08 2008-09 2009-100
0.5
1
1.5
2
2.5
3
3.5
4
4.5
MP to BV Ratio
2005-06 2006-07 2007-08 2008-09 2009-100.
5,000.
10,000.
15,000.
20,000.
25,000.
30,000.
Market Captilization

Figure in crore
Summarized consolidated Balance Sheet
Capital and Liabilities 2005-06 2006-07 2007-08 2008-09 2009-10
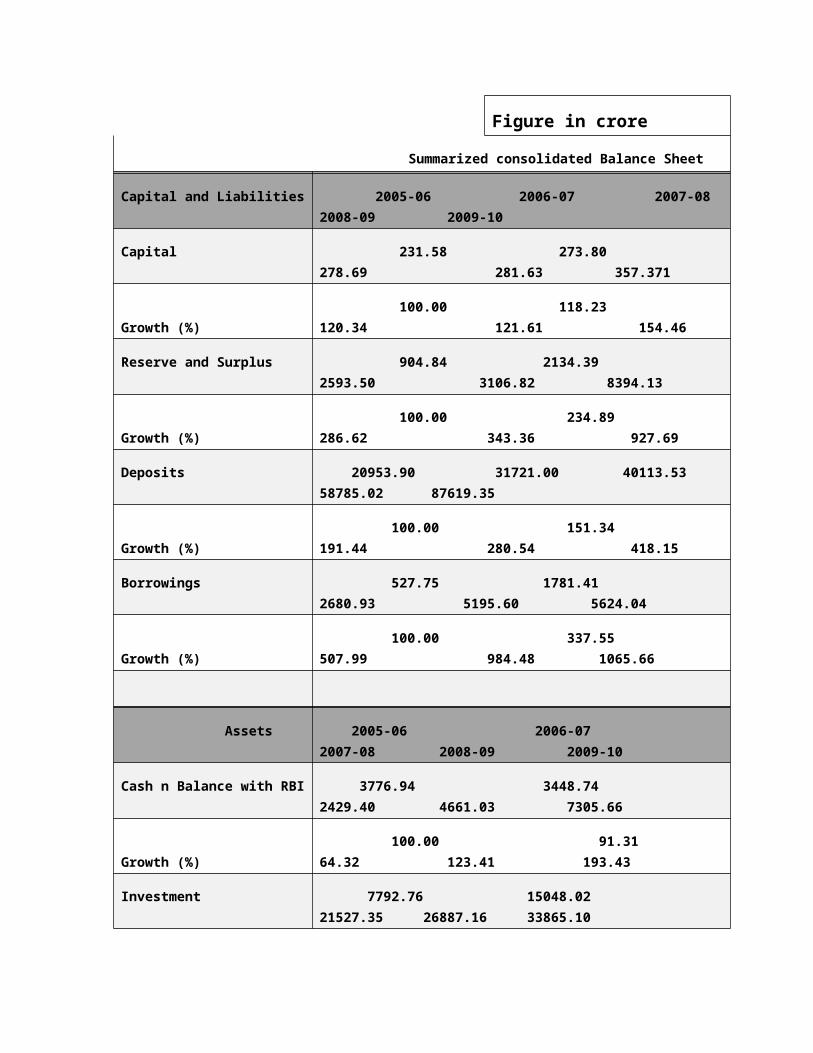
Capital 231.58 273.80 278.69 281.63 357.371
Growth (%) 100.00 118.23 120.34 121.61 154.46
Reserve and Surplus 904.84 2134.39 2593.50 3106.82 8394.13
Growth (%) 100.00 234.89 286.62 343.36 927.69
Deposits 20953.90 31721.00 40113.53 58785.02 87619.35
Growth (%) 100.00 151.34 191.44 280.54 418.15
Borrowings 527.75 1781.41 2680.93 5195.60 5624.04
Growth (%) 100.00 337.55 507.99 984.48 1065.66
Assets 2005-06 2006-07 2007-08 2008-09 2009-10
Cash n Balance with RBI 3776.94 3448.74 2429.40 4661.03 7305.66
Growth (%) 100.00 91.31 64.32 123.41 193.43
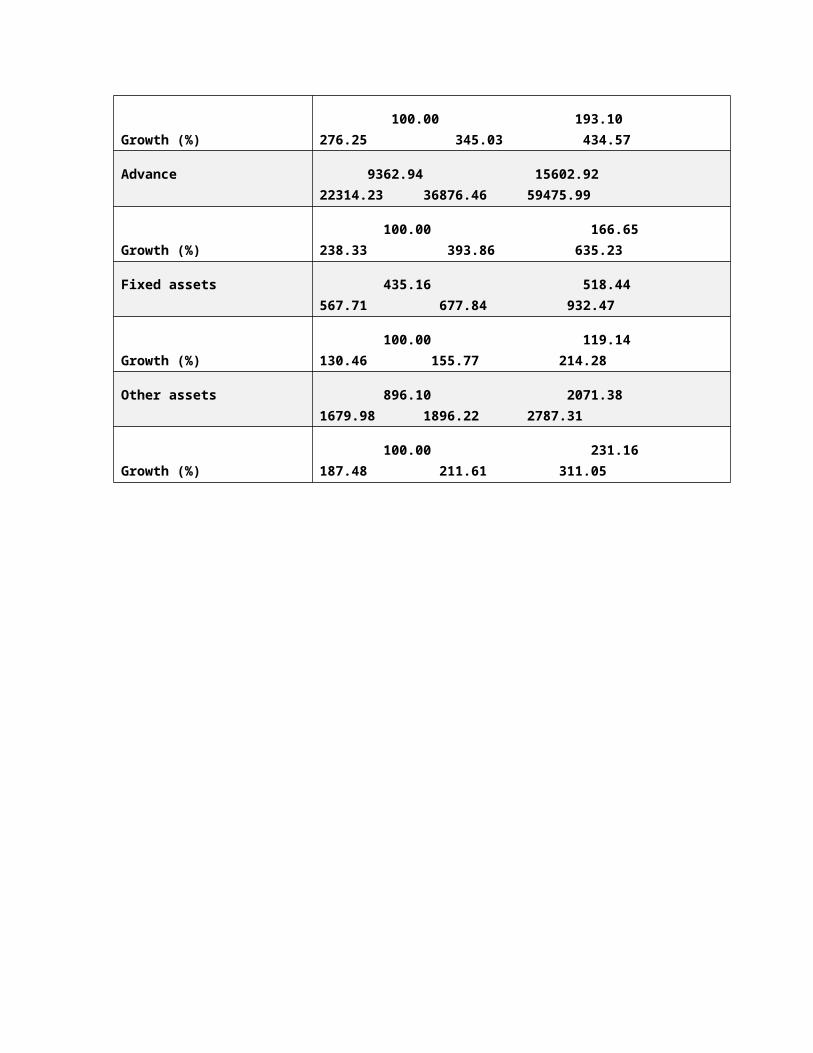
Investment 7792.76 15048.02 21527.35 26887.16 33865.10
Growth (%) 100.00 193.10 276.25 345.03 434.57
Advance 9362.94 15602.92 22314.23 36876.46 59475.99
Growth (%) 100.00 166.65 238.33 393.86 635.23
Fixed assets 435.16 518.44 567.71 677.84 932.47
Growth (%) 100.00 119.14 130.46 155.77 214.28
Other assets 896.10 2071.38 1679.98 1896.22 2787.31
Growth (%) 100.00 231.16 187.48 211.61 311.05
Figures in Crores
Summarized consolidated Income statement
Particular 2005-06 2006-07 2007-08 2008-09 2009-10
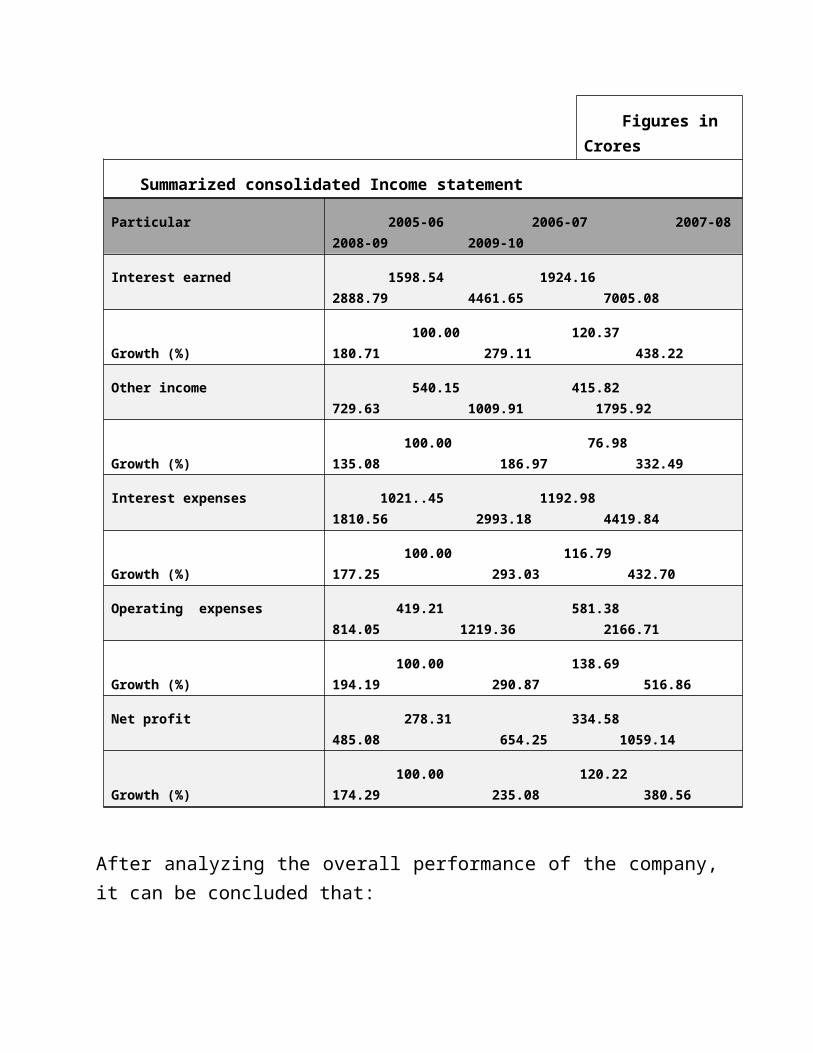
Interest earned 1598.54 1924.16 2888.79 4461.65 7005.08
Growth (%) 100.00 120.37 180.71 279.11 438.22
Other income 540.15 415.82 729.63 1009.91 1795.92
Growth (%) 100.00 76.98 135.08 186.97 332.49
Interest expenses 1021..45 1192.98 1810.56 2993.18 4419.84
Growth (%) 100.00 116.79 177.25 293.03 432.70
Operating expenses 419.21 581.38 814.05 1219.36 2166.71
Growth (%) 100.00 138.69 194.19 290.87 516.86
Net profit 278.31 334.58 485.08 654.25 1059.14
Growth (%) 100.00 120.22 174.29 235.08 380.56
After analyzing the overall performance of the company, it can be concluded that:
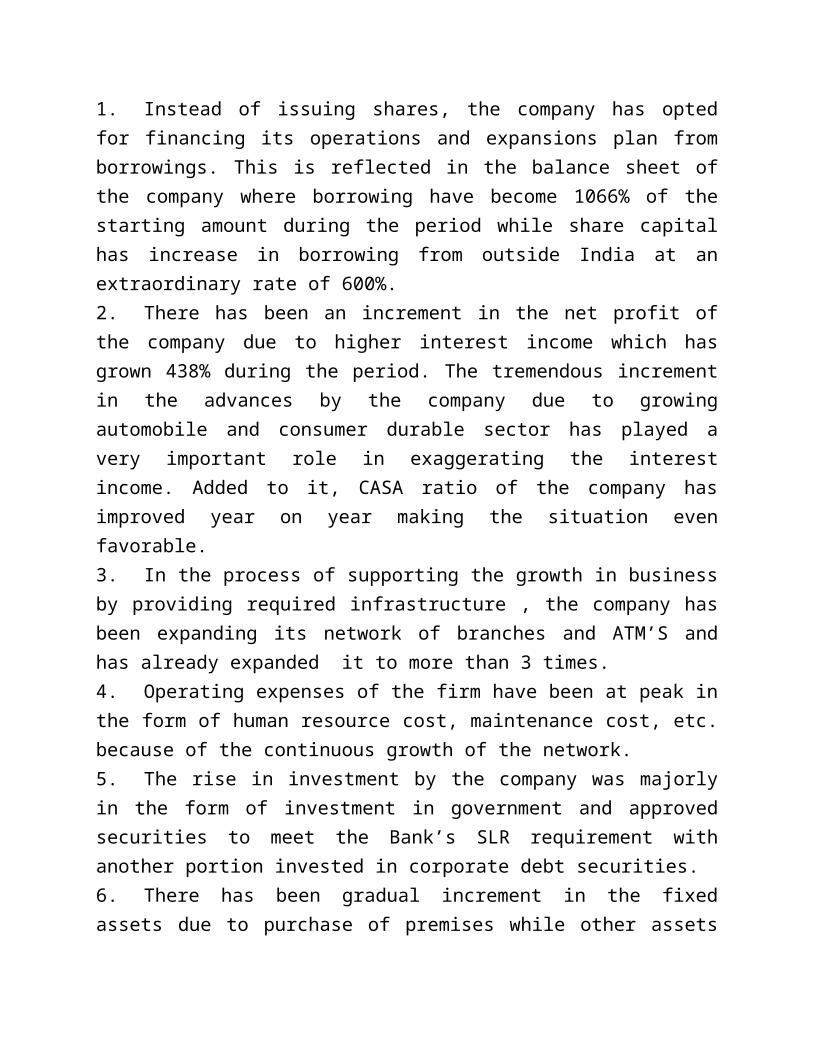
1. Instead of issuing shares, the company has opted for financing its operations and expansions plan from borrowings. This is reflected in the balance sheet of the company where borrowing have become 1066% of the starting amount during the period while share capital has increase in borrowing from outside India at an extraordinary rate of 600%.2. There has been an increment in the net profit of the company due to higher interest income which has grown 438% during the period. The tremendous increment in the advances by the company due to growing automobile and consumer durable sector has played a very important role in exaggerating the interest income. Added to it, CASA ratio of the company has improved year on year making the situation even favorable.

3. In the process of supporting the growth in business by providing required infrastructure , the company has been expanding its network of branches and ATM’S and has already expanded it to more than 3 times.4. Operating expenses of the firm have been at peak in the form of human resource cost, maintenance cost, etc. because of the continuous growth of the network.5. The rise in investment by the company was majorly in the form of investment in government and approved securities to meet the Bank’s SLR requirement with another portion invested in corporate debt securities.6. There has been gradual increment in the fixed assets due to purchase of premises while other assets has shown similar characteristics due to maintenance of stocks of stationary etc. subsequent to the expansion in operation.7. In FY08 , much of the growth in deposits was fuelled by growth of 74% in CASA deposits , which is twice the growth in term deposits . This has helped to improve the share of CASA in deposits to 46% in March ’08 from 40% in March ’07, thereby improving NIM to some extent.
Introduction:ICICI Limited was founded in 1955 jointly by world bank , Government of India and representatives of Indian Industry as one of the three financial Institutions to provide medium and long –term finance to Indian businesses (like other two financial institutions such as IDBI and SIDBI ) Formerly known as “ Industrial Credit and Investment Corporation of India “,it did not entertain retail customer and was thus not a bank in the literal sense . Later, in 1994, ICICI founded a separate legal entity in the name of ICICI Bank to take up the retail banking service including deposits, credit card, car loan etc.
Business overview: In ICICI Bank is India's second-largest bank with total assets of Rs. 3,634.00 billion (US$ 81 billion) at March 31, 2010 and profit after tax Rs. 40.25 billion (US$ 896 million) for the year ended March 31, 2010. The Bank has a network of 2,016 branches and about 5,219 ATMs in India and presence in 18 countries. ICICI Bank offers a wide range of banking products and financial services to corporate and retail customers through a variety of delivery channels and through its specialized subsidiaries in the areas of investment banking, life and non-life insurance, venture capital and asset management. The Bank currently has subsidiaries in the United Kingdom, Russia and Canada, branches in United States, Singapore, Bahrain, Hong Kong, Sri Lanka, Qatar and Dubai International Finance Centre and representative offices in United Arab Emirates, China, South Africa, Bangladesh, Thailand, Malaysia and Indonesia. Our UK subsidiary has established branches in Belgium and Germany. ICICI Bank's equity shares are listed in India on Bombay Stock Exchange and the National Stock Exchange of India Limited and its American Depositary Receipts (ADRs) are listed on the New York Stock Exchange (NYSE).
ICICI Bank is currently listed on following stock exchanges in India:
Stock Exchange Code for ICICI BankBombay Stock Exchange Limited (BSE)PhirozeJeejeebhoy TowersDalal Street, Mumbai 400 001
National Stock Exchange of India Limited (NSE)Exchange Plaza, Bandra-Kurla ComplexBandra (East), Mumbai 400 051
ICICIBANKNew York Stock Exchange (ADSs)211, Wall Street, New York, NY 10005, United States of America IBN
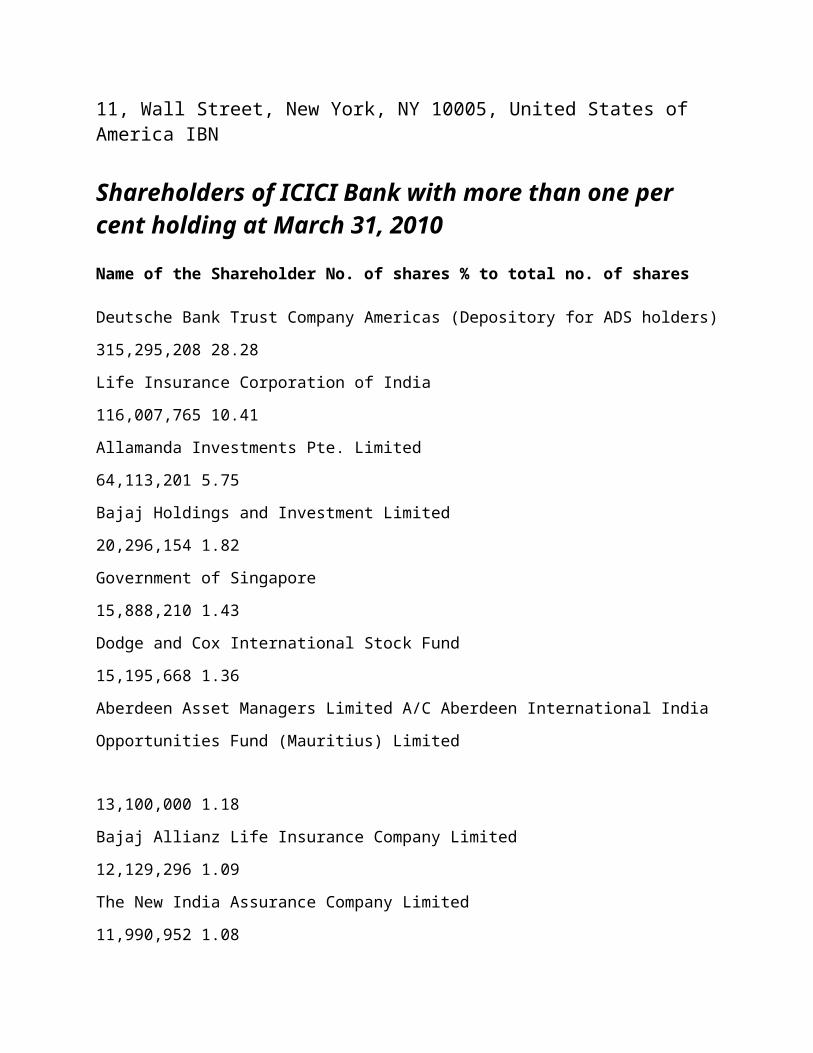
Shareholders of ICICI Bank with more than one per cent holding at March 31, 2010
Name of the Shareholder No. of shares % to total no. of shares
Deutsche Bank Trust Company Americas (Depository for ADS holders)
315,295,208 28.28
Life Insurance Corporation of India
116,007,765 10.41
Allamanda Investments Pte. Limited
64,113,201 5.75
Bajaj Holdings and Investment Limited
20,296,154 1.82
Government of Singapore
15,888,210 1.43
Dodge and Cox International Stock Fund
15,195,668 1.36
Aberdeen Asset Managers Limited A/C Aberdeen International India
Opportunities Fund (Mauritius) Limited
13,100,000 1.18
Bajaj Allianz Life Insurance Company Limited
12,129,296 1.09
The New India Assurance Company Limited
11,990,952 1.08
Total
584,016,454 52.40
SUBSIDIARY COMPANIES At March 31, 2010, ICICI Bank had 17 subsidiaries as listed in the following table: Domestic Subsidiaries International Subsidiaries ICICI Prudential Life Insurance ICICI Bank UK PLC Company Limited ICICI Lombard General Insurance ICICI Bank Canada Company Limited ICICI Prudential Asset Management Company Limited ICICI Prudential Trust Limited
ICICI Bank Eurasia Limited Liability Company ICICI Securities Holdings Inc.2
ICICI Securities Limited ICICI Securities Inc.3 ICICI Securities Primary Dealership Limited
ICICI International Limited
ICICI Venture Funds Management Company Limited ICICI Home Finance Company Limited ICICI Investment Management Company Limited ICICI Trusteeship Services Limited ICICI Prudential Pension Funds Management Company Limited1
MERGER OF THE BANK OF RAJASTHAN LIMITED WITH
ICICI BANK
The Board of Directors of ICICI Bank and the Board of Directors of The Bankof
Rajasthan Limited (Bank of Rajasthan) at their respective Meetings held on
May 23, 2010, approved the scheme of amalgamation of Bank of Rajasthan
with ICICI Bank. The amalgamation is subject to approval of RBI and
Membersof both the Banks. Approval of the Members of ICICI Bank is being
sought atan extraordinary general meeting scheduled on June 21, 2010.The
proposed amalgamation would substantially enhance ICICI Bank’sbranch
network, already the largest among Indian private sector banks,and
especially strengthen its presence in northern and western India. Itwould
combine Bank of Rajasthan’s branch franchise with ICICI Bank’sstrong capital
base, to enhance the ability of the merged entity to capitalize on the growth
opportunities in the Indian economy.
About Bank of Rajasthan
Bank of Rajasthan is a listed old Indian private sector bank with its
corporateoffice at Mumbai in Maharashtra and registered office at Udaipur
inRajasthan. At March 31, 2009, Bank of Rajasthan had 463 branches and
111ATMs, total assets of Rs. 172.24 billion, deposits of Rs. 151.87 billion
andadvances of Rs. 77.81 billion. It made a net profit of Rs. 1.18 billion in
fiscal2009 and a net loss of Rs. 0.10 billion in the nine months ended
December31, 2009. Around 40% of the branches of the Bank of Rajasthan
are locatedin rural and semi-urban areas.
ORGANISATION STRUCTURE
During fiscal 2010, given the significant expansion in our branch network and our increased focus on customer service, we reorganized our organization structure to provide greater empowerment to our branches with enhanced senior management oversight of their operations. We expect our branch network to serve as an integrated channel for deposit mobilization, retail asset origination and distribution of third party products. At the same time, we seek to ensure effective control and supervision and consistency in standards across the
organization. The organization is structured into the following principal groups:
Retail Banking Group: The retail sales and service architecture has been organized into four geographies. These have been further divided into zonal and regional structures. The Retail Strategy, Product & Policy Group has been formed to develop customer-segment specific strategies, including product design and service propositions. The Retail Banking Group is also responsible for inclusive and rural banking.
Wholesale Banking Group, comprising the Corporate Banking Group, Commercial Banking Group, Investment Banking Group, Project Finance Group, Financial Institutions and Capital Markets Group, Government Banking Group and Mid-corporate & Small Enterprises Group.
International Banking Group, comprising the Bank’s international operations, including operations in various overseas markets as well as products and services for non-resident Indians, international trade finance, correspondent banking and wholesale resource mobilization.
Global Markets Group, comprising our global client-centric treasury operations.
Corporate Centre, comprising financial reporting, planning and strategy, asset liability management, investor relations, secretarial, corporate branding, corporate communications, risk management, compliance, internal audit, legal, financial crime prevention and reputation risk management, accounts and taxation and the Bank’s proprietary trading operations across various markets.
Human Resources Management Group, which is responsible for the Bank’s recruitment, training, leadership development and other personnel management functions and initiatives.
Global Operations and Middle Office Groups, which are responsible for back-office operations, controls and monitoring for our domestic and overseas operations.
Customer Services Group, which is responsible for initiatives towards building and maintaining long-term customer relationships.
Information Technology Group, which is responsible for enterprise-wide technology initiatives, with dedicated teams serving individual business groups and managing information security and shared infrastructure.
Global Infrastructure & Administration Group, which is responsible for management of corporate facilitiesand administrative support functions.
Future prospects:
During fiscal 2010, the Bank continued to focus on improving its funding mix, conserving capital, liquidity management and risk containment and increasing operating efficiencies. We continued to grow our branch network and became the first private sector bank in India to have 2,000 branches in May 2010. We believe that the success achieved with respect to our strategy in fiscal 2010 and the enhanced branch network have positioned us well to capitalize on future growth opportunities
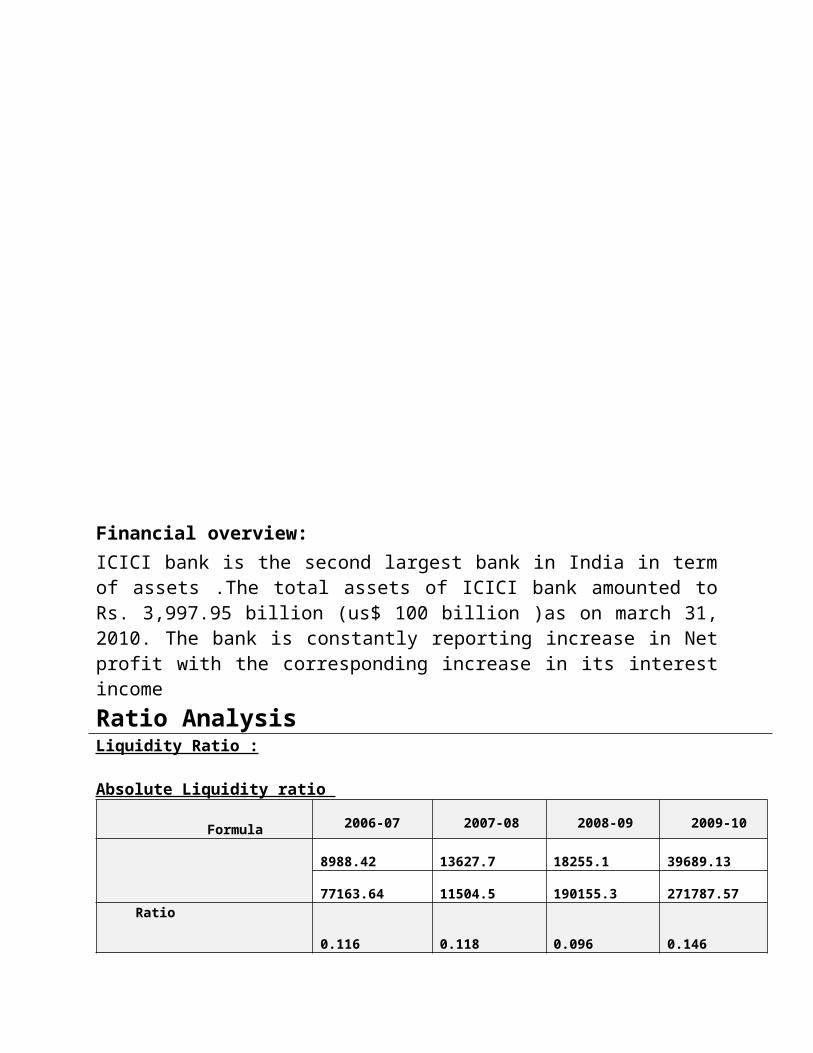
Financial overview:ICICI bank is the second largest bank in India in term of assets .The total assets of ICICI bank amounted to Rs. 3,997.95 billion (us$ 100 billion )as on march 31, 2010. The bank is constantly reporting increase in Net profit with the corresponding increase in its interest incomeRatio AnalysisLiquidity Ratio :
Absolute Liquidity ratio
Formula 2006-07 2007-08 2008-09 2009-10
Cash and near cash Current liabilities
8988.42 13627.7 18255.1 39689.13
77163.64 11504.5 190155.3 271787.57
Ratio 0.116 0.118 0.096 0.146
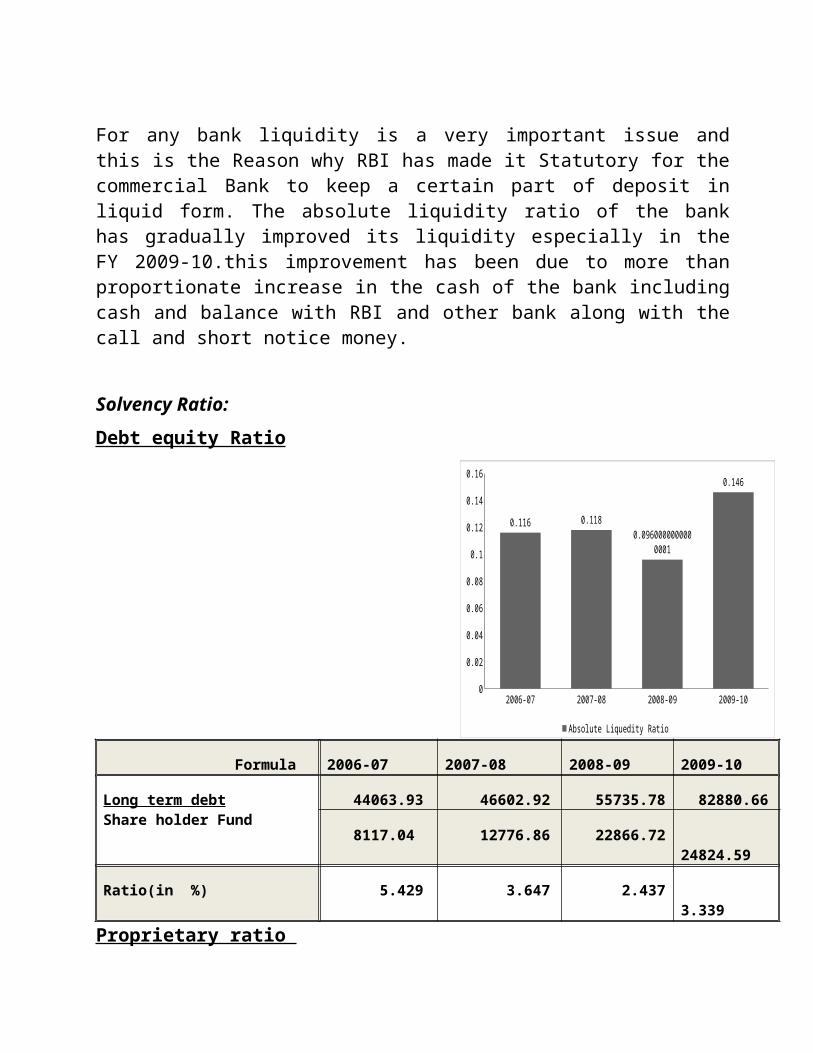
For any bank liquidity is a very important issue and this is the Reason why RBI has made it Statutory for the commercial Bank to keep a certain part of deposit in liquid form. The absolute liquidity ratio of the bank has gradually improved its liquidity especially in the FY 2009-10.this improvement has been due to more than proportionate increase in the cash of the bank including cash and balance with RBI and other bank along with the call and short notice money.
Solvency Ratio:
Debt equity Ratio
Formula 2006-07 2007-08 2008-09 2009-10
Long term debtShare holder Fund
44063.93 46602.92 55735.78 82880.66
8117.04 12776.86 22866.72 24824.59
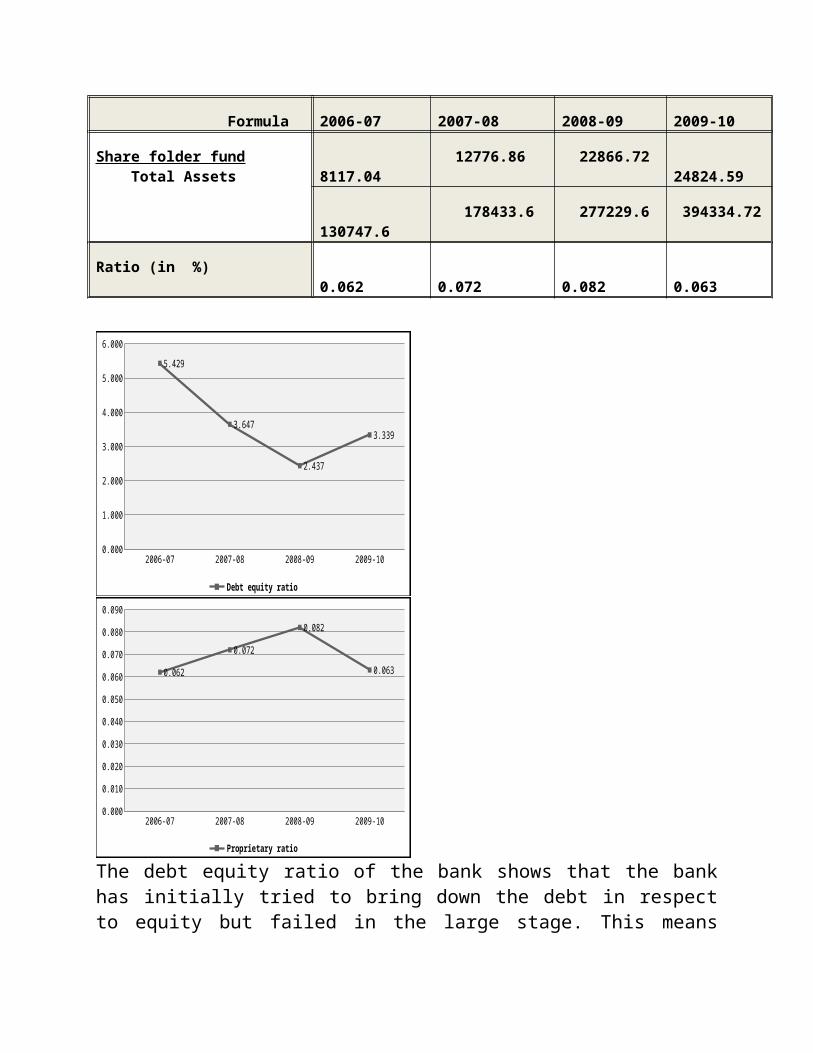
Ratio(in %) 5.429 3.647 2.437 3.339
Proprietary ratio
Formula 2006-07 2007-08 2008-09 2009-10
Share folder fund Total Assets
8117.04 12776.86 22866.72 24824.59
130747.6 178433.6 277229.6 394334.72
Ratio (in %) 0.062 0.072 0.082 0.063
2006-07 2007-08 2008-09 2009-100
0.02
0.04
0.06
0.08
0.1
0.12
0.14
0.16
0.116 0.118
0.0960000000000001
0.146
Absolute Liquedity Ratio
2006-07 2007-08 2008-09 2009-100.000
0.010
0.020
0.030
0.040
0.050
0.060
0.070
0.080
0.090
0.062
0.072
0.082
0.063
Proprietary ratio
The debt equity ratio of the bank shows that the bank has initially tried to bring down the debt in respect to equity but failed in the large stage. This means bank is relying more on debt as compared to equity capital.
Similarly, the propriety ratio of the bank had gradually improved on account of more than proportionate increase in the shareholder fund vis-a vis the total assets in the initial years. But fell down in 2008-09 due to maintenance higher total assets, primarily the cash and balance and advances.Turnover ratio:Fixed asset turnover Ratio
Formula 2006-07 2007-08 2008-09 2009-10
Total sales Fixed Assets
13906.64 16917.76 26327.99 41507.58
4147.07 4178.19 4142.87 4340.15
2006-07 2007-08 2008-09 2009-100.000
1.000
2.000
3.000
4.000
5.000
6.000
5.429
3.647
2.437
3.339
Debt equity ratio
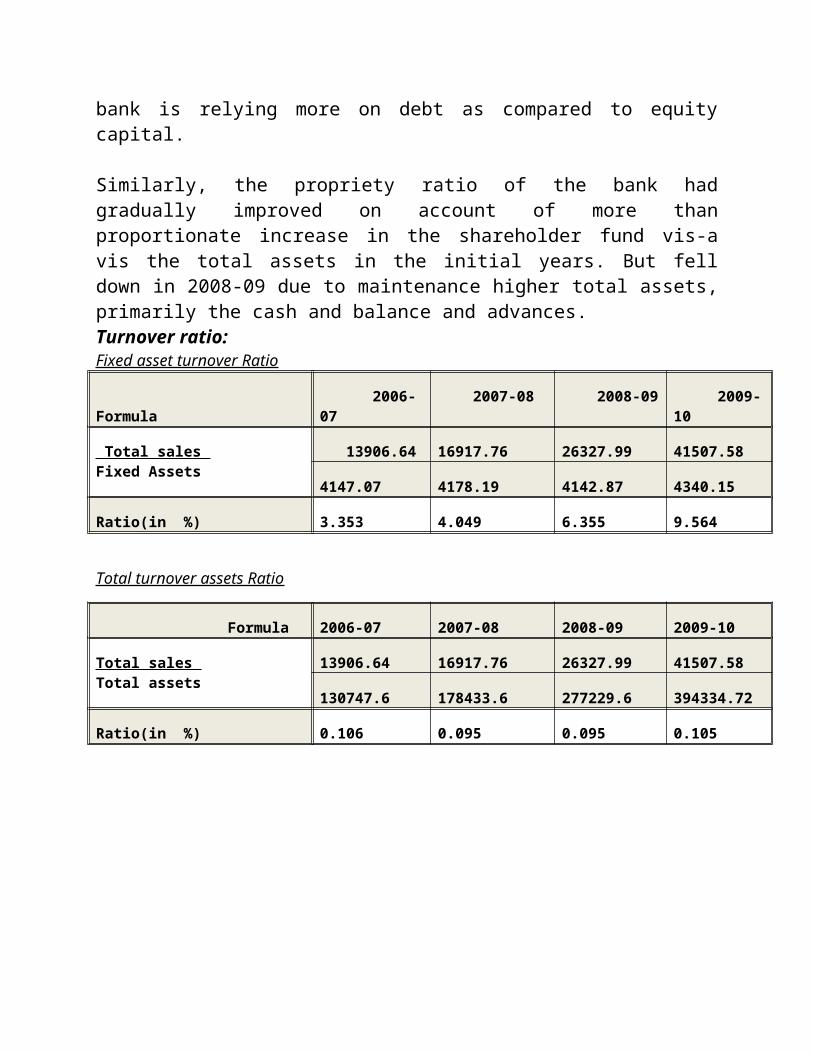
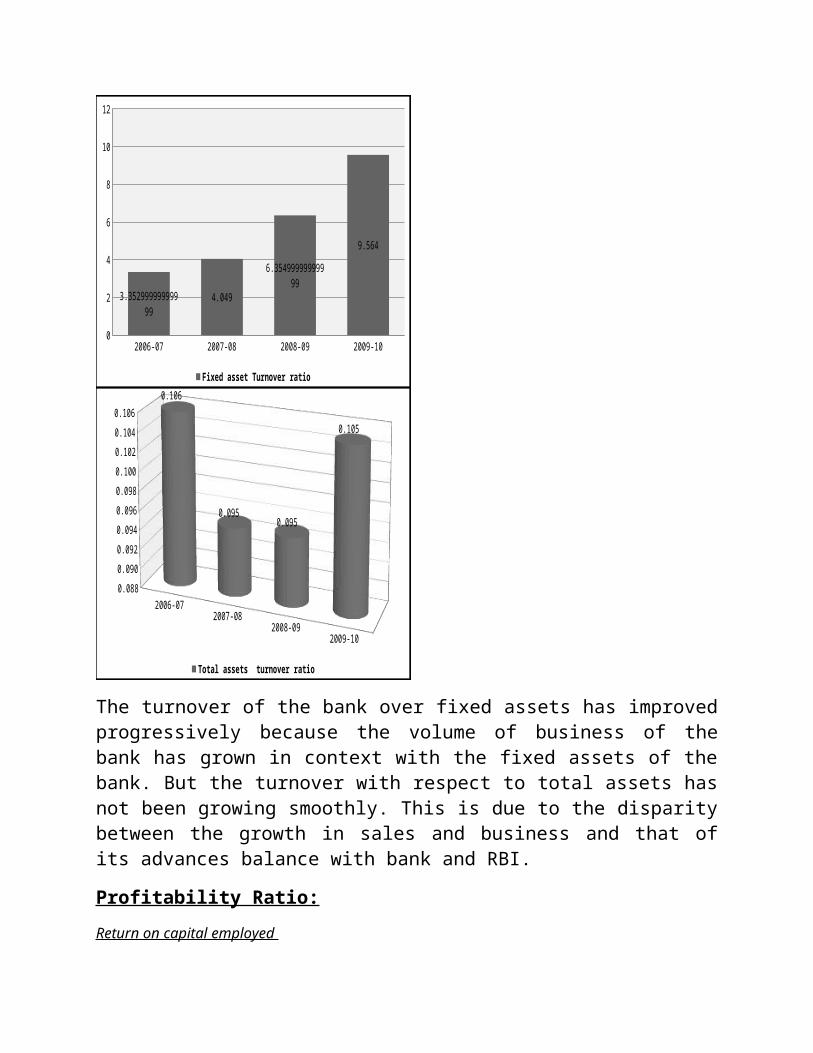
Ratio(in %) 3.353 4.049 6.355 9.564
Total turnover assets Ratio
Formula 2006-07 2007-08 2008-09 2009-10
Total sales Total assets
13906.64 16917.76 26327.99 41507.58
130747.6 178433.6 277229.6 394334.72
Ratio(in %) 0.106 0.095 0.095 0.105
2006-072007-08
2008-092009-10
0.088
0.090
0.092
0.094
0.096
0.098
0.100
0.102
0.104
0.1060.106
0.0950.095
0.105
Total assets turnover ratio
2006-07 2007-08 2008-09 2009-100
2
4
6
8
10
12
3.35299999999999 4.049
6.35499999999999
9.564
Fixed asset Turnover ratio
The turnover of the bank over fixed assets has improved progressively because the volume of business of the bank has grown in context with the fixed assets of the bank. But the turnover with respect to total assets has not been growing smoothly. This is due to the disparity between the growth in sales and business and that of its advances balance with bank and RBI.
Profitability Ratio:
Return on capital employed
Formula 2006-07 2007-08 2008-09 2009-10
Profit after taxCapital employed
1580.38 1852.33 2420.09 2760.63
52180.97 59379.78 78602.50 107705.25
Ratio(in %) 3.03 3.12 3.08 2.56
Return on Total assets
Formula 2006-07 2007-08 2008-09 2009-10
Profit after taxTotal assets
1580.38 1852.33 2420.09 2760.63
130747.6 178433.6 277229.6 394334.72
Ratio(in %) 1.21 1.04 0.87 0.70
The profit earning capacity of the bank seems to be mediocre in the period .Return on capital employed by the bank has been impulsive. The reason behind is that the profit earned by the bank has not in consistent with the capital employed. Also the return on total assets has been falling for the last four years revealing inadequate use of the total assets.
Return on equity
2006-072007-08
2008-092009-10
0.000
0.500
1.000
1.500
2.000
2.500
3.000
3.500
3.03 3.123.08
2.56
Return on capital Employed
Formula
2006-07
2007-08
2008-09
2009-10
Profit after Tax Share holders fund
1580.38
1852.33
2420.09
2760.63
8117.04
12776.86
22866.72
24824.59
Ratio (in %) 19.47 14.50 10.58
11.12
The return on equity produced by the bank is quite produced by the bank is quite disappointing as it has shown remarkable fall in these four years starting from 19.47% and ending at 11.12% .This signifies an unproductive unutilizationof the shareholder fund by the bank . Hence, the bank becomes unattractive from the point of view of the shareholders.
Investors Ratio:
Earnings per Share (EPS)
Formula 2006-07 2007-08 2008-09 2009-10
Profit after Tax No of share o/s
1580.38 1852.33 2420.09 2760.63
616401200 736775800 889834500 899343700
Ratio (in %) 25.64 25.14 27.20 30.70
Dividend per share(DPS)
Formula 2006-07 2007-08 2008-09 2009-10
Dividend paid No of share o/s
535.49 638.17 759.87 907.21
616401200 736775800 889834500 899343700
Ratio (in %) 8.69 8.66 8.54 10.09
2006-07 2007-08 2008-09 2009-100.000
5.000
10.000
15.000
20.000
25.000
19.47
14.5
10.58 11.12
Return on equity
If we give a look to the earning per share, we will find that the performance of the bank is quite satisfactory the earning per share has gradually increased. Dividend per share paid by the bank has shown capricious characteristics. it was previously increasing but after that it has improved 205 in one year due to higher dividend being paid by the bank to its shareholders.Dividend payout Ratio
Formula 2006-07 2007-08 2008-09 2009-10
Dividend per share Earnings per share
8.69 8.66 8.54 10.09
25.64 25.14 27.20 30.70
Ratio (in %) 0.34 0.34 0.31 0.33
2006-07 2007-08 2008-09 2009-100.000
5.000
10.000
15.000
20.000
25.000
30.000
35.000
25.64 25.14 27.230.7
Earning per share
2006-07 2007-08 2008-09 2009-107.500
8.000
8.500
9.000
9.500
10.000
10.500
8.69 8.66 8.54
10.09
Dividend per share
2006-07 2007-08 2008-09 2009-100.000
0.500
1.000
1.500
2.000
2.500
3.000
2.94
2.2
1.451.18
Dividend yield
Dividend yield
Formula 2006-07 2007-08 2008-09 2009-10
Dividend per share Market Price of share
8.69 8.66 8.54 10.09
295.90 393.00 589.25 853.01
Ratio (in %) 2.94 2.20 1.45 1.18
The dividend paid by the bank per share with respect to the earning from each has been almost steady with few ups and downs. But the dividend yield graphs shows that the dividend paid by the bank each year has not been in consistent with the rise I the market price of the shares.
Book value per share
2006-07 2007-08 2008-09 2009-100.295
0.300
0.305
0.310
0.315
0.320
0.325
0.330
0.335
0.340
0.34 0.34
0.310000000000001
0.330000000000002
Dividendpayout ratio
Formula 2006-07 2007-08
Share holder fund No of share o/s
8117.04 12776.86
616401200 736775800
Ratio (in Rs) 131.68 173.42
Market price to Book value ratio
Formula 2006-07 2007-08
Market Price of Share Book Value per share
294.90 393.00
131.68 173.42
Ratio (in %) 2.25 2.27
The book value per share of the bank has increased over year primarily due to rise in the reserve and surplus which has inflated the shareholder fund in the balance sheet. Similarly the market price to book value ratio has improved year on year powered by higher market price of the share of the company o the exchange.
2006-07 2007-08 2008-09 2009-100.000
0.500
1.000
1.500
2.000
2.500
3.000
3.500
2.25 2.27 2.29
3.09
Market price to book value
Price earnings ratio
2006-07 2007-08 2008-09 2009-100.000
50.000
100.000
150.000
200.000
250.000
300.000
131.68
173.42
256.979999999999276.03
Book value per share
Formula 2006-07 2007-08 2008-09 2009-10
Market Price of Share Earning per share
294.90 393.00 589.25 853.01
25.64 29.37 27.11 31.03
Ratio 11.54 13.38 21.74 27.49The ratio of market price to earnings per share shows an incessant trend of rise. The reason behind is the proportionate rise I both the market price as well as the earning per share. Rising PE ratio signifies better returns for the investors in future Other key Ratio:Market Capitalization
The market capitalization of the ban has shown steady augment. it has grown over the four years in the same pace on an average
Trend Analysis
2006-07 2007-08 2008-09 2009-100.000
5.000
10.000
15.000
20.000
25.000
30.000
11.5413.38
21.74
27.49
Price earning ratio
2006-07 2007-08 2008-09 2009-100.
10,000.
20,000.
30,000.
40,000.
50,000.
60,000.
70,000.
80,000.
1823928955
52433
76715
Market capitalization
Figure in crore
Summarized consolidated Balance Sheet
Capital and Liabilities 2006-07 2007-08 2008-09 2009-10
Capital 966.40 1086.78 1239.83 1249.34
Growth (%) 100.00 112.46 128.29 129.28
Reserve and Surplus 7139.52 11537.44 21351.95 23065.69
Growth (%) 100.00 161.60 299.07 323.07
Deposits 68078.7 101108.60 172450.9 224613.63
Growth (%) 100.00 148.52 253.31 365.19
Borrowings 34958.07 38369.02 44999.95 61659.54
Growth (%) 100.00 109.76 128.73 176.38
Assets 2006-07 2007-08 2008-09 2009-10
Cash n Balance with RBI 5446.30 6370.14 8985.94 19241.04
Growth (%) 100.00 116.96 164.99 353.29
Investment 46267.45 54651.62 84013.88 120616.69
Growth (%) 100.00 118.12 181.58 260.69
Advance 64947.93 96404.96 156260.32 211399.44
Growth (%) 100.00 148.44 240.59 325.49
Fixed assets 4147.07 4178.19 4142.87 4340.15
Growth (%) 100.00 100.75 99.90 104.66
Other assets 6396.75 9566.19 14557.39 18289.31
Growth (%) 100.00 149.55 227.57 285.92
Conclusion:
After analyzing the trend balance sheet and income statement of the given period, it found that:
Interest earned by the bank in this five year has shown a growth of 3655or3.56 times. This is because advance disbursed advances of the bank have a growth of 365%or 3.56 times within rather than 5 years.
Figures in Crores
Summarized consolidated Income statement
Particular 2006-07 2007-08 2008-09 2009-10
Interest earned 9352.67 9833.76 15135.82 24002.55
Growth (%) 100.00 105.14 161.83 256.64
Other income 4553.02 7097.63 9479.69 17361.24
Growth (%) 100.00 94.93 140.93 246.60
Interest expenses 7167.66 6804.38 10101.48 17675.72
Growth (%) 100.00 94.93 140.93 246.60
Operating expenses 4193.43 7285.66 10569.76 18013.21
Growth (%) 100.00 173.74 252.06 429.56
Net profit 1579.63 1810.04 2399.02 2760.63
Growth (%) 100.00 114.59 151.87 174.76
Apart from this, income of the bank from sources other than lending has shown an outstanding growth of 570% mostly in last few years. This is due to various value added services being provided by the bank through its wide network of base by providing modern service. The role of expansion of ATMs and branches is clear from the corresponding remarkable hike in the operating cost of the bank which has become 6.44 times of the amount in FY 2004.
One thing which attracts attention is that interest expanded by the bank has shown a growth of 2.46 times since FY06 while the bank deposits have grown at the rate of 365%. This is because, as discussed previously, the percentage of CASA, which are low fund cost, in the total deposits has increased year on year. As such percentage of fixed deposits has not growth in total deposits.
Due to rise in investment by the bank, interest and other income of the bank and availibilty of higher low cost funds, the bank managed to surmount the excessive operating and expansive cost and earned a growth off 200% in profit in 5 years.

Introduction
HDFC Bank marked the beginning of its services in the year 1995 with setting a loud and clear message that it wants to become a "World-class Indian Bank". It always believed in winning the hearts of its customers with quality products and services. It is the sole reason why today HDFC has been able to achieve both national and international acclaim.
Housing Development Finance Corporation Limited (HDFC) was arguably the first to obtain RBI's 'in-principle' approval to foray into private sector bank. This came into effect when RBI was implementing liberalization process to improve the banking industry of India in 1994. In 1994, the name changed to HDFC Bank Limited. It started its function as a Scheduled Commercial Bank in January 1995
Business overview
. The financial performance during the fiscal year endedMarch 31, 2010 remained healthy with total net revenues (netinterest income plus other income) increasing by 14% toRs. 12,194.2 crores from Rs. 10,711.8 crores in the previous financialyear. Revenue growth was driven both by an increase in net interestincome and other income. Net interest income grew by 13% primarilydue to an increase in the average balance sheet size and anincrease in full year net interest margins by 13 basis points to 4.3%.Other income registered a growth of 15.7% over that in theprevious year to Rs. 3,807.6 crores in the financial year endedMarch 31, 2010. This growth was driven primarily by an increasein fees and commissions earned and income from foreignexchange and derivatives offset in part by lower bond gains thanthose in the previous financial year. In the fiscal year endedMarch 31, 2010, commission income increased by 15.2% toRs. 2,830.6 crores with the main drivers being fees on debit andcredit cards, transactional charges & fees on deposit accounts andprocessing fees on retail assets. Commissions from thedistribution of third party insurance & mutual funds remainedone of the major components of fees and commissions. Whilst theregulatory changes restricted the commissions payable tobanks by mutual funds, the same was offset by higherdistribution volumes. The Bank made a profit on the sale /revaluation of investments of Rs. 345.1 crores during the year,almost 10% lower than that in the previous year as yieldsstarted moving up since the third quarter of the financial yearended March 31, 2010. Foreign exchange and derivativesrevenues grew from Rs. 440.5 crores in the previous financialyear to Rs. 623.2 crores in the fiscal year ended March 31, 2010.

Product and Services
HDFC Bank offers its customers a large number of products and services to meet their diverse needs and requirements. The vast range of products and services of the bank is composed of:
Personal Banking
Private Banking Accounts and Deposits
o Savings Accounts, Salary Accounts, Current Accounts, Fixed Deposits, Recurring Deposit, Demat Account, Safe Deposit Lockers
Credit, Debit and Pre-paid Cards o Silver Credit Card, Titanium Credit Card, Value Plus Credit Card, Visa Signature
Credit Card, Corporate Platinum Credit Card, Purchase Card, EasyShop Gold Debit Card, EasyShop International Debit Card, EasyShop International Business Debit Card, EasyShop Titanium Debit Card, MoneyPlus Card, ForexPlus Chip Card
Investments and Insurance o Mutual Funds, Insurance, Tax Planning, Bonds, General & Health Insurance,
Equities & Derivatives, Knowledge Centre, Mudra Gold Bar Forex and Trade Services
o Products & Services, Forex Services Branch Locator, RBI Guidelines, Forex Limits
Loans o Personal Loans, SmartDraft, Home Loans, Two Wheeler Loans, New Car Loans,
Used Car Loans, Working Capital Finance, Commercial Vehicle Finance, Tractor Loans, Health Care Finance, Loans Against Rental Receivables, Warehouse Receipt Loans, Loan Against Property
NRI Banking
Accounts and Deposits o Rupee Savings Accounts, Rupee Current Accounts, Rupee Fixed Deposits,
Foreign Currency Deposits, Accounts for Returning Indians, Compare Accounts Investments and Insurance
o Mutual Funds, Private Banking, Portfolio Investment Schemes Payment Services
o NetSafe, InstaPay, BillPay, DirectPay, Online Donation, Visa Money Transfer Remittances
o Funds Transfer Cheques / DDs / TCs, Quickremit, ChequeLockBox, Quickremit Loans
o Home Loans, Loans Against Securities, Loans Against Deposits
Wholesale Banking
Government Sector
Small and Medium Enterprises o Funded Services, Non-Funded Services, Specialized Services, Value Added
Services, Internet Banking Financial Institutions & Trusts
o Clearing Sub-membership, RTGS – Sub membership, Funds Transfer, ATM Tie-ups, Tax Collection, Corporate Salary Accounts, Cash Management Services, Derivatives Desk, Money Market Desk, Forex Desk, Custodial Service, Mutual Funds, Stock Brokers, Insurance Companies, Commodity Businesses, Participation in RBI Auctions, SGL Maintenance
Corporates o Funded Services, Non Funded Services, Value Added Services, Internet Banking,
Supply Chain Partners (Dealer Financing, Vendor Financing), Agricultural Lending
LISTING
Listing on Indian Stock Exchanges
Sr.No. NAME AND ADDRESS OF THE STOCK EXCHANGE STOCK CODE
1. Bombay Stock Exchange Limited, PhirozeJeejeebhoy Towers, Dalal Street, Fort, Mumbai 400 023
500180
2. The National Stock Exchange of India Ltd, Exchange Plaza, 5th Floor, BandraKurla
Complex, Bandra (East), Mumbai 400 051
HDFCBANK
International Listing:
1 The American Depository The New York Stock Exchange J P Morgan Chase Bank, shares (ADS) (Ticker – HDB)11, Wall Street, N.A.4, New York Plaza, 13th
Floor, (CUIP No. 40415F101) New York, N.Y. 11005 New York, NY 10004
2 Global Depository Receipts (GDRs)
Luxembourg Stock Exchange Deutsche Bank Trust Company
(ISIN No. US40415F2002) Postal Address : Americas,
11, av de la Porte-Neuve, 2, BourlevardKonrad Adenauer,
L – 2227 Luxembourg. L – 1115 Luxembourg
Mailing Address :
B.P. 165, L – 2011, Luxembourg
Subsidiaries
1. Your Bank has two subsidiaries, HDFC Securities Limited (“HSL”)2. HDB Financial Services Limited
Shareholding pattern
Network
Bank expanded its distribution network – from1,412 branches in 528 cities as on March 31, 2009 to1,725 branches in 779 cities on March 31, 2010. The Bank’s ATMsincreased from 3,295 to 4,232 during the same period.

Ratio analysis
Liquidity ratio:Absolute liquidity Ratio
Formula 2005-06 2006-07 2007-08 2008-09 2009-10
Cash and near cash Current liabilities
3550.88 4474.00 6942.37 9073.43 14827.98
36705.84 41618.71 63646.31 78367.36 113359.4
Ratio 0.097 0.107 0.109 0.116 0.131
The absolute liquidity ratio of the company shows an upward trend as shown in graph .The company has improved its liquidity status on regular basis without any failure for these five years in question .The growth in liquidity has been propelled by the growth in call and short notice money in initial 4 yea while the fifth year’s
2005-06 2006-07 2007-08 2008-09 2009-100.000
0.020
0.040
0.060
0.080
0.100
0.120
0.140
Absolute liquidity Ratio
Absolute liquidity Ratio
liquidity was facilitated by the amazing growth in the cash balance of the company with RBI Solvency ratio:
Debt equity ratio
Formula 2005-06 2006-07 2007-08
Long term debtShareholder Fund
2307.82 4790.01 2858.48
2693.33 4520.28 5299.60
Ratio 0.857 1.060 0.539
The graph of debt equity ratio of the company reveals that company has increased its dependence on after equity after 2004 as the graph shows a downward graph for 2005-06 is the absence of tier II debt in its long term debt structu8re . While the shareholders fund has registered a constant growth due to reserve and supply of the company.
Proprietary ratio
Formula 2005-06 2006-07 2007-08 2008-09 2009-10
Shareholder Fund Total Assets
2693.33 4520.28 5299.60 6498.98 11572.07
42306.99 51429.00 73601.32 91308.25 133193.07
2005-06 2006-07 2007-08 2008-09 2009-100
0.2
0.4
0.6
0.8
1
1.2
0.857000000000001
1.06
0.539
0.938
0.668000000000003
Debt Equity Ratio
Ratio 0.064 0.088 0.072
The graph showing proprietary ratio of the company is displaying a mixed tend of ups and down .the ratio initially moved up because of doubling of the reserve and surplus which raised the shareholder fund was not so significant .finally , the ratio recovered due to remarkable increase I shareholders fund.
Turnover ratio:Fixed assets turnover ratio
Formula 2005-06 2006-07 2007-08 2008-09 2009-10
Total Sales Fixed Assets
4813.77 4563.77 5689.70 7262.54 10475.17
616.91 708.32 817.46 987.53 1196.29
Ratio 7.803 6.443 6.529 7.354 8.756
Since the growth in total sales of the company is not so high initial years, growth in fixed assets has worsened the situation. This has made the graph fall between 2006 and 2010. After that, company managed the of more than 40% in its total sales, increasing the turnover on fixed assets to a new height.
Total assets turnover ratio
Formula 2005-06 2006-07 2007-08 2008-09 2009-10
Total sales Total Assets
4813.77 4563.77 5689.70 7262.54 10475.17
42306.99 51429.00 73601.32 91308.25 133193.07
2005-06 2006-07 2007-08 2008-09 2009-100.000
0.010
0.020
0.030
0.040
0.050
0.060
0.070
0.080
0.090
0.100
0.0640000000000001
0.0880000000000001
0.072 0.071
0.087
Proprietory Ratio
2005-06 2006-07 2007-08 2008-09 2009-10
7.803
6.443 6.529
7.354
8.756
Fixed Assets turnover Ratio
Ratio 0.114 0.089 0.077 0.080 0.079
The turnover of the company from the total assets has degradation is the maintainers of high level of assets by the company. Looking at the assets side of the balance sheet, we will find that the cash and balance with RBI and other assets of the company have shown a growth of more than times in these five years. As such , total assets of the company have increased more than the sales
Profitability Ratio:
Return on capital employed
Formula 2005-06 2006-07 2007-08 2008-09 2009-10
Profit After tax Capital employed
509.50 665.56 881.56 1150.96 1595.07
5001.15 9310.29 8158.08 12596.97 19300.03
Ratio 10.2 7.2 10.8 9.1 8.3
2005-06 2006-07 2007-08 2008-09 2009-10
0.114
0.0890000000000001
0.077 0.080.07900000000000
02
Total assets Turn over Ratio
The return on capital employed by the company has been falling overall. The reason behind is that the company has not improved its profit level at the same rate as it has done with the capital employed iin the business. the return in 2007-08 is vey trivial due to excessive borrowings from the bank and other financial institution during the year .
Return on total assets
Formula 2005-06 2006-07 2007-08 2008-09 2009-10
Profit After taxTotal assets
509.50 665.56 881.56 1150.96 1595.07
42306.99 51429.00 73601.32 91308.25 133193.07
Ratio 1.20 1.29 1.20 1.26 1.20
The the return on total assets of the company has shown a mixed characteristics in these five years Return on equity in 2007-08 due to growth in PAT which is more than the proportionate increase in the total assets . There has been a good amount of rise in the profit but still return on total assets has been low because of similar rise in the total assets held by the company.
Return on Equity (ROE)
Formula 2005-06 2006-07 2007-08 2008-09 2009-10
Profit After taxShare holder Fund
509.50 665.56 881.56 1150.96 1595.07
2693.33 4520.28 5299.60 6498.98 11572.07
Ratio 18.92 14.72 16.63 17.71 13.78
2005-06 2006-07 2007-08 2008-09 2009-100.000
2.000
4.000
6.000
8.000
10.000
12.00010.2
7.2
10.8
9.18.3
Return on Capital employed
2005-06 2006-07 2007-08 2008-09 2009-101.140
1.160
1.180
1.200
1.220
1.240
1.260
1.280
1.300
1.2
1.29
1.2
1.26
1.2
Return on Total Assets
Return on equity of the company has decreased over the year due to improper use of the shareholders und during the period , especially in the last fiscal year where there is almost 90% growth in the shareholder fund while the profit after tax has recorded a rise of about 30% I the year bring down the return on equity
Investors Ratio:
Earnings per shareFormula 2005-06 2006-07 2007-08 2008-09 2009-10
Profit After taxNo of share o/s
509.50 665.56 881.56 1150.96 1595.07
284791713 309875308 313142408 319389608 354432920
Ratio 17.89 21.48 28.15 36.04 45.00
Earnings per share doubled during the period which is a good sign for the investor s. There graph for the earning per share reveal that the company has consistently improved its earning with respect to the number of outstanding share . This growth in earning has been facilitated by the growth in total sales of the company during the period. Dividend per share
Formula 2005-06 2006-07 2007-08 2008-09 2009-10
Dividend PaidNo of share o/s
84.95 100.05 140.07 172.58 223.63
284791713 309875308 313142408 319389608 354432920
Ratio 2.98 3.23 4.47 5.40 6.31
2005-06 2006-07 2007-08 2008-09 2009-100.
2.
4.
6.
8.
10.
12.
14.
16.
18.
20.18.92
14.72
16.6317.71
13.78
Return on Equity
2005-06 2006-07 2007-08 2008-09 2009-100.0
5.0
10.0
15.0
20.0
25.0
30.0
35.0
40.0
45.0
17.8921.48
28.1536.04
45
Earnings per Share

Just like the earning per share has grown incessantly during the period, dividend paid by the company per outstanding share has also increased. The rise in dividend per share shows that the company has been fair in distributing the profit earned by the company.
Dividend Payout ratio
Formula 2005-06 2006-07 2007-08
DPSEPS
2.98 3.22 4.47
17.89 21.48 28.15
Ratio 0.17 0.15 0.16
Although the dividend per share has grown during the period but the dividend payout ratio divulge a different story. The ratio of dividend paid and the corresponding earning of the company during the period.
Dividend yield
Formula 2005-06 2006-07 2007-08 2008-09 2009-10
Dividend per share Market price of share
2.98 3.22 4.47 5.40 6.31
378.35 544.25 773.5 949.4 1319.95
Ratio 0.79 0.59 0.58 0.57 0.48
2005-06 2006-07 2007-08 2008-09 2009-100.000
1.000
2.000
3.000
4.000
5.000
6.000
7.000
2.983.23
4.47
5.4
6.31
Dividend per Share
2005-06 2006-07 2007-08 2008-09 2009-100.000
0.020
0.040
0.060
0.080
0.100
0.120
0.140
0.160
0.180
Dividend Payout Ratio
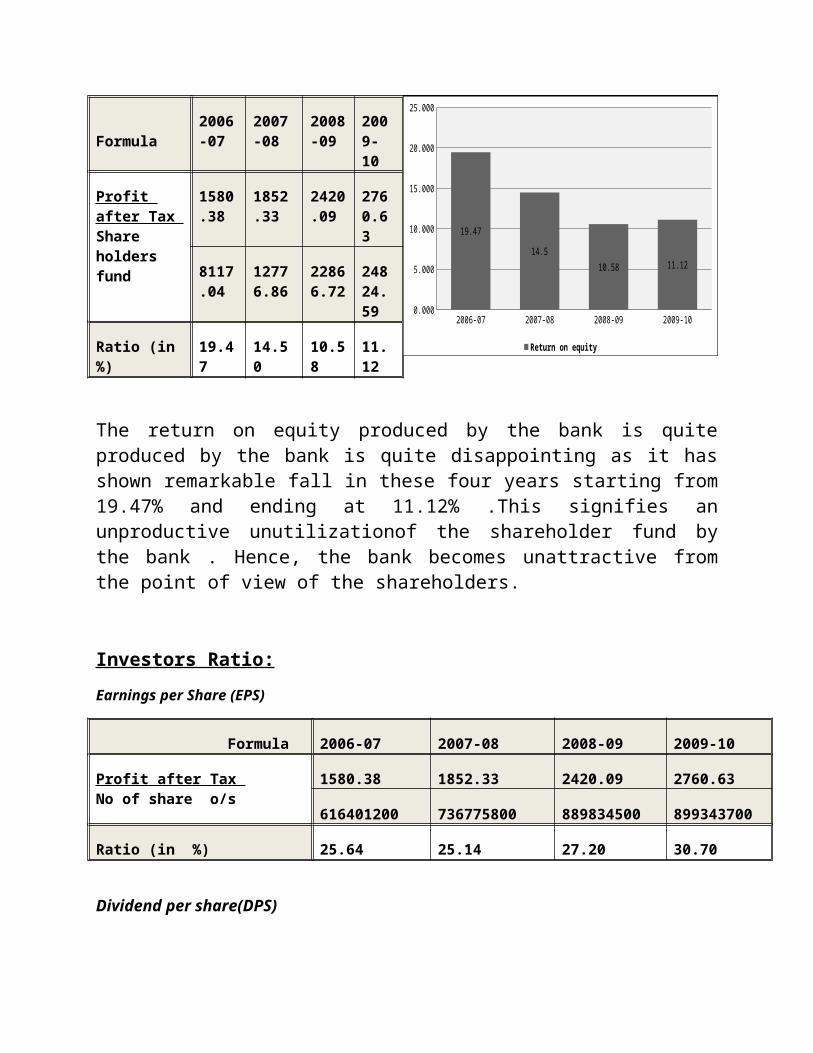
Just like dividend payout ratio, the dividend yield to the investors with respect to the prevailing price of share in the market has declined. The reason behind may be seen as the rise in the market price of the shares of the company at the rate of more than 45% during the period .
Book value per share
Formula 2005-06 2006-07 2007-08 2008-09 2009-10 Shareholder fund No of share o/s
2693.33 4520.28 5299.60 6498.98 11572.07
284791713 309875308 313142408 319389608 354432920
Ratio 94.57 145.87 169.24 203.48 326.50
Book value of the shares has been constantly increasing and reached to an extraordinary height because of the constant rise in the shareholders fund which is mainly energized by the rising reserve and surplus of the company
Price earnings Ratio
Formula 2005-06 2006-07 2007-08 2008-09 2009-10
Market price of Share Earning per Share
3780.35 544.25 773.5 949.4 1319.95
17.89 21.48 28.15 36.04 45.00
Ratio 21.15 25.34 27.48 26.34 29.33
2005-06 2006-07 2007-08 2008-09 2009-100.000
0.100
0.200
0.300
0.400
0.500
0.600
0.700
0.800
0.900
0.79 0.59 0.58 0.57 0.48
Dividend Yield
2005-06 2006-07 2007-08 2008-09 2009-100.000
50.000
100.000
150.000
200.000
250.000
300.000
350.000
Book value per share

Price earnings ratio of the company has improved year on year because the rise in the market price of the share of the company has been matched by the rise in the earning per share of the company.Market price to book value ratio
Formula 2005-06 2006-07
Market price of Share Book value per share
378.35 544.25
94.57 145.87
Ratio 4.00 3.73
Market value to book value ratio of the company shows that initially market price was growing at a lower rate with respect to the book value. But later it started rising at a higher rate due to higher popularity amongst the investors.Market capitalization
Formula 2005-06 2006-07 2007-08 2008-09 2009-10
Market price of Share X No of share O/s
10775.09
16864.96 24221.57
30322.85 46783.37
Market capitalization of the company has been growing which is also clear from the growth in the market price of the share.
2005-06 2006-07 2007-08 2008-09 2009-100.000
5.000
10.000
15.000
20.000
25.000
30.000
35.000
Price Earning ratio
2005-06 2006-07 2007-08 2008-09 2009-100
0.5
1
1.5
2
2.5
3
3.5
4
4.5
5
MP to BV Ratio
2005-06
2006-07
2007-08
2008-09
2009-10
0. 5,000. 10,000. 15,000. 20,000. 25,000. 30,000. 35,000. 40,000. 45,000. 50,000.
Market Captilization
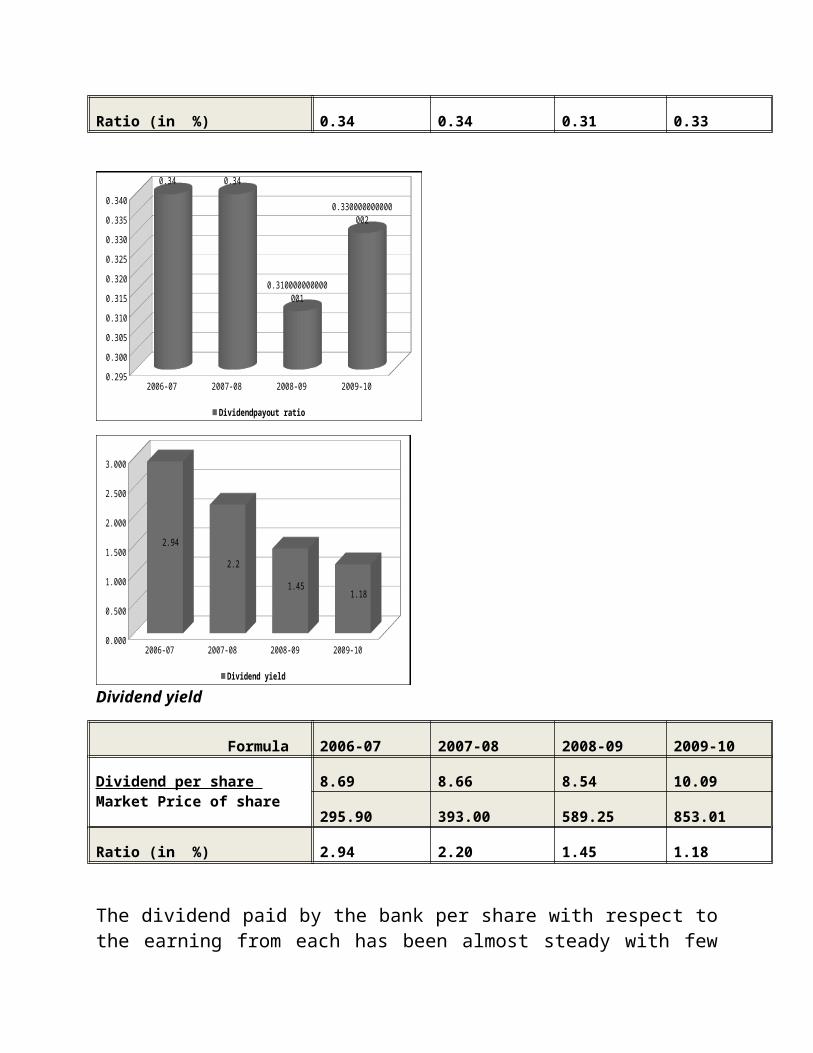
Trend Analysis
Figure in crore
Summarized consolidated Balance Sheet
Capital and Liabilities 2005-06 2006-07 2007-08 2008-09 2009-10
Capital 284.79 309.88 313.14 319.39 354.43
Growth (%) 100.00 108.81 109.95 112.15 124.45
Reserve and Surplus 2407.09 4209.97 5014.10 6150.98 11180.72
Growth (%) 100.00 174.90 208.31 255.54 464.49
Deposits 30408.80 36354.25 55747.14 68264.27 100631.38
Growth (%) 100.00 119.55 183.33 224.49 330.93
Borrowings 2307.82 4790.01 2858.48 2815.39 4478.86
Growth (%) 100.00 207.56 123.86 121.99 194.07
Assets 2005-06 2006-07 2007-08 2008-09 2009-10
Cash n Balance with RBI 2541.98 2 560.13 3306.61 5075.25 12553.18
Growth (%) 100.00 104.25 130.08 199.66 493.83
Investment 19363.46 19349.81 28390.67 30567.04 49288.01
Growth (%) 100.00 99.93 146.62 157.86 254.54
Advance 17744.51 25566.30 35062.30 46944.78 63426.90
Growth (%) 100.00 144.08 197.60 264.56 357.45
Fixed assets 616.91 708.32 871.46 987.53 1196.29
Growth (%) 100.00 114.82 141.26 160.08 193.92
Other assets 1031.23 1330.57 2334.52 3735.47 4453.89
Growth (%) 100.00 129.03 226.38 362.23 431.90
Conclusion:
After analyzing the overall performance of the company and its consolidated account, it is concluded that:
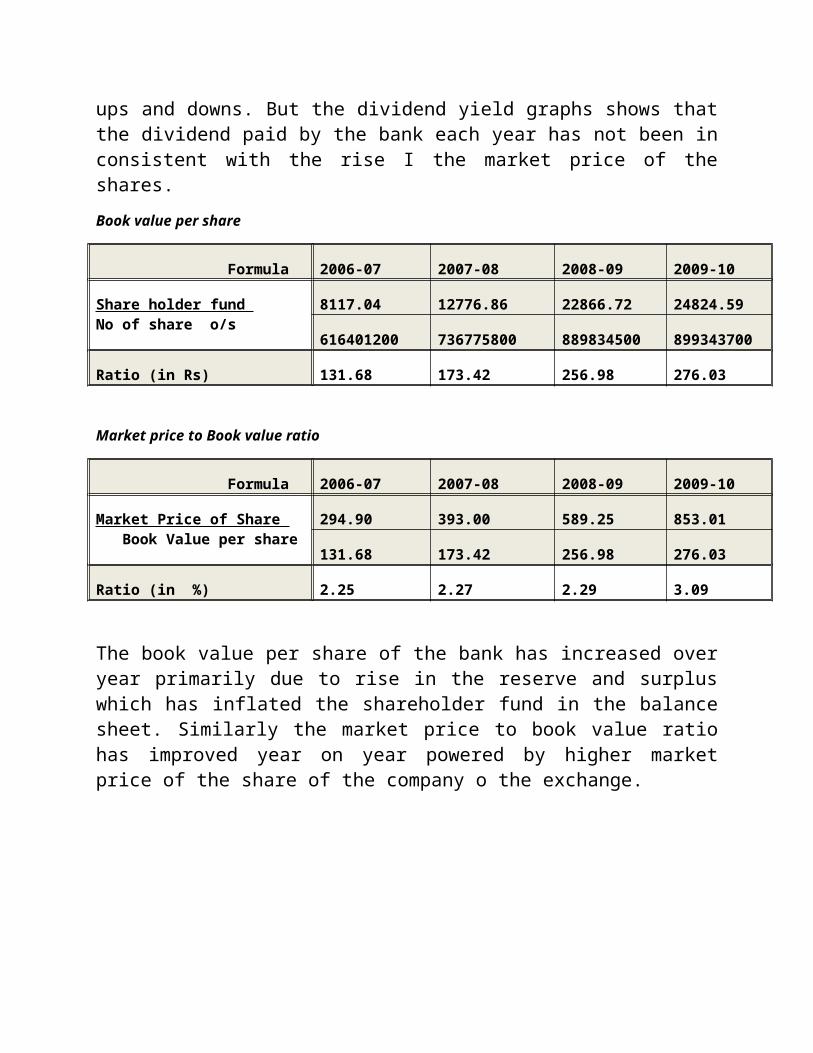
The company has added huge amount to the reserve and surplus during period making it Approximately 5 times the one in the starting year. this has improved the book value of the share of the company but depressed the return on equity and capital employed .
Although the advances of the company has grown almost at the same pace as the deposited , the company needs to improved the ratio of advance to deposits keeping in mind the objective of minimizing the non performing advances .
It is good that the company, although doubled its borrowings initially, but was able to control it later. Still it is twice as that in the beginning of the period and hence need attention.
The asset of the bank in the form of cash and balance with RBI has grown to about five times as that in the first year under consideration. This has improved the liquidity position of the company to some extent.
Other assets of the company has shown unprecedented growth of more than 400% mainly due to rise in interest accrued and deferred tax asset.
Figures in Crores
Summarized consolidated Income statement
Particular 2005-06 2006-07 2007-08 2008-09 2009-10
Interest earned 2548.93 3093.49 4475.32 6646.15 10117.03
Growth (%) 100.00 121.36 175.58 260.74 396.91
Other income 480.03 651.34 1155.60 1577.28 2375.77
Growth (%) 100.00 135.69 240.73 328.58 494.92
Interest expenses 1211.05 1315.56 1929.18 3179.30 4887.37
Growth (%) 100.00 108.63 159.30 262.52 403.56
Operating expenses 810.00 1085.40 1714.79 2473.97 3826.36
Growth (%) 100.00 134.00 211.70 305.43 472.39
Net profit 509.50 665.56 881.56 1150.96 1595.07
Growth (%) 100.00 130.63 173.02 225.90 313.07
Although the operating cost of the company has increased at the rate of 472% in these five years due to rise in salary expenses and provisions to the employees, marketing expenses etc, the company has managed to earn profit at the growth rate of 313% .the profit has been exaggerated by he income earned the company from exchange transaction and sales and revaluation of investments.
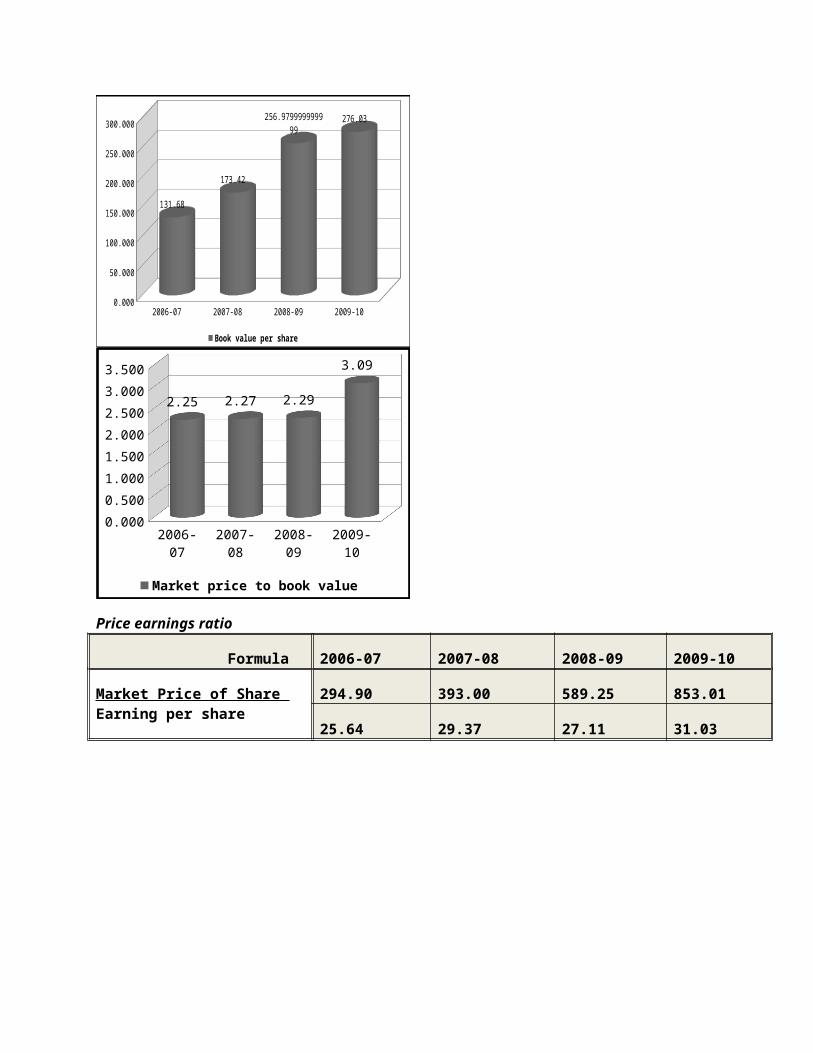
Introduction
The Industrial Development Bank of India Limited, popularly known as IDBI Bank is one of the leading public sector banks in India. Categorized as "other public sector bank" by Reserve Bank of India (RBI), IDBI Bank is also the 4th largest Indian bank. Founded in 1964 to provide credit and other facilities to its customers, IDBI Bank currently has 457 centers, 688 branches and 1020 ATMs across the nation. It is world's 10th largest development bank in terms of reach. IDBI Bank also built several institutions including the National Stock Exchange of India (NSE), the Stock Holding Corporation of India (SHCIL) and the National Securities Depository Services Ltd. (NSDL) etc.
Business overview
Strategic initiatives implemented during the year,benefited your Bank immensely, reflecting improvedperformance in various key business areas. Your Bankattained new heights with total business of Rs.2,15,829crore at end-March 2009, comprising Rs. 1,12,401 croreof deposits and Rs.1,03,428 crore of advances. Total assetsreached Rs.1,72,402crore, registering a growth of 31.9%during the financial year..
During the financial year April 2008-March 2009, grossincome of your Bank amounted to Rs.13,021.6crore,contributed by interest income of Rs.11,631.7 crore andother income of Rs.1,389.9 crore. Total expenditure ofyour Bank, during the year, excluding provisions andcontingencies, stood at Rs.11,643.7crore, consistingRs.10,305.8 crore of interest expenses and Rs.1,337.9crore of operational expenses. With the provision of Rs.373.3 crore towards bad & doubtful debts andinvestments, Rs.19 crore towards incremental prudentialprovisions for standard assets, and Rs.127.1 crore towardstax, total provisions during the period amounted toRs.519.4 crore.Your Bank’s working during the year resulted in a ProfitBefore Tax (PBT) of Rs.985.6 crore. Considering a provisionof Rs.127.1 crore towards taxation, Profit After Tax (PAT)amounted to Rs.858.5 croreFor each share with face value of Rs.10, Earning Per Share(EPS) during the year stood at Rs.11.9 and Book ValuePer Share stood at Rs.102.3 as at end-March 2009.
VisionOur vision for the Bank is for it to be the trusted partner in progress, by leveraging quality human capital and setting global standards of excellence, to build the most valued financial conglomerate. Our experience of financial markets helps us to
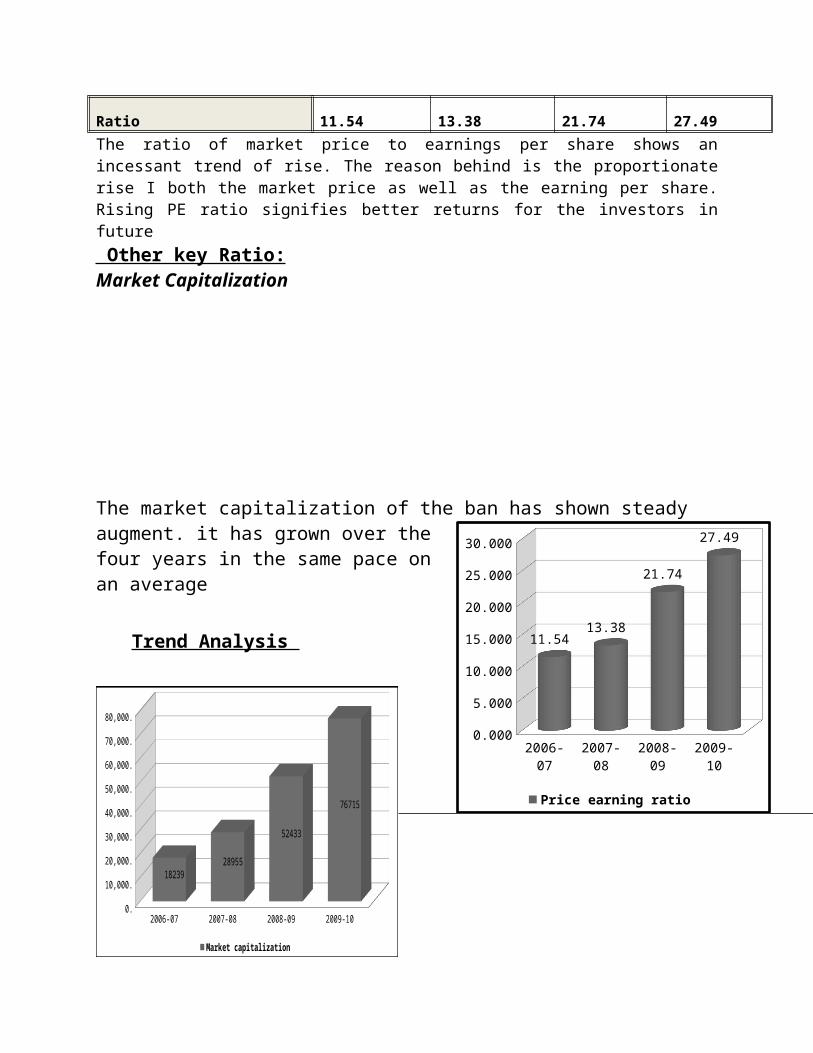
effectively cope with challenges and capitalize on the emerging opportunities by participating effectively in our country’s growth process.
Products and Services
IDBI Bank offers a wide array of products and services to its customers. For different customer groups and needs, there are different types of products and services including Personal Banking, Corporate Banking, SME Finance and Agri Business etc.
Personal Banking
Following products and services are offered under Personal Banking:
Deposits o Savings Account o Current Account o Fixed Deposits o Suvidha Tax Saving Fixed
Deposit o Pension Accounts o Sabka Account o Super Shakti Account for
Women o Jubilee Plus Account
Loans o Home Loans o Loans Against Property o Education Loans o Personal Loan o Loan Against Securities o Reverse Mortgage Loan o Auto Loan
Payments o Tax Payments o Stamp Duty payments o EasyFillo Bill Payment o Card to Card Money Transfer o Online Payments o PayMate
Investments Advisory o Smart Financial Planning
o Mutual Fund o Insurance o Fixed Income Securities
Cards o Gold Debit Card o International Debit cum
ATM Card o Gift Card o World Currency Card o Cash Card o KIDS Debit Card o Foundation Day Cash Back
Scheme 2009 o Platinum Card
Institutional Banking o Institutional Savings Account o Corporate Payroll Account
24 Hours Banking o Phone Banking o SMS Banking o AccountAlertso Internet Banking
Other products o Lockers o India Post
Preferred Banking NRI Services Capital Market
o IPO o Demat
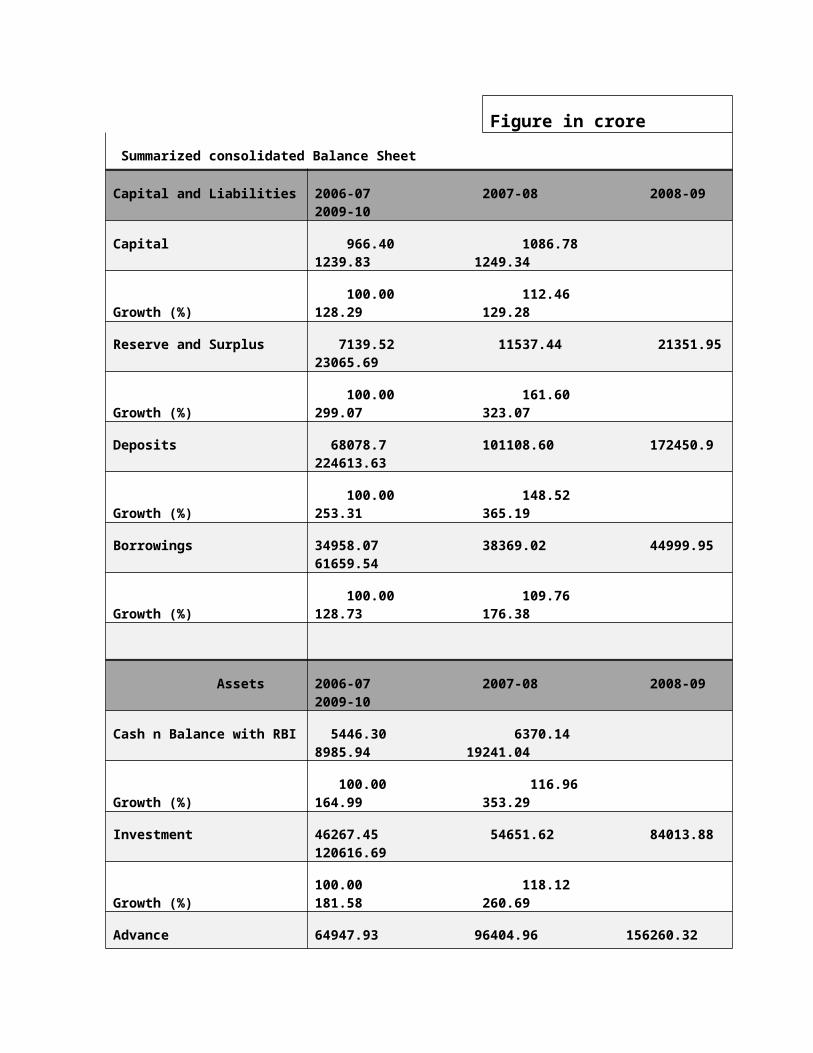
Corporate Banking
Following products and services are offered by IDBI Bank for the corporates:
Project Finance Infrastructure Finance Syndication, Underwriting & Advisory Services Carbon Credits Business Working Capital Cash Management Services Trade Finance Tax Payments Derivatives Technology Upgradation Fund Scheme (TUFS) Film Financing Scheme Direct Discounting Bills Rehabilitation Finance
SME Finance
Following SME Finance products are offered by the IDBI Bank:
SulabhVyapar Loan Dealer Finance Funding under CGFMSE Direct Credit Scheme - SIDBI Preferred customer scheme - IDBI Bank / SIDBI Vendor financing (Pre - Sale) Vendor financing (Post - Sale) Lending Against the Security of Future Credit Card Receivables Working Capital Financing - Software Development Entities Finance to Medical Practitioners Loan to SRWTO SME Hosiery Special Current Account
Listed in Stock exchange
The Bombay Stock Exchange Ltd. (BSE) and The National Stock Exchange of India Ltd. (NSE)
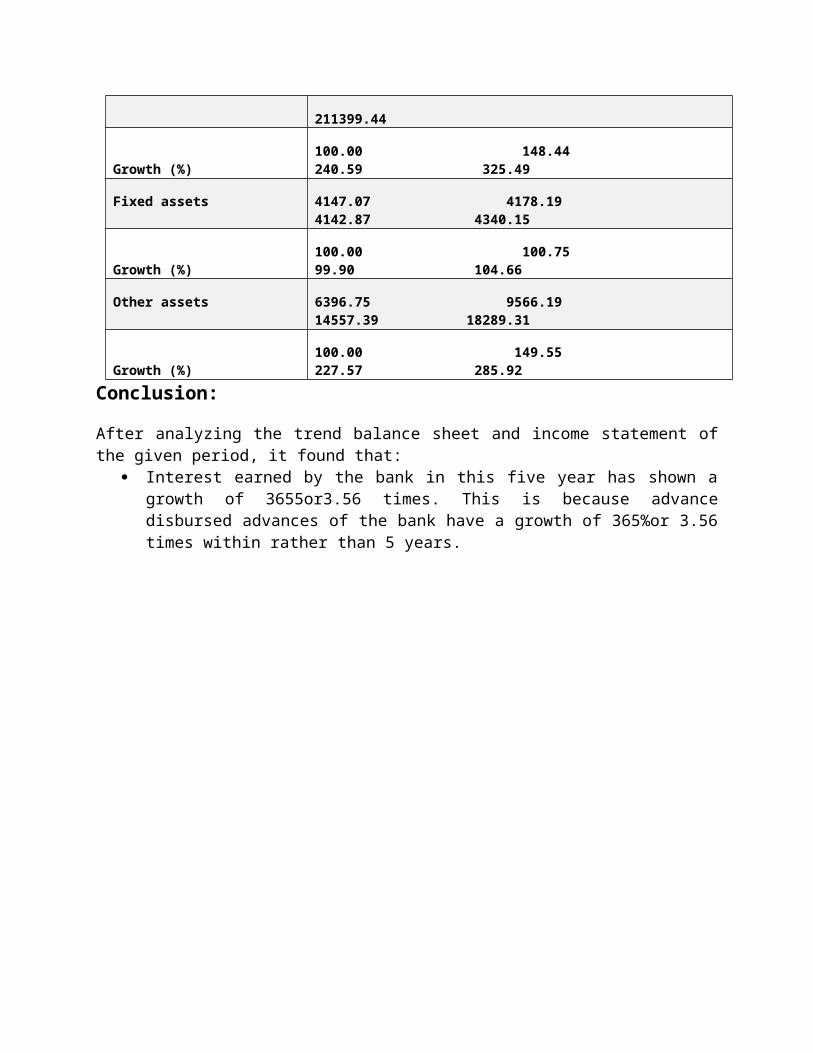
Subsidiaries
IBDI Bank has the following subsidiaries:
IDBI Capital Market Services Limited IDBI Home Finance Limited IDBI Intech Limited IDBI Gilts Limited
Shareholding Pattern
Category of Shareholders No. of Shares Held
% to Total
Government of India 381778000 52.68 Employees 1655148 0.23 Public 112813766 15.57 Hindu Undivided Family 2882941 0.40 Bodies corporate 32950067 4.55 Institutions (viz. Banks, FIIs, SFCs, FIs, Mutual Funds & OCBs)
125458883 17.30
Societies 28960 0.00 Trusts 465938 0.06 Insurance Companies 60641585 8.37 NRI’s 5374409 0.74 Directors & Relatives 20440 0.00 NSDL (transit) 711287 0.10
GRAND TOTAL 724781424 100.00
Network
IDBI Bank currently has 457 centers, 688 branches and 1020 ATMs across the nation. Comprising 179 metropolitanbranches, 175 urban branches, 100 semi urban branchesAnd 55 rural branches.It is world's 10th largest development bank in terms of reach.
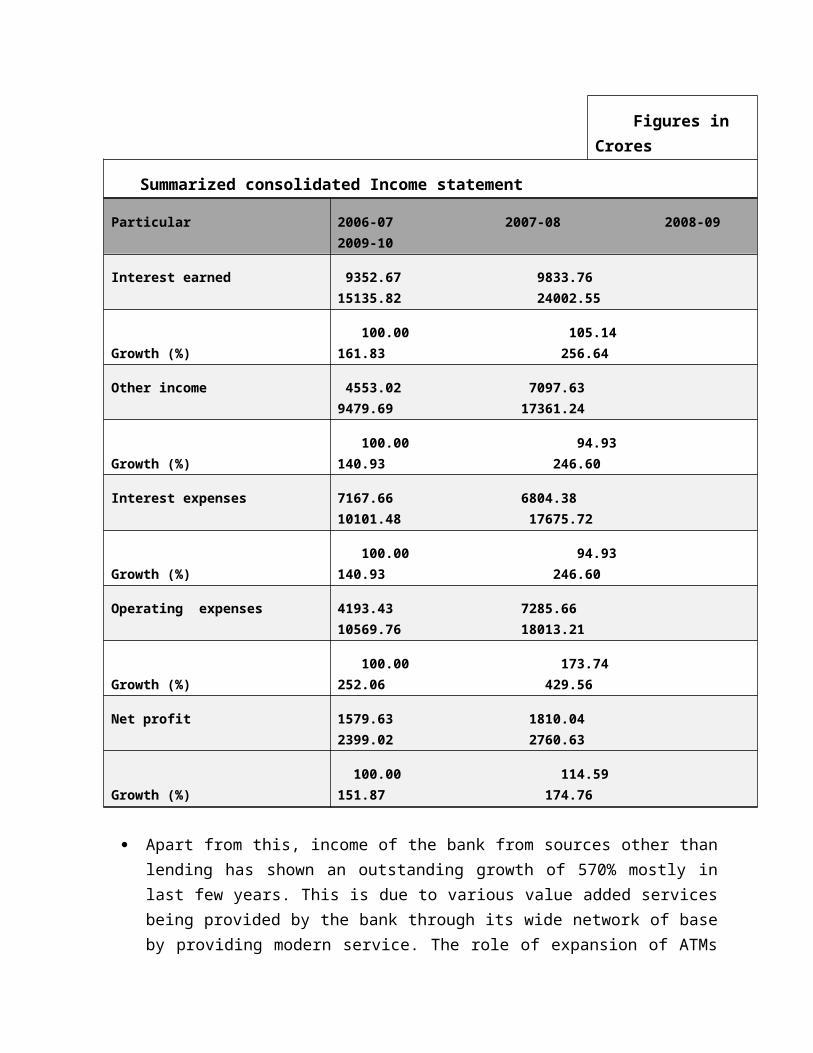
Financial overview
Ratio Analysis
Liquidity Ratio:
Absolute liquidity Ratio
Formula 2007-08 2008-09 2009-10
Cash and near cash Current Liabilities
5689.65 5551.98 7328.20
21374.84 30401.78 47370.66 Ratio 0.266 0.183 0.155
The liquidity of the company as determined by its absolute liquidity ratio has deteriorated each year. The company has experienced a decline in first interval because of fall in balances with and money at call and short notice, while the decline in second interval has been due to excessive rise in current liabilities.
2007-08 2008-09 2009-100
0.05
0.1
0.15
0.2
0.25
Absolute Liquidity Ratio
Debt Equity Ratio
Formula 2007-08 2008-09 2009-10
Long Term DebtShareholder fund
55068.76 52839.97 49576.35
6238.33 6659.89 8526.75 Ratio 8.827 7.934 5.814
The two turnover ratio of the company show different attributes. While debt equity ratio has undergone constant fall during the period, the proprietary ratio has shown a mixed behavior. Debt equity ratio has continuously fallen down due to constant fall in long term debt. On the other hand, proprietary ratio has ended at a high fraction because of rise in the shareholders fund. The movements of both of these ratios reveal that the company is looking onwards decreasing the debt and using the ratio reveal that the company is looking towards decreasing the debt and using the share market to raise funds.
2007-08 2008-09 2009-100
1
2
3
4
5
6
7
8
9
Debt Equity Ratio
Proprietary ratio:
Formula 2007-08 2008-09 2009-10
Shareholder Fund Total Assets
6238.33 6659.89 8526.75
82999.44 90302.24 105940.49 Ratio 0.075 0.074 0.080
Turnover Ratio:
Total assets turnover ratio
Formula 2007-08 2008-09 2009-10
Total sales Total Assets
3345.34 6786.18 7346.23
82999.44 90302.24 105940.49 Ratio 0.040 0.075 0.069
Fixed asset Turnover ratio
Formula 2007-08 2008-09 2009-10
Total sales Fixed assets
3345.34 6786.18 7346.23
914.17 838.53 2803.13
Ratio 3.659 8.093 2.621
2007-08 2008-09 2009-100.07
0.072
0.074
0.076
0.078
0.08
0.082
0.075
0.074
0.08
Proprietary ratio
The ratio for turnover of the company over fixed and total assets had initially increased for the first year as a result of progress in the sales which has more than doubled itself. But in FY 09, both have shown a fall because of insufficient y-o-y growth in sales.
2007-08 2008-09 2009-100
0.01
0.02
0.03
0.04
0.05
0.06
0.07
0.08
Total assets Turnoveer ratio
Profitability Ratio
Return on capital EmployedFormula 2007-08 2008-09 2009-10
Profit after taxCapital employed
318.57 543.92 588.31
61307.09 59499.86 58103.10
Ratio 2.43 5.06 6.36
The return on capital employed by the company has been growing since the beginning till the end of the period. This is because the company has constantly improved its profit
after tax while at the same time has decreased the capital employed by it, especially in th3e form off borrowings.
Return on total Assets
Formula 2007-08
Profit after tax Total Assets
318.57
82999.442007-08 2008-09 2009-100
1
2
3
4
5
6
7
Return on Capital Employed
2007-08 2008-09 2009-100
1
2
3
4
5
6
7
8
9
3.659
8.093
2.621
Fixed assets Turnover Ratio
Ratio 0.38 0.60 0.56
2007-08 2008-09 2009-100
1
2
3
4
5
6
7
8
9
5.11
8.176.9
Return on Equity
Return on equity
Formula 2007-08 2008-09 2009-10
Profit after taxShareholder fund
318.57 543.92 588.31
6238.33 6659.89 8526.75 Ratio 5.11 8.17 6.90
After looking into the graph of ROTA and ROE of the company, we will find that both of these have been common in their ups and down during the period. The variation between the two has been similar because the rate of growth in Share holder fund and total assets is almost same.
Earning per share Formula 2007-08 2008-09 2009-10
Profit after taxNo of share O/S
318.57 543.92 588.31
652880406 723794603 724354088
Ratio 4.88 7.15 8.12
2007-08 2008-09 2009-100
100
200
300
400
500
600
Return on total assets
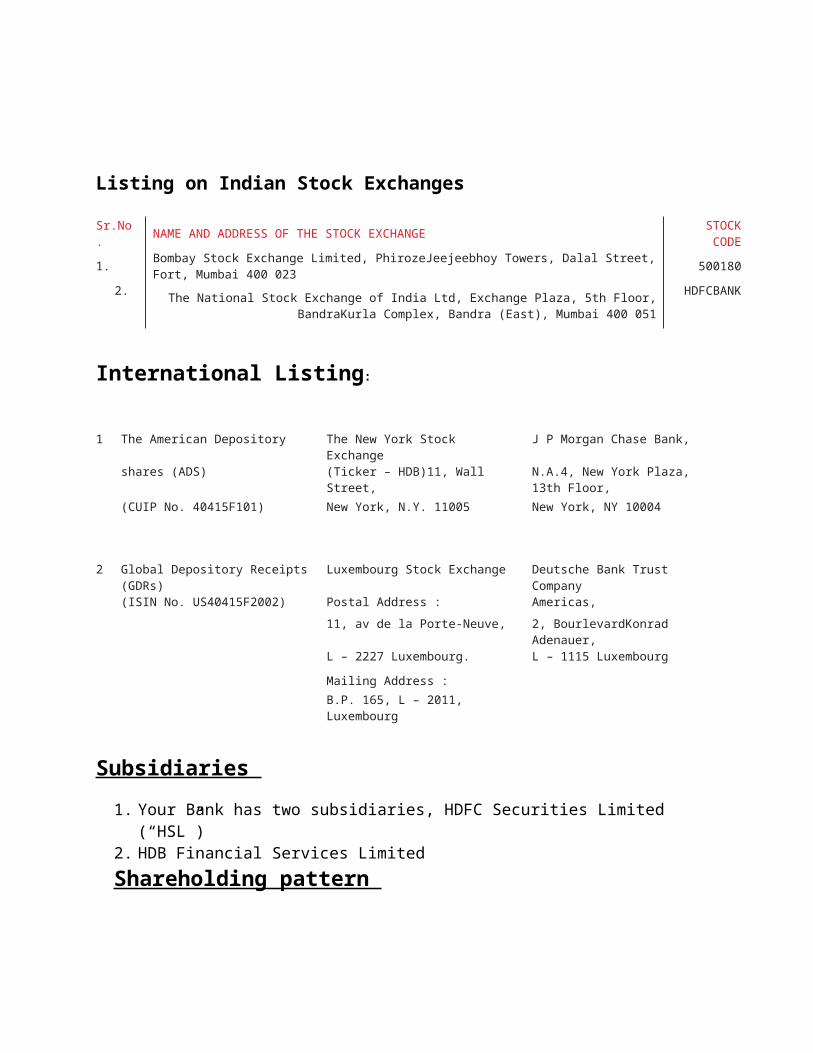
The earnings per share of the company have shown a y-o-y improvement as the profit of the company has grown remarkable after FY 08 increasing the earnings per share. Similarly, the dividend paid by the company has also improved in commensurate with the earning of the company. The graph for DPS in FY 08 is zero because the company hadn’t paid any dividend .
2007-08 2008-09 2009-100
1
2
3
4
5
6
7
8
9
Earning per Share
Dividend per Share
Formula 2007-08 2008-09 2009-10
Dividend Paid No of share O/S
NIL 83.91 124.84
652880406 723794603 724354088 Ratio 0.00 1.16 1.72
Dividend Payout Ratio
Formula 2007-08 2008-09 2009-10
Dividend per shareEarning per share
0 1.16 1.72
4.88 7.15 8.12 Ratio 0.00 0.15 0.21
Dividend yield As seen earlier , dividend paid by the company to its net earning has also improved .As such , the ratio of dividend paid by the company to its net earning has also improved .Similar is the case with yield of dividend to the shareholders with respect to the price of the share in the market . The graph for dividend yield resembles the one for dividend payout ratio.
2007-08 2008-09 2009-100
0.2
0.4
0.6
0.8
1
1.2
1.4
1.6
1.8
Dividend per Share
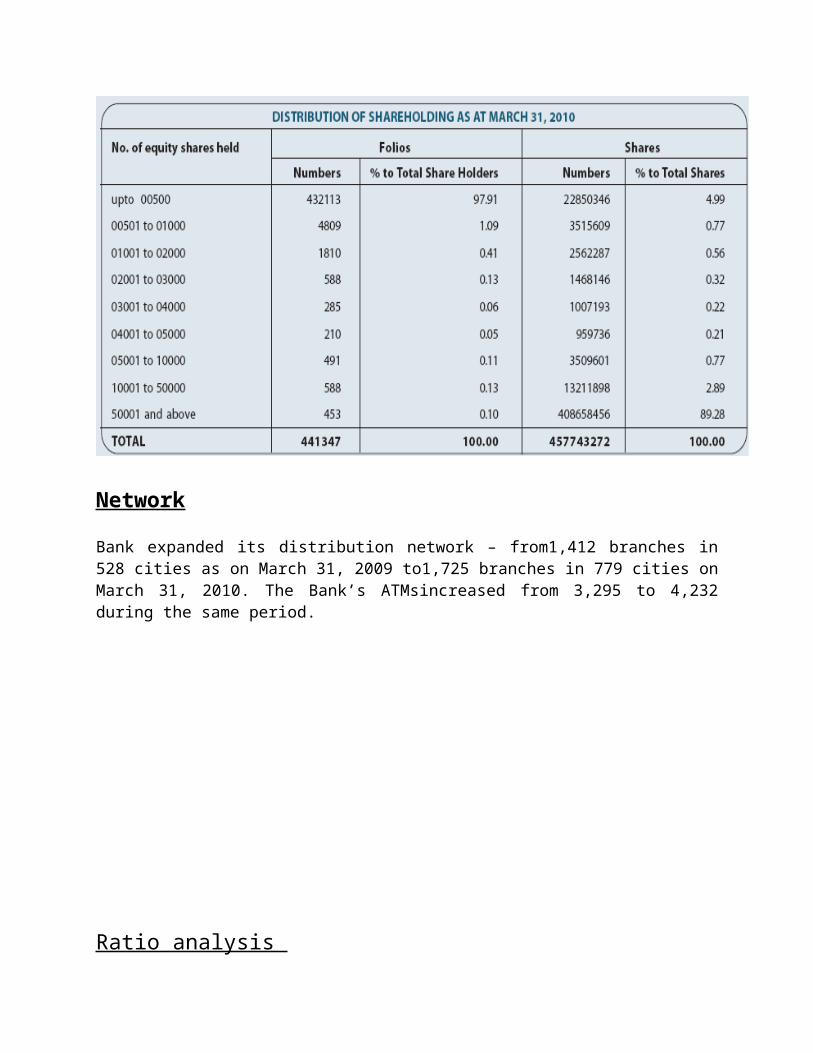
Formula 2007-08 2008-09 2009-10
Dividend per shareMarket Price of share
0 1.16 1.72
91.15 78.30 77.55 Ratio 0.00 1.48 2.22
Book value per share
Formula 2007-08 2008-09 2009-10
Share holder Fund No of share O/S
6238.33 6659.89 8526.75
652880406 723794603 724354088 Ratio 95.55 92.01 117.72
Book value per share of the company has initially increased in the last year in the period under consideration because of high growth in shareholders fund on account of augmentation fund in the reserve and surplus by the company. The fall seen I the first interval is due to insufficient growth in shareholders fund.
Price earnings ratio
2007-08 2008-09 2009-100
20
40
60
80
100
120
BV Per Share
2007-08 2008-09 2009-100
0.05
0.1
0.15
0.2
0.25
Dividend Payout Ratio
2007-08 2008-09 2009-10
0
1.48
2.22
Dividend Yield
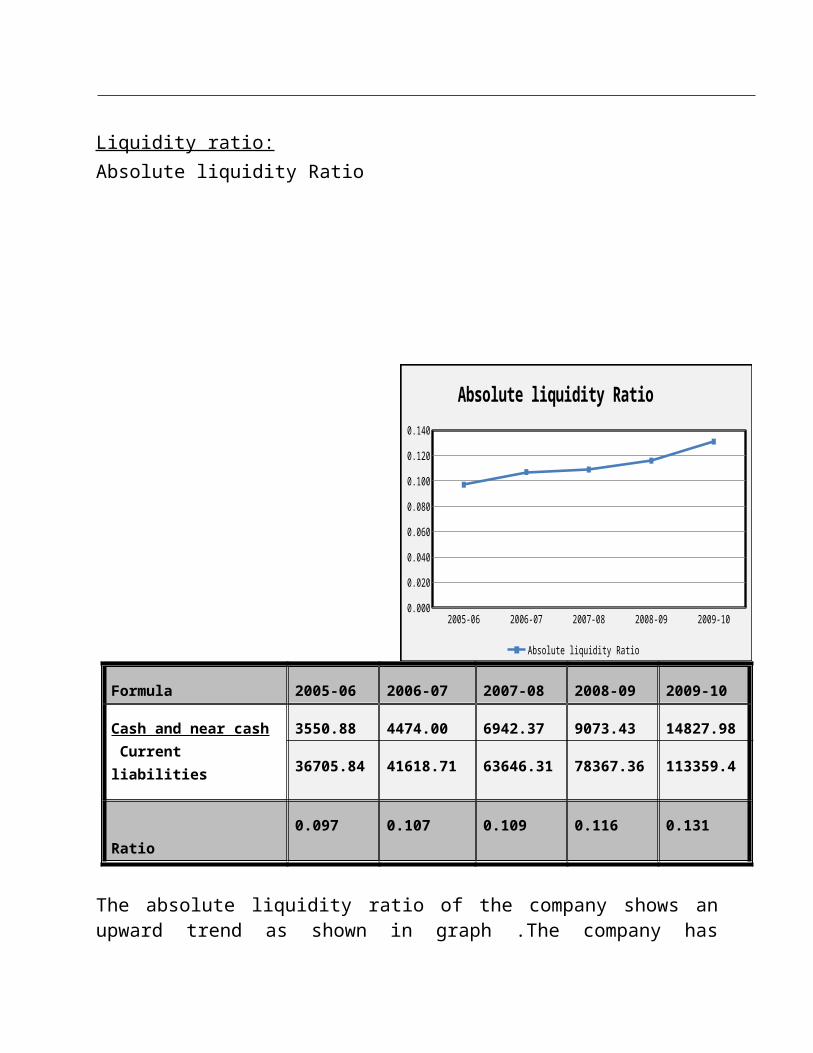
Formula 2007-08 2008-09 2009-10
Market Price of share Earning per share
91.15 78.30 77.55
4.88 7.15 8.12 Ratio 18.68 10.43 9.55
Market price to Book value per share
Formula 2007-08 2008-09
Market Price of share Book value Per Share
91.15 78.30
95.55 92.01 Ratio 0.95 0.85
The company has undergone a fall in its PE ratio. The fall signifies that the trust of shareholder /investors in the company has tainted. The market price to book value ratio of the company has also undergone a fall during the period conveying the same message as the PE ratio
Market Capitalization Formula 2007-08 2008-09 2009-10
Market price of share XNo .of share outstanding
5951.00 5667.31 5617.37
Since the market price of the share company has deteriorated during the period, its market capitalization has shown the similar reaction. Similarly the enterprise value of the company has declined as added to fall in the market price, the company has strategically decreased its dependence on borrowing which has bought it down.
2007-08 2008-09 2009-100
2
4
6
8
10
12
14
16
18
20
Price Earning Ratio
2007-08 2008-09 2009-100
0.1
0.2
0.3
0.4
0.5
0.6
0.7
0.8
0.9
1
MP to BV Ratio
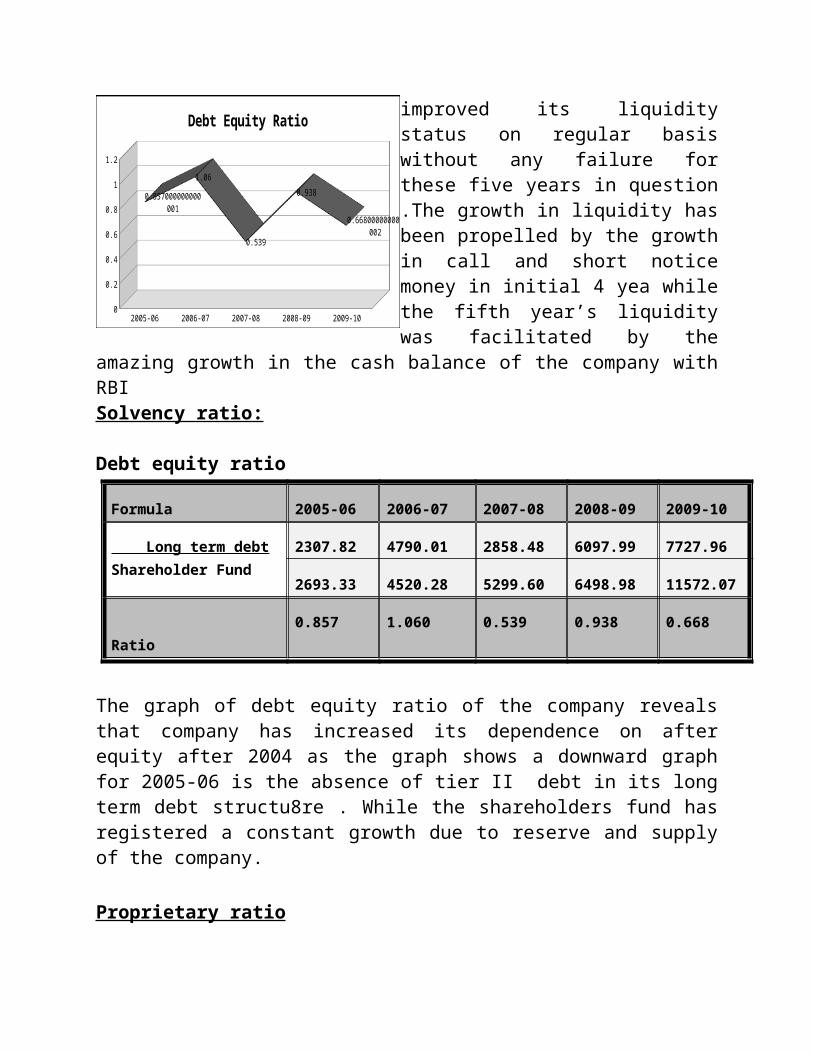
2007-08 2008-09 2009-105400
5500
5600
5700
5800
5900
6000
Market Capitalization
Enterprise value
Formula 2007-08 2008-09 2009-10
Market Capitalization + Long term Debt
61019.76 58507.28 55193.72
Net interest Income Formula 2007-08 2008-09 2009-10
Interest Earned –interest Expended
210.78 428.59 726.07
Net Interest Margin
Formula 2007-08 2008-09 2009-10
Net Interest Income Average earning Assets
210.78 428.59 729.07
76744.65 85128.39 97058.09
Ratio 0.27 0.50 0.75Net interest incomeThe net interest income of the company has gradually increased on account of balance between the increases in interest expended. NIM of the company took a great extent. This is because although the rate of growth in the advance s and deposited are same, the growth in the term of value is different since the base used for it itself is different.
2007-08 2008-09 2009-1052000
53000
54000
55000
56000
57000
58000
59000
60000
61000
62000
Enterprise Value
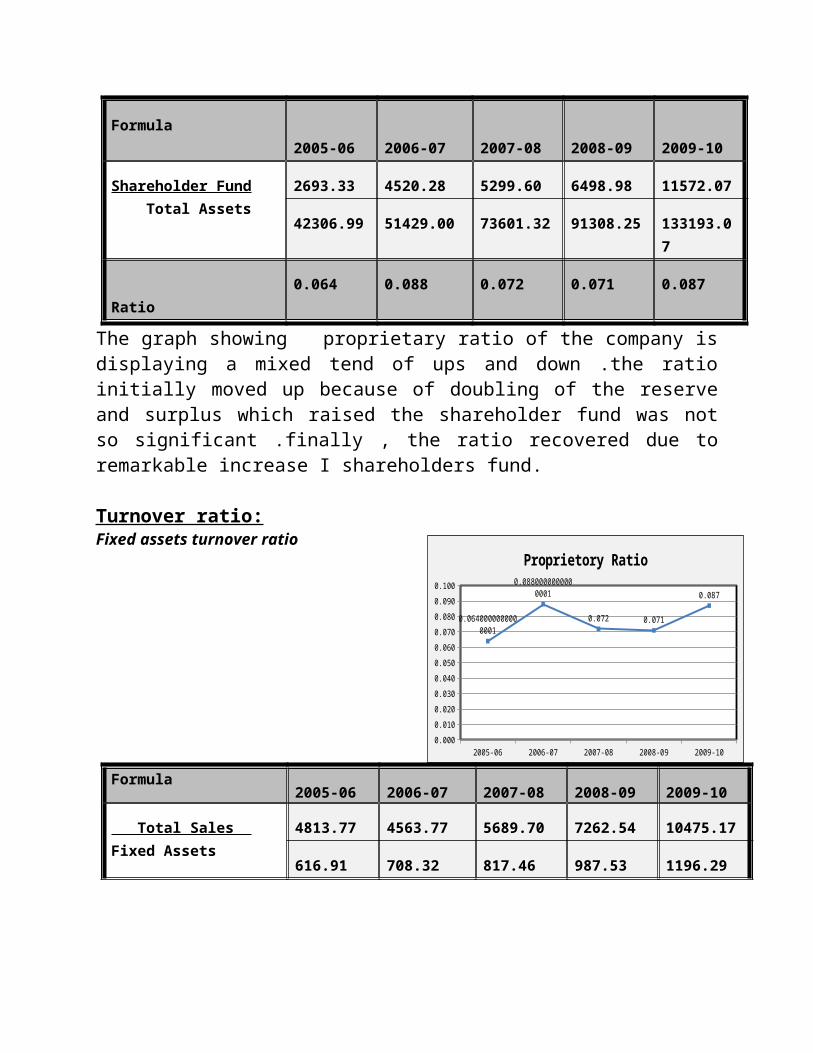
2007-08 2008-09 2009-100
100
200
300
400
500
600
700
800
210.78
428.59
726.07
NII
Figure in crore Summarized consolidated Balance Sheet
Capital and Liabilities 2007-08 2008-09 2009-10 Capital 721.78 723.79 724.35 Growth (%) 100.00 100.28 100.36 Reserve and Surplus 5514.43 5935.21 7802.00 Growth (%) 100.00 107.63 141.48 Deposits 15102.64 25853.91 43305.82
Growth (%) 100.00 171.19 286.74 Borrowings 51190.93 48910.62 44225.64 Growth (%) 100.00 95.55 86.39
Assets 2007-08 2008-09 2009-10 Cash n Balance with RBI 2376.43 2680.10 5405.53 Growth (%) 100.00 112.78 227.46
Investment 24728.11 25472.89 25362.55 Growth (%) 100.00 103.01 102.57 Advance 46326.89 54103.51 64367.34 Growth (%) 100.00 116.79 138.94 Fixed assets 914.17 838.53 2803.13 Growth (%) 100.00 91.73 306.63 Other assets 5340.61 4335.33 6079.25 Growth (%) 100.00 81.18 113.83
2007-08
2008-09
2009-10
0 0.1 0.2 0.3 0.4 0.5 0.6 0.7 0.8
NIM
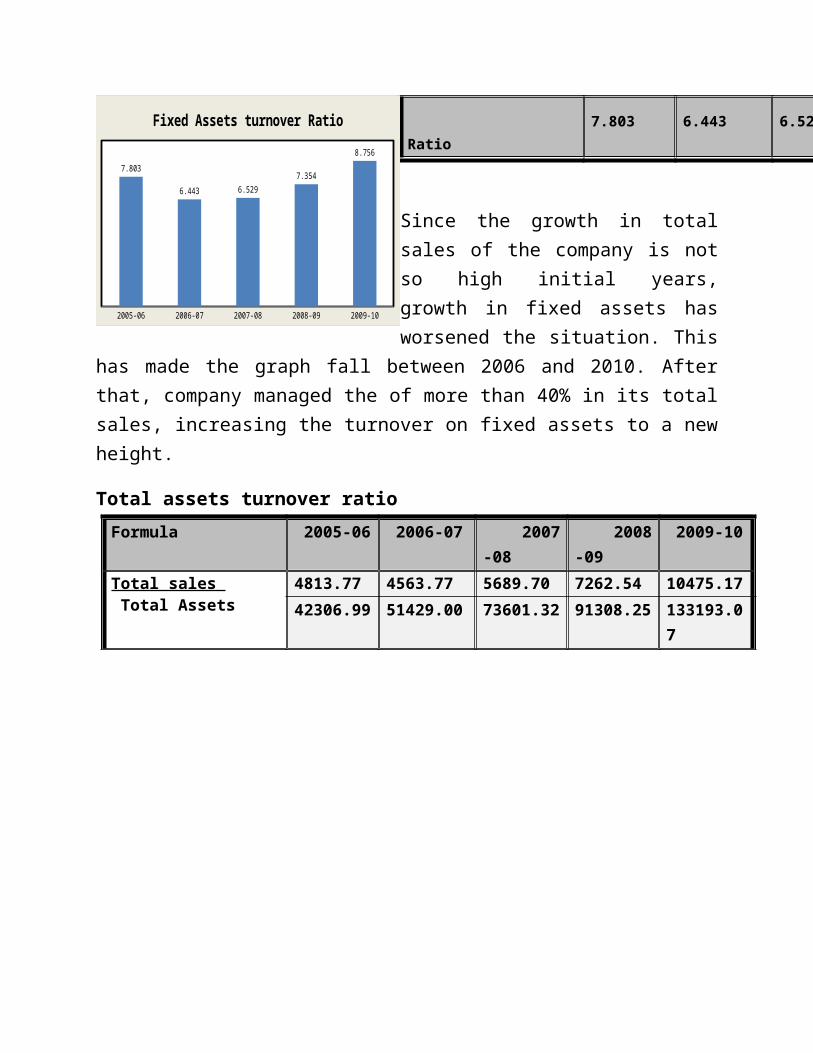
Figures in Crores
Summarized consolidated Income statement
Particular 2007-08 2008-09 2009-10Interest earned 2720.50 5543.65 6556.44 Growth (%) 100.00 203.77 241.00 Other income 631.95 1271.07 960.38 Growth (%) 100.00 201.14 151.97 Interest expenses 2509.73 5115.05 5830.37
Growth (%) 100.00 203.81 151.97Operating expenses 468.75 904.18 813.46 Growth (%) 100.00 192.89 173.54 Net profit 318.57 543.92 588.31 Growth (%) 100.00 170.73 184.67
Conclusion
1. The capital of the company is almost same with minor variation In the starting and the ending year. At the same time, borrowing has reduced during the period. This means that the bank has not raised much fund during the period. This means that the bank has raised much fund during the year as deposited have shown sufficient growth vis a vis other sources.
2. Both, the interest earned and interest expended by the company have grown during the period. But still there is increase in the NII
3. Other income of the company has been high in FY08 on account of sale of investment and exchange transaction. Again in FY 10 , it has reduced on account of decrease in profit on sale of the investment and loss in the revaluation of investment .
4. Operating expenses of the company has decreased for the last year on account of lower payment to the employees and reduction in the amount of depreciation in the least premises.
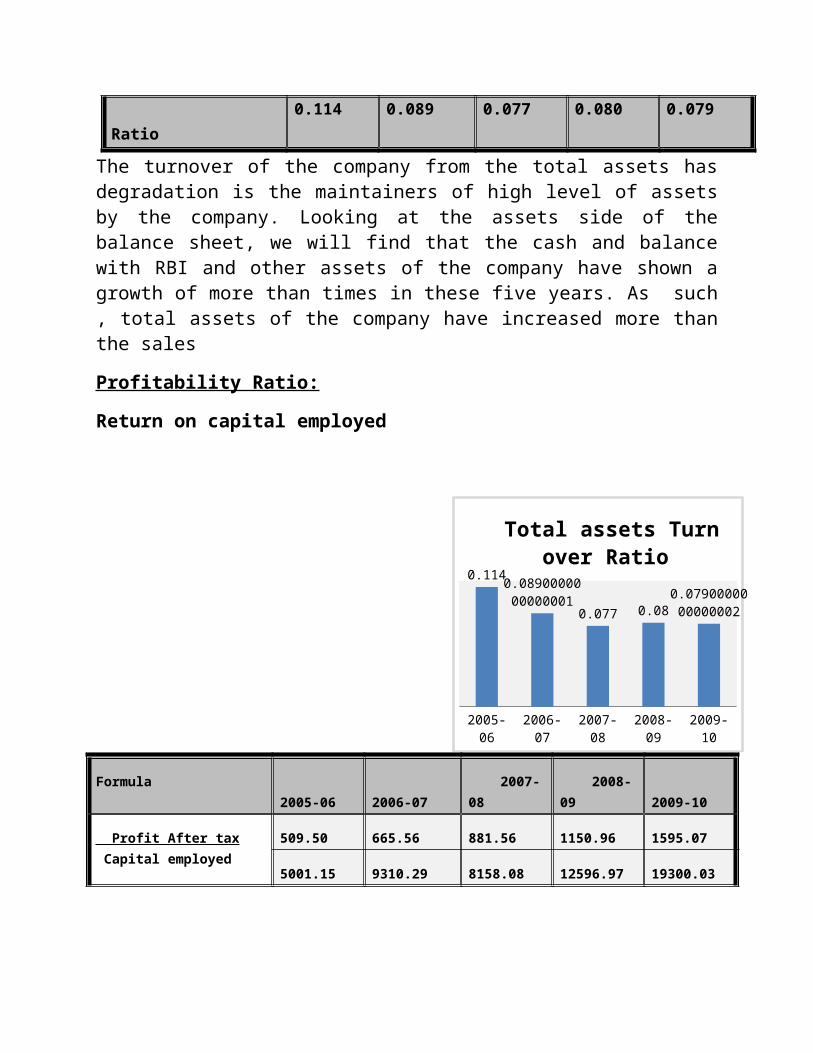
INTER BANK COMPARISON
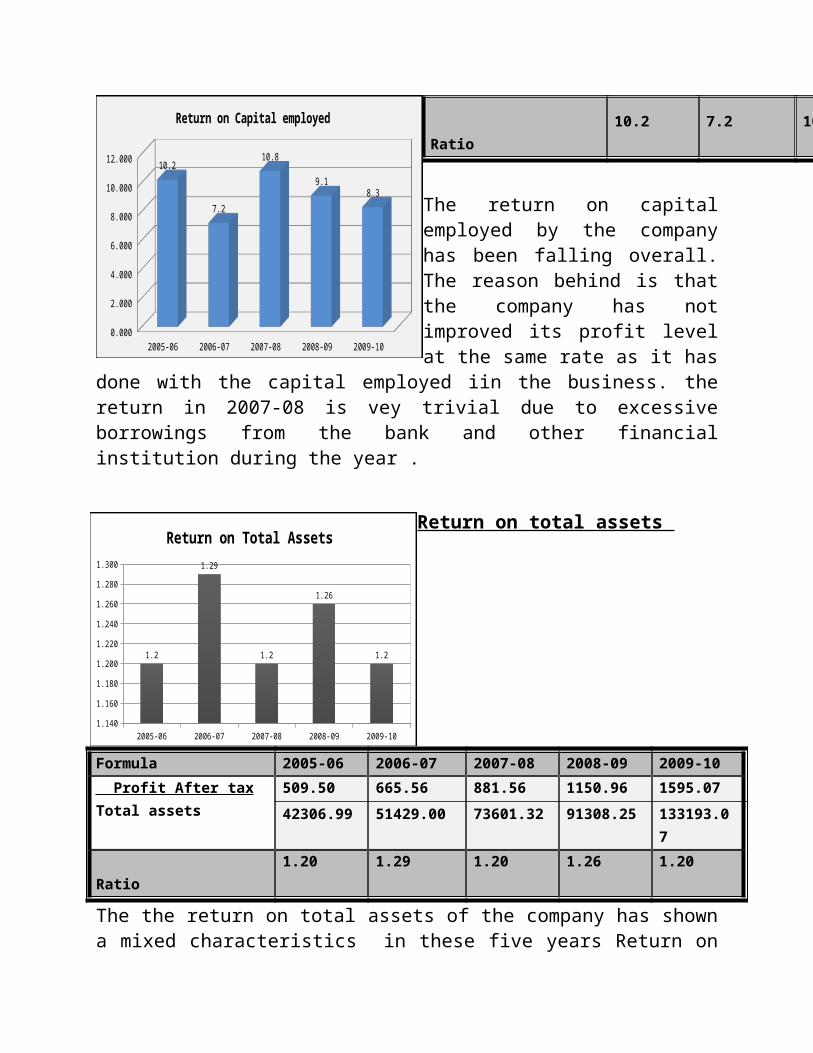
Name of Banks
Authorized capital
ICICI
HDFC
AXIS
INDUSIND
IDBI
1275
550
500
500
1250
Authorized capital: On the basis of authorized capital, it can be said that ICICI and IDBI bank are amongst the five companies .HDFC bank is the third largest while INDUSIND and AXIS bank are fourth position .
ICICI HDFC AXIS INDUSIND IDBI0
200
400
600
800
1000
1200
1400
Authorized capital
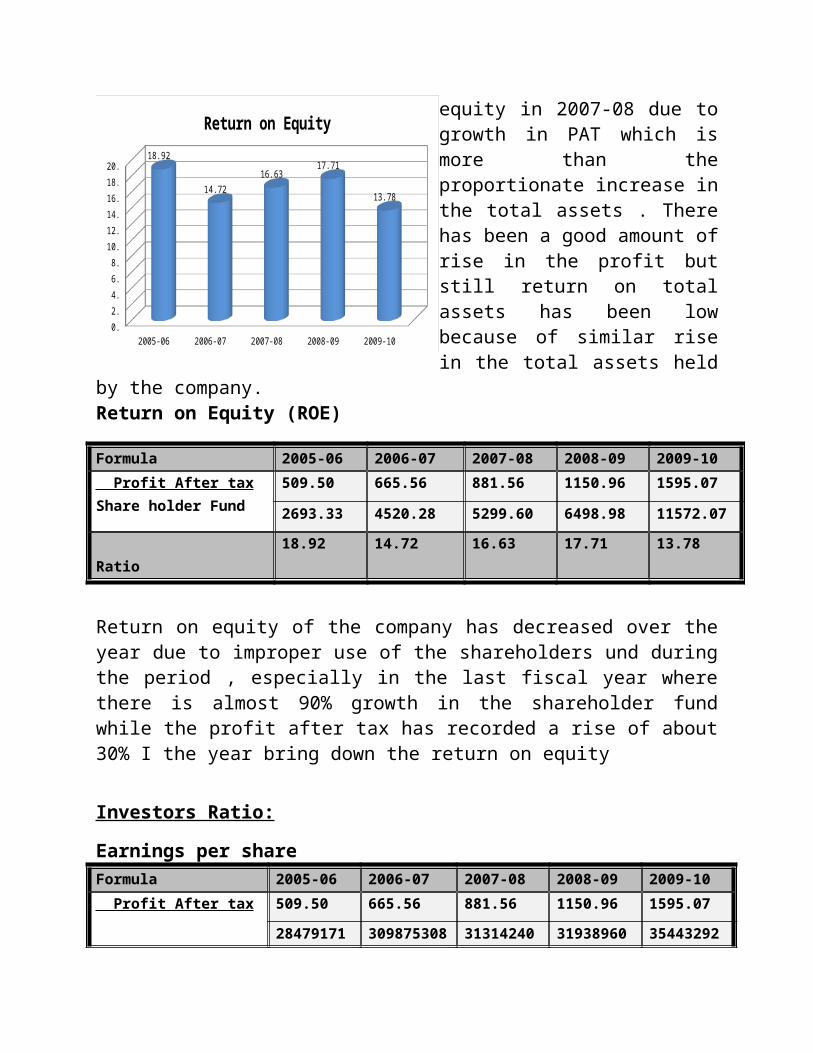
NetworkThe graph for network of the five companies reveals that ICICI Bank has the highest number of ATM while INDUSIND bank has lowest number of branches and ATM. This reveals that for competing with this bank INDUSIND bank has to expand their business frequently by the way of acquisition as ICICI Bank and HDFC bank were doing by acquiring Bank of Rajasthan and centurion bank of Punjab respectively
Name of the Bank ATM Branches
ICICI 5219 2016
HDFC 4232 1725
AXIS 4297 1035
INDUSIND 497 210
IDBI 1020 688
Price Earnings Ratio
FY07 FY08 FY09 FY100
5
10
15
20
25
30
35
Price Earning Ratio
ICICIINDUSINDHDFCAXISIDBI
ATM Branches0
1000
2000
3000
4000
5000
6000
ICICIHDFCAXISINDUSINDIDBI
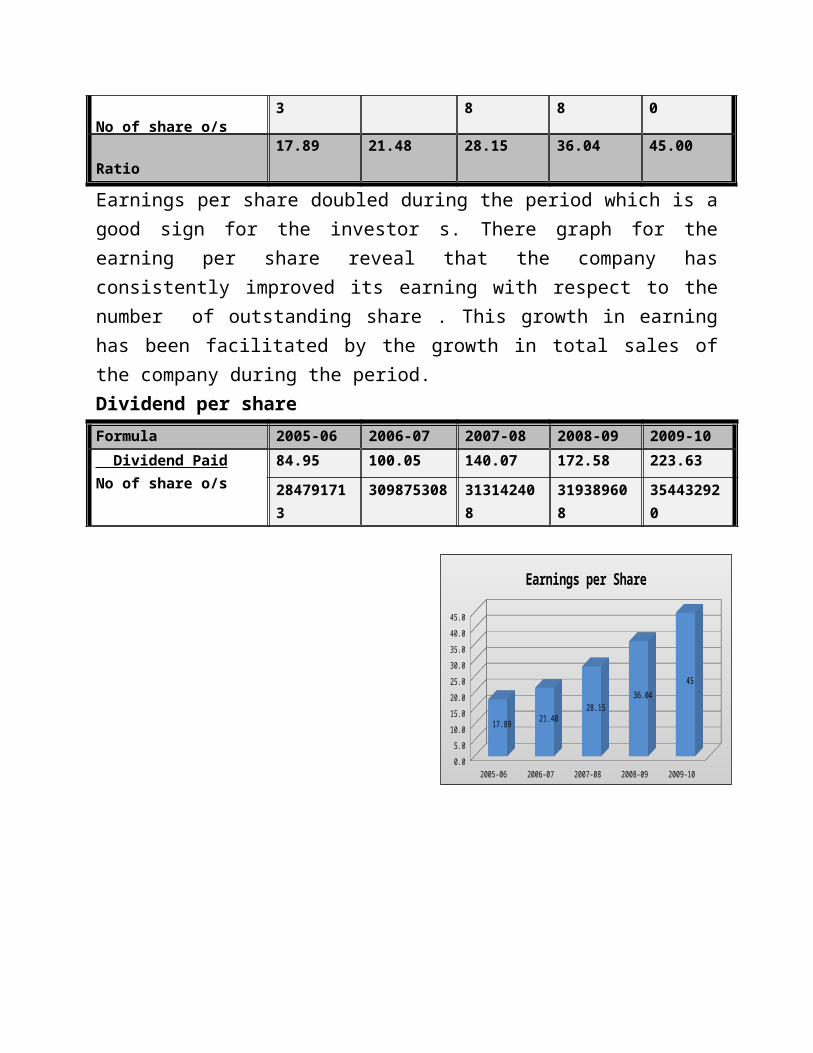
The graph shows that PE ratio of HDFC Bank has been highest the throughout the period while that of ofIndusind Bank has been the increasing gradually. This means that if we talk about the and confidence of share holder /investor, INDUSIND Bank is improving Gradually.
ICICI Bank has also recovered and improve its ratio significantly while IDBI has deteriorated it each year . Axis bank has an average PE ratio with respect to other companies .
Name of Banks
Price earnings ratio
05-06 06-07 07-08 08-09 09-10
ICICI 10.5
11.54
13.38
21.74
27.49
INDUSIND
2.73
16.07
8.88
7.38
6.78
HDFC 21.15
25.34
27.48
26.48
29.33
AXIS 12.21
19.81
20.47
21.10
26.38
IDBI 18.68
10.43
9.55
9.50
8.95
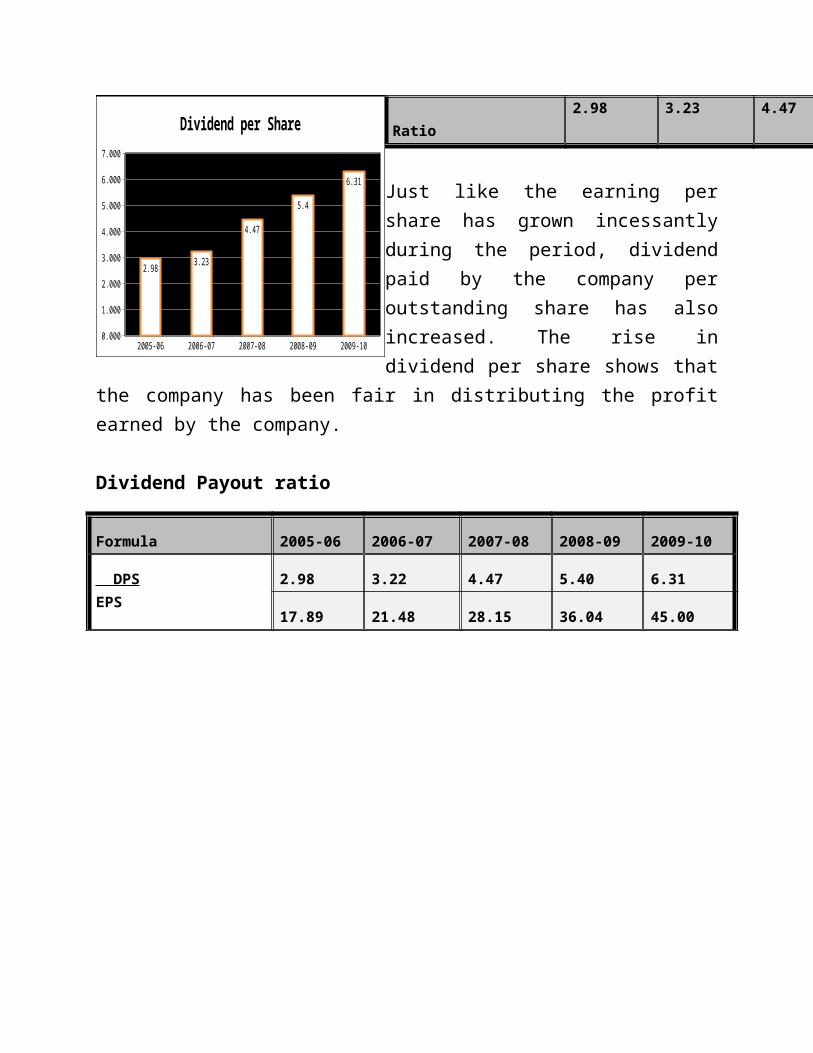
Return on EquityThe return on equity of Axis bank has been highestin FY09 while Indusind Bank also has scored high in FY .but if we see overall , HDFC has the highest bank , ICICI bank is lagging behind as its return on equity has been quite low during FY 08 and FY 09 and hence scoring very low overall .
Name of Banks Return on equity
05-06 06-07 07-08 08-09 09-10
ICICI 19.47 14.50 10.58 11.12 12.01
INDUSIND 25.55 6.82 14.12 18.31 18.32
HDFC 18.92 14.72 16.63 17.71 13.78
AXIS 24.44 13.84 16.81 19.23 12.10
IDBI 5.11 8.17 6.90 7.12 8.09
MP to BV RatioHere again , the graph for ratio of MP to BV of HDFC is the lowest . This reveals that the investors are ready to pay a price higher than the actual worth of each share of the com-pany . Even Axis bank looks better than ICICI bank in this case .while Indusind bank remain constant during this period .
FY07 FY08 FY09 FY100
0.5
1
1.5
2
2.5
3
3.5
4
4.5
5MP to BV Ratio
ICICI
INDUSIND
HDFC
AXIS
IDBI
Axis Title
FY07 FY08 FY09 FY100
5
10
15
20
25
Return on Equity
ICICIINDUSINDHDFCAXISIDBI
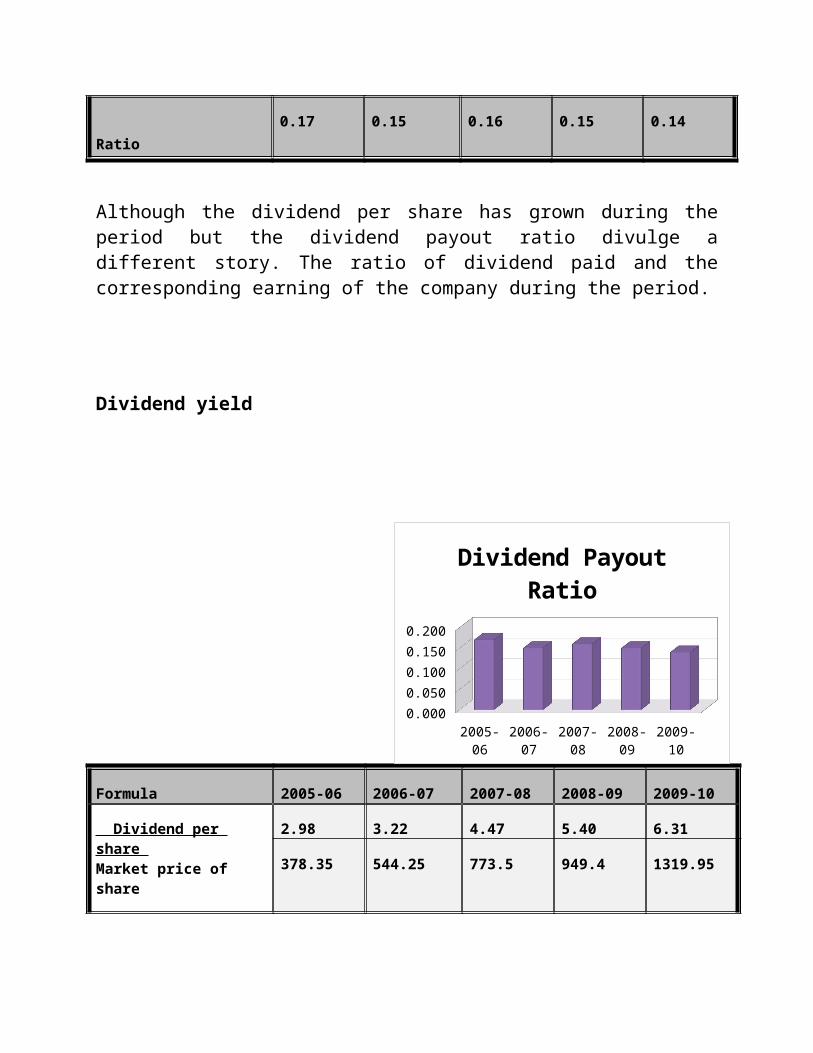
Name of Banks MP to BV Ratio
05-06 06-07 07-08 08-09 09-10
ICICI 2.25 2.27 2.29 3.09 3.14
INDUSIND 0.69 1.10 1.25 1.36 1.24
HDFC 94.57 145.87 169.24 203.48 326.50
AXIS 2.98 2.74 3.44 4.06 3.19
IDBI 0.95 0.85 0.66 0.87 0.92
Debt Equity Ratio
Name of Banks Debt equity Ratio
05-06 06-07 07-08 08-09 09-10
ICICI 5.429 3.647 2.437 3.339 3.139
INDUSIND 1.502 1.806 1.790 1.887 1.130
HDFC 0.857 1.660 0.539 0.938 0.668
AXIS 1.034 2.557 1.549 3.999 6.072
IDBI 8.827 7.934 5.814 6.235 5.211The leverage ratio of all companies shows that HDFC bank has the lowest debt in its capital structure and hence is the least leverage company . The leverage ratio of Axis bank has shown lots of variations while while that of ICICI bank is also comparatively
FY07 FY08 FY09 FY100
1
2
3
4
5
6
7
8
Debt equity ratio
ICICIINDUSINDHDFCAXISIDBI
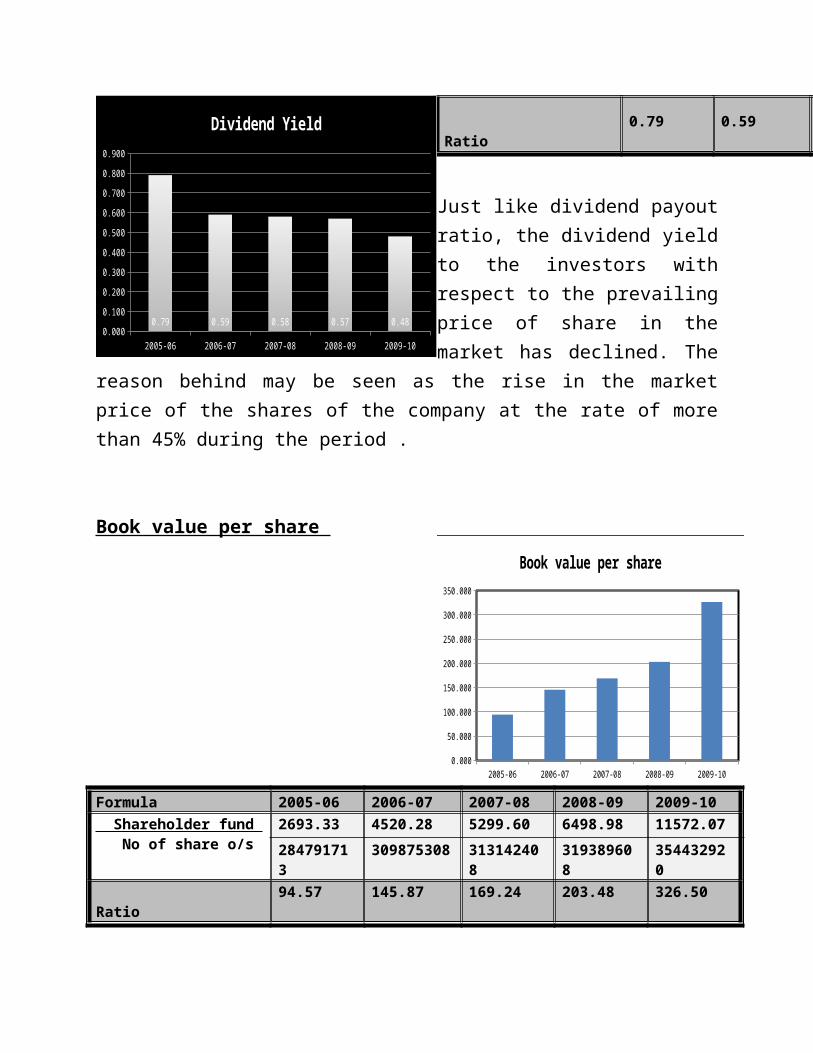
higher. IDBI bank looks to be the highest leverage company amongst the five.
Dividend payout Ratio:The graph for DRP shows that although highest dividend has been paid by indusind bank with respect to its earning in FY 07 . ICICI bank is the highest dividend payer overall . This means that if the earning of all the five companies were same , ICICI bank would have paid the highest dividend to its shareholders wile Indusind remain fluctuating in this regard . Axis bank and HDFC bank has been average in this case.
Earnings Per Share:Amongst the five companies , the earning for each share is highest for HDFC bank and that too has grown tremendously during the period .EPS of Indusind bank has also grown but still lower than that of HDFC bank . ICICI bank’s EPS ,although high , has not grown significantly during the period . IDBI bank is the lowest in this case too.
FY07 FY08 FY09 FY100
0.05
0.1
0.15
0.2
0.25
0.3
0.35
Dividend payout Ratio
ICICIINDUSINDHDFCAXISIDBI
FY07 FY08 FY09 FY100
5
10
15
20
25
30
35
40
45
Earning Per Share
ICICIINDUSINDHDFCAXISIDBI
Name of Banks Dividend payout Ratio
05-06 06-07 07-08 08-09 09-10
ICICI 0.34 0.34 0.31 0.33 0.30
INDUSIND 0.26 0.33 0.08 0.25 0.04
HDFC 0.17 0.15 0.16 0.15 0.14
AXIS 0.17 0.20 0.18 0.17 0.14
IDBI 0.00 0.15 0.21 0.25 0.20
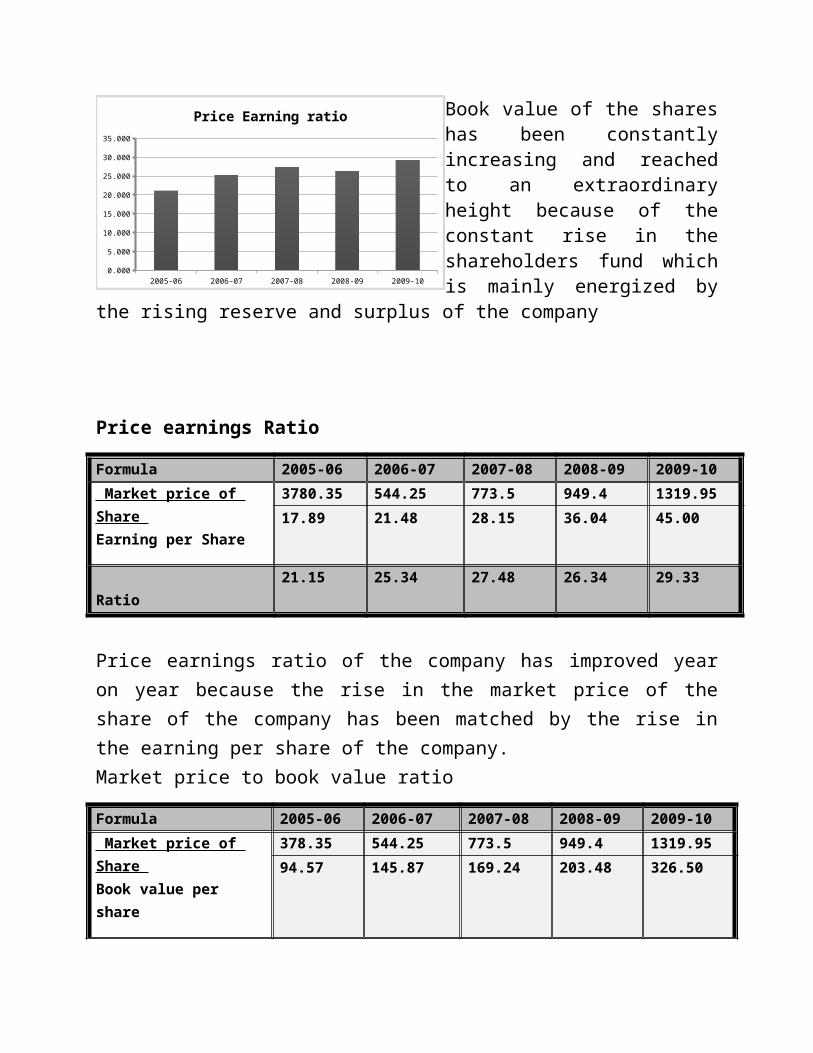
Name of Banks Earning per share
05-06 06-07 07-08 08-09 09-10
ICICI 25.64 25.14 27.20 30.70 30.89
INDUSIND 21.56 6.44 14.87 22.73 37.32
HDFC 17.89 21.48 28.15 36.04 45
AXIS 12.02 12.22 17.41 23.23 29.61
IDBI 4.88 7.51 8.12 9.50 8.95
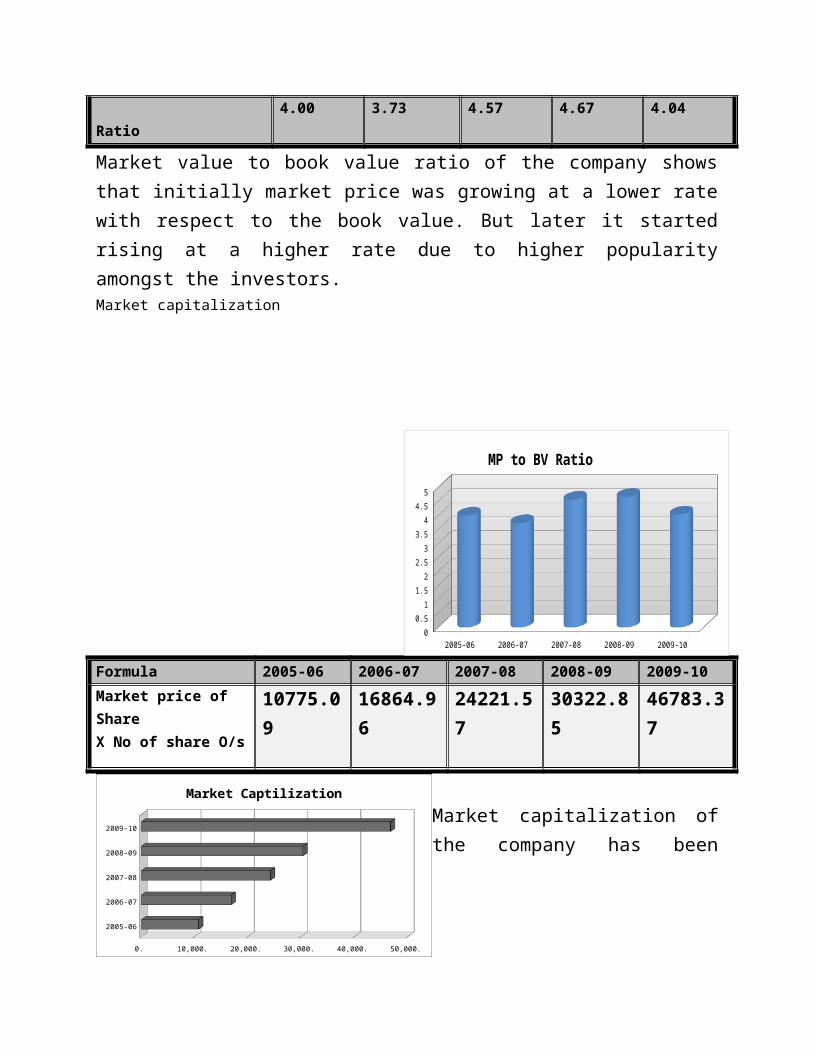
CONCLUSION
After making the comparison amongst the companies from all possible aspects, I reach to a final conclusion that amongst the five company’s .Indusind bank is Average preferred company because:
With respect to the services facilities and provided INDUSIND bank is at par with that of other bank need is to enhance quality of services.
Along with the expansion through network which every bank is doing INDUSIND Bank has least no of branches and ATM among these companies so there is need to expand by the way of acquisition as ICICI Bank and HDFC bank were doing by acquiring Bank of Rajasthan and centurion bank of Punjab respectively
The ratio of market price to book value is highest signifying that the investors in the secondary are ready to pay a price for its shares which are higher than its actual worth.
Indusind bank in the least leveraged company amongst the five bank companies under consideration. This means that the company has the option to raise funds in the form of debt if require in future which in undesirable for those which are already leveraged.
Company is creating reserve in order to meet future contingencies and hence paying lower dividend as compared to other companies. This will not only benefit the company but also its shareholder as the company can use these reserves whenever so desired.
Earning of the company also good when distributed amongst each outstanding share of INDUSIND bank will be fair. This indicates that the company is having sufficient earning to pay to its shareholders.