Company Presentation · This presentation, including the accompanying oral presentation...
33
Company Presentation May 2015
Transcript of Company Presentation · This presentation, including the accompanying oral presentation...

Company Presentation
May 2015
Forward-Looking Statements
2
This presentation, including the accompanying oral presentation (collectively, this “presentation”), does not constitute an offer to sell or the solicitation of an offer to buy anysecurities. This presentation is provided by On Deck Capital, Inc. (“OnDeck”) for informational purposes only. No representations express or implied are being made byOnDeck or any other person as to the accuracy or completeness of the information contained herein.
This presentation contains “forward-looking statements” within the meaning of the Private Securities Litigation Reform Act of 1995 and other legal authority. Forward-looking statements include statements about scalability, growing distribution channels, credit predictability and information concerning our future financial performance,business plans and objectives, potential growth opportunities, financing plans, competitive position, industry environment and potential market opportunities. Forward-looking statements can also be identified by words such as "will," "enables," "expects," "allows," "continues," "believes," "anticipates," "estimates" or similar expressions.Forward-looking statements are neither historical facts nor assurances of future performance. They are based only on our current beliefs, expectations and assumptionsregarding the future of our business, anticipated events and trends, the economy and other future conditions. Moreover, we do not assume responsibility for the accuracyand completeness of forward-looking statements. As such, they are subject to inherent uncertainties, changes in circumstances, known and unknown risks and otherfactors that are difficult to predict and in many cases outside our control.
As a result, you should not rely on any forward-looking statements. Our expected results may not be achieved, and actual results may differ materially from ourexpectations. Important factors that could cause actual results to differ from our forward-looking statements are the risks that we may not be able to manage our anticipatedor actual growth effectively, that our credit models do not adequately identify potential risks, and other risks, including those under the heading “Risk Factors” in our AnnualReport on Form 10-K for the year ended December 31, 2014 and in other documents that we file with the Securities and Exchange Commission, or SEC, from time to timewhich are available on the SEC website at www.sec.gov. We undertake no obligation to publicly update any forward-looking statements for any reason after the date of thispresentation to conform these statements to actual results or to changes in our expectations, except as required by law.
In addition to the U.S. GAAP financial information, this presentation includes certain non-GAAP financial measures. We believe that non-GAAP measures can provideuseful supplemental information for period-to-period comparisons of our core business and is useful to investors and others in understanding and evaluating our operatingresults. These non-GAAP measures have not been calculated in accordance with U.S. GAAP. You should not consider them in isolation or as a substitute for an analysis ofour results under U.S. GAAP. There are a number of limitations related to the use of these non-GAAP measures versus their nearest GAAP equivalents. For example,neither Adjusted EBITDA nor Adjusted Net (Loss) Income is a substitute for Net (Loss) Income. In addition, other companies may calculate non-GAAP financial measuresdifferently or may use other measures to evaluate their performance, all of which could reduce the usefulness of our non-GAAP financial measures as tools for comparison.Adjusted EBITDA excludes some recurring costs, including interest expense associated with debt used for corporate purposes, non-cash stock-based compensation,depreciation and amortization expense and fair value adjustment for our warrant liability. Therefore Adjusted EBITDA does not reflect interest expense, the non-cashimpact of stock-based compensation or working capital needs that will continue for the foreseeable future. Adjusted Net (Loss) Income excludes stock-based compensationexpense and warrant liability fair value adjustment which will continue for the foreseeable future and therefore will generally be more favorable than Net (Loss) Incomedetermined in accordance with GAAP. Please refer to the Non-GAAP Reconciliations at the end of this presentation for a description of these non-GAAP measures and areconciliation to Net (Loss) Income.
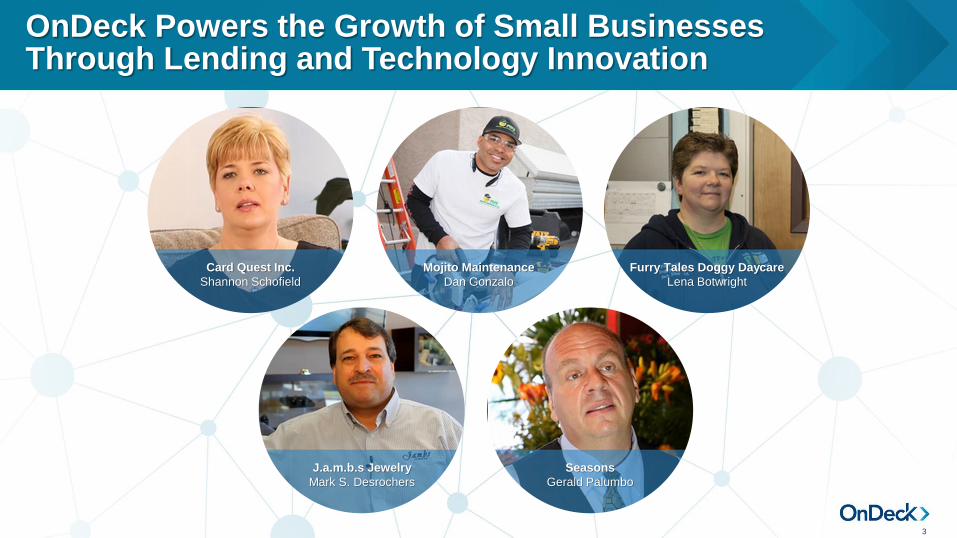
OnDeck Powers the Growth of Small Businesses Through Lending and Technology Innovation
3
Card Quest Inc.
Shannon Schofield
Mojito Maintenance
Dan Gonzalo
Furry Tales Doggy Daycare
Lena Botwright
J.a.m.b.s Jewelry
Mark S. Desrochers
Seasons
Gerald Palumbo
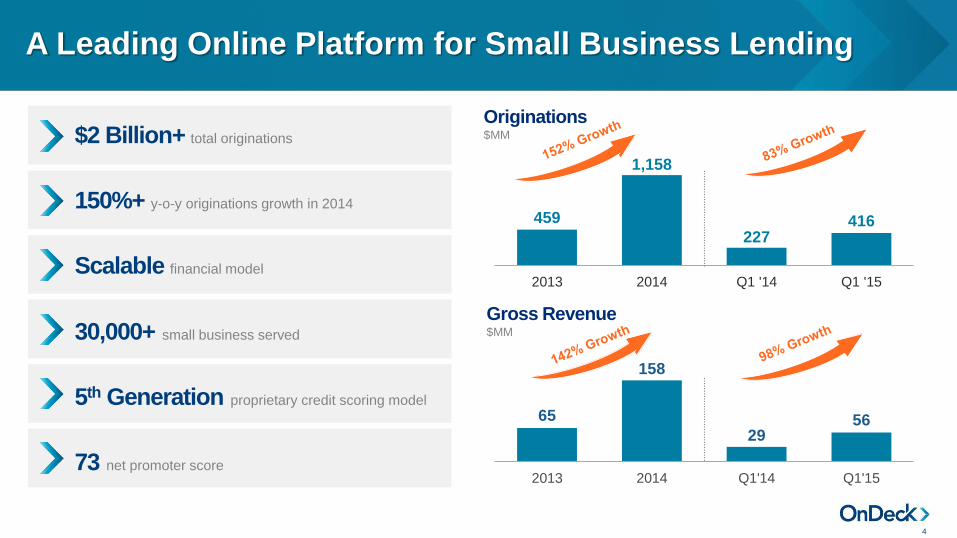
$2 Billion+ total originations
Scalable financial model
5th Generation proprietary credit scoring model
30,000+ small business served
73 net promoter score
150%+ y-o-y originations growth in 2014
A Leading Online Platform for Small Business Lending
4
459
1,158
227416
2013 2014 Q1 '14 Q1 '15
Originations$MM
65
158
2956
2013 2014 Q1'14 Q1'15
Gross Revenue$MM
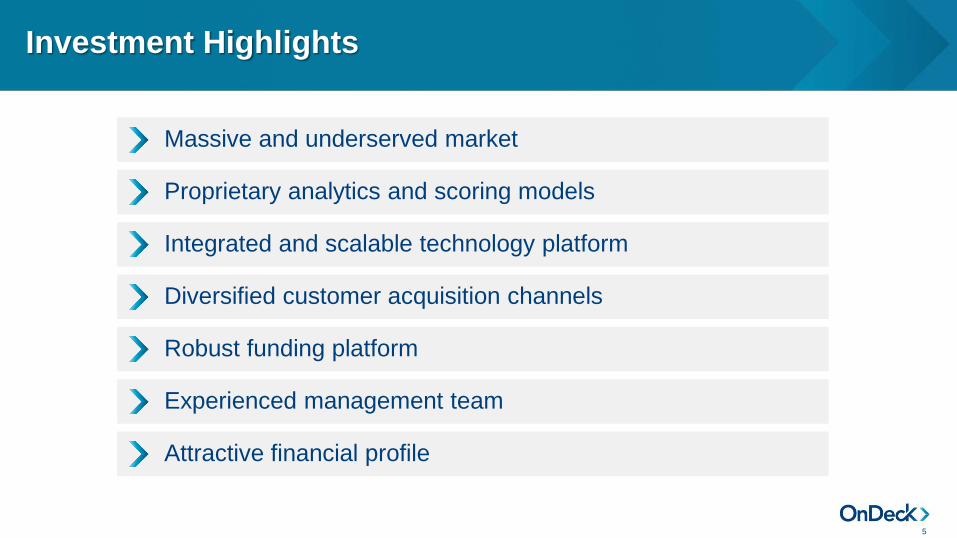
Investment Highlights
5
Massive and underserved market
Proprietary analytics and scoring models
Integrated and scalable technology platform
Diversified customer acquisition channels
Robust funding platform
Experienced management team
Attractive financial profile
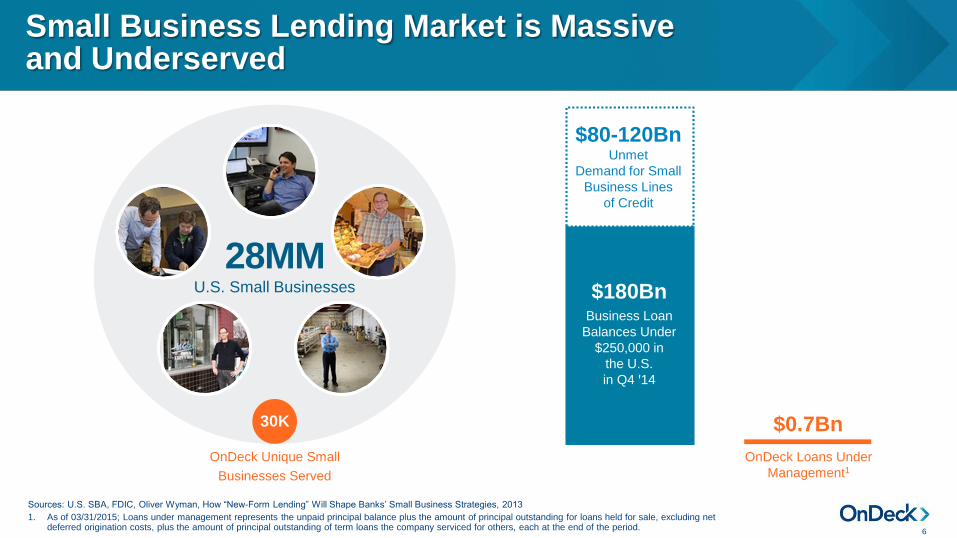
Small Business Lending Market is Massive and Underserved
6
Sources: U.S. SBA, FDIC, Oliver Wyman, How “New-Form Lending” Will Shape Banks’ Small Business Strategies, 2013
1. As of 03/31/2015; Loans under management represents the unpaid principal balance plus the amount of principal outstanding for loans held for sale, excluding net deferred origination costs, plus the amount of principal outstanding of term loans the company serviced for others, each at the end of the period.
$80-120Bn
Unmet
Demand for Small
Business Lines
of Credit
$0.7Bn
OnDeck Loans Under
Management1
$80-120BnUnmet
Demand for Small
Business Lines
of Credit
$180BnBusiness Loan
Balances Under
$250,000 in
the U.S.
in Q4 ꞌ14
28MMU.S. Small Businesses
OnDeck Unique Small
Businesses Served
30K
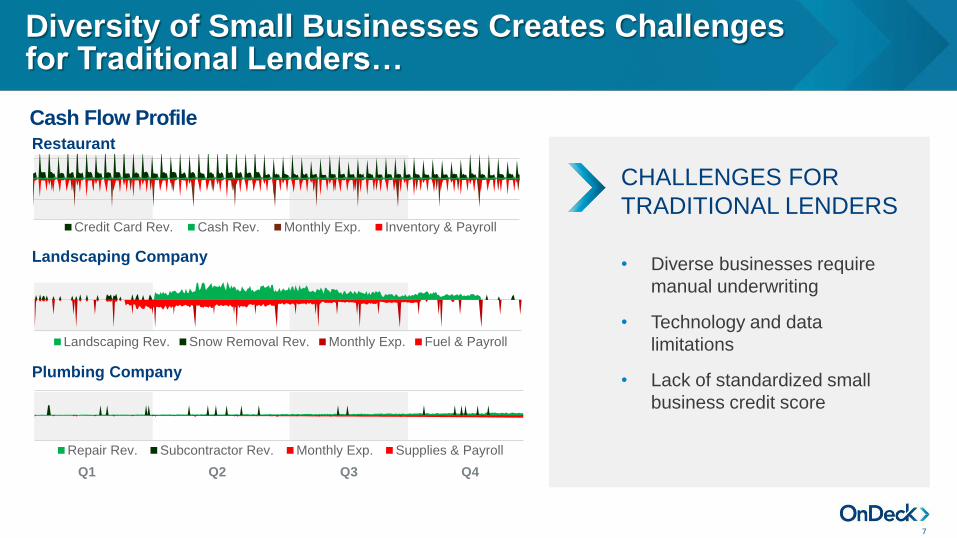
Credit Card Rev. Cash Rev. Monthly Exp. Inventory & Payroll
Landscaping Rev. Snow Removal Rev. Monthly Exp. Fuel & Payroll
Repair Rev. Subcontractor Rev. Monthly Exp. Supplies & Payroll
• Diverse businesses require
manual underwriting
• Technology and data
limitations
• Lack of standardized small
business credit score
Diversity of Small Businesses Creates Challenges for Traditional Lenders…
CHALLENGES FOR
TRADITIONAL LENDERS
Cash Flow ProfileRestaurant
Landscaping Company
Plumbing Company
7
Q1 Q2 Q3 Q4
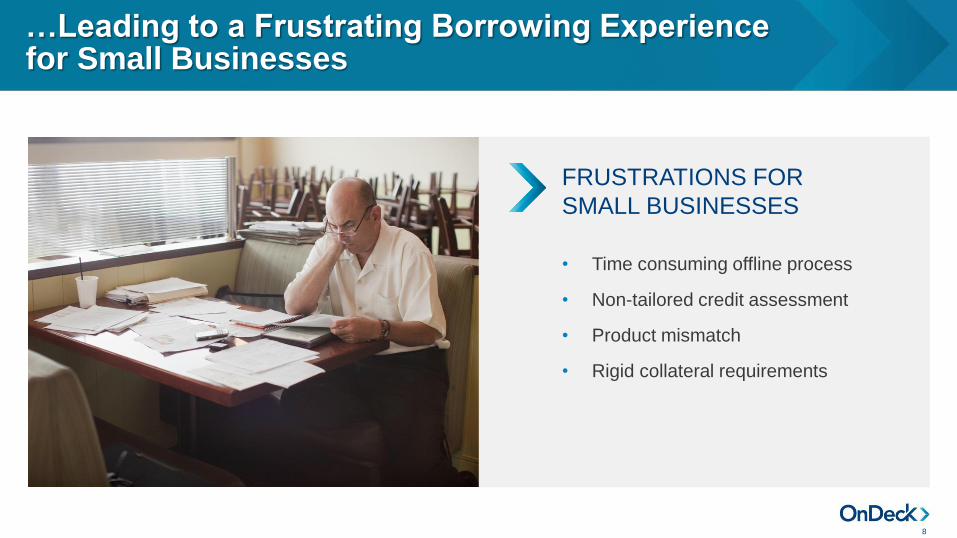
…Leading to a Frustrating Borrowing Experience for Small Businesses
FRUSTRATIONS FOR
SMALL BUSINESSES
• Time consuming offline process
• Non-tailored credit assessment
• Product mismatch
• Rigid collateral requirements
8
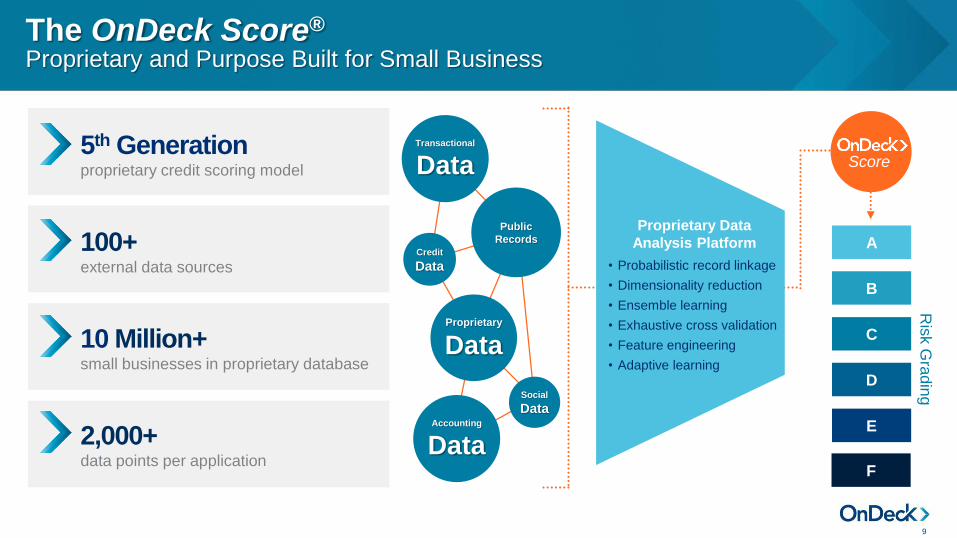
The OnDeck Score®
Proprietary and Purpose Built for Small Business
100+ external data sources
5th Generationproprietary credit scoring model
10 Million+ small businesses in proprietary database
2,000+ data points per application
9
Score
A
B
C
D
E
Ris
k G
rad
ing
• Probabilistic record linkage
• Dimensionality reduction
• Ensemble learning
• Exhaustive cross validation
• Feature engineering
• Adaptive learning
Proprietary Data
Analysis Platform
Public
RecordsCredit
Data
Social
Data
Proprietary
Data
Transactional
Data
Accounting
DataF
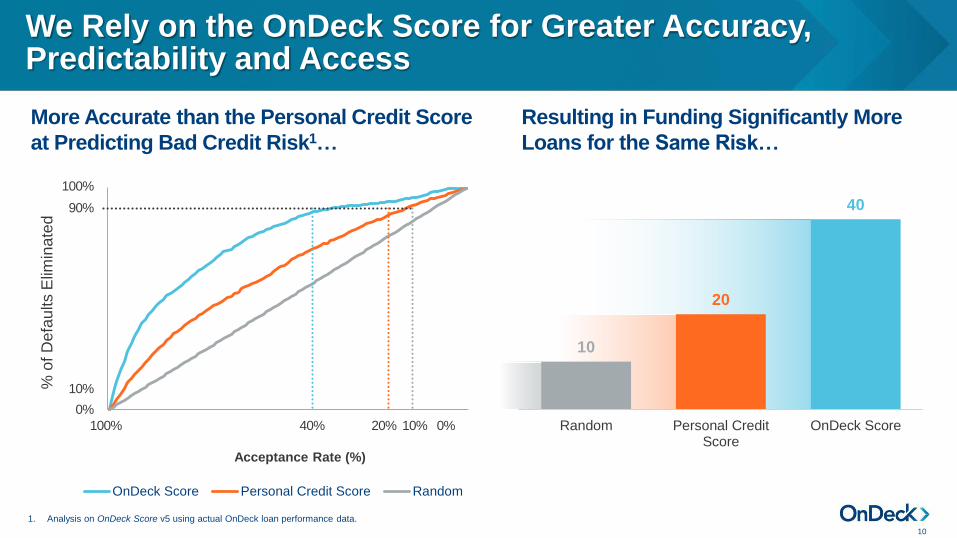
Acceptance Rate (%)
OnDeck Score Personal Credit Score Random
Resulting in Funding Significantly More
Loans for the Same Risk…
More Accurate than the Personal Credit Score
at Predicting Bad Credit Risk1…
We Rely on the OnDeck Score for Greater Accuracy, Predictability and Access
10
1. Analysis on OnDeck Score v5 using actual OnDeck loan performance data.
90%
100%
0%
100% 40% 20% 10% 0%
% o
f D
efa
ults E
limin
ate
d
10%
10
20
40
Random Personal CreditScore
OnDeck Score
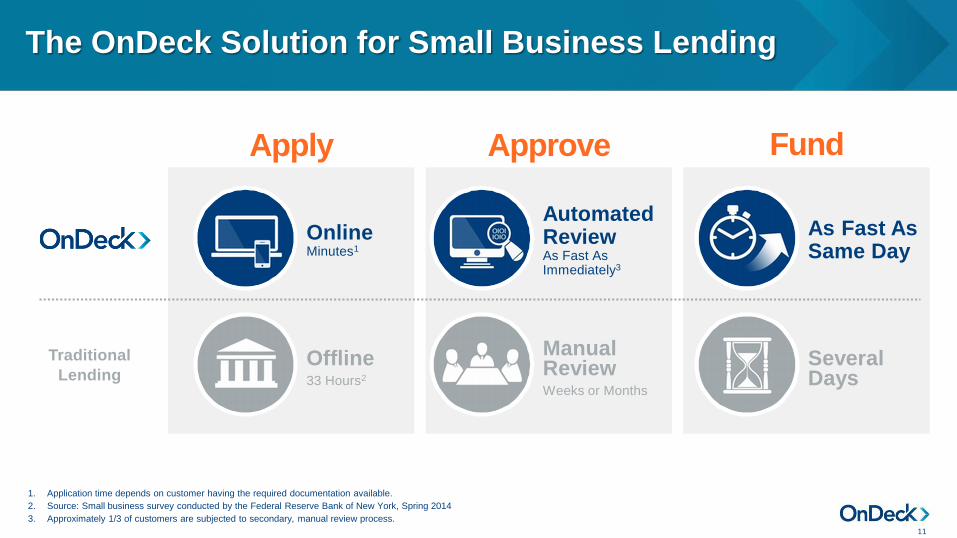
Online Minutes1
Automated Review As Fast As Immediately3
As Fast As Same Day
The OnDeck Solution for Small Business Lending
11
1. Application time depends on customer having the required documentation available.
2. Source: Small business survey conducted by the Federal Reserve Bank of New York, Spring 2014
3. Approximately 1/3 of customers are subjected to secondary, manual review process.
FundApproveApply
Offline33 Hours2
Manual ReviewWeeks or Months
Several Days
Traditional
Lending
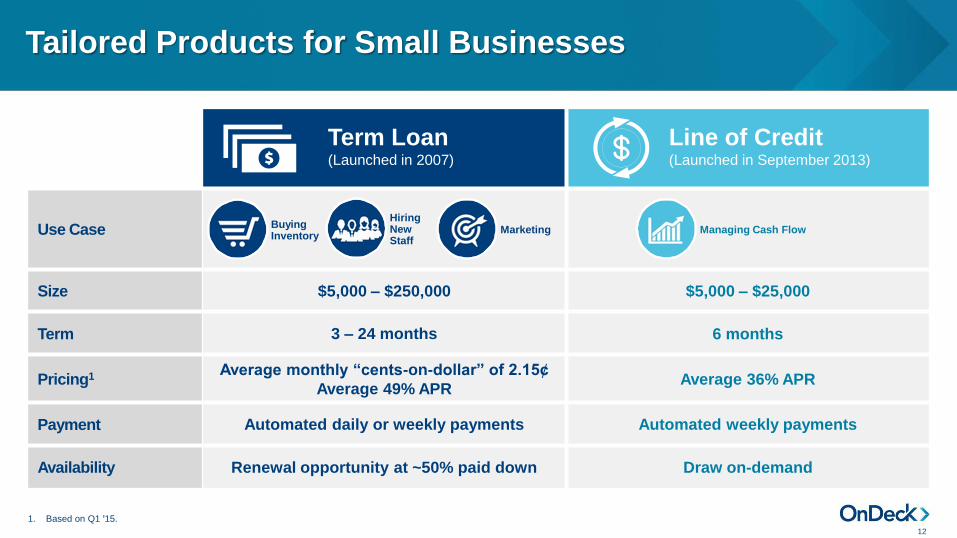
Use Case
Size $5,000 – $250,000 $5,000 – $25,000
Term 3 – 24 months 6 months
Pricing1 Average monthly “cents-on-dollar” of 2.15¢
Average 49% APRAverage 36% APR
Payment Automated daily or weekly payments Automated weekly payments
Availability Renewal opportunity at ~50% paid down Draw on-demand
Tailored Products for Small Businesses
1. Based on Q1 ꞌ15.
Term Loan(Launched in 2007)
Line of Credit(Launched in September 2013)
HiringNewStaff
Buying Inventory
Marketing Managing Cash Flow
12
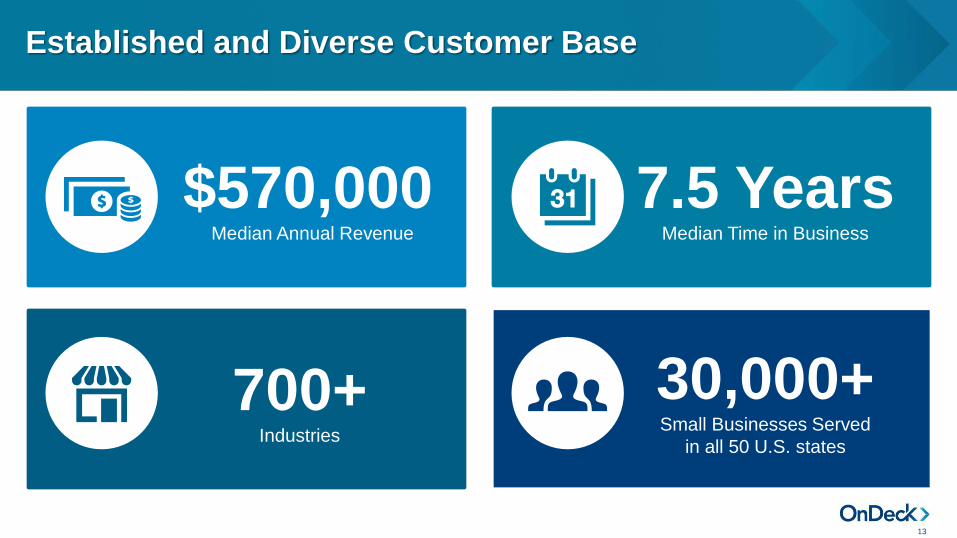
7.5 YearsMedian Time in Business
$570,000Median Annual Revenue
700+Industries
30,000+Small Businesses Served
in all 50 U.S. states
Established and Diverse Customer Base
13
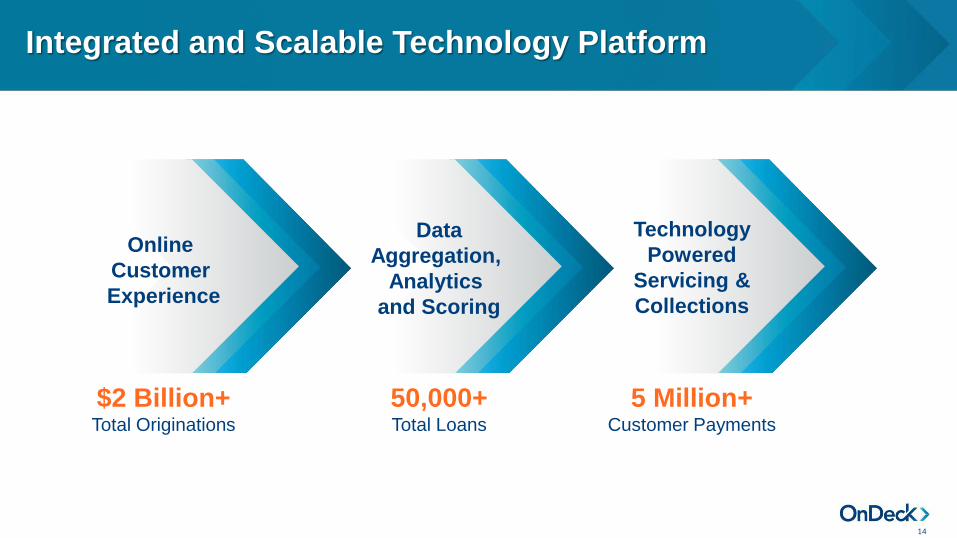
Online
Customer
Experience
Data
Aggregation,
Analytics
and Scoring
Technology
Powered
Servicing &
Collections
Integrated and Scalable Technology Platform
14
$2 Billion+Total Originations
50,000+Total Loans
5 Million+Customer Payments
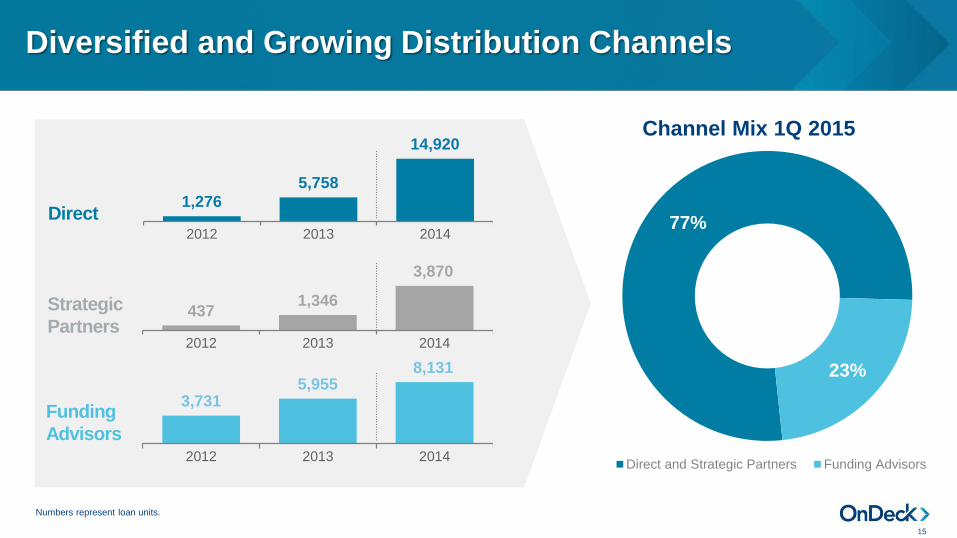
Diversified and Growing Distribution Channels
Numbers represent loan units.
15
1,276
5,758
14,920
2012 2013 2014
Direct
3,7315,955
8,131
2012 2013 2014
Funding
Advisors
Strategic
Partners
77%
23%
Direct and Strategic Partners Funding Advisors
Channel Mix 1Q 2015
4371,346
3,870
2012 2013 2014
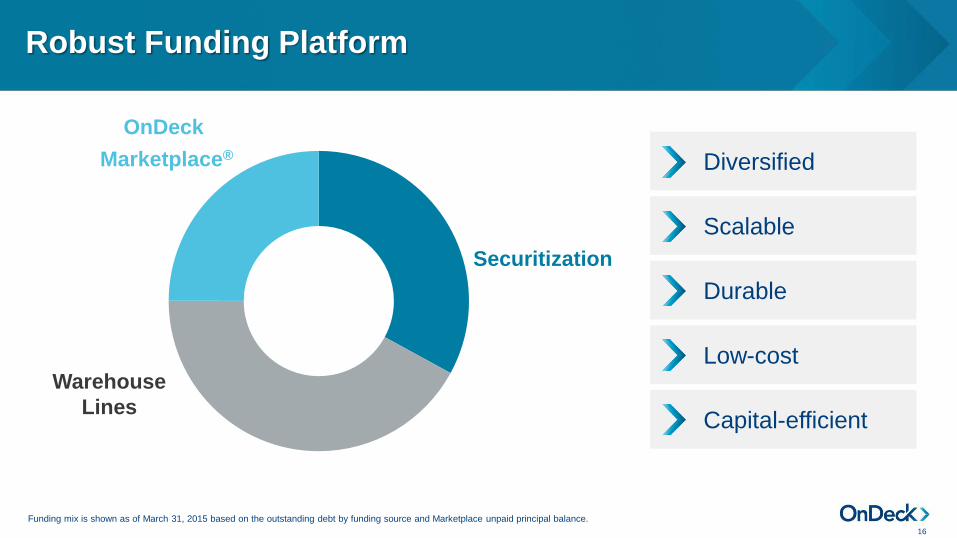
Robust Funding Platform
16
Funding mix is shown as of March 31, 2015 based on the outstanding debt by funding source and Marketplace unpaid principal balance.
Securitization
Warehouse
Lines
OnDeck
Marketplace® Diversified
Scalable
Durable
Low-cost
Capital-efficient
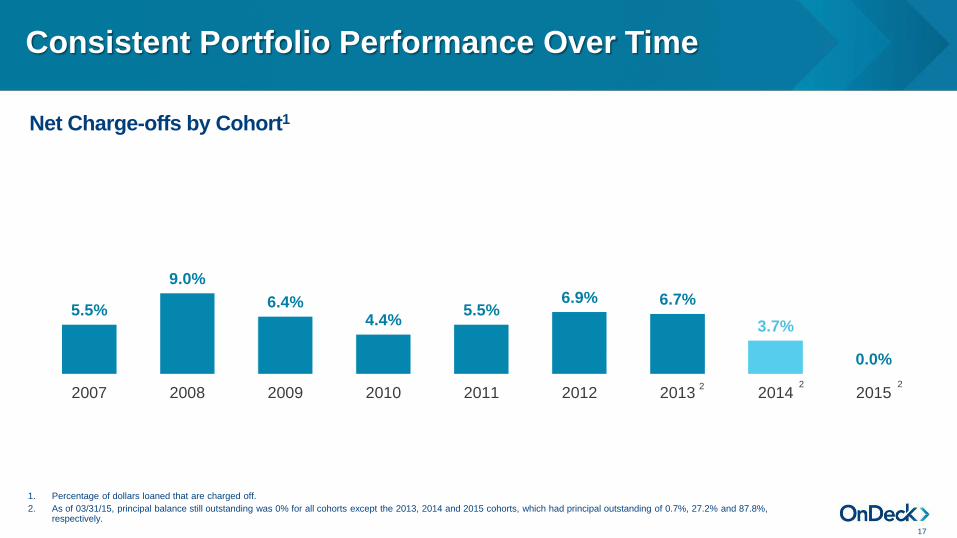
5.5%
9.0%
6.4%4.4%
5.5%6.9% 6.7%
3.7%
0.0%
2007 2008 2009 2010 2011 2012 2013 2014 2015
Net Charge-offs by Cohort1
Consistent Portfolio Performance Over Time
17
1. Percentage of dollars loaned that are charged off.
2. As of 03/31/15, principal balance still outstanding was 0% for all cohorts except the 2013, 2014 and 2015 cohorts, which had principal outstanding of 0.7%, 27.2% and 87.8%, respectively.
222
Growth Strategy
Brand and direct
marketing
Strategic partnerships
Data and analytics
Product expansion
Extend customer
lifetime value
International expansion
18
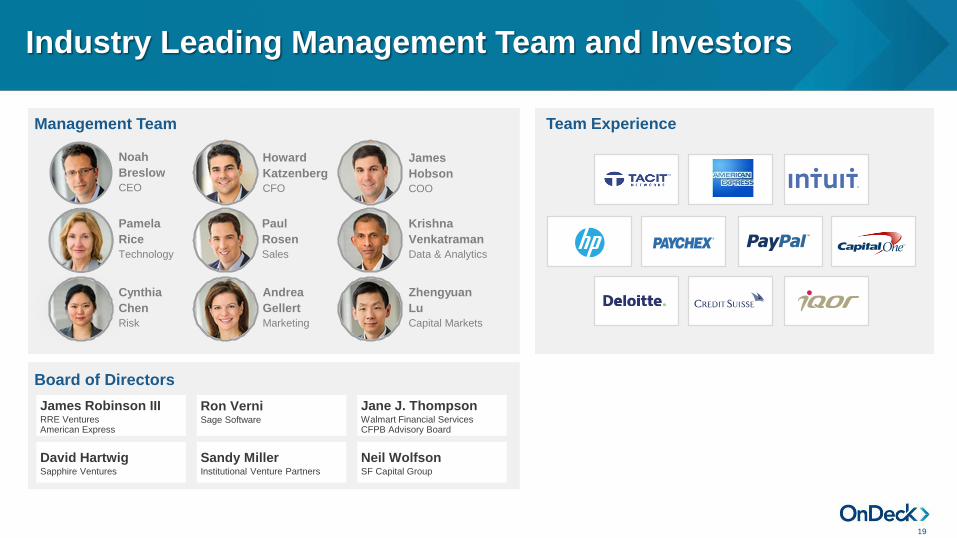
Industry Leading Management Team and Investors
Noah
Breslow
CEO
James
Hobson
COO
Paul
Rosen
Sales
Howard
Katzenberg
CFO
Zhengyuan
Lu
Capital Markets
Krishna
Venkatraman
Data & Analytics
Pamela
Rice
Technology
Cynthia
Chen
Risk
Andrea
Gellert
Marketing
Management Team Team Experience
19
Board of Directors
James Robinson IIIRRE VenturesAmerican Express
David HartwigSapphire Ventures
Sandy MillerInstitutional Venture Partners
Jane J. ThompsonWalmart Financial ServicesCFPB Advisory Board
Neil WolfsonSF Capital Group
Ron VerniSage Software
Financial Highlights
20
Capital light funding model
Compelling customer lifetime value
Rapid growth
Demonstrated operating leverage
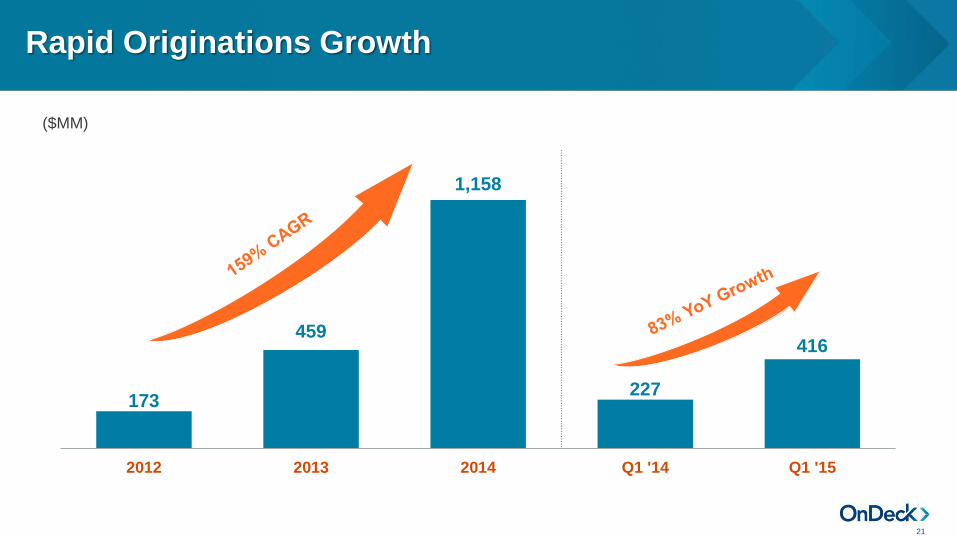
173
459
1,158
227
416
2012 2013 2014 Q1 '14 Q1 '15
Rapid Originations Growth
21
($MM)
($MM)
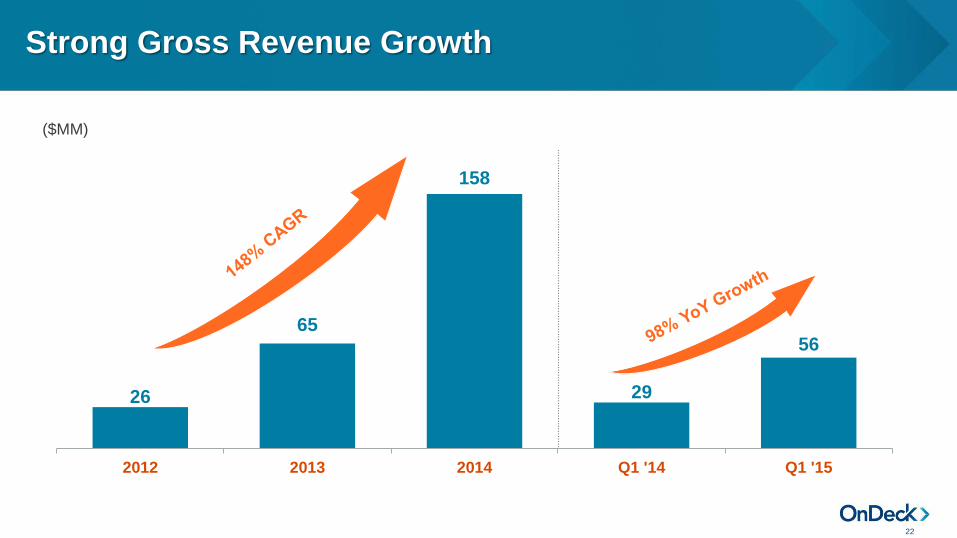
Strong Gross Revenue Growth
22
26
65
158
29
56
2012 2013 2014 Q1 '14 Q1 '15
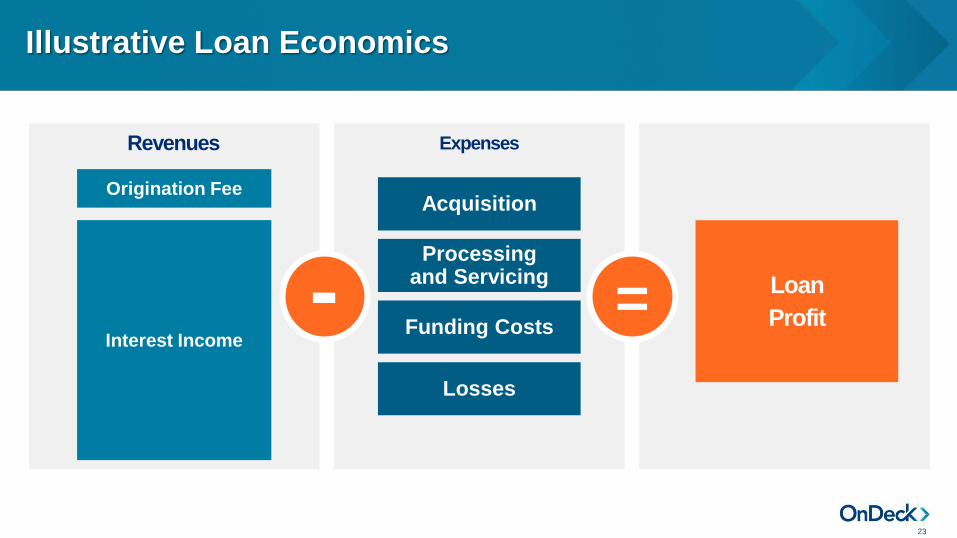
Loan
Profit
Revenues Expenses
–
Illustrative Loan Economics
23
=
Origination Fee
Interest Income
Losses
Funding Costs
Processing and Servicing
Acquisition
-
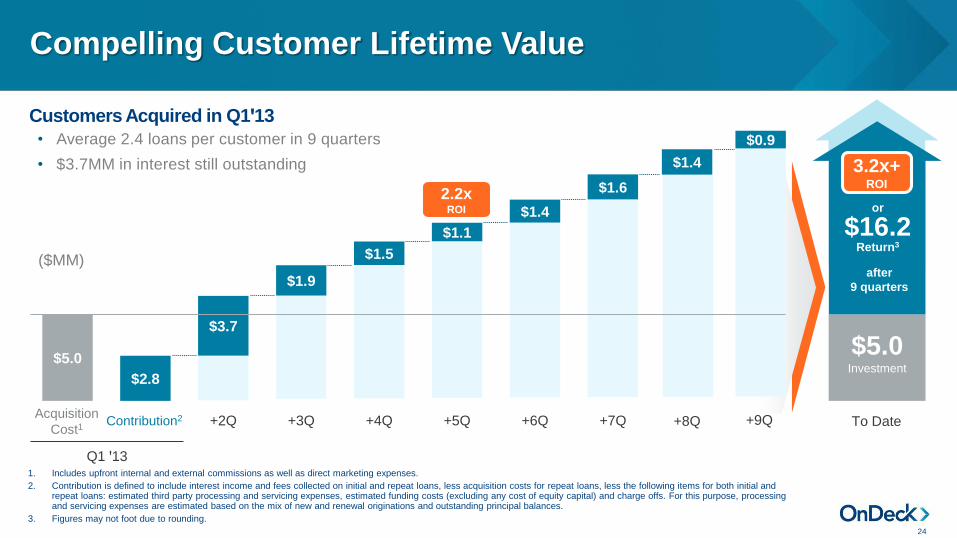
Customers Acquired in Q1ꞌ13
• Average 2.4 loans per customer in 9 quarters
• $3.7MM in interest still outstanding
($MM)
Compelling Customer Lifetime Value
24
1. Includes upfront internal and external commissions as well as direct marketing expenses.
2. Contribution is defined to include interest income and fees collected on initial and repeat loans, less acquisition costs for repeat loans, less the following items for both initial and repeat loans: estimated third party processing and servicing expenses, estimated funding costs (excluding any cost of equity capital) and charge offs. For this purpose, processing and servicing expenses are estimated based on the mix of new and renewal originations and outstanding principal balances.
3. Figures may not foot due to rounding.
3.2x+ROI
after
9 quarters
or
$16.2Return3
$5.0Investment
Q1 ꞌ13
$5.0
$2.8
$1.9
$1.5
$1.1
$1.4
Acquisition
Cost1Contribution2 +2Q +3Q +4Q +5Q +6Q
$1.6
+7Q
$3.7
$1.4
+8Q
$0.9
+9Q
2.2xROI
To Date
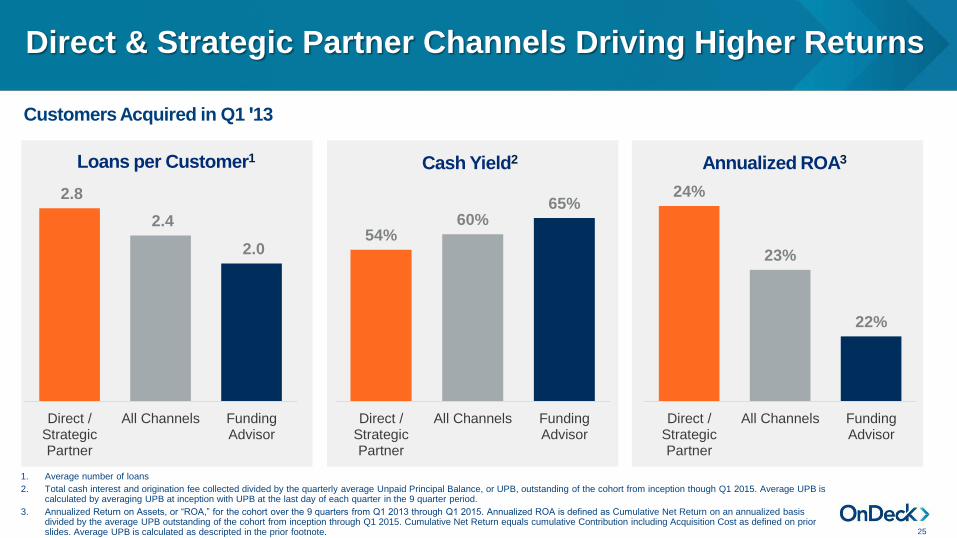
Loans per Customer1
Direct & Strategic Partner Channels Driving Higher Returns
25
Annualized ROA3
2.8
2.4
2.0
Direct /StrategicPartner
All Channels FundingAdvisor
24%
23%
22%
Direct /StrategicPartner
All Channels FundingAdvisor
Customers Acquired in Q1 ꞌ13
1. Average number of loans
2. Total cash interest and origination fee collected divided by the quarterly average Unpaid Principal Balance, or UPB, outstanding of the cohort from inception though Q1 2015. Average UPB is calculated by averaging UPB at inception with UPB at the last day of each quarter in the 9 quarter period.
3. Annualized Return on Assets, or “ROA,” for the cohort over the 9 quarters from Q1 2013 through Q1 2015. Annualized ROA is defined as Cumulative Net Return on an annualized basis divided by the average UPB outstanding of the cohort from inception through Q1 2015. Cumulative Net Return equals cumulative Contribution including Acquisition Cost as defined on prior slides. Average UPB is calculated as descripted in the prior footnote.
54%60%
65%
Direct /StrategicPartner
All Channels FundingAdvisor
Cash Yield2
Annualized ROA2
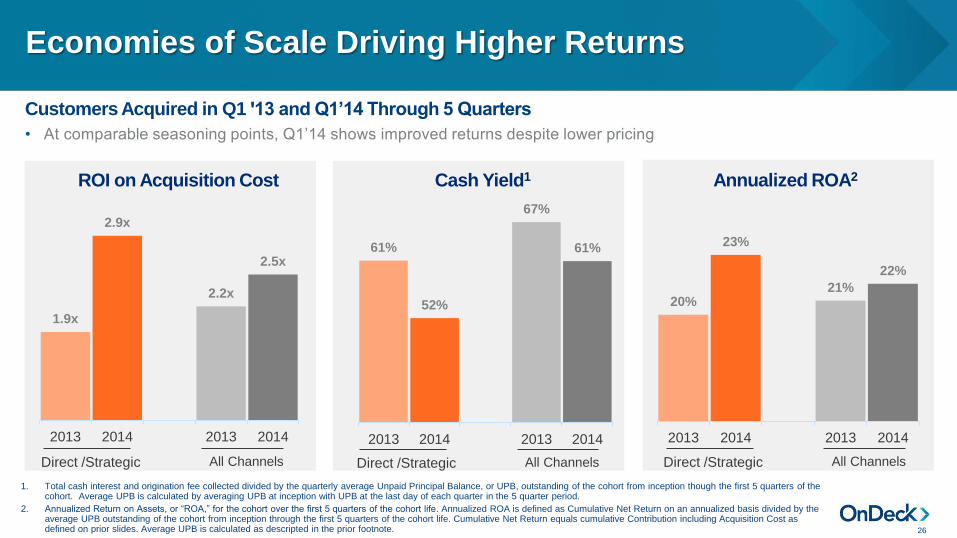
Economies of Scale Driving Higher Returns
26
ROI on Acquisition Cost
Customers Acquired in Q1 ꞌ13 and Q1’14 Through 5 Quarters
• At comparable seasoning points, Q1’14 shows improved returns despite lower pricing
20%
23%
21%
22%
2013 2014 2013 2014
1.9x
2.9x
2.2x
2.5x
2013 2014 2013 2014
Direct /Strategic All ChannelsDirect /Strategic All Channels
Cash Yield1
61%
52%
67%
61%
2013 2014 2013 2014
Direct /Strategic All Channels
1. Total cash interest and origination fee collected divided by the quarterly average Unpaid Principal Balance, or UPB, outstanding of the cohort from inception though the first 5 quarters of the cohort. Average UPB is calculated by averaging UPB at inception with UPB at the last day of each quarter in the 5 quarter period.
2. Annualized Return on Assets, or “ROA,” for the cohort over the first 5 quarters of the cohort life. Annualized ROA is defined as Cumulative Net Return on an annualized basis divided by the average UPB outstanding of the cohort from inception through the first 5 quarters of the cohort life. Cumulative Net Return equals cumulative Contribution including Acquisition Cost as defined on prior slides. Average UPB is calculated as descripted in the prior footnote.
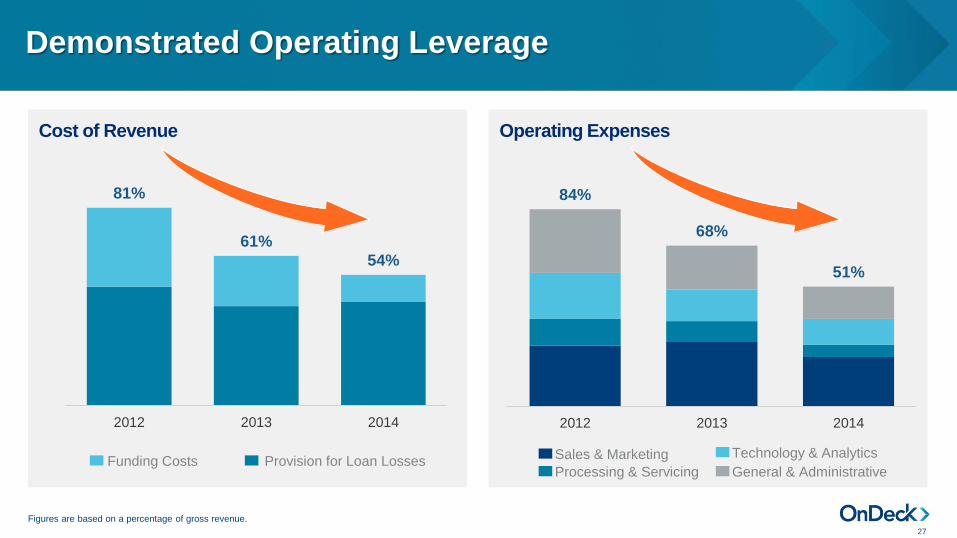
81%
61%
54%
2012 2013 2014
Cost of Revenue Operating Expenses
84%
68%
51%
2012 2013 2014
Provision for Loan LossesFunding CostsSales & Marketing Technology & Analytics
Processing & Servicing General & Administrative
Demonstrated Operating Leverage
Figures are based on a percentage of gross revenue.
27
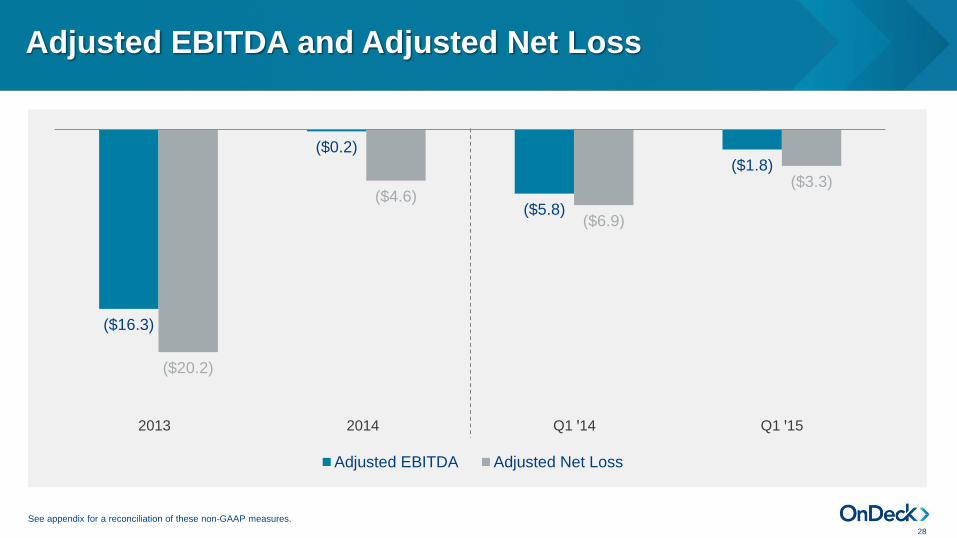
Adjusted EBITDA and Adjusted Net Loss
See appendix for a reconciliation of these non-GAAP measures.
($16.3)
($0.2)
($5.8)
($1.8)
($20.2)
($4.6)
($6.9)
($3.3)
Adjusted EBITDA Adjusted Net Loss
2013 2014 Q1 ꞌ14 Q1 ꞌ15
28

Investment Highlights
29
Massive and underserved market
Proprietary analytics and scoring models
Integrated and scalable technology platform
Diversified customer acquisition channels
Robust funding platform
Experienced management team
Attractive financial profile

APPENDIX
1
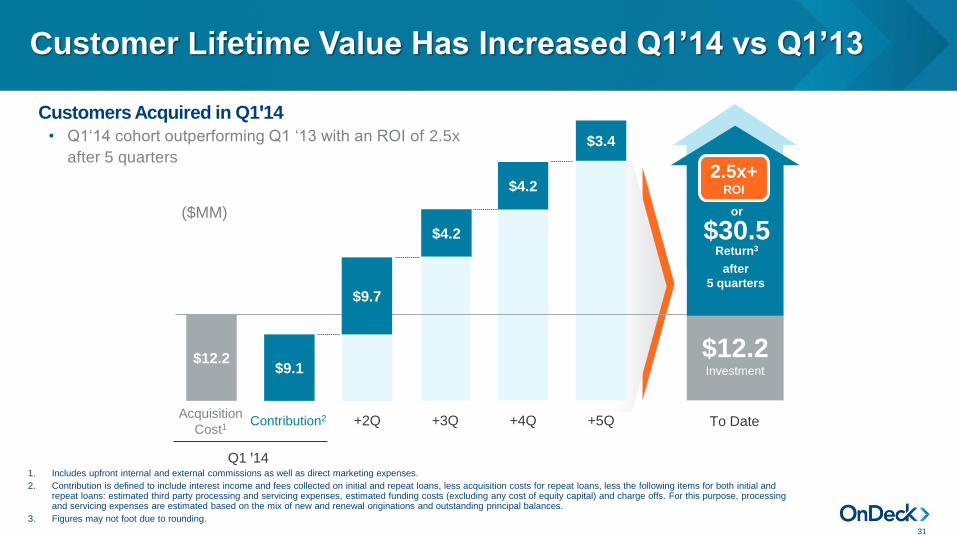
Customers Acquired in Q1ꞌ14
• Q1‘14 cohort outperforming Q1 ‘13 with an ROI of 2.5x
after 5 quarters
($MM)
31
1. Includes upfront internal and external commissions as well as direct marketing expenses.
2. Contribution is defined to include interest income and fees collected on initial and repeat loans, less acquisition costs for repeat loans, less the following items for both initial and repeat loans: estimated third party processing and servicing expenses, estimated funding costs (excluding any cost of equity capital) and charge offs. For this purpose, processing and servicing expenses are estimated based on the mix of new and renewal originations and outstanding principal balances.
3. Figures may not foot due to rounding.
Q1 ꞌ14
$12.2$9.1
$4.2
Acquisition
Cost1Contribution2 +2Q +3Q +4Q +5Q
2.5x+ROI
after
5 quarters
or
$30.5Return3
$12.2Investment
To Date
$9.7
$4.2
$3.4
Customer Lifetime Value Has Increased Q1’14 vs Q1’13
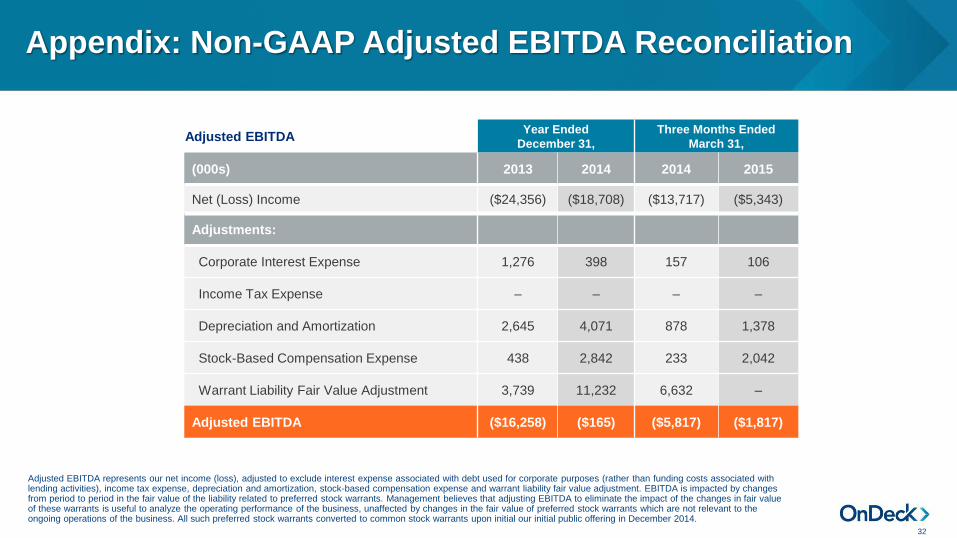
Adjusted EBITDAYear Ended
December 31,
Three Months Ended
March 31,
(000s) 2013 2014 2014 2015
Net (Loss) Income ($24,356) ($18,708) ($13,717) ($5,343)
Adjustments:
Corporate Interest Expense 1,276 398 157 106
Income Tax Expense – – – –
Depreciation and Amortization 2,645 4,071 878 1,378
Stock-Based Compensation Expense 438 2,842 233 2,042
Warrant Liability Fair Value Adjustment 3,739 11,232 6,632 –
Adjusted EBITDA ($16,258) ($165) ($5,817) ($1,817)
Appendix: Non-GAAP Adjusted EBITDA Reconciliation
Adjusted EBITDA represents our net income (loss), adjusted to exclude interest expense associated with debt used for corporate purposes (rather than funding costs associated with lending activities), income tax expense, depreciation and amortization, stock-based compensation expense and warrant liability fair value adjustment. EBITDA is impacted by changes from period to period in the fair value of the liability related to preferred stock warrants. Management believes that adjusting EBITDA to eliminate the impact of the changes in fair value of these warrants is useful to analyze the operating performance of the business, unaffected by changes in the fair value of preferred stock warrants which are not relevant to the ongoing operations of the business. All such preferred stock warrants converted to common stock warrants upon initial our initial public offering in December 2014.
32
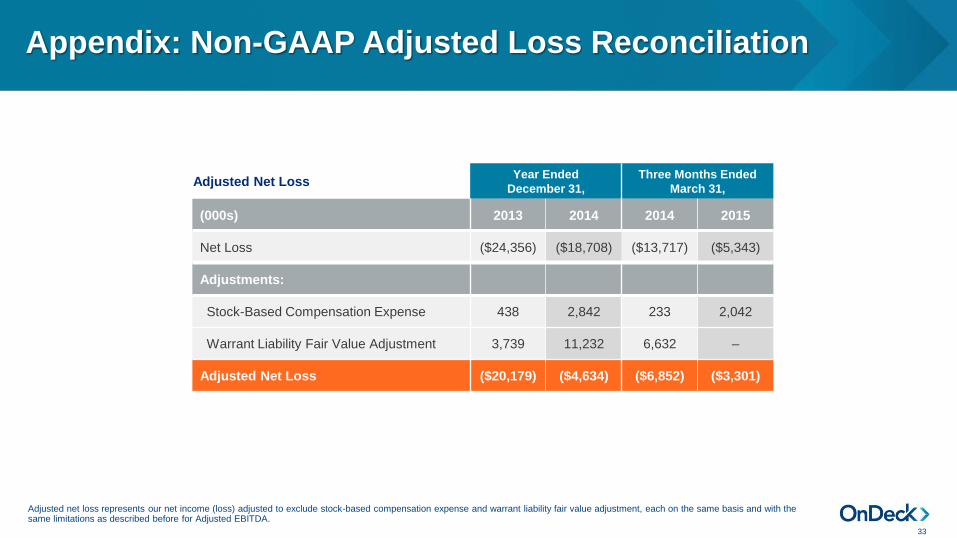
Adjusted Net LossYear Ended
December 31,
Three Months Ended
March 31,
(000s) 2013 2014 2014 2015
Net Loss ($24,356) ($18,708) ($13,717) ($5,343)
Adjustments:
Stock-Based Compensation Expense 438 2,842 233 2,042
Warrant Liability Fair Value Adjustment 3,739 11,232 6,632 –
Adjusted Net Loss ($20,179) ($4,634) ($6,852) ($3,301)
Appendix: Non-GAAP Adjusted Loss Reconciliation
Adjusted net loss represents our net income (loss) adjusted to exclude stock-based compensation expense and warrant liability fair value adjustment, each on the same basis and with the same limitations as described before for Adjusted EBITDA.
33