
Company presentation 20 07 10 def - Gruppo Ascopiave
110
Page 1
Transcript of Company presentation 20 07 10 def - Gruppo Ascopiave

Page 1

Page 2
Contents
Business Overview ............................................................................................
Gas distribution .................................................................................................
Gas sales ............................................................................................................
Photovoltaic power plants ................................................................................
Strategy ..............................................................................................................
Financials ...........................................................................................................
Sinergie Italiane ..................................................................................................
Dividends ...........................................................................................................
Annexes ..............................................................................................................
Pag. 3
Pag. 22
Pag. 35
Pag. 47
Pag. 51
Pag. 64
Pag. 92
Pag. 100
Pag. 104
Page 3
Contents
Business Overview
Group profile .....................................................................................................
Competitive environment: the gas chain in Italy ................................................
Business activities and main financial data .......................................................
Primary business activities ...............................................................................
Secondary business activities ...........................................................................
Ascopiave Group structure as of 31st March 2010 ...........................................
Ascopiave shareholders as of 30th June 2010 .................................................
Equity story before IPO (1956-2006) ................................................................
Initial Public Offering (IPO) ...............................................................................
Use of IPO proceeds ........................................................................................
Equity story after IPO (2007-2010) ...................................................................
Growth in the gas down-stream market in 2007-2009 ......................................
Market positioning ............................................................................................
Pag. 4
Pag. 5
Pag. 6
Pag. 7
Pag. 9
Pag. 11
Pag. 12
Pag. 13
Pag. 14
Pag. 15
Pag. 16
Pag. 17
Pag. 20

Page 4
Group profile
Ascopiave Group operates mainly in the gas sector
Its principal business activities are the distribution and sale of gas to end customers in Northern Italy
In terms of both customer base and quantities of gas sold Ascopiave is currently one of the leading
national players in the gas sector
The Group holds direct licences and consignments to manage its distributing activity
Natural gas is sold through several companies: some of them are subsidiaries in which the Group
is the majority shareholder, while in others the Group holds a 49% interest and joint control with
the other shareholders.
Thanks to its leading role on the market, the Group has been operating as a gas wholesaler and
trader since 2007
Ascopiave Group is active also in the heat management, cogeneration, electricity sales and
production of electricity by photovoltaic power plants
Ascopiave has been listed on the STAR division of the Italian Stock Exchange since 12 December
2006
Page 5
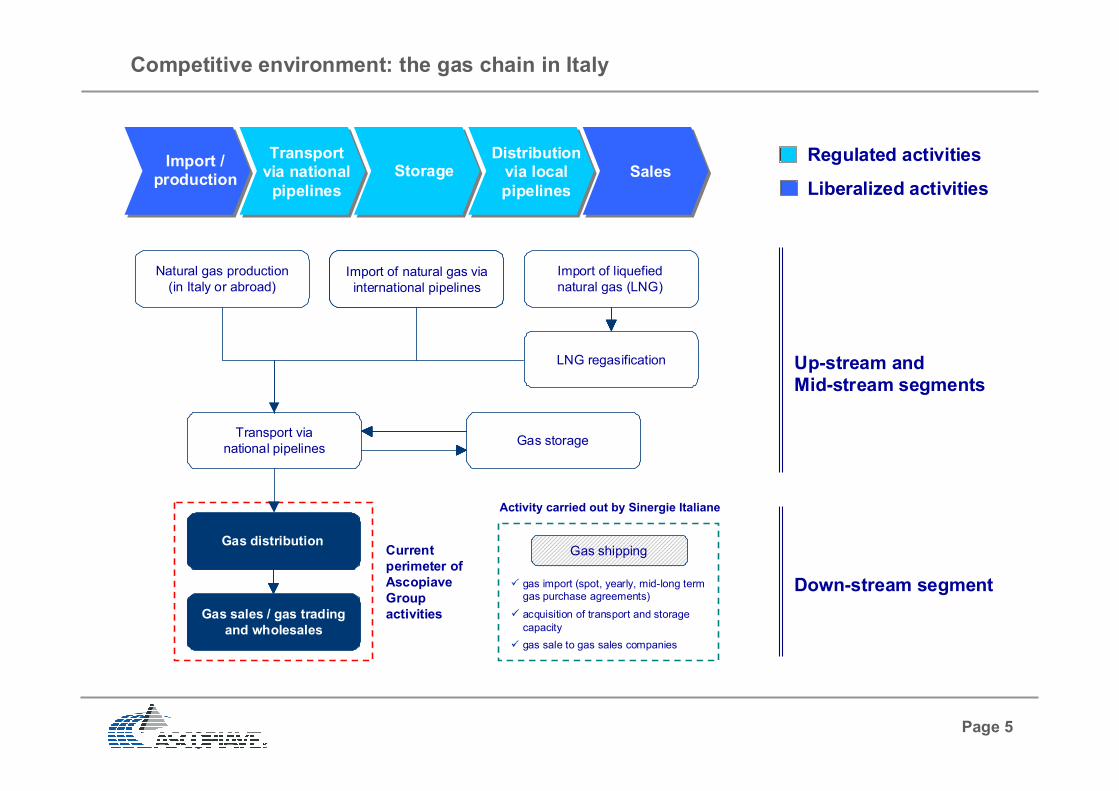
Gas shipping
gas import (spot, yearly, mid-long term
gas purchase agreements)
acquisition of transport and storage
capacity
gas sale to gas sales companies
Activity carried out by Sinergie Italiane
Competitive environment: the gas chain in Italy
Import / production
Transportvia national
pipelines
StorageDistributionvia local
pipelines
SalesRegulated activities
Liberalized activities
Up-stream and
Mid-stream segments
Down-stream segment
Natural gas production
(in Italy or abroad)Import of natural gas via
international pipelines
Import of liquefied
natural gas (LNG)
LNG regasification
Transport via
national pipelinesGas storage
Gas distribution
Gas sales / gas trading
and wholesales
Current
perimeter of
Ascopiave
Group
activities

Page 6
Business activities and main financial data
Gas
distribution
2009 MAIN FINANCIAL DATA*
* Thousand of Euro; ** Distribution SBU includes heating services management, cogeneration and electricity production by
photovoltaic power plants; *** Sales SBU includes gas sales to end customers, gas trading and wholesales and electricitysales; **** Distribution SBU and sales SBU revenues are represented before elisions
Primary business activities
Revenues****
EBITDA
EBIT
764,151
61,545
41,088
Gas
trading and
wholesales
Secondary business activities
Heating
services
managementCogeneration
Electricity
sales
Photovoltaic
power plants
77,177
41,595
27,444
763,483
19,950
13,645
GroupDistribution
SBU**
Sales
SBU***
67%
33%
EBIT 2009
Sales SBU
Distribution SBU
41,088
Gas sales
to end
customers
Page 7
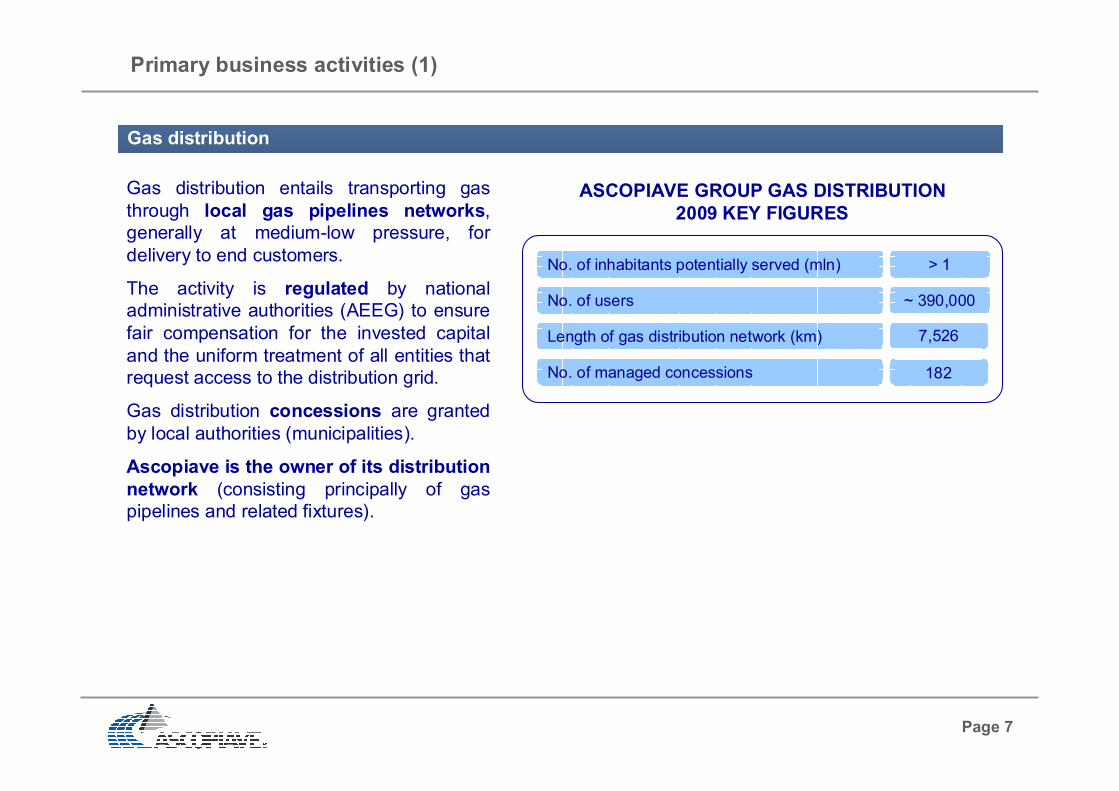
No. of managed concessions 182
Length of gas distribution network (km) 7,526
Gas distribution entails transporting gas
through local gas pipelines networks,
generally at medium-low pressure, for
delivery to end customers.
The activity is regulated by national
administrative authorities (AEEG) to ensure
fair compensation for the invested capital
and the uniform treatment of all entities that
request access to the distribution grid.
Gas distribution concessions are granted
by local authorities (municipalities).
Ascopiave is the owner of its distribution
network (consisting principally of gas
pipelines and related fixtures).
Primary business activities (1)
Gas distribution
ASCOPIAVE GROUP GAS DISTRIBUTION
2009 KEY FIGURES
No. of inhabitants potentially served (mln) > 1
No. of users ~ 390,000
Page 8
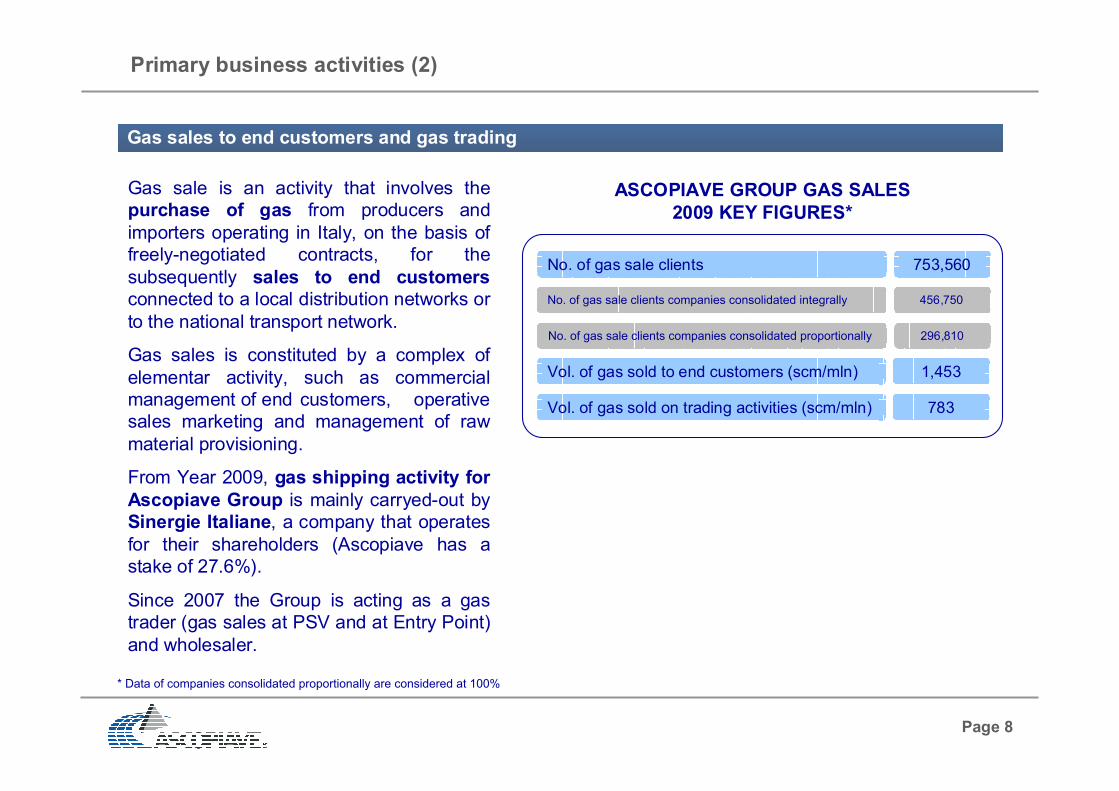
Gas sale is an activity that involves the
purchase of gas from producers and
importers operating in Italy, on the basis of
freely-negotiated contracts, for the
subsequently sales to end customers
connected to a local distribution networks or
to the national transport network.
Gas sales is constituted by a complex of
elementar activity, such as commercial
management of end customers, operative
sales marketing and management of raw
material provisioning.
From Year 2009, gas shipping activity for
Ascopiave Group is mainly carryed-out by
Sinergie Italiane, a company that operates
for their shareholders (Ascopiave has a
stake of 27.6%).
Since 2007 the Group is acting as a gas
trader (gas sales at PSV and at Entry Point)
and wholesaler.
Primary business activities (2)
Gas sales to end customers and gas trading
No. of gas sale clients 753,560
Vol. of gas sold to end customers (scm/mln) 1,453
Vol. of gas sold on trading activities (scm/mln) 783
ASCOPIAVE GROUP GAS SALES
2009 KEY FIGURES*
* Data of companies consolidated proportionally are considered at 100%
No. of gas sale clients companies consolidated integrally 456,750
No. of gas sale clients companies consolidated proportionally 296,810

Page 9
Ascopiave provides other services, such as heating services management, cogeneration, sale of
electricity and production of electricity by photovoltaic power plants.
Heating services management:
Heating division provide to clients, who are principally local administrative organisations, a service that
comprises the following main activities:
management, control, ordinary and extraordinary maintenance of winter heating systems, with the
figure of the ‘third party manager' and fuel supplier, and of summer cooling systems
design of all types of heating and/or air conditioning systems, aimed at implementation and
technological requalification, thereby limiting consumption and fighting atmospheric pollution
design and installation of thermo-regulation systems and tele-management for air conditioning
systems
telematic system monitoring
Cogeneration:
Cogeneration is one of the most common forms of energy recycling. It consist in the simultaneous
generation of electricity and useful heat using a single fuel, as natural gas. Cogeneration technology
provides greater conversion efficiencies than traditional generation methods.
Ascopiave Group works in cogeneration business through the subsidiary Le Cime Servizi.
Secondary business activities (1)
Other activities

Page 10
Electricity sales:
The liberalisation of the electricity market gave to Ascopiave Group the opportunity to add the supply of
electric energy to its traditional gas supply, offering a type of “dual fuel” option for a unified solution to its
customers' energy.
Electricity sales activity is carried out by Ascotrade, Global Energy, Pasubio Servizi, Veritas Energia and
Estenergy.
In 2009 the volumes of electricity sold by the Group amount to 701 GWh*.
Production of electricity by photovoltaic power plants:
Photovoltaic power plants use an array of solar cells that converts solar radiation into direct current
electricity. The photovoltaic generation reenters in the field of renewable energy sources.
In 2008 Ascopiave has constituted AscoEnergy, a company active in the field of electric energy
production using photovoltaic power plant. Ascopiave is majority shareholder with a 70% stake.
During 2009 AscoEnergy acquired 100% stake of Masseria, 100% stake of Lucania, a 50% stake of
Specchiano and constituting Serin (50%).
Secondary business activities (2)
Other activities
* Data of companies consolidated proportionally are considered at 100%

Page 11
89%
100%
49%
100%
100%
100%
70%
48.999%
27.601%
17%
51%
100%
100%
ACTIVITIES
Gas distribution,
heating management
Gas
distribution
Heating
management
Gas sales and
electricity sales
Gas sales
Development of gas storage site
Gas shipping
Photovoltaic
power plants
Gas distribution,
gas sales
100%
51%
Global Energy Group
Ascoenergy Group
100%
100%
50%
50%
Ascopiave Group structure as of 31st March 2010

Page 12
Ascopiave shareholders as of 30th June 2010
Asco Holding
S.p.A.
93
municipalities
ASM Rovigo S.p.A.
NORTHERN
ITALY
Blue Flame S.r.l.
Veneto Sviluppo S.p.A.
Other with a stake <2%
Description of other major shareholders:
ASM Rovigo S.p.A. is the utility company of Rovigo municipality (located in Veneto Region of Italy)
Blue Flame S.r.l. is a private holding company partecipatedby Fassina Group, Quaternario Investimenti S.p.A., Biasuzzi
family, Geo Nova S.p.A. and Investimento NetworkingEuropean Infrastructures Partners-Neip II S.A.
Veneto Sviluppo S.p.A. is an holding company
partecipated with a stake of 51% by Veneto Region of Italy and with a stake of 49% by eleven national and regional
banking groups
Pasubio Group S.r.l. is a company partecipated by 9
municipalities in Province of Vicenza (located in Veneto Region of Italy)
Veneto Banca S.p.A. is a bank of the Veneto Banca GroupCompany’s ownshare
4.399%
2.515%
18.117%
3.545%
61.562%
Pasubio Group S.r.l.
Veneto Banca S.p.A.
8.142%
0.931%
0.789%
Municipalities
shareholders of
Asco Holding
S.p.A.
Description of the majority shareholder:
Asco Holding S.p.A. is an holding company partecipated by 93
municipalities, mainly located in Province of Treviso. It holds capital stake in
Ascopiave S.p.A. and in other companies: Asco TLC S.p.A. (broadband
telecommunications services) and BIM Nuove Energie (heating management)
Page 13
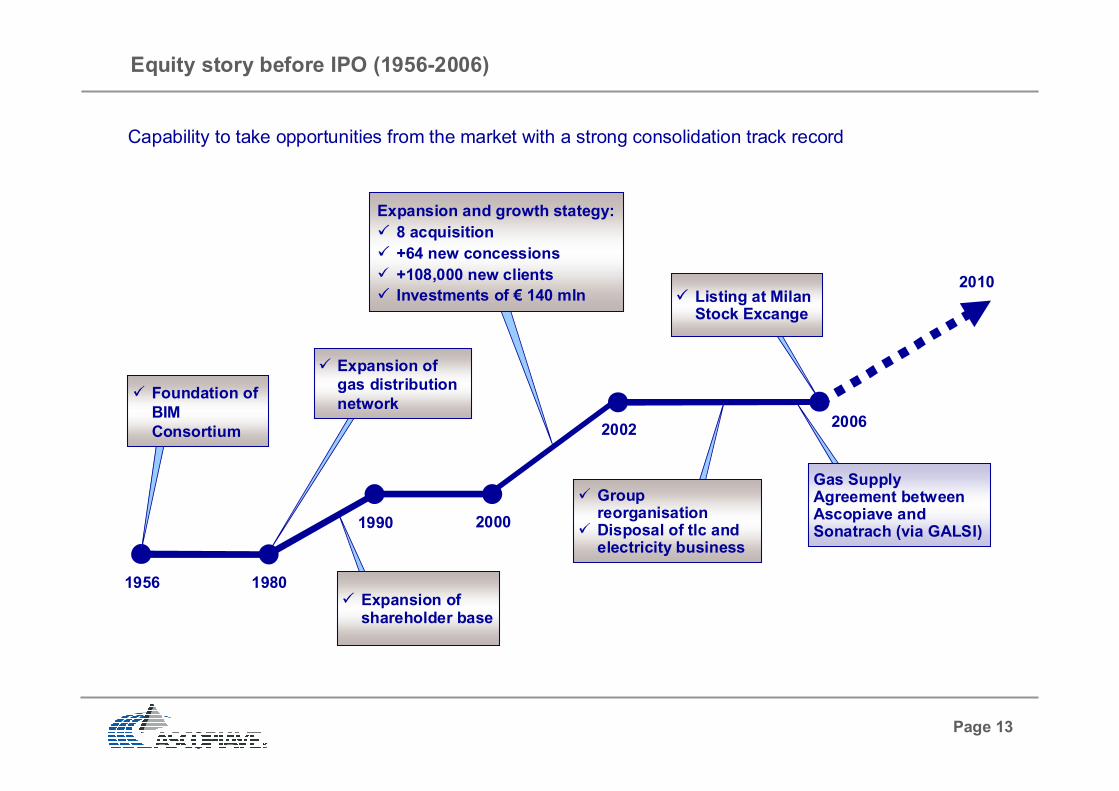
Equity story before IPO (1956-2006)
1956 1980
2000
20022006
2010
1990
Expansion and growth stategy:
8 acquisition
+64 new concessions
+108,000 new clients
Investments of € 140 mln
Expansion of shareholder base
Foundation of
BIM
Consortium
Expansion of gas distribution
network
Group reorganisationDisposal of tlc and electricity business
Listing at Milan Stock Excange
Capability to take opportunities from the market with a strong consolidation track record
Gas SupplyAgreement betweenAscopiave and Sonatrach (via GALSI)

Page 14
Initial Public Offering (IPO)
Ascopiave was listed on Milan Stock Exchange Star segment on 12 December 2006.
Global coordinator, lead manager and sole bookrunner of the institutional offering was Mediobanca - Banca
di Credito Finanziario S.p.A.
The IPO was launched through a public offering for the underwriting of new shares (PUO), following an
increase in the share capital of the company.
Main offering data of the Initial Public Offering
Shares held by Asco Holding after IPO 60%
Shares held by the market after IPO 40%
Placement price* (€/share) 1,80
IPO proceeds** (€/M) 161,3
* Excluded incentives for retail market; ** Increase in share capital net of listing costs
Source: Italian Stock Exchange website
Performance of share price since placement date
Listing allows the Group to implement a plan of growth, pursuing a series of projects in the gas mid-stream
and down-stream segments with the aim of improving its actual position in the italian gas market,
maximizing the return on stakeholders’ capital invested.
1.80
Page 15
Use of IPO proceeds
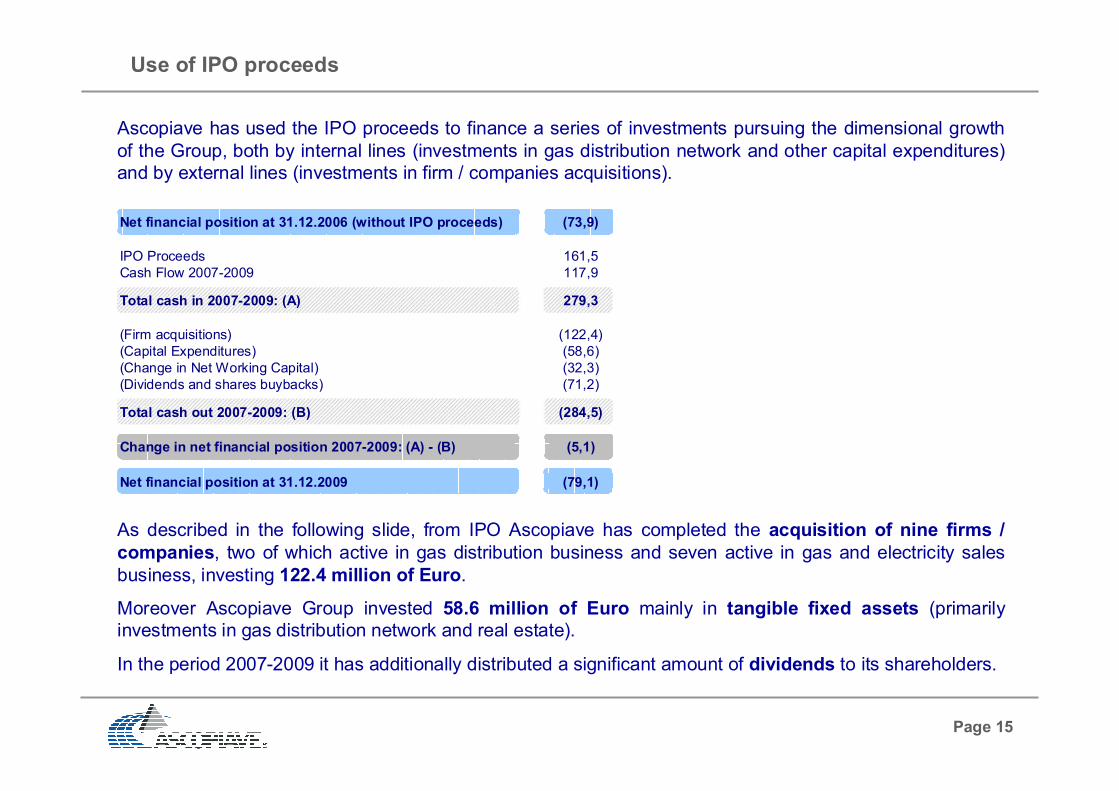
Ascopiave has used the IPO proceeds to finance a series of investments pursuing the dimensional growth
of the Group, both by internal lines (investments in gas distribution network and other capital expenditures)
and by external lines (investments in firm / companies acquisitions).
As described in the following slide, from IPO Ascopiave has completed the acquisition of nine firms /
companies, two of which active in gas distribution business and seven active in gas and electricity sales
business, investing 122.4 million of Euro.
Moreover Ascopiave Group invested 58.6 million of Euro mainly in tangible fixed assets (primarily
investments in gas distribution network and real estate).
In the period 2007-2009 it has additionally distributed a significant amount of dividends to its shareholders.
Net financial position at 31.12.2006 (without IPO proceeds) (73,9)
IPO Proceeds 161,5
Cash Flow 2007-2009 117,9
Total cash in 2007-2009: (A) 279,3
(Firm acquisitions) (122,4)
(Capital Expenditures) (58,6)
(Change in Net Working Capital) (32,3)
(Dividends and shares buybacks) (71,2)
Total cash out 2007-2009: (B) (284,5)
Change in net financial position 2007-2009: (A) - (B) (5,1)
Net financial position at 31.12.2009 (79,1)

Page 16
Equity story after IPO (2007-2010)
2007
2008
200931 dec 2009
2010
IPO
12 dec 2006
New Acquisitions:
Edigas DG (100%)
Edigas Due (100%) (North-Western Italy)
New Acquisition:
Veritas Energia (51%)(North-Eastern Italy)
New Acquisition:
Bimetano Servizi (100%)
(North-Eastern Italy)
New Acquisitions:
ASM DG (100%)ASM Set (49%)
Estenergy (48,999%)
(North-Eastern Italy)
Long-Term Gas SupplyAgreement between SIN IT and Gazprom(2009-2018)
Company set up:
Sinergie Italiane
(SIN IT): 20.01%
New Acquisition:
Pasubio Servizi
(100%)
(North-Eastern Italy)
Increase of
capital stake in
Sinergie Italiane
(SIN IT): 27.6%

Page 17
Number of gas sale customers
Growth in the gas down-stream market in 2007–2009 (1)
(*) Operating data of the companies consolidated proportionally (49% or 51%) are taken into account at 100%
(*) (*)
(*)
NORTHERN
ITALY
Page 18
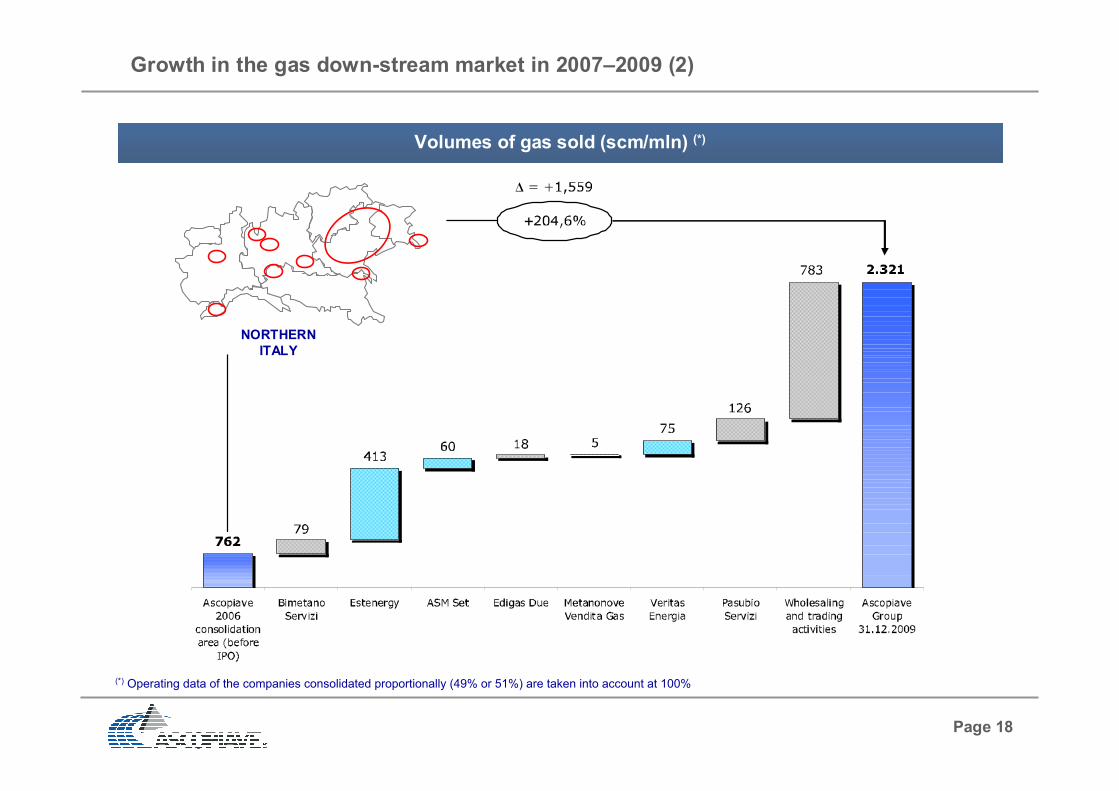
Growth in the gas down-stream market in 2007–2009 (2)
(*) Operating data of the companies consolidated proportionally (49% or 51%) are taken into account at 100%
Volumes of gas sold (scm/mln) (*)
NORTHERN
ITALY

Page 19
Growth in the gas down-stream market in 2007–2009 (3)
Number of gas users
Northern Italy
ITALY
2009
Lenght of gas distribution network
RAB
RAB - before IPO consolidation area
RAB - companies acquired after IPO
6,360 km
223 mln
2006
7,526 km
298 mln
263 mln
35 mln

Page 20
Market positioning (1)
Ranking Gas sale operator
No of gas sale
customers in
Triveneto
%
1 Ascopiave Group 685.000 26,1%
2 ENI 500.000 19,1%
3 Enel Gas 160.000 6,1%
4 Trentino Servizi 130.000 5,0%
5 AGSM Verona 125.000 4,8%
6 AIM Vicenza 115.000 4,4%
7 AMGA Udine 100.000 3,8%
8 Thuega 80.000 3,0%
9 Edison 80.000 3,0%
10 IRIS Gorizia 60.000 2,3%
Altri 588.000 22,4%
Totale 2.623.000 100,0%
FROM 284,000 (2003) TO 685,000 (2008 pro-forma) cagr 03-08: +141,2%
No. of gas sale customers in Triveneto
Triveneto
ITALY
No. of gas sale customers
(*) Operating data of the companies consolidated proportionally (49% or 51%) are taken into account at 100%
(*)
With over 680.000 gas sale customers,
Ascopiave ranks 1st in “Triveneto”

Page 21
Ranking Gas sale operatorsVol. of gas sold in
Italy (Mcm)%
1 Eni 26,862 38.1%
2 Enel 12,799 18.2%
3 E.On 3,927 5.6%
4 Edison 3,428 4.9%
5 Energie Investimenti 3,136 4.5%
6 A2A 2,668 3.8%
7 Ascopiave Group 2,376 3.4%
8 Hera 2,209 3.1%
9 Cir (Sorgenia) 1,142 1.6%
10 Iride 1,107 1.6%
11 E.S.TR.A. Energia 567 0.8%
12 Linea Group Holding 399 0.6%
13 Erogasmet 386 0.5%
14 Gas Plus 371 0.5%
15 Trentino Servizi 313 0.4%
16 Amga - Azienda Multiservizi (Udine) 311 0.4%
Others 8,432 12.0%
Total 70,433 100.0%
Ranking Gas sale operatorsVol. of gas sold in
Italy (Mcm)%
1 Eni 26,862 38.6%
2 Enel 12,799 18.4%
3 E.On 3,927 5.6%
4 Edison 3,428 4.9%
5 Energie Investimenti 3,136 4.5%
6 A2A 2,668 3.8%
7 Hera 2,209 3.2%
8 Ascopiave Group 1,552 2.2%
9 Cir (Sorgenia) 1,142 1.6%
10 Iride 1,107 1.6%
11 E.S.TR.A. Energia 567 0.8%
12 Linea Group Holding 399 0.6%
13 Erogasmet 386 0.6%
14 Gas Plus 371 0.5%
15 Trentino Servizi 313 0.4%
16 Amga - Azienda Multiservizi (Udine) 311 0.4%
Others 8,432 12.1%
Total 69,609 100.0%
Market positioning (2)
The Group has created an industrial pole that, with
more than 1.5 billion of cube meters of gas sold, ranks
8th in Italy
Volumes of gas sold in Italy (a)
(a) In house processing on 2008 AEEG data; (b) Including volumes sold to final market by Ascotrade, Global Energy, Etra Energia, ASM Set, Estenergy, Edigas Due,
Veritas Energia, MetanoNove Vendita Gas and Pasubio Servizi; data of the companies consolidated proportionally are taken into account at 100% (c) Also including volumes sold on wholesaling and trading activities.
(c)
FROM 435 cm/mln (2007) TO 824 cm/mln (2008)Volumes of gas sold by trading activities
(b)
Also considering volumes of gas sold on wholesale /
trading activities the Group, with about 2.4 billion of
cube meters of gas sold, ranks 7th in Italy

Page 22
Contents
Gas distribution
Legal framework ................................................................................................
Expiring date of the ongoing gas distribution concessions ................................
Concessions ......................................................................................................
Ownership of gas distribution network and compensation upon expiry date ......
Decrees to be issues by Ministry of Economic Development ............................
Tariff regulation: third regulatory period .............................................................
Tariff regulation: VRT breakdown ......................................................................
Gas distribution tariffs applied to end customers ...............................................
Tariff equalization system ..................................................................................
SWOT analysis – Distribution SBU ....................................................................
Pag. 23
Pag. 24
Pag. 25
Pag. 26
Pag. 27
Pag. 29
Pag. 30
Pag. 32
Pag. 33
Pag. 34

Page 23
Legal framework
The regulation of the gas sector was reformed considerably in 2000, following the introduction of the
Letta Decree (Legislative Decree No. 164/00), which began the process of liberalising the Italian gas
market.
The liberalization concerns every activity of the gas chain, including gas distribution and gas sale.
Gas distribution was classified as a local public services and had to be awarded by concession for a
maximum of 12 years pursuant to a competitive tender process.
The concessions and direct awards which were already in place when the Letta Decree came into force
would expire:
at 31st December 2012 (or earlier if so provided in the agreement of concession or direct award) for
all concessions and direct awards entered into between gas distributors and local authorities
pursuant to a competitive tender process
at the end of the transition period (or earlier if so provided in the applicable concession or direct
award) for all concessions and direct awards entered into between gas distributors and local
authorities in the absence of a competitive tender process
The transition period is the deadline for the expiry of direct awards and concessions relating to the
distribution of gas not granted through a competitive tender process, initially set at 31st December 2005
and subsequently extended by Milleproroghe Decree at 31st December 2009 and by the local
authorities for a further one year for reason of public interest.

Page 24
Expiring date of the ongoing gas distribution concessions
Regulation concerning the expiring date of the ongoing gas distribution concessions has been modified
several times during the last ten years:
Lgs. D. 164/2000 (so called Letta Decree)
Art. 1 Com. 69, L. 239/2004 (so called Marzano Law)
Art. 46-bis Lgs. D. 159/2007
There are different current interpretations of the regulation, so there is a fundamental uncertainty about
the effective expiring date of the gas concessions.
The next slide illustrates the expiration date of Ascopiave Group concessions in case of the most
prudential and unfavourable interpretation of the actual regulation.
Except for only few concessions granted pursuant to a public competitive tender process, the great part
of the gas distribution concessions managed by Ascopiave Group expires at the end of the so called
“Transition Period”, lasting until 31st december 2009 or, in case of an autonomous and motivated
decision taken by each municipality, until 31st december 2010.
Page 25
6,3%
32,1%
49,7%
10,0%
1,9%
0,0%
10,0%
20,0%
30,0%
40,0%
50,0%
60,0%
Within 31.12.2009 31.12.2010 31.12.2010 31.12.2012 New concessions
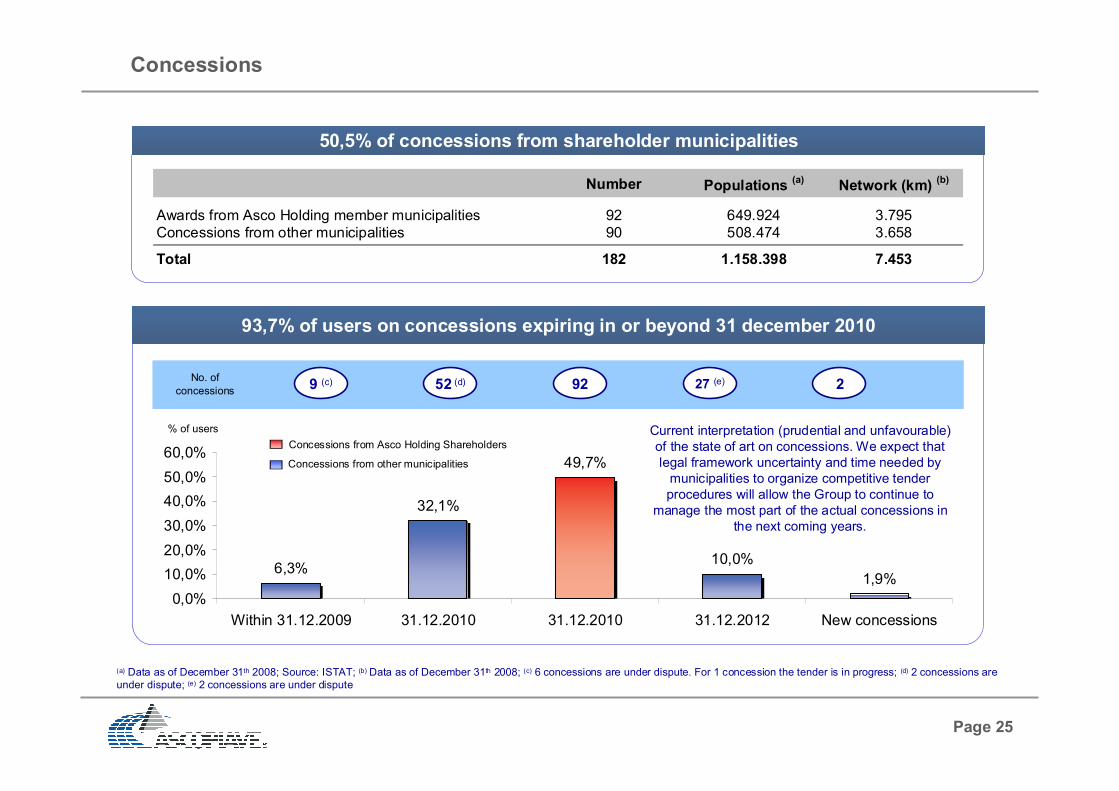
Number Populations (a)
Network (km) (b)
Awards from Asco Holding member municipalities 92 649.924 3.795
Concessions from other municipalities 90 508.474 3.658
Total 182 1.158.398 7.453
Concessions
(a) Data as of December 31th 2008; Source: ISTAT; (b) Data as of December 31th 2008; (c) 6 concessions are under dispute. For 1 concession the tender is in progress; (d) 2 concessions are
under dispute; (e) 2 concessions are under dispute
50,5% of concessions from shareholder municipalities
93,7% of users on concessions expiring in or beyond 31 december 2010
% of users
Concessions from Asco Holding Shareholders
Concessions from other municipalities
No. of
concessions29 (c) 52 (d) 92 27 (e)
Current interpretation (prudential and unfavourable)
of the state of art on concessions. We expect that
legal framework uncertainty and time needed by
municipalities to organize competitive tender
procedures will allow the Group to continue to
manage the most part of the actual concessions in
the next coming years.

Page 26
Ownership of gas distribution network and compensation upon expiry date
Ascopiave is the owner of gas distribution networks in municipalities in which it operates.
In accordance with Letta Decree, at the end of concessions or at the end of transition period, local
authorities must award gas distribution concessions, which must last no longer than 12 years, pursuant to
a competitive tender process.
If Ascopiave didn’t win next competitive tender, it would be entitled to receive a compensation.
Royal Decree 2578 – Industrial value of the network
The compensation is calculated in accordance with the terms of the agreement implementing the
concession or direct award (as the case may be) or, if this is not provided for, in accordance with
criteria set out in Royal Decree 2578 of 1925 (the “industrial value of the network”).
The elements set out in Royal Decree 2578 of 1925 to be used in calculating the compensation due
include (i) the industrial value of the network, moveable assets and real property, taking into
consideration the age of such assets and any renovations made thereto and provisions in the
concession or direct award relating to the ownership of the assets at the end of the concession or
direct award (as the case may be); (ii) advances or subsidies granted by the awarding municipalities,
as well as any registration taxes paid in advance by the concession or direct award holder (as the case
may be) and any premia paid to the awarding municipalities, taking into consideration the items
referred to in above; and (iii) loss of profit that the concession or direct award holder will suffer as a
result of the termination of the concession or direct award (as the case may be).

Page 27
Decrees to be issues by Ministry of Economic Development (1)
Regulation of the “minimum territorial district”
Minimum territorial district - joining a pool of municipalities with a minimum number of users - to be
defined by the Ministry of Economic Development (jointly with other public authorities).
Tasks: 1) Reducing the number of tenders
2) Reducing the number of operators, permitting them to achieve an optimal size,
improving efficiency through economies of scale
The Law No. 166/2009 specified that minimum territorial district must be determined within 31st
December 2012 by Ministry of Economic Development.
Draft under discussion:
127 / 129 minimum territorial district:
• > 300.000 end-users: metropolitan areas (Rome, Milan, Turin, Naples, Genua and Palermo)
• 300.000 – 100.000 end-users (one or more district inside one mid or large province)
• < 100.000 end users (small provinces with less than 100.000 end users)

Page 28
Decrees to be issues by Ministry of Economic Development (2)
Regulation of the “call of tenders”
Regulation of the “call of tenders” to be provided by the Ministry of Economic Development (jointly
with other public authorities).
Main issues: 1) Value of the assets to be paid to the outgoing concession holder
2) Standards of economic and technical offer
3) Employment of the work force of the outgoing concession holder
Draft under discussion
1) Unless different agreement by the parts: costruction cost: reference to price lists established by local chamber of
commerce or other local authorities or AEEG / useful life: established by Decree
2) It should be evaluated:
• investment plan (development, renewal, maintenance and innovation)
• technical offer concerning safety and continuity of the distribution service (network inspections, odorisation,
emergency services, gas leaks, cathodic protection and continuity of service) and quality (standards of the
execution of works, the connection, disconnection and re-connection of gas supplies to customers, appointments and the levels of adherence thereto, meter-reading, the checking of supply pressure, written
complaints or requests for information and call centre services)
• economic offer concerning discount on prices paid by end-customers for services, amount of additional investments for network extension and new connections
3) Work force of the outgoig concession holder should be partially employed by the new concession holder. Number of
employees should be proportional to the number of end-users of the minimum territorial district.
Page 29
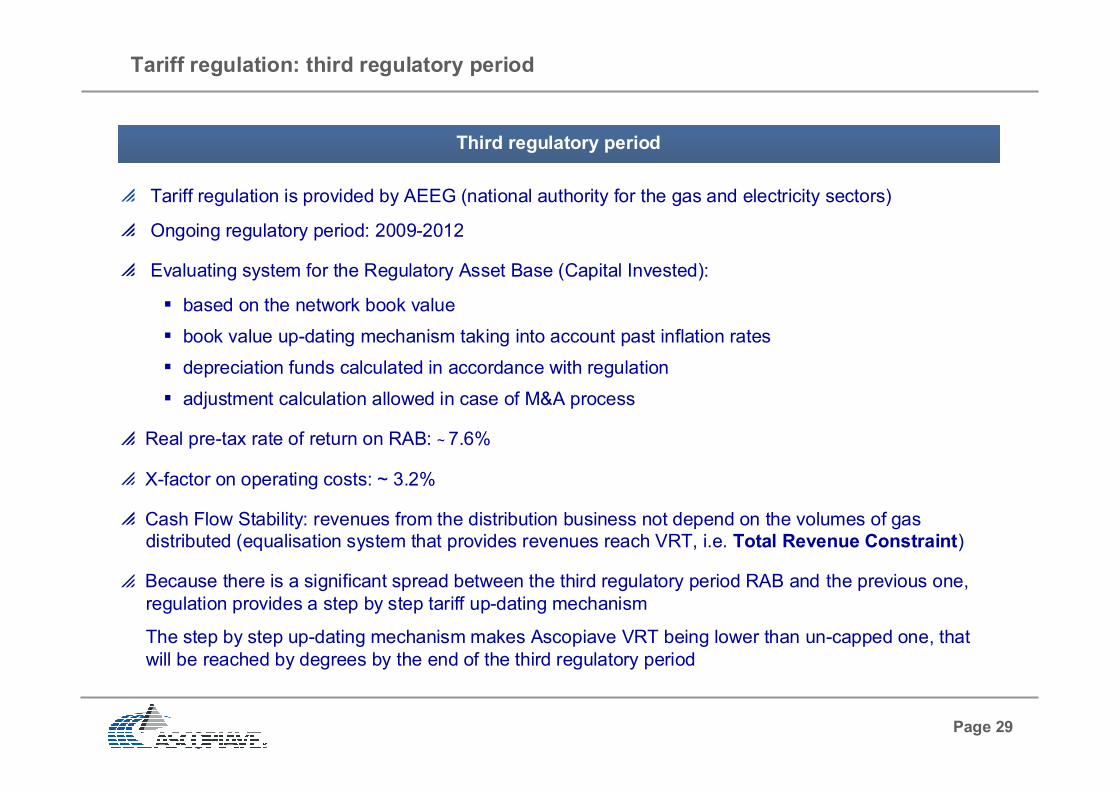
Tariff regulation: third regulatory period
Tariff regulation is provided by AEEG (national authority for the gas and electricity sectors)
Ongoing regulatory period: 2009-2012
Evaluating system for the Regulatory Asset Base (Capital Invested):
based on the network book value
book value up-dating mechanism taking into account past inflation rates
depreciation funds calculated in accordance with regulation
adjustment calculation allowed in case of M&A process
Real pre-tax rate of return on RAB: ~ 7.6%
X-factor on operating costs: ~ 3.2%
Cash Flow Stability: revenues from the distribution business not depend on the volumes of gas
distributed (equalisation system that provides revenues reach VRT, i.e. Total Revenue Constraint)
Because there is a significant spread between the third regulatory period RAB and the previous one,
regulation provides a step by step tariff up-dating mechanism
The step by step up-dating mechanism makes Ascopiave VRT being lower than un-capped one, that
will be reached by degrees by the end of the third regulatory period
Third regulatory period

Page 30
2010 AMM
22%
2010 CO
36%
2010 CI x rd
41%
VRT = CO + AMM + CI x rd
where:
CO: represents the tariff quota covering
management operating costs
AMM: represents the quota covering
depreciation
CI: represents the net capital invested in
distribution
rd: represents the real, pre-tax rate of return
on net invested capital (~ 7.60%)
2010 RAB:
capped RAB: 319,3 €/mln
un-capped RAB: 347,6 €/mln
Tariff regulation: VRT breakdown (1)
2010 VRT (*) (“Vincolo dei Ricavi Ammesso”, i.e. 2010 Total Revenue Constraint)
2010 VRT (Thousand of Euro)
2010 CO 20,570
2010 AMM 12,606
2010 CI x rd 24,332
Total 2010 VRT (*) 57,508
2010 RAB 319,321
(*) Ascopiave 2010 VRT has been approved by Gas and Electricity Authority (AEEG) with Resolution n. 206/09.

Page 31
Tariff regulation: VRT breakdown (2)
21,1 20,6 20,6
10,9 12,6 14,6
22,724,3
26,5
0,0
10,0
20,0
30,0
40,0
50,0
60,0
70,0
VRT 2009 2010 VRT 2010 VRT
UN-CAPPED
CI x rd
AMM
CO
+€ 4,1M
2009 VRT 2010 VRT2010 VRT
UN-CAPPED
CHANGE
2009-2010 VRT
CHANGE
2010 VRT
CO 21,123 20,570 20,570 -0,553 0,000
AMM 10,901 12,606 14,588 1,706 1,982
CI x rd 22,687 24,332 26,482 1,645 2,150
Total VRT 54,710 57,508 61,640 2,798 4,132
RAB 297,697 319,321 347,603 21,624 28,282
The difference between 2010 VRT and 2009 VRT is equal to
+2.8 €/mln and is due for -0.6 €/mln to CO component, for
+1.7 €/mln to AMM component and for 1.6 €/mln to CI x rd
component.
The difference between 2010 RAB and 2009 RAB is equal to
+21.6 €/mln.
The difference between 2010 VRT and 2010 VRT un-capped
is equal to +4.1 €/mln and is due for +2.0 €/mln to AMM
component and for +2.1 €/mln to CI x rd component.
The difference between 2010 RAB and 2010 RAB un-capped
is equal to +28.3 €/mln.
Comparison between Ascopiave Group 2009 VRT, 2010 VRT and 2010 VRT UN-CAPPED
VRT
components

Page 32
T3(dis) Variable component destined to remunerate distribution service
T1(cot) Fixed component destined to remunerate commercialization of gas distribution and metering services
T1(mis) Fixed component destined to remunerate metering service
Fixed component destined to remunerate distribution serviceT1(dis)
During the third regulatory period, gas distribution tariffs applied by gas distributors to
their customers are determinated by AEEG. Tariffs are up-dated annually.
Gas distribution tariffs are defined for tariff areas* and are articolated in the following
components (gas distribution and gas metering services):
Gas distribution tariffs applied to end customers
(*) Represent the geographic areas where are applied the same gas distribution and gas metering tariffs. Six tariff areas are been identified in the whole italian
national territory (see the figure); (**) UG1, UG2, GS, RE and RS represent additional components of the gas distribution tariff, paid by final customers to nationalfunds managed by public authorities (“Cassa Conguaglio per il Settore Elettrico” and AEEG)
RE** Variable component destined to cover charges for interventions tied to energy saving and to development of renewable sources
UG1** Variable component destined to cover possible unbalances and/or balance of tariff equalization systems
UG2** Component, in part fixed and in part variable, destined to compensate detailed sale commercialization costs
GS** Variable component destined to cover tariff compensation system for poor economically customers
RS** Variable component destined to cover charges for interventions tied to quality of gas distribution and metering
TARIFFAREAS
North-West
North-East
Central
Central-South-West
Central-South-East
South

Page 33
Tariff regulation provides a revenues equalization system - managed by a national authority (i.e. “Cassa
Conguaglio per il Settore Elettrico”) - that makes the gas distribution revenues of each distributor equal its
pre-determined Total Revenues Costraint (“Vincolo dei Ricavi Ammesso” or “VRT”).
Equalization system provides gas distributor: [1] receive money from “Cassa Conguaglio” if the total annual
amount of distribution tariffs applied to its end customers is lower than VRT; [2] pay money to “Cassa
Conguaglio” if the same amount is higher than VRT.
Tariff equalization system
Tariff equalization mechanism
VRT =
revenues
[1]
Amount to
be received
by Cassa
ConguaglioTariffs
applied to
end
customers
VRT =
revenues
[2]
Amount to
be payd to
Cassa
ConguaglioTariffs
applied to
end
customers
Page 34
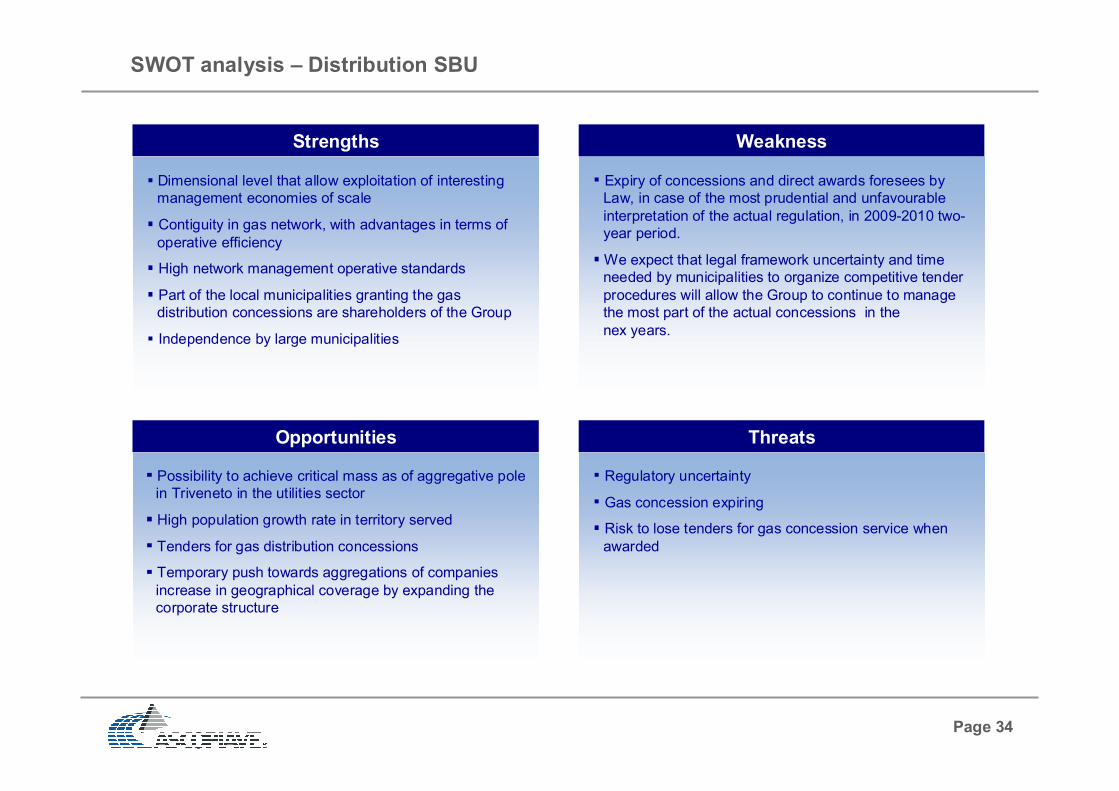
SWOT analysis – Distribution SBU
ThreatsOpportunities
Weakness
Expiry of concessions and direct awards foresees by
Law, in case of the most prudential and unfavourable
interpretation of the actual regulation, in 2009-2010 two-
year period.
We expect that legal framework uncertainty and time
needed by municipalities to organize competitive tender
procedures will allow the Group to continue to manage
the most part of the actual concessions in the
nex years.
Regulatory uncertainty
Gas concession expiring
Risk to lose tenders for gas concession service when
awarded
Possibility to achieve critical mass as of aggregative pole
in Triveneto in the utilities sector
High population growth rate in territory served
Tenders for gas distribution concessions
Temporary push towards aggregations of companies
increase in geographical coverage by expanding the
corporate structure
Dimensional level that allow exploitation of interesting
management economies of scale
Contiguity in gas network, with advantages in terms of
operative efficiency
High network management operative standards
Part of the local municipalities granting the gas
distribution concessions are shareholders of the Group
Independence by large municipalities
Strengths

Page 35
Contents
Gas sales
Legal framework ................................................................................................
Volumes of gas sold by the Group .....................................................................
Gas sales to end customers: market segmentation and selling prices ...............
Gas sales on trading activities: market segmentation and selling prices ............
Gas purchasing costs ........................................................................................
Gas selling price to domestic end customers .....................................................
Review of QVD component ................................................................................
Review of CCI component .................................................................................
Swot analysis – Sales SBU ................................................................................
Pag. 36
Pag. 37
Pag. 38
Pag. 39
Pag. 40
Pag. 41
Pag. 44
Pag. 45
Pag. 46

Page 36
Legal framework
The liberalization of the Italian gas sector begun with the introduction of the Legislative Decree No.
164/00 (so called Letta Decree).
The liberalization concerns every activity of the gas chain, including gas distribution and gas sale.
Gas sale market liberalization
Gas sale segment has been completely liberalized since 2003:
Each end customers can freely negotiate gas supply contract with every gas sale operator active
in the market
AEEG established maximum price level for domestic customers

Page 37
Volumes of gas sold by Ascopiave
Group to end customers: 65%
Volumes of gas sold by the Group
To end customers of companies
consolidated integrally(a)
886.2
To end customers of companies
consolidated proportionally(b)
566.5
To end customers (a)+(b)
1,452.7
On trading activities (c)
783.1
Volumes of gas sold (a)+(b)+(c)
2,235.8
(*) Operating data of the companies consolidated proportionally (49% or 51%) are taken into account at 100%
1.453
783
0
200
400
600
800
1.000
1.200
1.400
1.600
1.800
Gas sold to end
customers
Gas sold on trading
and wholesaling
activities
65.0%
35.0%
Volumes of gas sold by the Group
2009 data (scm/million)

Page 38
Gas sales to end customers: market segmentation and selling prices
Small business
customers~ 20%
Business and small
business customers~ 30%
Volumes of gas sold
to end customers*1,452.7
(*) 2009 data in million of standard cubic meter. Operating data of the companies consolidated proportionally (49% or 51%) are taken into account at 100%.
Domestic customers ~ 50%Mandatory maximum price level set by
the Authority of Energy and Gas
Volumes of gas sold to end customers
Market segmentationPricing
Completely free prices; mainly price
discounts on standard level prices
Prices tailored on the individual consumption
demand and capacity requirement

Page 39
Gas sales on trading activities: market segmentation and selling prices
Volumes of gas sold on trading activities
Market segmentationPricing
Entry Point ~ 19%
Wholesales ~ 6%
Volumes of gas sold
on trading activities*783.1
PSV ~ 75%
(*) 2009 data in million of standard cubic meter. Operating data of the companies consolidated proportionally (49% or 51%) are taken into account at 100%.
Completely free prices
Completely free prices
Completely free prices (fixed mark-up on the
corresponding purchasing cost - back to back)

Page 40
Gas purchasing costs
Sales on trading activity~ 35% volumes
Sales to end customers~ 65%volumes
Actually: annual contracts (thermal year)
Delivery: entry of local distribution network
Penalty for excess capacity use
Gas purchasing costs are negotiated on a free market
Incumbent shippers have strong market position
The shipping company Sinergie Italiane (27.6% Ascopiave) is the main gas supplier of the Group (~
60% of estimated volumes sold to end customerss in thermal year 2009-2010)
Gas purchasing costs
Uses Sourcing
Actually: spot back to back contracts

Page 41
RGCT Regional supplement to gas consumption tax
Gas consumption taxGCT
Gas selling price to domestic end customers (1)
Gas price applicated to domestic end customers is determinated by AEEG and is articolated in the following
components, each of them destinated to remunerate a particular activity of the gas chain:
Tariff component, articulated in a fixed part and in a variable part, relative to detailed sale commercializationQVD
QTI Tariff component relative to transport service, updated yearly by gas transport company with effective date as of 1st October
QS Tariff component relative to storage service, updated yearly by AEEG with effective date as of 1st April
QOA Tariff component relative to additional charge, constituted by sum of PHI, CVI, CCONR and CFGUI elements
CCI Tariff component relative to wholesaling commercialization (raw material), updated quarterly by AEEG
All components, except for TD, are determined in accordance with Res. No. 64/09.
In addition to the components described above, the end customers is obliged to pay the following duties
and taxes:
VAT Value Added Tax
GCT
Tariff component, articulated in a fixed part and in a variable part, relative to gas distribution (gas distribution tariff)TD

Page 42
36%
14%4%
27%
14%
4%1%
CCI
QT
QS
QOA
TD
QVD
GCT
VAT
Gas selling price to domestic end customers (2)
Gas selling price to a typical domestic end customer (annual consumption: 1,400 scm)
CCI = wholesale cost of gas
QT = transportation cost via national network
QS = storage cost of gas
QOA = additional fees
TD = Distribution tariff
QVD = Retail sale cost
GCT = Gas consumption taxes
VAT = Value added tax
P = CCI + QT + QS + QOA + TD + QVD + GCT + VATP = CCI + QT + QS + QOA + TD + QVD + GCT + VAT
1st january 2010 (Municipality: Conegliano)
Price component Eurocent / scm %
CCI 24,52 35%
QT 3,15 4%
QS 1,04 1%
QOA 0,22 0%
TD 9,89 14%
QVD 3,11 4%
Price 41,93 60%
GCT 18,41 26%
VAT 10,00 14%
Taxes 28,41 40%
Price + taxes 70,34 100%

Page 43
Gas selling price to domestic end customers (3)
(Data in €cent/scm)
Gas selling price to domestic end customers: from 3rdQ 2009 to 2ndQ 2010
National average price of natural gas for a family with autonomous heating and annual gas consumption
of 1,400 scm.
Page 44
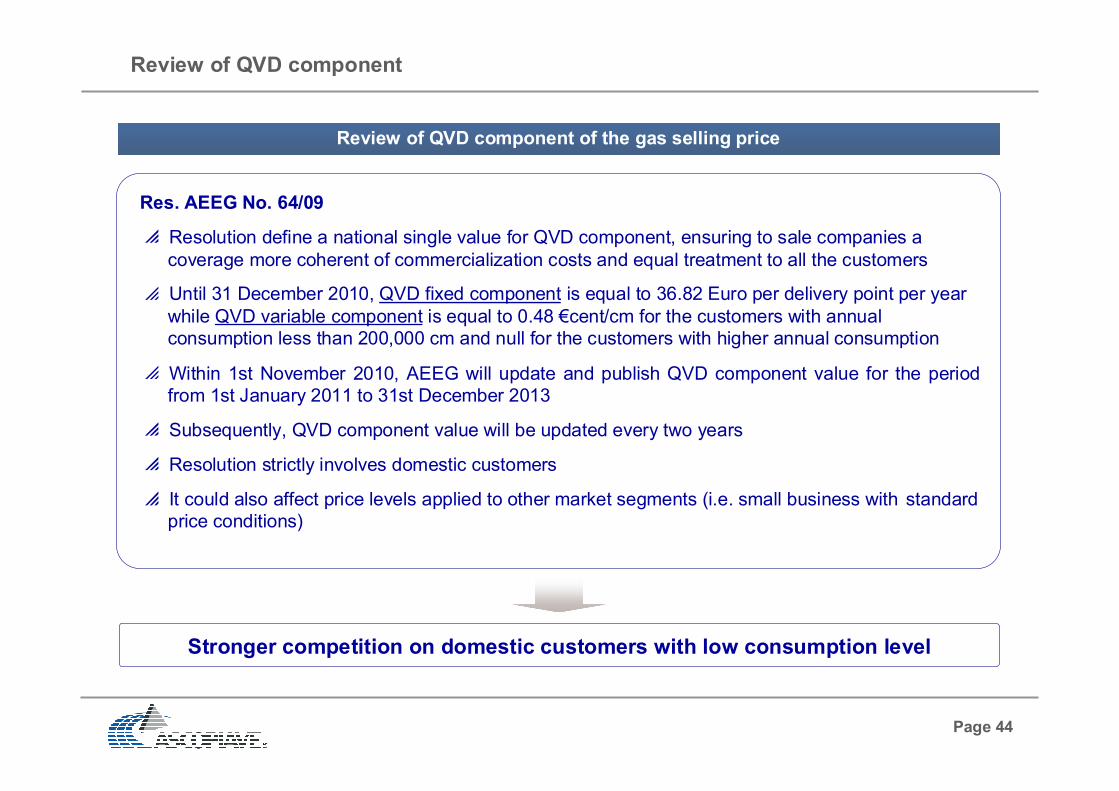
Review of QVD component
Review of QVD component of the gas selling price
Stronger competition on domestic customers with low consumption level
Res. AEEG No. 64/09
Resolution define a national single value for QVD component, ensuring to sale companies a
coverage more coherent of commercialization costs and equal treatment to all the customers
Until 31 December 2010, QVD fixed component is equal to 36.82 Euro per delivery point per year
while QVD variable component is equal to 0.48 €cent/cm for the customers with annual
consumption less than 200,000 cm and null for the customers with higher annual consumption
Within 1st November 2010, AEEG will update and publish QVD component value for the period
from 1st January 2011 to 31st December 2013
Subsequently, QVD component value will be updated every two years
Resolution strictly involves domestic customers
It could also affect price levels applied to other market segments (i.e. small business with standard
price conditions)

Page 45
Review of CCI component
Review of CCI component of the gas selling price
Selling price reduction should be compensated by lower gas purchasing cost
Res. AEEG No. 89/10
Since 1st october 2010
It modified the formula with which quarterly update the reference gas price
It foresee a reduction of CCI variable component allowing a money saving for the customers
during all the thermal year 2010-2011
Resolution strictly involves domestic customers
It could also affect price levels applied to other market segments (i.e. small business with standard
price conditions)

Page 46
SWOT analysis – Sales SBU
ThreatsOpportunities
Weakness
Limited diffusion and knowledge of the brand outside of
the region served
Risk exposure connected to gas purchase cost
Activity partially regulated by the Italian Electricity and
Gas Authority
Competition in a fully liberalizated market
Competitive pressure increase and attacks from new
entrants
Enel’s role in dual-fuel market
Entrance and consolidation of foreign groups and major
Italian utilities
Presence into territory with good development capability
in the segment of residential customers
Presence in territory with high population growth rate
Opportunity to acquire new customers into locations not
served by distribution SBU
Total market ‘opening’ (also for electricity, as of 1 July
2007) – Cross selling on customer base
Infrastructure development projects likely to increase the
country’s gas importing capacity and create business
opportunities abroad
Large end customer base
High per-capita consumption
Front offices capillarity
Low switch rate
Efficient customer care service
Differentiation of offered services (dual fuel)
Independence by big customers
Deeply rooted presence in reference geographical area
Strong local brand reputation
Low credit losses
High degree of customer loyalty
Strengths

Page 47
Contents
Photovoltaic power plants
AscoEnergy business model ..............................................................................
Ascopiave Group and Casillo Group Joint Venture ............................................
Specchiano S.r.l. ................................................................................................
Pag. 48
Pag. 49
Pag. 50

Page 48
AscoEnergy business model
AscoEnergy business model
AscoEnergy business model contemplates a mix of direct project development and acquisition of projects
developed by third parties (Joint Ventures are preferred).
For what concerns direct developments, AscoEnergy manages the high value added activities like
authorization process and grid connection.
Plant
Localization
Plant
LocalizationAuthorization
Process
Authorization
ProcessPlant
Realization
Plant
RealizationGrid
Connection
Grid
ConnectionOperation &
Maintenance
Operation &
Maintenance
FinancingFinancing
Ascoenergy Developed ProjectsAscoenergy Developed Projects
Activities directly managed by AscoEnergy
Activities commissioned to third parties

Page 49
Ascopiave Group and Casillo Group Joint Venture
Ascopiave S.p.A.Casillo Partecipazioni S.r.l.
100%70% 30%
50%50%
Agroenergetica S.r.l. AscoEnergy S.r.l.
100% 100% 100% 100% 100%
Bioenergy Italia S.r.l.
Serin S.r.l.
New Co. 1
100%
Specchiano S.r.l. Lucania S.r.l.
New Co. 2 Masseria S.r.l. New Co. 3
Ascopiave Group and Casillo Group Joint Venture
Page 50
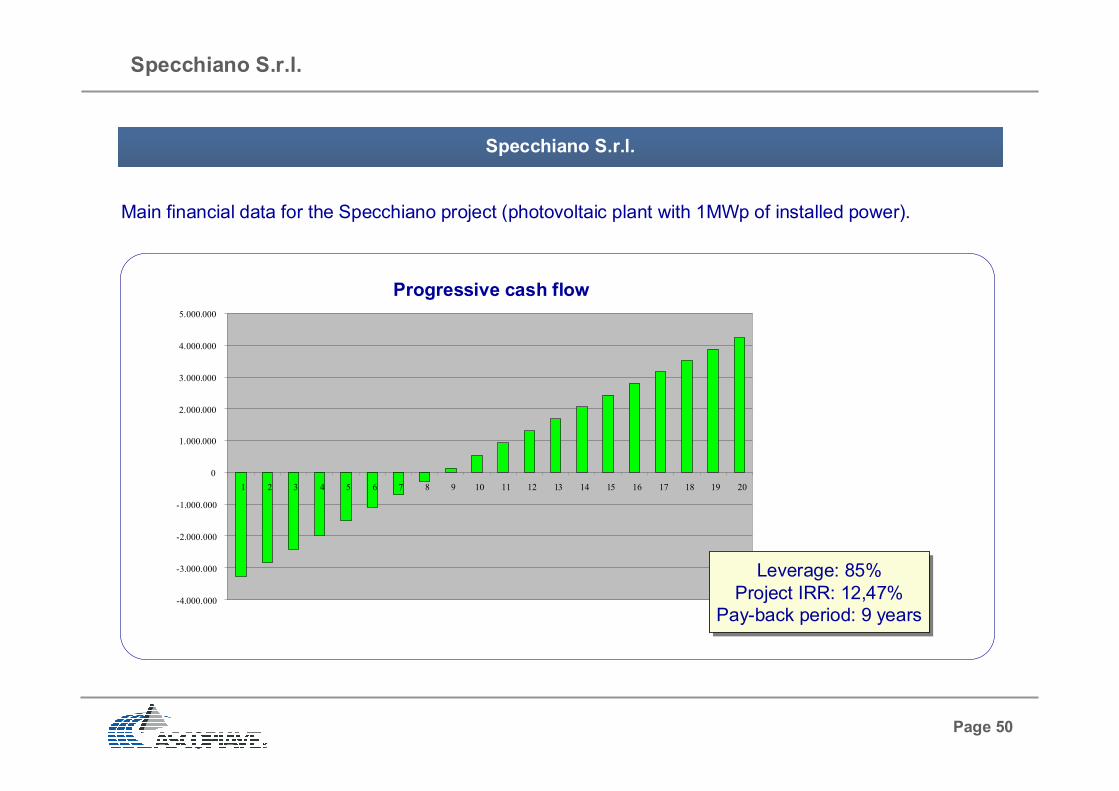
Specchiano S.r.l.
Specchiano S.r.l.
Main financial data for the Specchiano project (photovoltaic plant with 1MWp of installed power).
Progressive cash flow
-4.000.000
-3.000.000
-2.000.000
-1.000.000
0
1.000.000
2.000.000
3.000.000
4.000.000
5.000.000
1 2 3 4 5 6 7 8 9 10 11 12 13 14 15 16 17 18 19 20
Leverage: 85%
Project IRR: 12,47%
Pay-back period: 9 years
Leverage: 85%
Project IRR: 12,47%
Pay-back period: 9 years

Page 51
Contents
Strategy
Strategic guidelines and objectives ....................................................................
Growth in the down-stream market ....................................................................
Growth in the down-stream market: model ........................................................
Import infrastructures and new projects .............................................................
Long term supply agreement with Sonatrach .....................................................
Leading role in Sinergie Italiane .........................................................................
Sinergie Italiane Shareholders ...........................................................................
Sinergie Italiane: volumes ranking .....................................................................
Sinergie Italiane: supply opportunity ..................................................................
Long term supply agreement with Gazprom ......................................................
Pag. 52
Pag. 54
Pag. 55
Pag. 56
Pag. 57
Pag. 58
Pag. 59
Pag. 60
Pag. 61
Pag. 62
Page 52
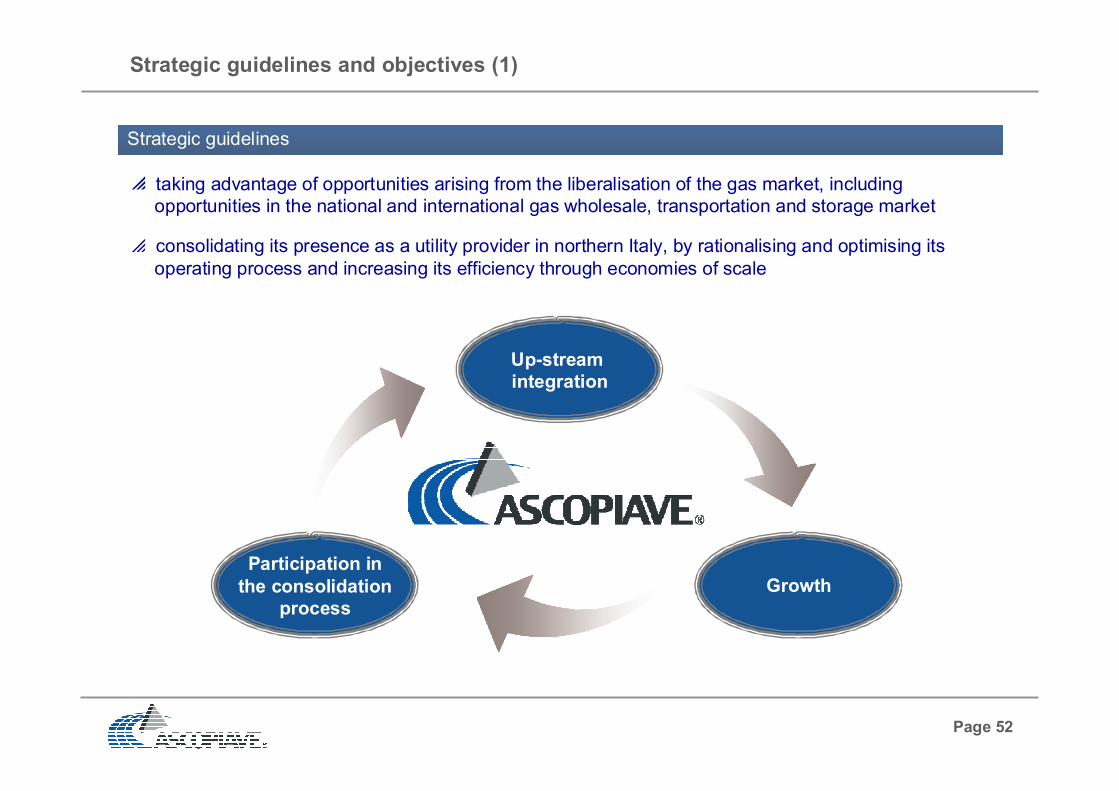
Strategic guidelines and objectives (1)
taking advantage of opportunities arising from the liberalisation of the gas market, including
opportunities in the national and international gas wholesale, transportation and storage market
consolidating its presence as a utility provider in northern Italy, by rationalising and optimising its
operating process and increasing its efficiency through economies of scale
Up-stream
integration
Participation in
the consolidation
process
Growth
Strategic guidelines

Page 53
Strategic guidelines and objectives (2)
Long term autonomous and diversified supplying system by an up-stream
integration in the gas value chain
OBJECTIVES
• Maximizing and stabilizing margins - minimizing commodities risks
• Increasing volume sold
• Less than 90% supplied by incumbents
• Improvement and exploitation of internal competences and know how
Dimensional growth by a significant increase of the customer base and of the volumes
sold consolidating the leadership in the North-East and a national role
• FOCUSED CAPACITY ACQUISITION (LNG, PIPE, STORAGE)
• SONATRACH GSA – GAZPROM GSA (VIA SINERGIE ITALIANE)
• OTHERS MEDIUM / LONG TERM AGREEMENTS
• GROWTH VIA ACQUISITION (“EXTERNAL GROWTH”)
• “ORGANIC GROWTH”
• TRADING AND WHOLESALING
• RETENTION OF OWN END USERS (via dual fuel and cross selling strategies)
Page 54
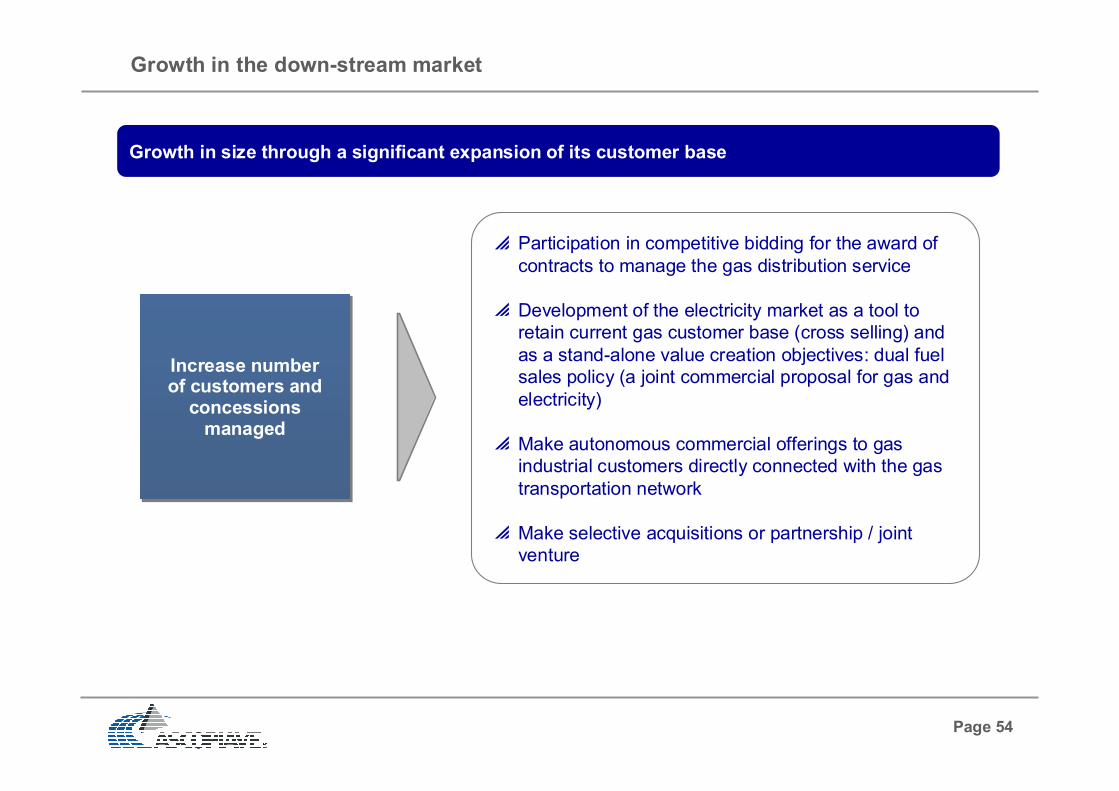
Growth in the down-stream market
Growth in size through a significant expansion of its customer base
Increase numberof customers and concessions managed
Increase numberof customers and concessions managed
Participation in competitive bidding for the award of
contracts to manage the gas distribution service
Development of the electricity market as a tool to
retain current gas customer base (cross selling) and
as a stand-alone value creation objectives: dual fuel
sales policy (a joint commercial proposal for gas and
electricity)
Make autonomous commercial offerings to gas
industrial customers directly connected with the gas
transportation network
Make selective acquisitions or partnership / joint
venture
Page 55
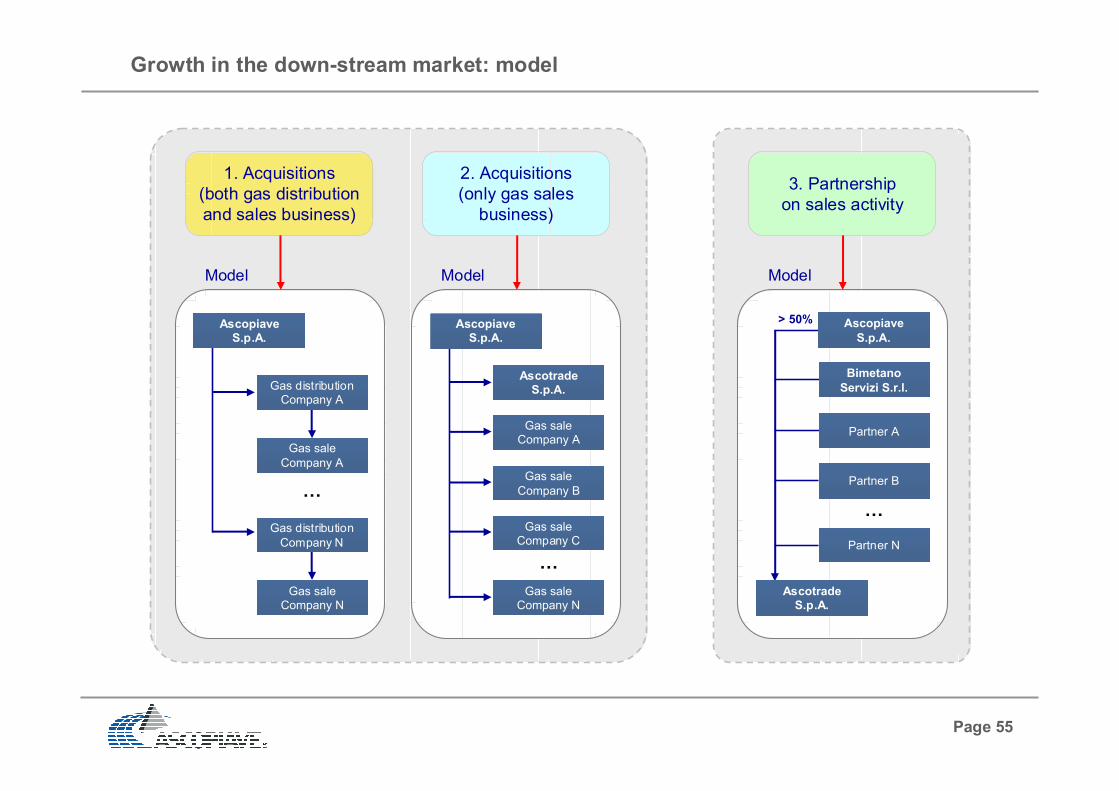
Growth in the down-stream market: model
1. Acquisitions
(both gas distribution
and sales business)
Gas sale
Company B
Gas saleCompany C
Gas saleCompany N
AscopiaveS.p.A.
Gas saleCompany A
Ascotrade S.p.A.
…
2. Acquisitions
(only gas sales
business)
Model
3. Partnership
on sales activity
Ascotrade S.p.A.
Partner A
Partner B
Partner N
Bimetano
Servizi S.r.l.
Ascopiave
S.p.A.
…
> 50%
Model
AscopiaveS.p.A.
…
Model
Gas sale
Company A
Gas distributionCompany A
Gas saleCompany N
Gas distribution
Company N
Page 56
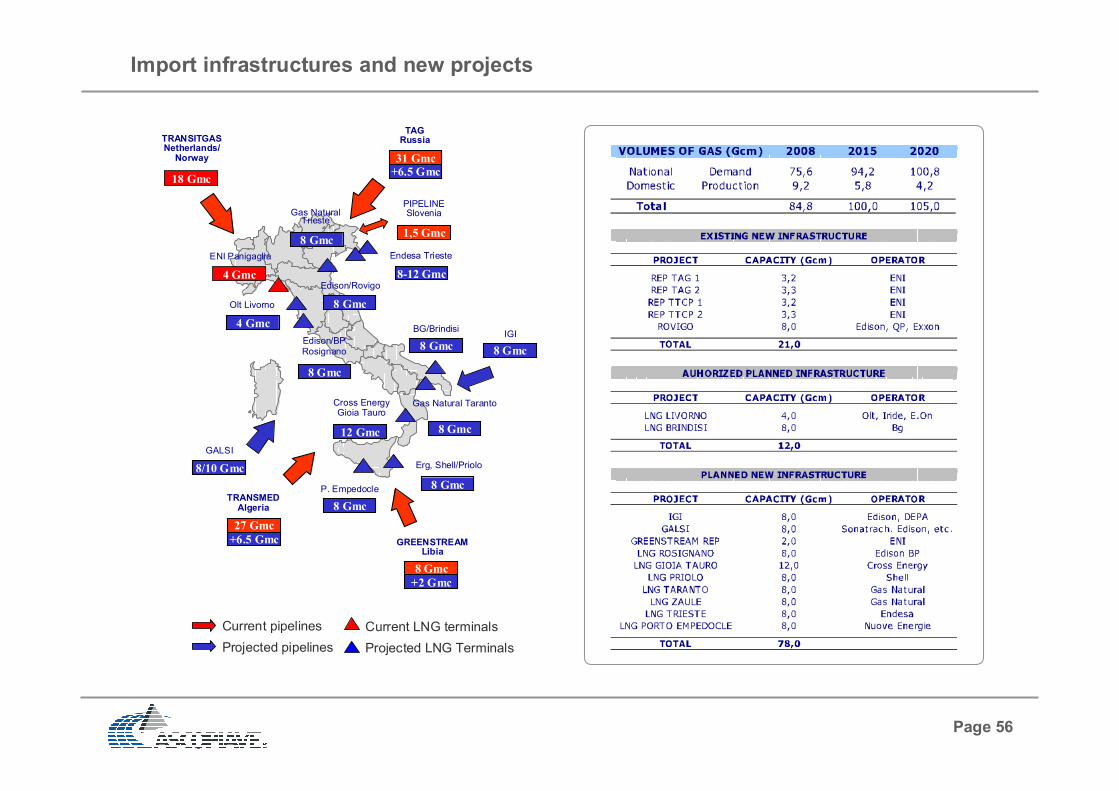
Import infrastructures and new projects
+6.5 Gmc
31 Gmc
TAGRussia
+6.5 Gmc
27 Gmc
TRANSMEDAlgeria
BG/Brindisi
8 Gmc
Edison/Rovigo
8 Gmc
Gas Natural Taranto
8 Gmc
Gas NaturalTrieste
8 Gmc
Cross EnergyGioia Tauro
12 Gmc
Olt Livorno
4 Gmc
GALSI
8/10 Gmc
Edison/BP Rosignano
8 Gmc
Erg, Shell/Priolo
8 Gmc
8-12 Gmc
Endesa Trieste
1,5 Gmc
PIPELINESlovenia
GREENSTREAMLibia
8 Gmc
+2 Gmc
P. Empedocle
8 Gmc
18 Gmc
TRANSITGAS Netherlands/Norway
4 Gmc
ENI Panigaglia
8 Gmc
IGI
Projected pipelines
Current pipelines Current LNG terminals
Projected LNG Terminals

Page 57
Long Term supply agreement with Sonatrach
Purchase of 500 Scm/M of gas import
through GALSI pipeline
Duration of the agreement: 15 years from
the date in which GALSI will go into
operation
Current agreement with Sonatrach
Shell, Essent, EGL, Vitol, RWE, EON, BP
and Gaselys
Current agreements with:
Source: gie.waxinteractive3.com
GALSIInternational
Section
GALSINational
Section
Page 58
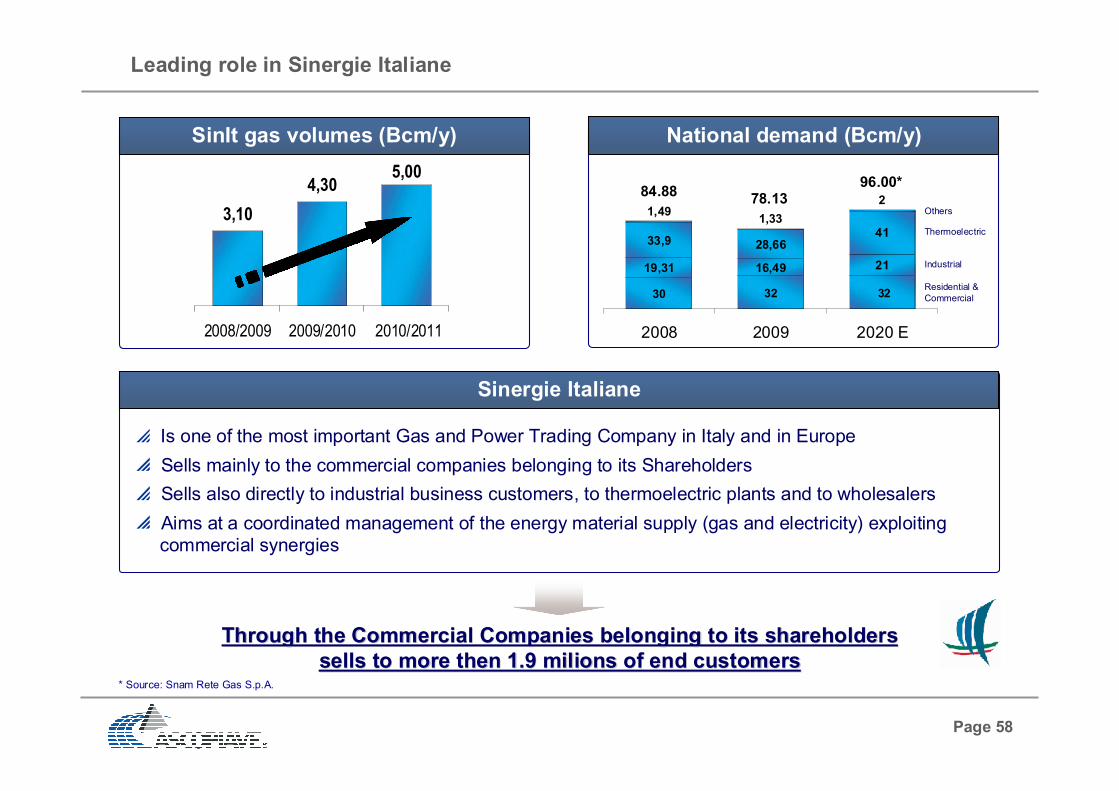
SinIt gas volumes (Bcm/y)
19,31 16,49 21
33,9 28,6641
1,491,33
2
30 32 32
2008 2009 2020 E
84.8878.13
96.00*
Residential &
Commercial
Industrial
Thermoelectric
Others
ThroughThrough the Commercial the Commercial CompaniesCompanies belongingbelonging toto itsits shareholdersshareholders
sellssells toto more more thenthen 1.9 1.9 milionsmilions of end of end customerscustomers
Leading role in Sinergie Italiane
Is one of the most important Gas and Power Trading Company in Italy and in Europe
Sells mainly to the commercial companies belonging to its Shareholders
Sells also directly to industrial business customers, to thermoelectric plants and to wholesalers
Aims at a coordinated management of the energy material supply (gas and electricity) exploiting
commercial synergies
Sinergie Italiane
* Source: Snam Rete Gas S.p.A.
National demand (Bcm/y)
3,10
4,305,00
2008/2009 2009/2010 2010/2011
Page 59
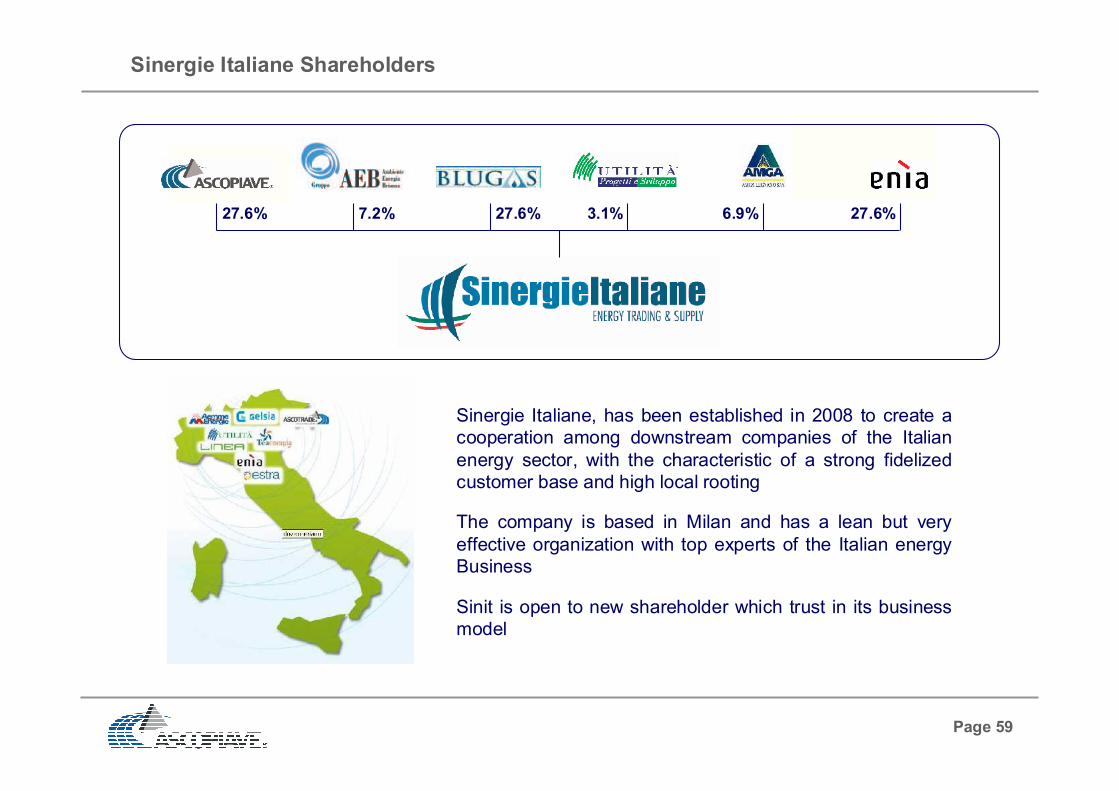
Sinergie Italiane, has been established in 2008 to create a
cooperation among downstream companies of the Italian
energy sector, with the characteristic of a strong fidelized
customer base and high local rooting
The company is based in Milan and has a lean but very
effective organization with top experts of the Italian energy
Business
Sinit is open to new shareholder which trust in its business
model
Sinergie Italiane Shareholders
27.6% 27.6% 27.6%7.2% 3.1% 6.9%
Page 60
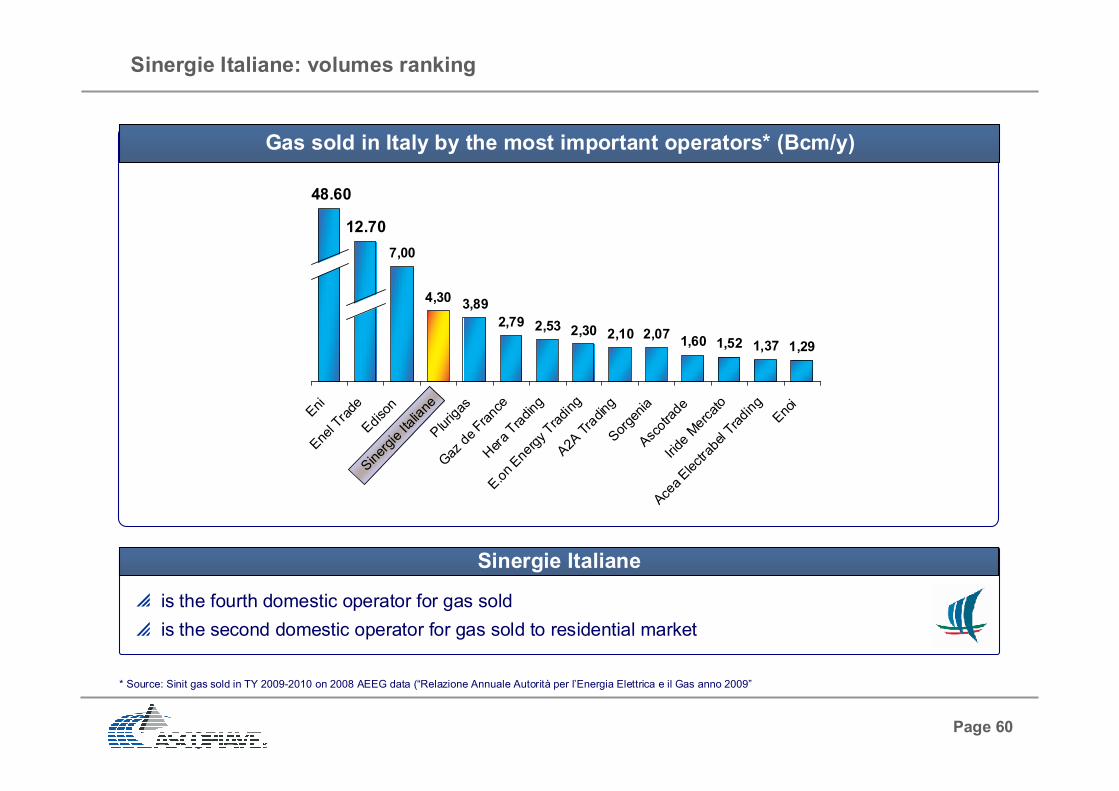
* Source: Sinit gas sold in TY 2009-2010 on 2008 AEEG data (“Relazione Annuale Autorità per l’Energia Elettrica e il Gas anno 2009”
7,00
4,303,89
2,79 2,53 2,30 2,10 2,071,60 1,52 1,37 1,29
Eni
Ene
l Tra
deEd
ison
Siner
gie
Italia
nePlurig
as
Gaz
de
Fran
ceHer
a Tr
ading
E.o
n Ene
rgy Tra
ding
A2A
Tra
ding
Sor
genia
Asc
otra
deIri
de M
erca
to
Acea
Electra
bel T
radi
ng
Eno
i
48.60
12.70
Sinergie Italiane: volumes ranking
Gas sold in Italy by the most important operators* (Bcm/y)
is the fourth domestic operator for gas sold
is the second domestic operator for gas sold to residential market
Sinergie Italiane

Page 61
Thanks to its residential market Sinit has
significative share of Italian Storage which
give to its portfolio flexibility and arbitrage
opportunity
1.100
648573
2008/2009 2009/2010 2010/2011
Sinit manages all the phases of the supply chain
(supply, transportation and storage)
Sinit has long term capacity on europeran
pipelines
is active on the most important European Hubs
is one of the most important operator at Italian
PSV
Sinergie Italiane: supply opportunity
Pipeline capacity
Storage capacity (Mcm/y)
Swissgas
TAG
Wallbach
Dunkerque Transitgas

Page 62
Long term supply agreement with Gazprom
Long term supply agreement with Gazprom
Contract TOP signed by Sinergie Italiane
Total volumes supplied:
1.0 B/Scm per year in 2009-2010 TY
1.5 B/Scm per year in 2011-2021 TY
Starting from October 2009
The Long Term Agreement follows two yearly contracts
Delivery Point in Tarvisio (Italian Border)
Good flexibilities
Negotiations for additional volumes still in progress

Page 63
Contents
Financials
FY 2009 financial results
FY 2009 income statement ........................................................................
FY 2009 income statement break-down by Strategic Business Unit ..........
Balance sheet ............................................................................................
Capital employed as of 31 december 2009 ...............................................
Volumes of gas sold to end customers ......................................................
Volumes of gas sold on trading and wholesaling activities ........................
EBITDA bridge ..........................................................................................
Gross margin on gas sales ........................................................................
Distribution tariff revenues .........................................................................
Other changes ...........................................................................................
Net financial position .................................................................................
1stQ 2010 financial results
2006-2009 financial comparison
Pag. 64
Pag. 65
Pag. 66
Pag. 67
Pag. 68
Pag. 69
Pag. 70
Pag. 71
Pag. 72
Pag. 73
Pag. 74

Page 64
FY 2009 income statement
(Thousand of Euro) 2009 2008 Chg Chg %
Revenues 764.151 824.672 (60.521) -7,3%
(Cost of raw materials and consumables) (617.384) (703.872) 86.488 -12,3%
(Cost of services) (58.888) (43.377) (15.511) +35,8%
(Cost of personnel) (18.377) (15.494) (2.883) +18,6%
(Other operating costs) (9.934) (9.873) (61) +0,6%
Other operating income 1.976 280 1.696 +605,0%
EBITDA 61.545 52.337 9.208 +17,6%
(Depreciations and amortizations) (16.283) (14.071) (2.212) +15,7%
(Provisions) (4.174) (3.880) (294) +7,6%
EBIT 41.088 34.386 6.702 +19,5%
Financial income / (expenses) (857) (5.009) 4.151 -82,9%
EBT 40.231 29.378 10.853 +36,9%
(Income taxes) (14.340) (10.588) (3.751) +35,4%
(Net income of minorities) (603) (337) (266) +78,8%
Net income of the Group 25.288 18.452 6.836 +37,0%
Page 65
EBIT break-down
Years 2007-2009
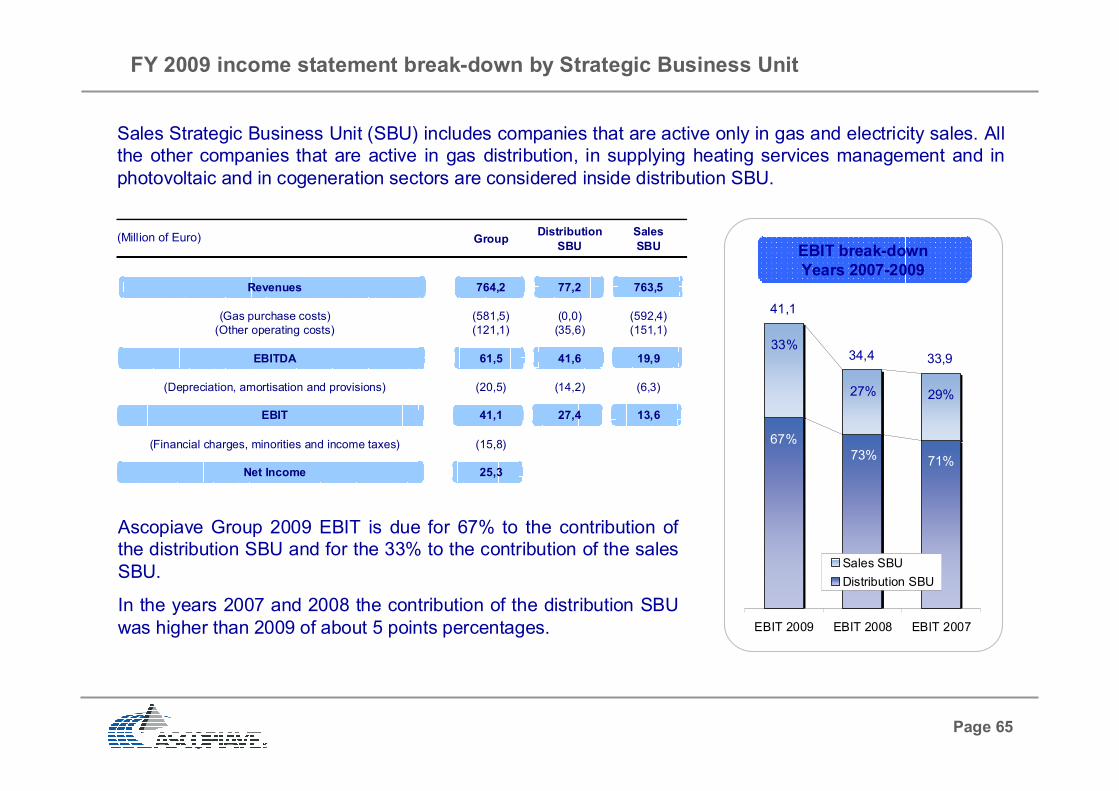
FY 2009 income statement break-down by Strategic Business Unit
(Million of Euro)
Sales Strategic Business Unit (SBU) includes companies that are active only in gas and electricity sales. All
the other companies that are active in gas distribution, in supplying heating services management and in
photovoltaic and in cogeneration sectors are considered inside distribution SBU.
Ascopiave Group 2009 EBIT is due for 67% to the contribution of
the distribution SBU and for the 33% to the contribution of the sales
SBU.
In the years 2007 and 2008 the contribution of the distribution SBU
was higher than 2009 of about 5 points percentages. EBIT 2009 EBIT 2008 EBIT 2007
Sales SBU
Distribution SBU
33%
67%
27% 29%
73% 71%
41,1
34,4 33,9
GroupDistribution
SBU
Sales
SBU
Revenues 764,2 77,2 763,5
(Gas purchase costs) (581,5) (0,0) (592,4)
(Other operating costs) (121,1) (35,6) (151,1)
EBITDA 61,5 41,6 19,9
(Depreciation, amortisation and provisions) (20,5) (14,2) (6,3)
EBIT 41,1 27,4 13,6
(Financial charges, minorities and income taxes) (15,8)
Net Income 25,3

Page 66
Balance sheet
(Thousand of Euro) 31/12/2009 31/12/2008 Chg Chg %
Tangible assets 329.970 319.279 10.691 +3,3%
Non tangible assets 114.542 92.776 21.767 +23,5%
Other fixed assets 15.418 13.860 1.558 +11,2%
Fixed assets 459.930 425.915 34.016 +8,0%
Operating current assets 211.796 281.573 (69.777) -24,8%
(Operating current liabilities) (178.075) (259.641) 81.566 -31,4%
(Operating non current liabilities) (44.468) (41.165) (3.303) +8,0%
Net working capital (10.747) (19.233) 8.485 -44,1%
Total capital employed 449.183 406.682 42.501 +10,5%
Group shareholders equity 367.245 359.108 8.137 +2,3%
Minorities 2.851 2.325 526 +22,6%
Net financial position 79.088 45.249 33.838 +74,8%
Total sources 449.183 406.682 42.501 +10,5%

Page 67
Capital employed as of 31st December 2009
(*) Minorities = 2,9 million of Euro (0.8%)
Tangible assets: this voice refers mainly to costs
held for the realization of the distribution plants,
of the natural gas distribution network, of the
connections to the network and to the laying of
reduction groups and of gas-meters (about 299
million of Euro). Also are included the costs held
for the realization of the buildings of ownership
related to the corporate and peripheral offices
and stores (about 18 million of Euro).
31/12/2009
Tangible assets 329.970
Goodwill 92.225
Other non tangible assets 22.317
Other fixed assets 15.418
Fixed assets 459.930
Net working capital (10.747)
Total capital employed 449.183
Shareholders equity (*) 370.096
Net financial position 79.088
Total sources 449.183
Goodwill refers in part to the surplus value
created by the contribution of the gas distribution
networks by members of local authorities in the
period between 1996 and 1999, and in part to the
surplus value paid pursuant to the firm
acquisition.
Goodwill has been allocated to the distribution
SBU for about 25 million of Euro and to the sales
SBU for about 67 million of Euro.

Page 68
Volumes of gas sold to end customers
Volumes of gas sold to end customers(Million of standard cubic meters)
Gas sold to end customers
Companies consolidated at 100%
Gas sold to end customers
Companies consolidated at 49%-51%
(*) 1stH 2009 of Edigas Due + 2ndH 2009 of Pasubio Servizi(**) 2009 of Veritas Energia
(*) (**)
Page 69
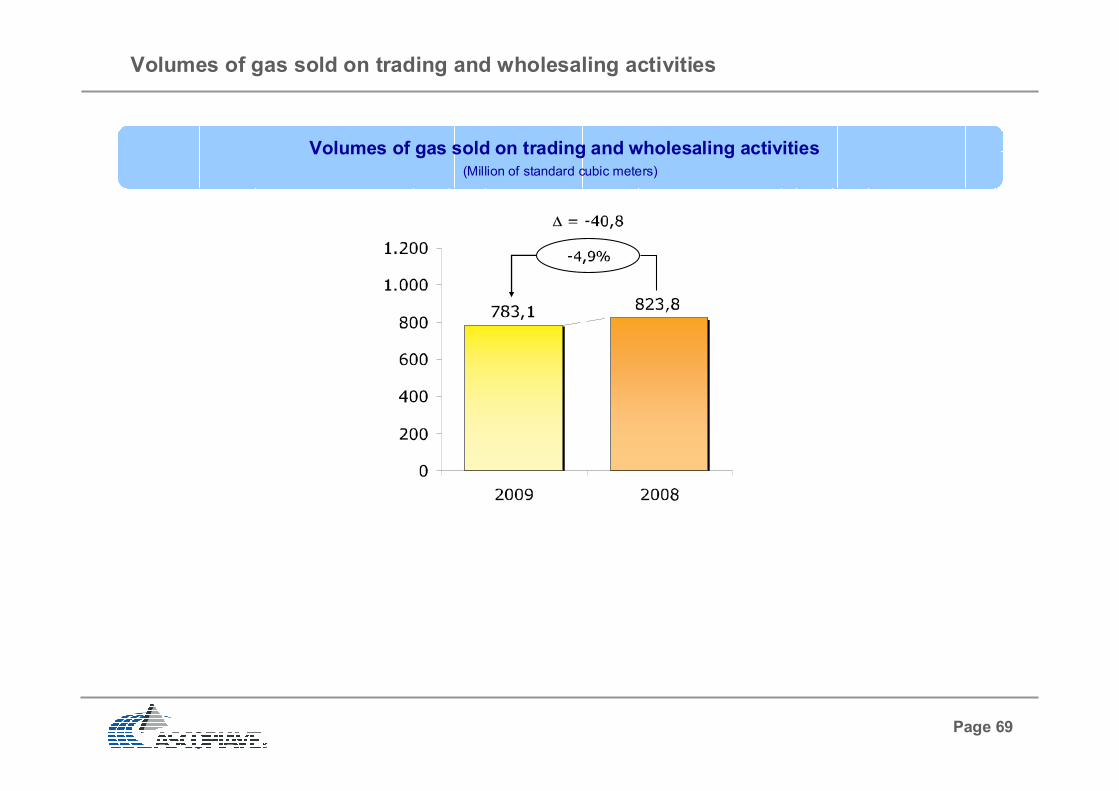
Volumes of gas sold on trading and wholesaling activities
Volumes of gas sold on trading and wholesaling activities(Million of standard cubic meters)
Page 70
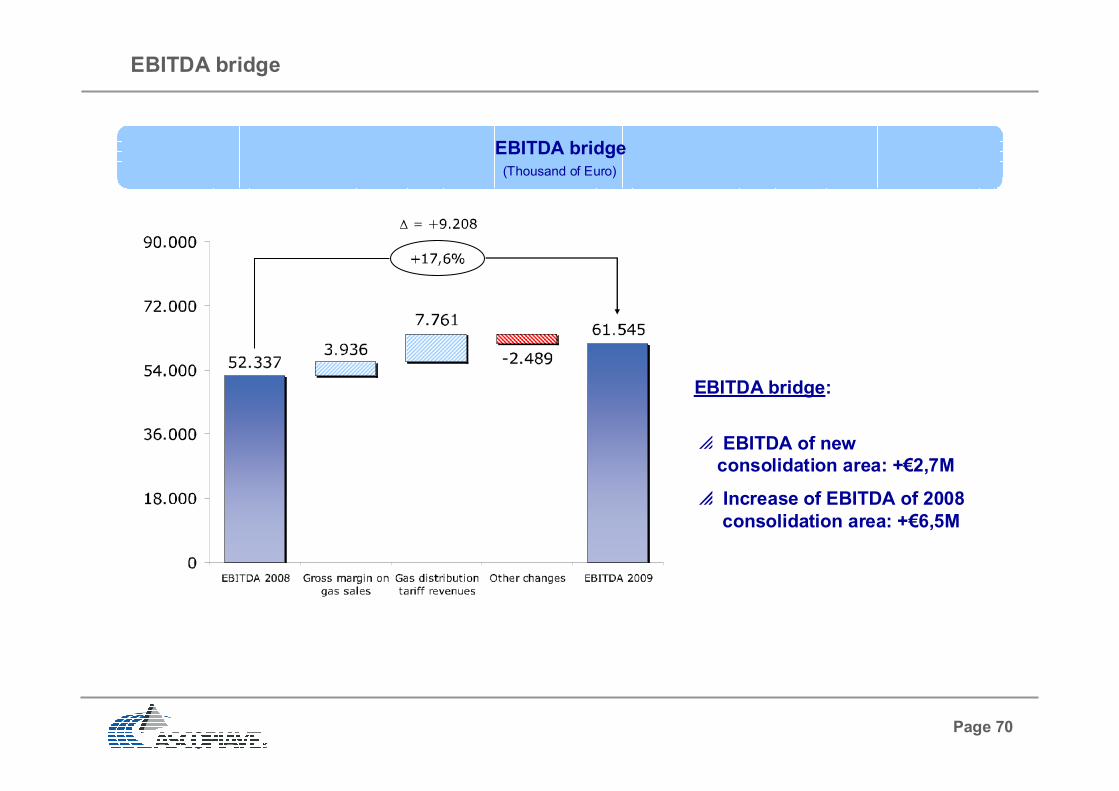
EBITDA bridge
EBITDA bridge:
EBITDA of new
consolidation area: +€2,7M
Increase of EBITDA of 2008
consolidation area: +€6,5M
EBITDA bridge(Thousand of Euro)
Page 71
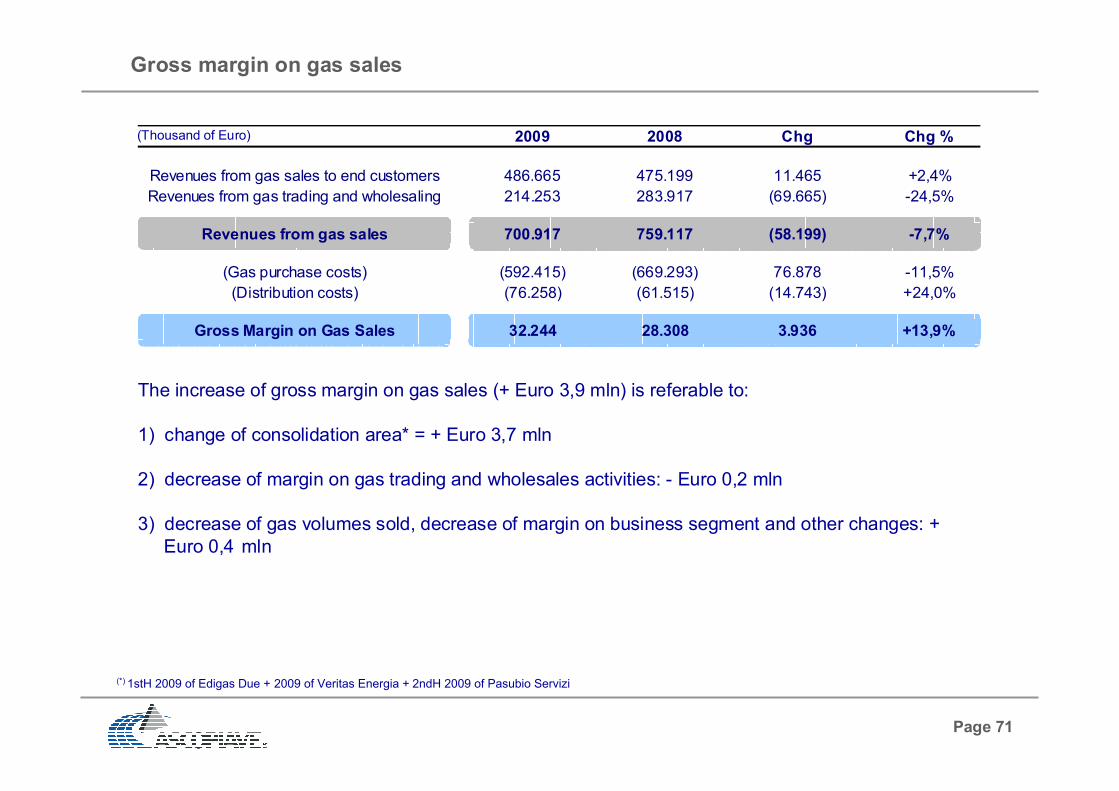
Gross margin on gas sales
The increase of gross margin on gas sales (+ Euro 3,9 mln) is referable to:
1) change of consolidation area* = + Euro 3,7 mln
2) decrease of margin on gas trading and wholesales activities: - Euro 0,2 mln
3) decrease of gas volumes sold, decrease of margin on business segment and other changes: +
Euro 0,4 mln
(Thousand of Euro) 2009 2008 Chg Chg %
Revenues from gas sales to end customers 486.665 475.199 11.465 +2,4%
Revenues from gas trading and wholesaling 214.253 283.917 (69.665) -24,5%
Revenues from gas sales 700.917 759.117 (58.199) -7,7%
(Gas purchase costs) (592.415) (669.293) 76.878 -11,5%
(Distribution costs) (76.258) (61.515) (14.743) +24,0%
Gross Margin on Gas Sales 32.244 28.308 3.936 +13,9%
(*) 1stH 2009 of Edigas Due + 2009 of Veritas Energia + 2ndH 2009 of Pasubio Servizi

Page 72
Distribution tariff revenues
The increase of gas distribution tariff revenues (+ Euro 7,8 mln) is due to:
1) change of consolidation area*: + Euro 2,1 mln
2) change of gas distribution tariffs applied to gas sales companies: + Euro 2,6 mln
3) equalization amount: + Euro 3,1 mln
(Thousand of Euro) 2009 2008 Chg Chg %
Tariffs applied to sales companies 51.070 46.395 4.675 +10,1%
Equalization amount (+ / -) 3.086 - 3.086 n.a.
Gas distribution tariff revenues 54.156 46.395 7.761 +16,7%
(*) 1stH 2009 of Edigas Esercizio Distribuzione Gas
Page 73
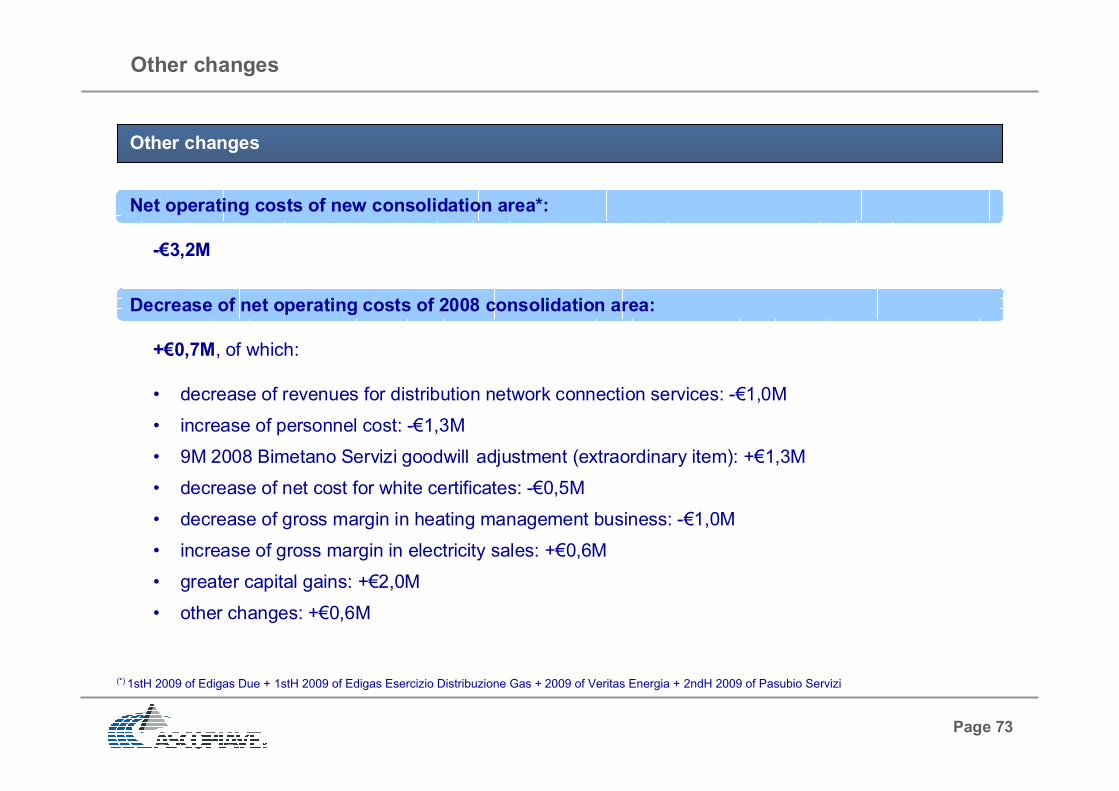
Other changes
Other changes
Net operating costs of new consolidation area*:
-€3,2M
Decrease of net operating costs of 2008 consolidation area:
+€0,7M, of which:
• decrease of revenues for distribution network connection services: -€1,0M
• increase of personnel cost: -€1,3M
• 9M 2008 Bimetano Servizi goodwill adjustment (extraordinary item): +€1,3M
• decrease of net cost for white certificates: -€0,5M
• decrease of gross margin in heating management business: -€1,0M
• increase of gross margin in electricity sales: +€0,6M
• greater capital gains: +€2,0M
• other changes: +€0,6M
(*) 1stH 2009 of Edigas Due + 1stH 2009 of Edigas Esercizio Distribuzione Gas + 2009 of Veritas Energia + 2ndH 2009 of Pasubio Servizi
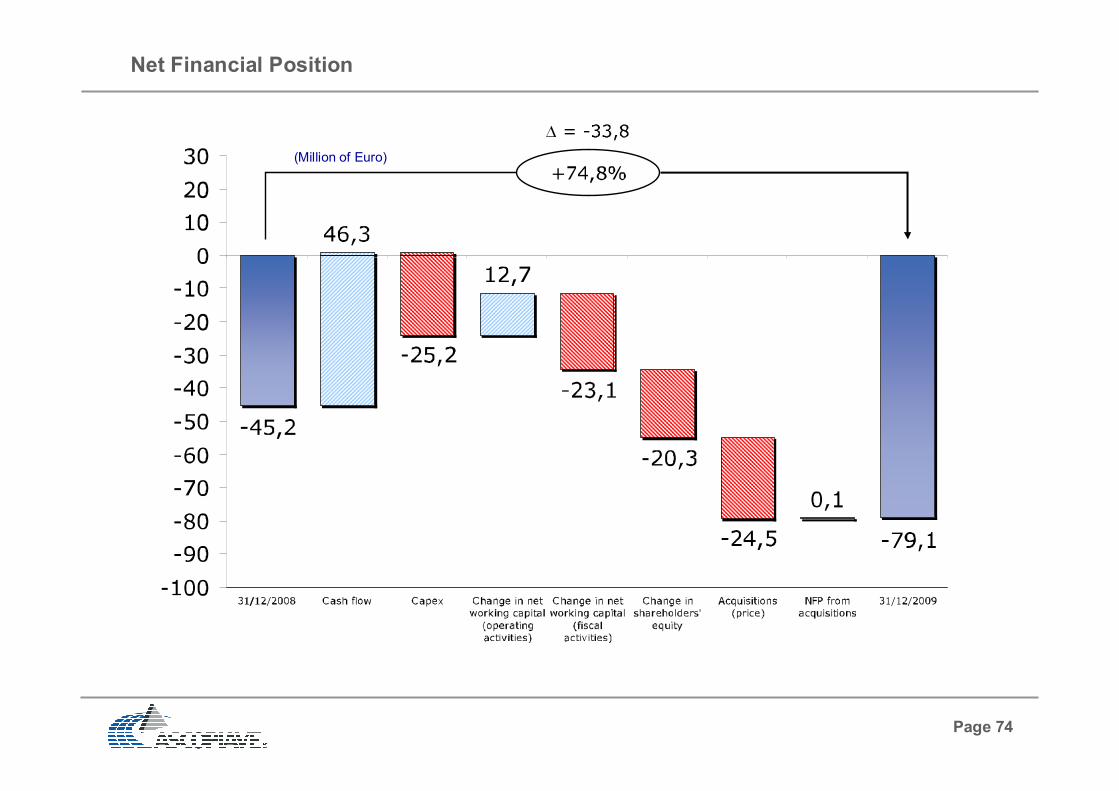
Page 74
Net Financial Position
(Million of Euro)
Page 75
Contents
Financials
FY 2009 financial results
1stQ 2010 financial results
1stQ 2010 income statement .....................................................................
Balance sheet ............................................................................................
Application of IFRIC 12 ..............................................................................
2006-2009 financial comparison
Pag. 76
Pag. 77
Pag. 78
Page 76
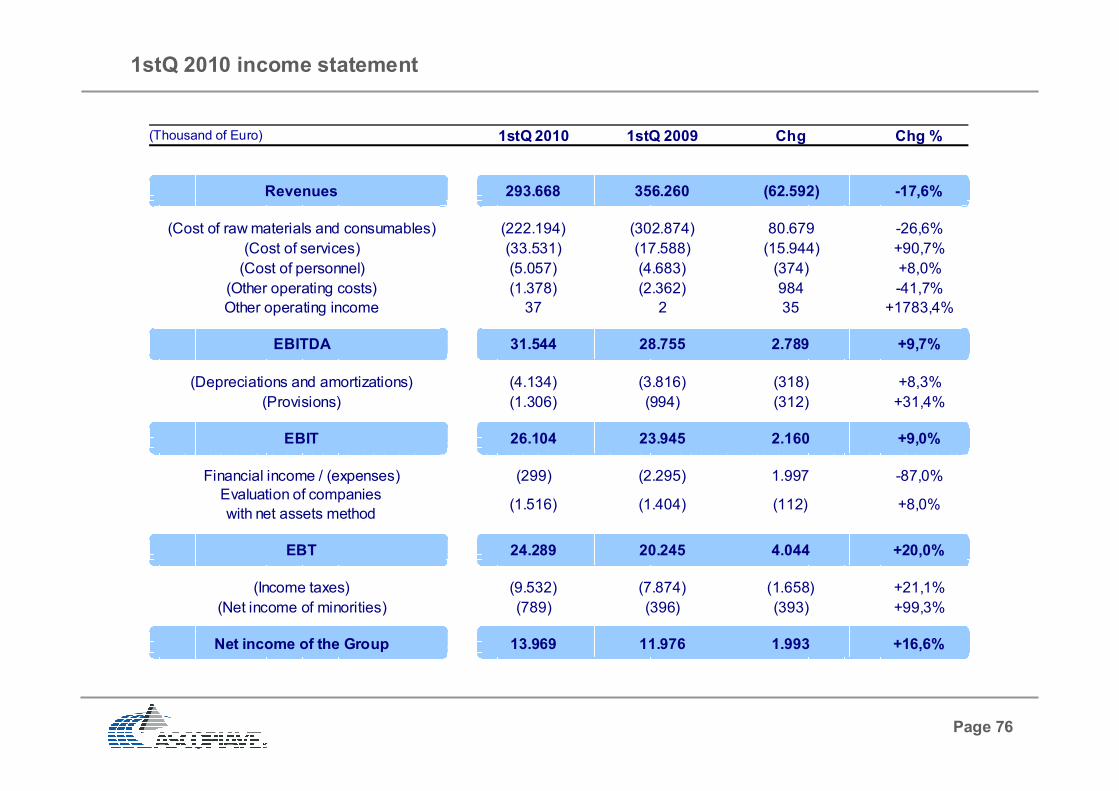
1stQ 2010 income statement
(Thousand of Euro) 1stQ 2010 1stQ 2009 Chg Chg %
Revenues 293.668 356.260 (62.592) -17,6%
(Cost of raw materials and consumables) (222.194) (302.874) 80.679 -26,6%
(Cost of services) (33.531) (17.588) (15.944) +90,7%
(Cost of personnel) (5.057) (4.683) (374) +8,0%
(Other operating costs) (1.378) (2.362) 984 -41,7%
Other operating income 37 2 35 +1783,4%
EBITDA 31.544 28.755 2.789 +9,7%
(Depreciations and amortizations) (4.134) (3.816) (318) +8,3%
(Provisions) (1.306) (994) (312) +31,4%
EBIT 26.104 23.945 2.160 +9,0%
Financial income / (expenses) (299) (2.295) 1.997 -87,0%
Evaluation of companies
with net assets method(1.516) (1.404) (112) +8,0%
EBT 24.289 20.245 4.044 +20,0%
(Income taxes) (9.532) (7.874) (1.658) +21,1%
(Net income of minorities) (789) (396) (393) +99,3%
Net income of the Group 13.969 11.976 1.993 +16,6%

Page 77
Balance sheet
(Thousand of Euro)
(*) Applying IFRIC 12 involves categorising the infrastructures under concession from tangible assets to intangible assets
(*)
(*)
31/03/2010 31/12/2009 Chg Chg %
Tangible assets 32.932 31.431 1.501 +4,8%
Non tangible assets 414.050 413.081 968 +0,2%
Other fixed assets 15.523 15.418 104 +0,7%
Fixed assets 462.505 459.930 2.574 +0,6%
Operating current assets 356.614 211.796 144.818 +68,4%
(Operating current liabilities) (282.848) (178.075) (104.772) +58,8%
(Operating non current liabilities) (45.852) (44.468) (1.384) +3,1%
Net working capital 27.914 (10.747) 38.661 -359,7%
Total capital employed 490.419 449.183 41.235 +9,2%
Group shareholders equity 380.733 367.245 13.488 +3,7%
Minorities 3.641 2.851 789 +27,7%
Net financial position 106.046 79.088 26.958 +34,1%
Total sources 490.419 449.183 41.235 +9,2%

Page 78
Application of IFRIC 12 (1)
With effect from the interim report at 31st March 2010, the Ascopiave Group has published its accounts
applying IFRIC 12, the International Accounting Standards Board interpretation governing the method of
accounting for and measuring service concession arrangements.
IFRIC 12 (“Service Concession Arrangements”), adopted by the European Union in March 2009 with
regulation No. 254/2009, is in fact applicable on 1st January 2010.
IFRIC 12 establishes that the operator shall not recognise the infrastructure, which will be relinquished, as a
tangible asset because the contractual service arrangement does not convey the right to “control” the
infrastructure, but only the right to use it to provide the public service in accordance with the terms
specified in the contract with the grantor.
This right may be classified as a financial asset or as an intangible asset, depending on whether there is an
unconditional contractual right to receive a consideration regardless of effective use of the infrastructure
(i.e. in the case of guaranteed minimum revenues), or a right to charge for the use of the public service (i.e.
the cases of concessions).

Page 79
31/03/2010 31/12/2009 31/12/2009
Tangible assets 32.932 31.431 329.970
Non tangible assets 414.050 413.081 114.542
Other fixed assets 15.523 15.418 15.418
Fixed assets 462.505 459.930 459.930
Application of IFRIC 12 (2)
The application of IFRIC 12 interpretation has determined for the Ascopiave Group a reclassification of
the net accounting value of the assets in the balance sheet as of 31 December 2009 (equals to 294,7
million of Euro) from tangible to intangible assets, as following illustrated.
The application of IFRIC 12 interpretation didn’t cause any effect on the 1stQ 2010 income statement
of the Ascopiave Group because: (i) the revenues related to the construction and empowerment of the
infrastructure are surveyed following the concerning costs; (ii) the process of amortization of the
activities concerning the agreements for services under concession remained the same and continues
to be applied considering the expected modalities of achievement of the economic benefits coming
from the use and the residual value of the infrastructure, as previewed by the reference normative
framework.
Effects of IFRIC 12 interpretation on Ascopiave Group balance sheet
Effects of IFRIC 12 interpretation on Ascopiave Group income statement

Page 80
Contents
Financials
FY 2009 financial results
1stQ 2010 financial results
2006-2009 financial comparison
2006-2009 income statement ....................................................................
Balance sheet ............................................................................................
2006-2009 EBITDA break-down by Strategic Business Unit .....................
Main financial ratios ...................................................................................
Financial leverage comparison ..................................................................
Change of net financial position .................................................................
Plan for the sale and purchase of own shares ...........................................
Pag. 81
Pag. 82
Pag. 83
Pag. 84
Pag. 85
Pag. 86
Pag. 88

Page 81
2006-2009 income statement
(Thousand of Euro) 2009 2008 2007 2006 cagr 06-09
Revenues 764.151 824.672 451.871 318.105 33,9%
(Cost of raw materials and consumables) (617.384) (703.872) (368.052) (245.935) 35,9%
(Cost of services) (58.888) (43.377) (22.984) (10.115) 79,9%
(Cost of personnel) (18.377) (15.494) (12.091) (10.878) 19,1%
(Other operating costs) (9.934) (9.873) (6.553) (10.193) -0,9%
Other operating income 1.976 280 4.315 127 150,0%
EBITDA 61.545 52.337 46.507 41.109 14,4%
(Depreciations and amortizations) (16.283) (14.071) (11.816) (11.255) 13,1%
(Provisions) (4.174) (3.880) (831) (705) 80,9%
EBIT 41.088 34.386 33.860 29.150 12,1%
Financial income / (expenses) (1.325) (4.681) 938 (1.864) -10,8%
Evaluation of companies
with net assets method468 (327) - - n.a.
EBT 40.231 29.378 34.798 27.286 13,8%
(Income taxes) (14.340) (10.588) (12.673) (11.047) 9,1%
(Net income of minorities) (603) (337) (361) 143 -261,7%
Net income of the Group 25.288 18.452 21.764 16.381 15,6%

Page 82
Balance sheet
(Thousand of Euro)
* Data are represented not considering the application of IFRIC 12
*31/12/2009 31/12/2008 31/12/2007 31/12/2006 cagr 06-09
Tangible assets 329.970 319.279 288.471 273.772 6,4%
Non tangible assets 114.542 92.776 81.164 23.524 69,5%
Other fixed assets 15.418 13.860 13.477 15.540 -0,3%
Fixed assets 459.930 425.915 383.112 312.836 13,7%
Operating current assets 211.796 281.573 307.554 108.833 24,8%
(Operating current liabilities) (178.075) (259.641) (183.970) (116.770) 15,1%
(Operating non current liabilities) (44.468) (41.165) (28.798) (23.538) 23,6%
Net working capital (10.747) (19.233) 94.786 (31.476) -30,1%
Total capital employed 449.183 406.682 477.897 281.360 16,9%
Group shareholders equity 367.245 359.108 368.782 368.511 -0,1%
Minorities 2.851 2.325 2.285 391 93,9%
Net financial position 79.088 45.249 106.830 (87.541) -196,7%
Total sources 449.183 406.682 477.897 281.360 16,9%

Page 83
2006-2009 EBITDA break-down by Strategic Business Unit
(Million of Euro)
INCOME STATEMENT GroupDistribution
SBU%
Sales
SBU%
Revenues 764,2 77,2 763,5
(Gas purchase costs) (581,5) (0,0) (592,4)
(Other operating costs) (121,1) (35,6) (151,1)
EBITDA 61,5 41,6 67,6% 19,9 32,4%
Revenues 824,7 72,6 811,9
(Gas purchase costs) (668,2) 0,0 (669,3)
(Other operating costs) (104,1) (35,0) (127,8)
EBITDA 52,3 37,6 71,8% 14,8 28,2%
Revenues 451,9 74,9 423,4
(Gas purchase costs) (351,3) (10,4) (342,5)
(Other operating costs) (54,1) (29,0) (70,0)
EBITDA 46,5 35,5 76,4% 11,0 23,6%
Revenues 318,1 65,3 300,4
(Gas purchase costs) (232,7) 0,0 (232,7)
(Other operating costs) (44,3) (25,5) (66,4)
EBITDA 41,1 39,9 97,0% 1,2 3,0%

Page 84
Main financial ratios
Average Return on Investment (8.8% pre-tax) is higher than real pre-tax return of
investment provided by the gas distribution regulatory system (~7.6%)
Ascopiave Group main financial ratiosAverage
ROI

Page 85
Ascopiave financial leverage (0.22) is lower than those of the Italian listed competitors (avg: 1.30).
The low indebtedness level is a positive result in the light of a macroeconomic scenario that makes
access to credit a real challenge, which therefore strengthens the Group’s economic and financial
soundness and enables it to reap the opportunity of carrying out potential extraordinary transactions in
2010.
Financial leverage comparison
Financial leverage comparison
(*) Local utilities financial leverage is calculated considering market capitalization on 30th December 2009 and net financial position on 30th September 2009; Ascopiave financial leverage is calculated considering market capitalization and net financial position on 30th December 2009; (**) Local utilities are: A2A, Hera, Acea,
Iride, Acegas-APS, ACSM-AGAM and Enìa.
(*)
(**)

Page 86
Change of net financial position (1)
Gas consumption depends on the seasons, with a higher demand for the winter period (January–March).
The seasonability of the activity affects the trend of the net financial position, because the revenues cycle
are not aligned with the costs cycle based on the fact that real consumptions by the household customers
are subject to billing balance subsequently to payment of cost for gas provisioning. Therefore, the
fluctuations of net financial position inside every year are determined by the evolution of net working capital.
The following graph show the evolution of Ascopiave Group net financial position from december 2005 to
december 2009. In this representation the fluctuations are determined, over that from evolution of net
working capital, by some extraordinary variation, following described.
4thQ 2006: increase in capital due to listing in Milan
Stock Exchange
4thQ 2007: cash requirements linked to acquisition of
shares of Estenergy, ASM DG and ASM Set and to
extraordinary effects on working capital (storage
campaign, billing delay and VAT and gas consumption
tax regimes)
3rdQ 2008: cash requirements linked to acquisition of
shares of Edigas DG and Edigas Due
3rdQ 2009: cash requirements linked to acquisition of
shares of Veritas Energia and Pasubio Servizi-130.000
-90.000
-50.000
-10.000
30.000
70.000
110.000
150.000
December t-1 March t June t September t December t
2006 2007
2008 2009
4thQ 2006
4thQ 2007
3rdQ 2008
3rdQ 2009
Note: actual Ascopiave average short term interest rates: Euribor rate 1M + spread (0.30-0.42)

Page 87
Change of net financial position (2)
Considering only the companies belonging to the historical area (Ascopiave and Ascotrade) and
normalizing the net financial position hypothesizing that (1) Ascopiave has not been listed on Milan Stock
Exchange, (2) that it has not make investment in company acquisitions, (3) that it has not distributed
dividends and (4) not considering extraordinary change in net working capital (storage campaign, billing
delay and VAT and gas consumption tax regimes), the evolution of net financial position is enough similar in
the last four years. Thus is visible that the trends of net financial position inside every year are
determined by evolution of net working capital due to the business particularity.
20.000
40.000
60.000
80.000
100.000
120.000
140.000
160.000
180.000
December t-1 March t June t September t December t
2006 2007
2008 2009

Page 88
Plan for the sale and purchase of own shares
The new plan for the sale and purchase of own shares has been authorized by shareholders’ meeting as of
28th April 2010.
The decision to approve a new plan was due to the need to immediately taking advantage of the
opportunity introduced by Legislative Decree No. 5 of 10th February 2009 to extend the maximum limit
of treasury shares that can be purchased by the company from 10% to 20% of its share capital.
OBJECTIVES OF THE PLAN
The aim of the Plan is to provide the Company with a valid instrument that will allow it to purchase own
shares in order to use them to conduct investment operations coherent with Company strategy, also
through share swap, exchange, underwriting, transfer, or any other act of disposal of treasury shares for
the acquisition of shareholdings or stakes or for other capital transactions that involve the allocation or
disposal of own shares.
The plan will pursue, inter alia, the following objectives: (i) take action, in compliance with prevailing law, to
regulate the performance of the trading and runs, against events that could lead to excess volatility or
limited liquidity of the trades; (ii) offer shareholders an additional instrument for monetising their investment
(iii) purchase own shares to be used, if required, for any share-based incentive plans reserved for directors
and/or employees and/or people who work for the Company or its subsidiaries or parent company.
The unit cost for the purchase of shares shall be determined on each separate occasion by the Board of
Directors, being understood that the price cannot be neither superior nor inferior to 10% of the
reference price recorded by the company stock on the Stock Exchange on the session before every single
purchase transaction.
At 30th June 2010 own shares amount to 3.535% of the company shareholding capital.
Page 89
Contents
Sinergie Italiane
Income statement ............................................................................................
Balance sheet ..................................................................................................
Gas sourcing and usage ..................................................................................
Net financial position ........................................................................................
Guarantees ......................................................................................................
Financial and non-financial risks ......................................................................
Pag. 90
Pag. 91
Pag. 92
Pag. 93
Pag. 95
Pag. 96
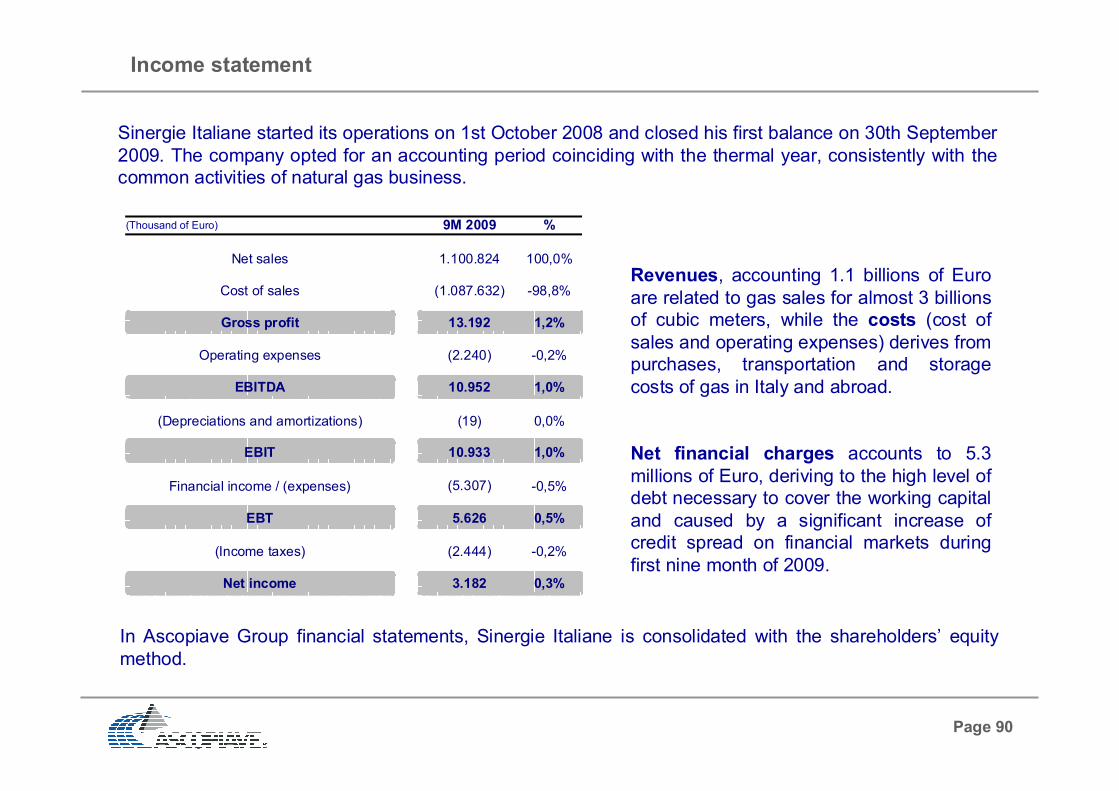
Page 90
Income statement
Sinergie Italiane started its operations on 1st October 2008 and closed his first balance on 30th September
2009. The company opted for an accounting period coinciding with the thermal year, consistently with the
common activities of natural gas business.
In Ascopiave Group financial statements, Sinergie Italiane is consolidated with the shareholders’ equity
method.
(Thousand of Euro) 9M 2009 %
Net sales 1.100.824 100,0%
Cost of sales (1.087.632) -98,8%
Gross profit 13.192 1,2%
Operating expenses (2.240) -0,2%
EBITDA 10.952 1,0%
(Depreciations and amortizations) (19) 0,0%
EBIT 10.933 1,0%
Financial income / (expenses) (5.307) -0,5%
EBT 5.626 0,5%
(Income taxes) (2.444) -0,2%
Net income 3.182 0,3%
Revenues, accounting 1.1 billions of Euro
are related to gas sales for almost 3 billions
of cubic meters, while the costs (cost of
sales and operating expenses) derives from
purchases, transportation and storage
costs of gas in Italy and abroad.
Net financial charges accounts to 5.3
millions of Euro, deriving to the high level of
debt necessary to cover the working capital
and caused by a significant increase of
credit spread on financial markets during
first nine month of 2009.

Page 91
Balance sheet
(Thousand of Euro)
The reclassified balance sheet, in terms of
“sources” and “uses” of cash, show a negative
net financial position for 201,3 million of Euro as
of 30th September 2009. The financial exposure
is binded mainly to need to finance, through short-
term indebteness, the net working capital of the
company, that is equal to 205,7 million of Euro.
As it’s clearly deduced by the prospectus, the net
working capital results mainly constituted by gas
stocked following up gas purchase in the summer
period.
30/09/2009
Fixed capital 75
Other non current assets and liabilities 676
(Risk liabilities) (499)
Other current assets and liabilities 9.962
Account receivables/(payables) 10.854
Ending inventory 185.369
Net working capital 205.686
Total capital employed 206.437
Shareholders equity 5.182
Bank debts (cash) 198.867
Other current financial liabilities/(assets) 2.388
Net financial position 201.255
Total sources 206.437

Page 92
Gas sourcing and usage
During the thermal year 2008/2009 Sinergie Italiane totally sold approximately 3.6 billions of cubic
meters of natural gas, of which 0.2 bcm relating to trading activities towards other shipping companies (at
PSV, Italian boarder or other European hubs), while the others 3.4 bcm has been delivered to sales
companies or directly to final customers at city gates.
The balance of sourcing and usage of Sinergie Italiane for the thermal year 2008/2009 is represented in
the following chart:
The final storage, arrived at an almost full saturation of available capacity at 30th September 2009, will be
sold during the winter 2009/2010.
TY 2008-2009
Purchases for shipping activities 3.241,2
Purchases at city gate 452,7
Withdrawal (injection) from stock (75,1)
Total sources 3.618,8
Gas sold in shipping activities 3.153,2
Gas purchased and sold at city gate 452,7
Not measured and fuel gas 12,9
Total usage 3.618,8
(Cm/mln)
Page 93
Net financial position (1)
The reclassified balance sheet as of 30th September 2009, illustrated in a previus slide, show a financial
indebtness of 201.3 million of Euro (97.5% of total capital employed).
The financial dinamic of Sinergie Italiane has been characterized by the need to face toward an elevated
financial requirement, in start-up phase of activity, connect to purchase of gas in storage in a particularly
criticism situation of financial markets. Infact, the crisis of financial market, with a consequent lack of
liquidity of banking institutes, has make necessary the financial support by shareholders, that make
concreted in various forms:
guarantee gived by shareholders to forehead credit authorizations released by the companies and, in
some cases, through direct financing
advance of billing times towards shareholders commercial companies
advanced cash-in of sales invoices respect to their natural expiry data through factoring and similar
operations
The company has made resort to short-term financing, over that for start-up phase, also subsequently to
face toward requirements generated by the current management cycle, deriving to lag between average
cash-in times and average payment times to suppliers. At the end of exercise, the company financial
requirement was mainly generated by the gas stock acquisition taked place in the summer period.
As of 30th September 2009, accorded credit line results not completely used and thus there is not a
liquidity risk also following the lended, if necessary, of suitable guarantee by shareholders.
All of this find comparison in situation of net financial indebtness of the company.
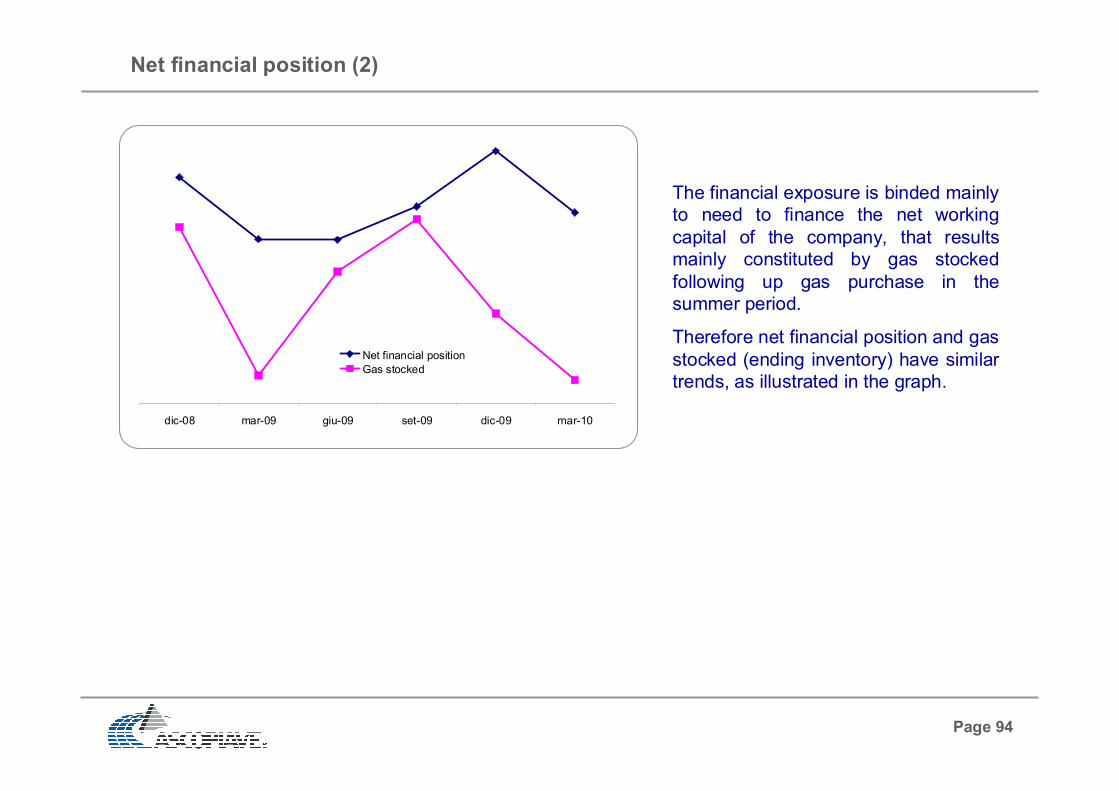
Page 94
Net financial position (2)
The financial exposure is binded mainly
to need to finance the net working
capital of the company, that results
mainly constituted by gas stocked
following up gas purchase in the
summer period.
Therefore net financial position and gas
stocked (ending inventory) have similar
trends, as illustrated in the graph.
dic-08 mar-09 giu-09 set-09 dic-09 mar-10
Net financial position
Gas stocked
Page 95
Guarantees
Capital commitments, equals to 116.3 milion of Euro, refers mainly to:
guarantees given in favour of Stogit to warranty for strategic storage and modulation service contract
(8.5 million of Euro)
guarantees given in favour of Eni, Snam Rete Gas (29.6 million of Euro) and Trans Austria Gasleitung
(6.0 million of Euro) to warranty for subscribed contracts for gas transportation
guarantees given in favour of Bp Italia (15.0 million of Euro) and Shell Italia (3.5 million of Euro) to
warranty for gas supply contracts
letters of credit released to Gazprom Export (48.7 million of Euro) to warranty for gas supply contracts
fair value of extant swap contracts, not expired, as of 30th September 2009 (1.9 million of Euro),
estimated by internal valuation models
The guarantees on credit lines and on gas purchase contracts released by Ascopiave in favour of Sinergie
Italiane as of 31th December 2009 amount to 164.4 million of Euro.

Page 96
Financial and non-financial risks
Financial risks
Sinergie Italiane is exposed to risks linked to disalignment between indicization formulas relative to gas
purchasing and those relative to gas selling, above all because of high volatility of oil-bearing commodities
and of the associated change in a more and more competitive energetic market.
In such a contexts can verified exposure to commodities risk for which it is not possible to guarantee an ex-
ante safeguard of consolidated gross margin.
With the aim to limit company risk esposure to price trend on reference energetic markets and, therefore,
with the only purpose of covering and not for speculative aim, within of company covering politics is
allowed the use of derived instruments on commodities and change.
For the stipulation of such covering contracts, the company exclusively recur to high and recognized profile
counter-parties, with low credit risk, of elevated international standing and that offers competitive conditions
for carrying-out requested service.
For the risk management, Sinergie Italiane has extant a proper “Risk policies for management and control
of energetical risk” that foresee the explicitation of strategic guidelines, of organizational / managerial
principles and of macro processes necessary to active management of main sources of energetical risk.
Non-financial risks
Sinergie Italiane don’t have credit risk from gas sale, beeing an activity almost totally make in favour of
shareholders and of their controlled companies.
The company has 7 employees and therefore is subjected to risks in matter of health and safety at work.
The company perform his activity with respect of disposition in matter of environment protection.

Page 97
Contents
Dividends and share performance
Dividend policy .................................................................................................
FTSE indexes performance .............................................................................
Ascopiave share performance .........................................................................
Pag. 98
Pag. 99
Pag. 100
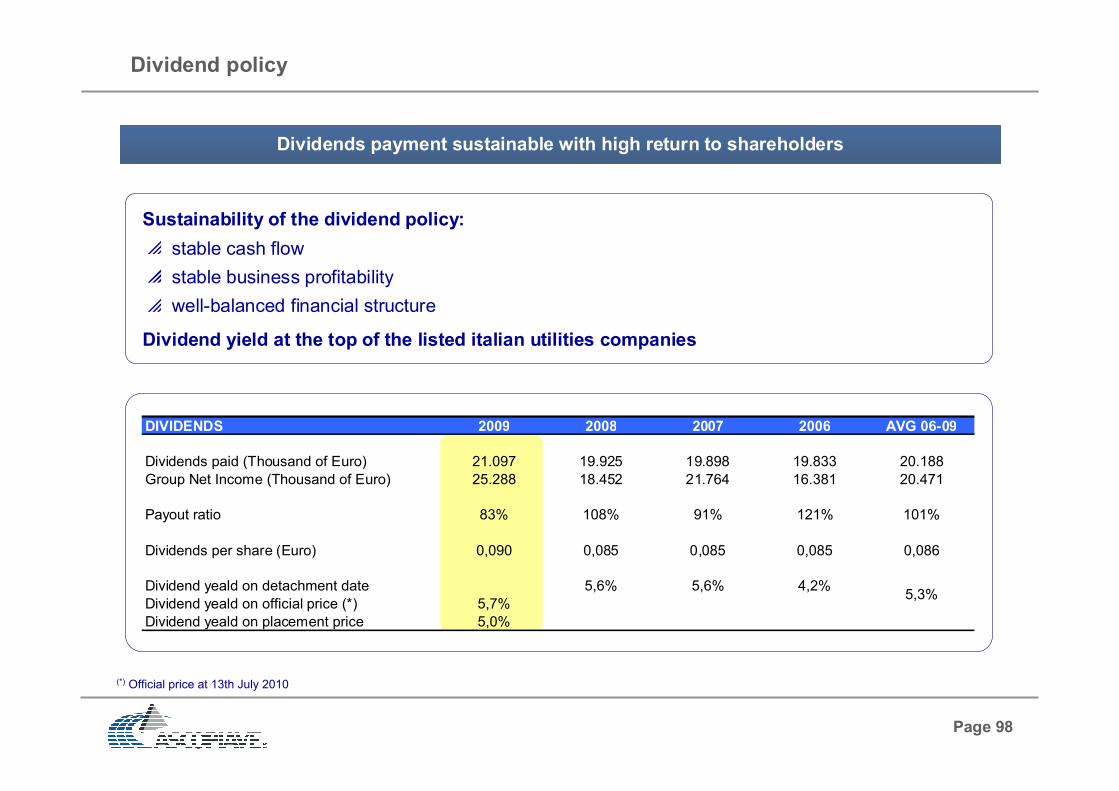
Page 98
Dividend policy
Dividends payment sustainable with high return to shareholders
Sustainability of the dividend policy:
stable cash flow
stable business profitability
well-balanced financial structure
Dividend yield at the top of the listed italian utilities companies
(*) Official price at 13th July 2010
DIVIDENDS 2009 2008 2007 2006 AVG 06-09
Dividends paid (Thousand of Euro) 21.097 19.925 19.898 19.833 20.188
Group Net Income (Thousand of Euro) 25.288 18.452 21.764 16.381 20.471
Payout ratio 83% 108% 91% 121% 101%
Dividends per share (Euro) 0,090 0,085 0,085 0,085 0,086
Dividend yeald on detachment date 5,6% 5,6% 4,2%
Dividend yeald on official price (*) 5,7%
Dividend yeald on placement price 5,0%
5,3%
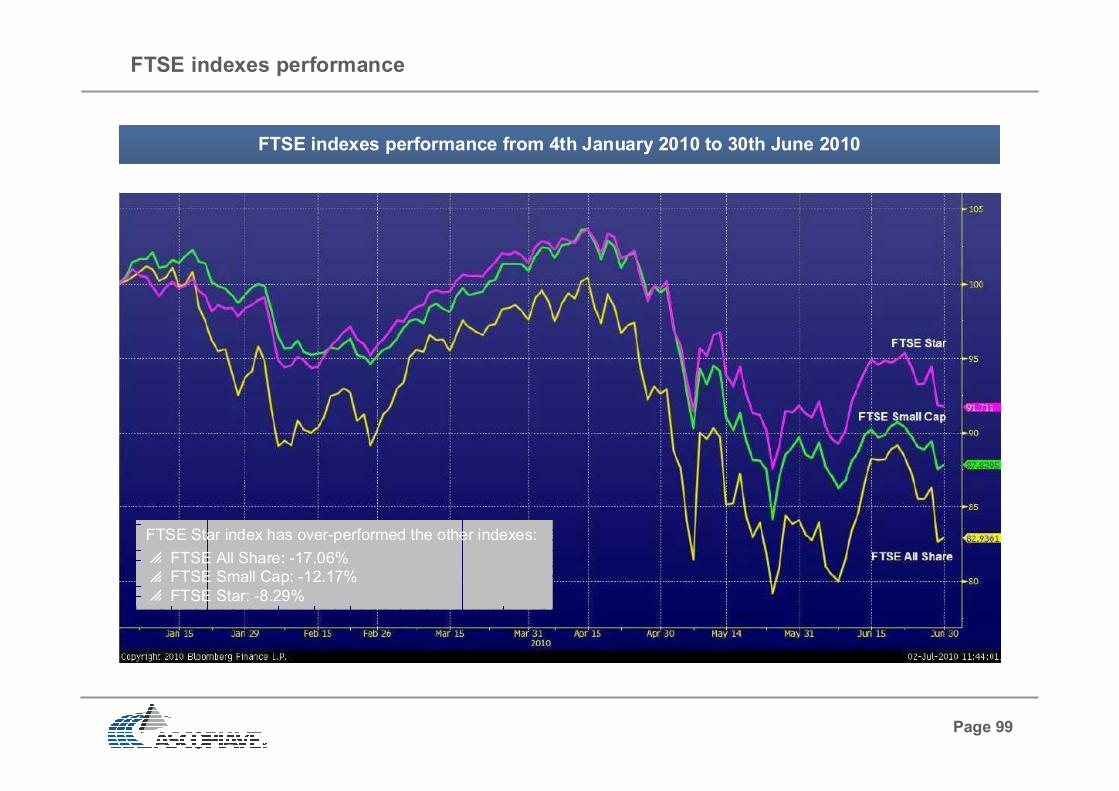
Page 99
FTSE indexes performance
FTSE indexes performance from 4th January 2010 to 30th June 2010
FTSE Star index has over-performed the other indexes:
FTSE All Share: -17.06%FTSE Small Cap: -12.17%
FTSE Star: -8.29%
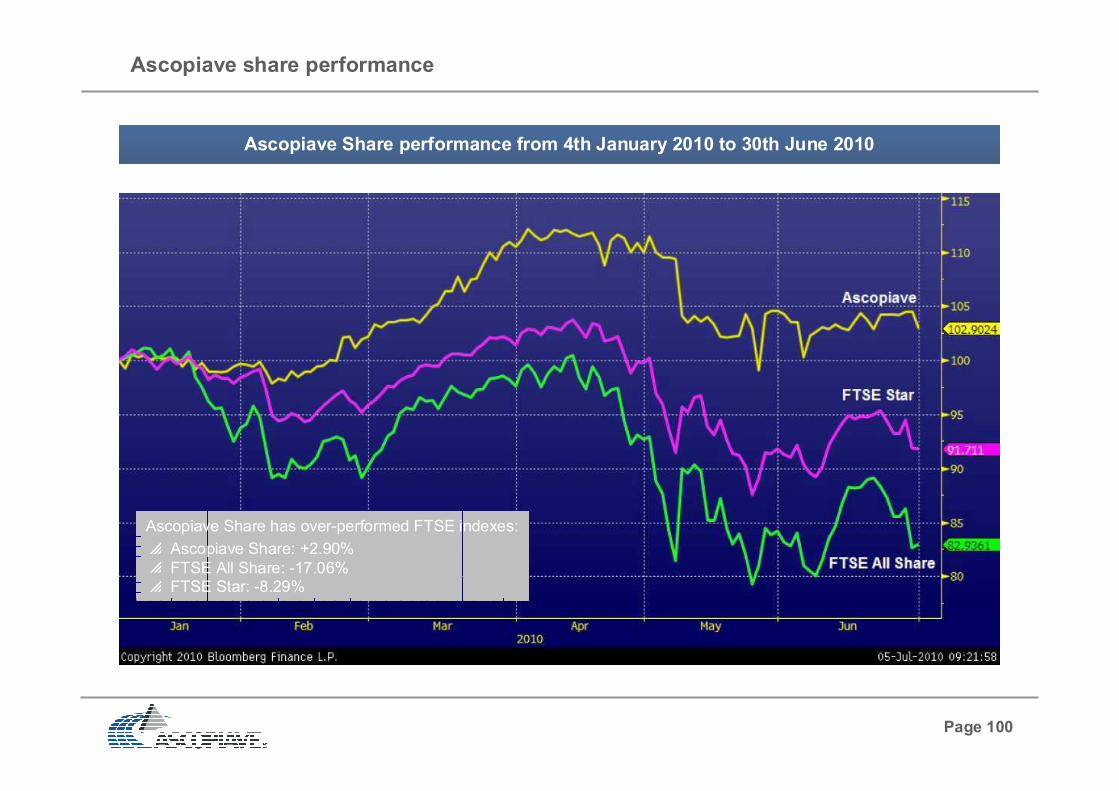
Page 100
Ascopiave share performance
Ascopiave Share performance from 4th January 2010 to 30th June 2010
Ascopiave Share has over-performed FTSE indexes:
Ascopiave Share: +2.90%
FTSE All Share: -17.06%FTSE Star: -8.29%
Page 101
Contents
Annexes
1stQ 2010 financial results
1stQ 2010 income statement ...................................................................
Balance sheet ..........................................................................................
Volumes of gas sold to end customers ....................................................
Volumes of gas sold on trading and wholesaling activities .......................
EBITDA bridge .........................................................................................
Gross margin on gas sales ......................................................................
Distribution tariff revenues .......................................................................
Other changes .........................................................................................
Net financial position ................................................................................
Pag. 102
Pag. 103
Pag. 104
Pag. 105
Pag. 106
Pag. 107
Pag. 108
Pag. 109
Pag. 110
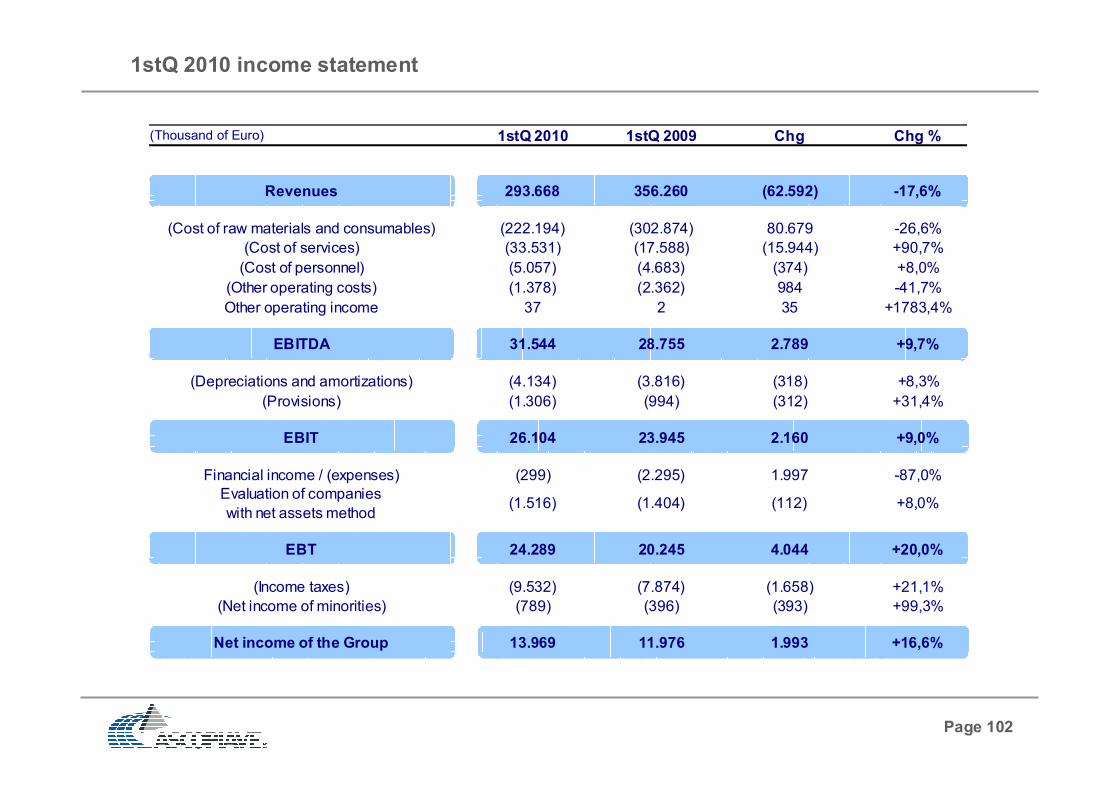
Page 102
1stQ 2010 income statement
(Thousand of Euro) 1stQ 2010 1stQ 2009 Chg Chg %
Revenues 293.668 356.260 (62.592) -17,6%
(Cost of raw materials and consumables) (222.194) (302.874) 80.679 -26,6%
(Cost of services) (33.531) (17.588) (15.944) +90,7%
(Cost of personnel) (5.057) (4.683) (374) +8,0%
(Other operating costs) (1.378) (2.362) 984 -41,7%
Other operating income 37 2 35 +1783,4%
EBITDA 31.544 28.755 2.789 +9,7%
(Depreciations and amortizations) (4.134) (3.816) (318) +8,3%
(Provisions) (1.306) (994) (312) +31,4%
EBIT 26.104 23.945 2.160 +9,0%
Financial income / (expenses) (299) (2.295) 1.997 -87,0%
Evaluation of companies
with net assets method(1.516) (1.404) (112) +8,0%
EBT 24.289 20.245 4.044 +20,0%
(Income taxes) (9.532) (7.874) (1.658) +21,1%
(Net income of minorities) (789) (396) (393) +99,3%
Net income of the Group 13.969 11.976 1.993 +16,6%

Page 103
Balance sheet
(Thousand of Euro)
(*)
(*)
(*) Applying IFRIC 12 involves categorising the infrastructures under concession from tangible assets to intangible assets
31/03/2010 31/12/2009 Chg Chg %
Tangible assets 32.932 31.431 1.501 +4,8%
Non tangible assets 414.050 413.081 968 +0,2%
Other fixed assets 15.523 15.418 104 +0,7%
Fixed assets 462.505 459.930 2.574 +0,6%
Operating current assets 356.614 211.796 144.818 +68,4%
(Operating current liabilities) (282.848) (178.075) (104.772) +58,8%
(Operating non current liabilities) (45.852) (44.468) (1.384) +3,1%
Net working capital 27.914 (10.747) 38.661 -359,7%
Total capital employed 490.419 449.183 41.235 +9,2%
Group shareholders equity 380.733 367.245 13.488 +3,7%
Minorities 3.641 2.851 789 +27,7%
Net financial position 106.046 79.088 26.958 +34,1%
Total sources 490.419 449.183 41.235 +9,2%
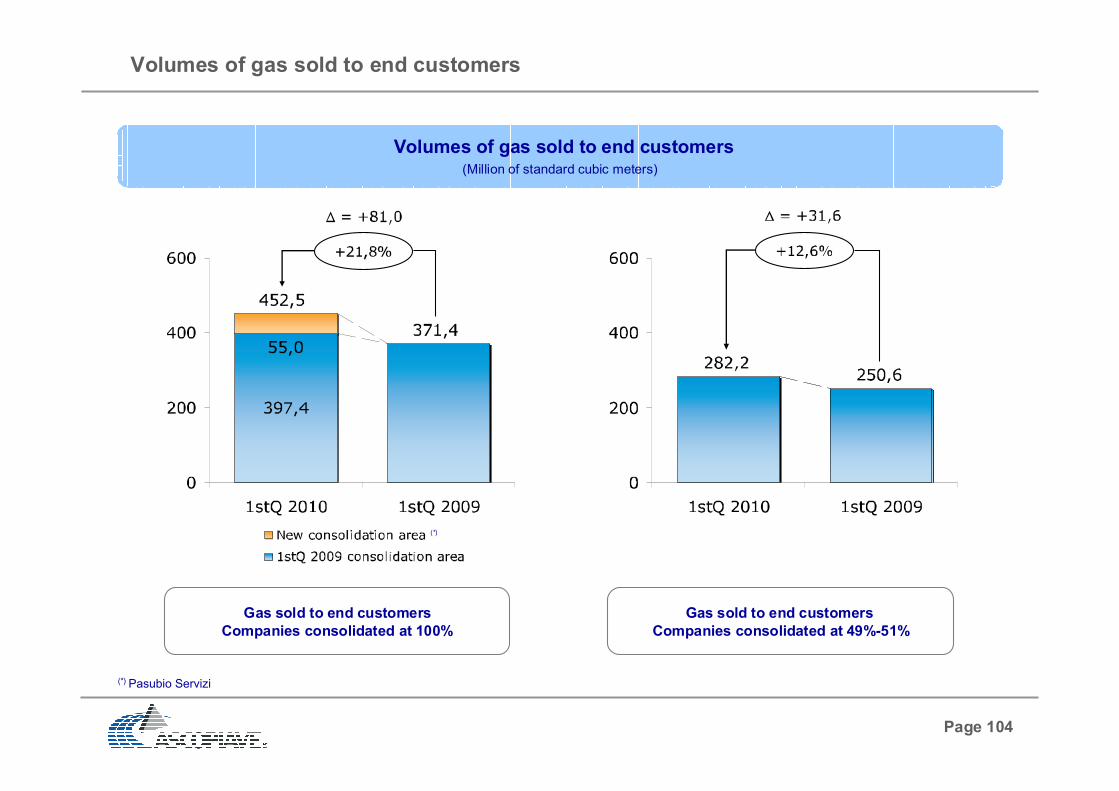
Page 104
Volumes of gas sold to end customers
Volumes of gas sold to end customers(Million of standard cubic meters)
Gas sold to end customers
Companies consolidated at 100%
Gas sold to end customers
Companies consolidated at 49%-51%
(*) Pasubio Servizi
(*)

Page 105
Volumes of gas sold on trading and wholesaling activities
Volumes of gas sold on trading and wholesaling activities(Million of standard cubic meters)

Page 106
EBITDA bridge
EBITDA bridge:
EBITDA of new
consolidation area: +€1,8M
Increase of EBITDA of 1stQ
2009 consolidation area:
+€1,0M
EBITDA bridge(Thousand of Euro)

Page 107
Gross margin on gas sales
(Thousand of Euro) 1stQ 2010 1stQ 2009 Chg Chg %
Revenues from gas sales to end customers 224.879 244.301 (19.422) -8,0%
Revenues from gas trading and wholesaling 53.765 92.573 (38.808) -41,9%
Revenues from gas sales 278.644 336.874 (58.230) -17,3%
(Gas purchase costs) (210.912) (292.053) 81.141 -27,8%
(Distribution costs) (43.916) (29.458) (14.458) +49,1%
Gross Margin on Gas Sales 23.816 15.363 8.452 +55,0%
The increase of gross margin on gas sales (+ Euro 8,5 mln) is referable to:
1) change of consolidation area* = + Euro 2,2 mln
2) increase of gross margin on gas sales to end customers of 1stQ 2009 consolidation area: + Euro
5,7 mln
3) increase of margin on gas trading and wholesales activities: + Euro 0,6 mln
(*) 1stQ 2010 of Pasubio Servizi

Page 108
The decrease of gas distribution tariff revenues (- Euro 6,5 mln) is due to:
1) change of gas distribution tariffs applied to gas sales companies: + Euro 2,1 mln
2) decrease of contribution to national funds: + Euro 0,4 mln
3) equalization amount: - Euro 8,9 mln
Distribution tariff revenues
(Thousand of Euro) 1stQ 2010 1stQ 2009 Chg Chg %
Tariffs applied to sales companies 23.331 21.241 2.090 +9,8%
(Contribution to national funds) - (354) 354 -100,0%
Equalization amount (+ / -) (8.943) - (8.943) n.a.
Gas distribution tariff revenues 14.388 20.887 (6.499) -31,1%
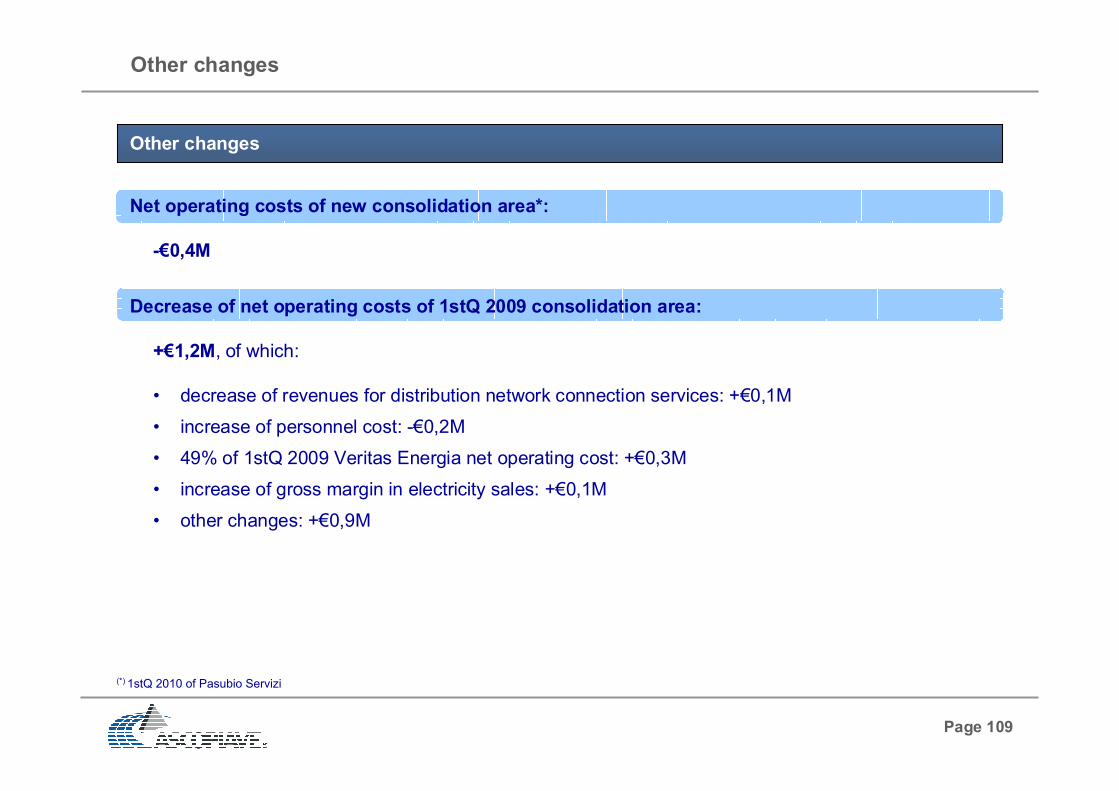
Page 109
Other changes
Other changes
Net operating costs of new consolidation area*:
-€0,4M
Decrease of net operating costs of 1stQ 2009 consolidation area:
+€1,2M, of which:
• decrease of revenues for distribution network connection services: +€0,1M
• increase of personnel cost: -€0,2M
• 49% of 1stQ 2009 Veritas Energia net operating cost: +€0,3M
• increase of gross margin in electricity sales: +€0,1M
• other changes: +€0,9M
(*) 1stQ 2010 of Pasubio Servizi

Page 110
Net Financial Position
(Million of Euro)