Company Overview - photoncontrol.com · Target Markets. Our target customers are Wafer Fabrication...
26
Company Overview November 2018
Transcript of Company Overview - photoncontrol.com · Target Markets. Our target customers are Wafer Fabrication...

Company Overview
November 2018

Forward-Looking Statements This Presentation contains “forward-looking statements” within the meaning of applicable Canadian securities legislation. These statements generally can be identified by use of forward looking words such as “may”, “will”, “expect”, “estimate”, “anticipate”, “intend”, “consider”, “believe” or “continue” or the negative thereof or similar variations. Such forward-looking statements concern the business and anticipated financial performance of the Company and include, without limitation, the Company’s expectations with respect to the overall order activity for the balance of the year, growth in the dollar value of the wafer fabrication equipment market, revenue from new products, growth in the etch market and the Company’s ability to build on its financial and operational foundation in the future.
These forward-looking statements are based on certain factors and assumptions, including, without limitation: the Company’s ability to successfully complete new purchase orders along the timelines expected; continued and future demand for the Company’s products; continued sales to the Company’s major customers; the continued financial health of the semiconductor industry; and the Company’s ability to continue and further enhance revenue diversification and open new market opportunities.
Forward-looking statements are subject to a variety of known and unknown risks, uncertainties and other factors which could cause actual events or results to differ from those expressed or implied by the forward-looking statements, including, without limitation: additional measures and controls may not be implemented as expected or along the timelines anticipated; uncertainties relating to the market for the Company’s products and maintaining a stable level of orders; fluctuations in revenue as a result of volatility in the markets and product mix; risks relating to the Company’s present reliance on its major customers for the majority of its sales; risks relating to the Company’s reliance on the financial health of the semiconductor industry; risks relating to the development of competing technologies and the possibility of increased competition; the effect of slow growth in the United States, the Company’s principal market, as well as other economies and other economic trends and conditions in the markets that the Company and its customers serve; risks associated with technical difficulties or delays in product introductions, improvements, implementation; uncertainties in product pricing or other initiatives of the Company and its competitors; uncertainties in factors that may result in a reduction in capital expenditures and/or delayed buying decisions affecting demand for the Company’s products; risks relating to currency fluctuations, particularly between the Canadian and United States dollars; and risks in pursuing additional development projects to support existing customers or pursue other business opportunities.
The foregoing assumptions, risks and uncertainties are not exhaustive of the items that may affect our forward-looking statements. Should underlying assumptions prove to be incorrect or one or more of these risks and uncertainties materialize, actual results may vary materially from those described in the forward-looking statements. The Company’s forward-looking statements are based on beliefs, expectations and opinions of management on the date the statements are made.
For the reasons set forth above, readers should not place undue reliance on forward-looking statements. The Company undertakes no obligation to update or revise any forward-looking statements included herein if these beliefs, estimates and opinions or other circumstances should change, except as otherwise required by applicable law.
7 November 20182

Photon ControlWe provide fiber optic process monitoring systems to increase the value and competitiveness of our customers’ Wafer Fabrication Equipment (“WFE”) by enabling end users (chip makers) to improve yield, uptime, and profitability.
7 November 20183
$8.8 $8.8
$11.0 $11.9 $12.6
$18.2
$24.7
$19.5
$14.4
$-
$5.0
$10.0
$15.0
$20.0
$25.0
$30.0
Order Backlog (CAD) $ in millions
64% INCREASE
Q3 2018 YTD 2018
Revenue (C$ millions) $10.1 $38.5
YoY Revenue Change (16%) 17%
Gross Margin 52% 56%
EBITDA Margin 30% 33%
Cash on 9/30/2018 $43 million (No Debt)
Revenue Guidance:Q4 2018 $8 to $9 million FY 2018 Exceeding overall industry growth

Target MarketsOur target customers are Wafer Fabrication Equipment (WFE) suppliers in the semiconductor and other solid-state industries.
Our products are deployed in the harshest environments where the most precise measurements are required to produce the end customers’ most advanced and valuable products.
Our solutions become “designed in” to our partners’ products, producing stable growing revenue streams with multi-year life cycles.
7 November 20184

Market and Technology
Drivers

Global Semiconductor Market
Broadening & diversifying into all elements of the economy
7 November 20186
Autos: $30B (9%)1
Robotics $10B (30%)
IoT $30B (15%)
Phones: $85B (4%) Servers: $15B (6%)
VR/AR: $10B (15%)
Medical: $5B (11%)
1 Labeling convention: “Market segment”: IC Revenue in 2020 (CAGR 2016-2020)

Technology Trends Drive Our Growth
7 November 20187
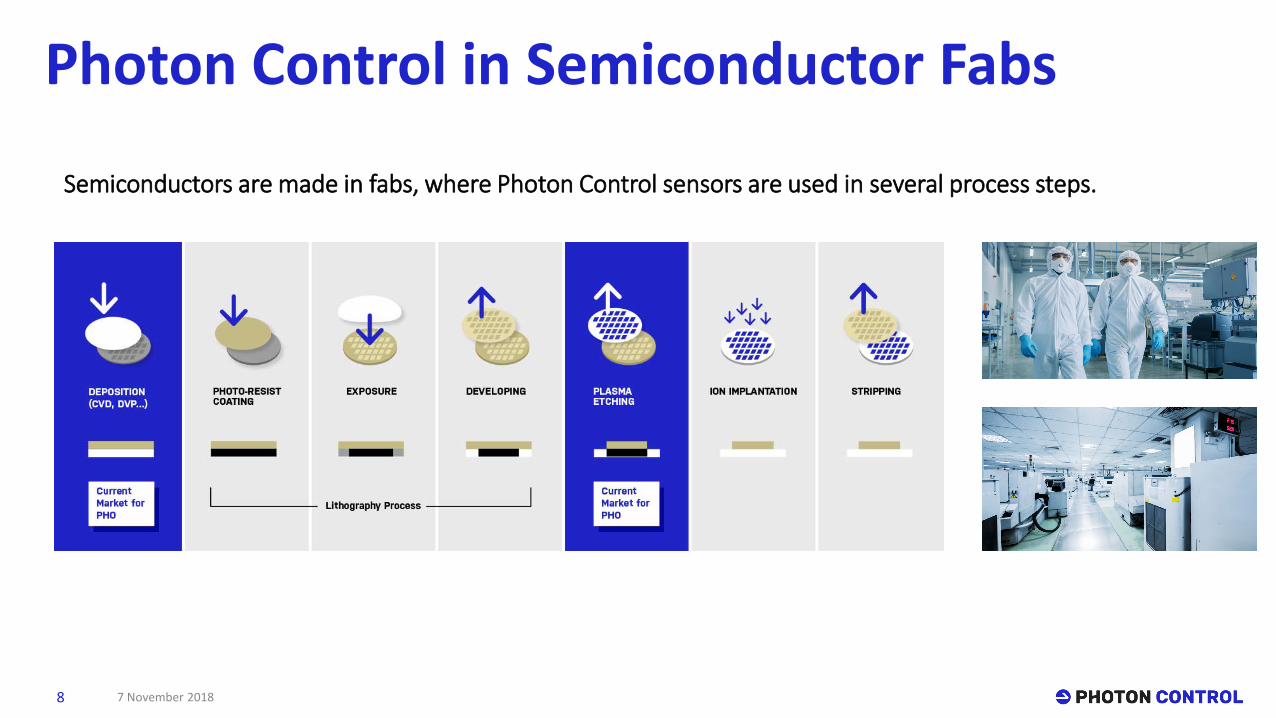
Photon Control in Semiconductor Fabs
Semiconductors are made in fabs, where Photon Control sensors are used in several process steps.
7 November 20188

Serving the Largest WFE OEMs in Etch
Global WFE Market by Process (2017)
(Billions of USD)
7 November 20189
Lam Research
$5.1(47.2%)
TokyoElectron
$2.8(26.3%)
AppliedMaterials
$2.0(18.5%)
Hitachi$0.4
(3.7%)
Others$0.5
(4.2%)
Dry Etch Equipment Market share (2017)
(Billions of USD)
Source: Gartner, Market Share: Semiconductor Wafer Fab Equipment, Worldwide, 2017
Total Dry Etch Equipment Market = $10.8BTotal WFE Market = $51B
Deposition$12.3 Litho & Track
$10.3
Automation$2.5
Inspection & Met.$5.5
Other $1.9
Thermal & doping
$2.7
Other clean & removal
$5.2
Dry Etch$10.8

Wafer Fabrication Equipment SegmentsEtch Equipment Share Surges in Era of 3D NAND and sub-20nm Logic
7 November 201810
Source: SEMI/SEAJ, SEMI EMDS
Device Total Etch Steps
Logic 40nm 35
Logic 28nm 50
Logic 10nm >110
Logic 7nm >140
Source: SEMI ISS, G Yin AMEC, Jan 2017
Etch spend 3D NAND
Etch spend 2D NAND> 3X
Sources:• Tokyo Electron (Corp IR, May 2017)• Lam Research (Investor Meeting, Mar 2018)
Etch
Litho
CVD

Products and Differentiators

Photon’s Temperature Sensor SystemImproving Yield by Improving Wafer Temperature UniformityThe performance of an individual chip is very sensitive to the local wafer temperature. More sensors enable better temperature control & uniformity which produce higher yield.
7 November 201812

Competitive Positioning
Compared to competitors, Photon Control offers:• Most accurate and stable products in the market.• 20+ years of expertise in materials, optics, & signal processing.• Custom in-house development & rapid prototyping.• Integrated engineering, manufacture, & service (“under one roof”).
Compared to other technologies, our approach offers:• Best accuracy and long-term stability.• Immunity to harsh environments (e.g., RF, microwave).• Longest life and lowest maintenance costs.
7 November 201813
Photon Control has the highest accuracy and stability in the harshest environments
Photon Control is the leader in fiber optic temperature sensors in Wafer Fabrication Equipment (WFE)

Market Size and Growth Strategy

Our Semiconductor Opportunity Landscape
7 November 201815

Total Addressable MarketFiber Optic Sensors in Semi• Total semi fiber optic sensor market
outpaces WFE markets (5 year CAGR 37% vs 2.3%1).
• More sensors enable the tighter process control required for more advanced devices.
• New techniques of measurement are under development.
• New points of measurement being requested by customers.
7 November 201816
1 Gartner (2018)

Strategy for Revenue Growth• Target:
• Reach a doubling of run rate revenue by 2021.
• Strategy: • Expand product portfolio with
innovative, yield-enhancing new products which allow us to increase our technical differentiation and market share.
• Dual path to product portfolio expansion: organic and inorganic
7 November 201817
2021 & Beyond+$100M (CDN)
$40M (CDN)

Growth and Investment StrategyTarget Markets• Stay focused on semiconductor equipment.• Dry Etch: Maintain or increase share as dry etch fiber optic sensor market continues to grow.• Deposition: Dominate the fiber optic sensor market for “harsh environment” deposition as its growth
accelerates.• Other: Expand in to other semi verticals.
Product Portfolio• Extend current technology:
• Improve performance of current products and reduce cost per point.
• Disruptive technologies: • Add disruptive sensor products to our portfolio through a combination of internal development, strategic
partnerships, and acquisition.
• M&A can accelerate our time to market for new products, and /or add incremental near-term revenue .
7 November 201818

Financial Profile

Revenue – 5 Year CAGR = 33%
7 November 201820
Trailing Twelve Months Revenue CAD$ M
0
10
20
30
40
50
60
Q4 Q1 Q2 Q3 Q4 Q1 Q2 Q3 Q4 Q1 Q2 Q3 Q4 Q1 Q2 Q3 Q4 Q1 Q2 Q3 Q4 Q1 Q2 Q3
2012 2013 2014 2015 2016 2017 2018
TTM Revenue

Revenue Growing Faster Than Market
Etch WFE > Semi WFE• Multi-patterning• 3D NAND• Atomic scale manufacturing• Extremely harsh environment• Growth in Etch WFE is highest for the most
advanced products
Photon Control > Etch WFE• Our Sensors provide greatest advantages for the
most advanced products.• Photon Control’s advantages have made it the
market and technology leader in this space.
7 November 201821

Strong Revenue & EBITDA Growth
7 November 201822
CAD$ M
$17.3
$21.0
$27.6
$32.2
$43.8
$49.5
$4.4 $6.0
$10.5 $10.5
$14.3 $15.7
25.3%
28.5%
38.2%
32.7% 32.6%31.8%
2013 2014 2015 2016 2017 TTM
Revenue
EBITDA
EBITDA Margin5-year CAGR = 33%

Strong Free Cash Flow
7 November 201823
CAD$ M
$1.8
$8.2
$12.3
$7.6 $8.4
$15.3
$6.1
$14.1
$26.2
$32.5 $34.3
$42.7
2013 2014 2015 2016 2017 TTM
Cash from Operations
Cash

Price History/Share Data
7 November 201824
Analyst Coverage: Echelon Wealth Partners
GMP Securities
Paradigm Capital
TSX Exchange: PHO
Closing Price (@ 11/7/18) $1.71
# Shares (Basic) 111m
# Shares(Fully Diluted) 114m
52-Week High $2.60
52-Week Low $1.38
Market Capitalization (@11/7/18) $189m
Cash (@ 9/30/18) $43m
Debt (@ 9/30/18) Nil
Nov

Key Takeaways
• Critical systems supplier to the largest customers in our space
• Multiple competitive advantages
• Leader in a large, growing market with a rich new product funnel
• Enviable financial metrics and strong balance sheet
• Generating significant cash to invest in the business, opportunistically pursue acquisitions and buy back shares
7 November 201825