Company ABC Valuation - tresvista.com AB… · Company ABC Valuation Active Operating Case:...
20
Company ABC Valuation Active Operating Case: Management Active LBO Case: 2 Model Date: 30 January Year 5 All figures in EUR millions, unless otherwise stated 1 of 20
-
Upload
phungtuyen -
Category
Documents
-
view
219 -
download
0
Transcript of Company ABC Valuation - tresvista.com AB… · Company ABC Valuation Active Operating Case:...

Company ABC ValuationActive Operating Case: Management
Active LBO Case: 2
Model Date: 30 January Year 5
All figures in EUR millions, unless otherwise stated
1 of 20

Company ABC Valuation - Guide
All figures in EUR millions, unless otherwise stated
Model Architecture
The model is broken up into the following parts:
Tab Description
Cover Provides user with a brief company description and informs the user of current operating and financing cases
LBO Contains all of the key switches and inputs for the LBO analysis. It also contains sources and uses,
financing facilities, LBO assumptions, LBO returns, and the sensitivity analysis
DCF Contains all of the key switches and inputs for the DCF analysis. It also contains assumptions on WACC, exit multiple,
perpetuity growth rate, and assumptions for years beyond the modeled period
Model Contains historical and projected income statement, balance sheet, and cash flow
Assumptions Tab Captures assumptions used in the operating model
Presentation Protocol
Number colour key is as follows:
#s are hardcoded
#s contain links to other sheets
#s contain formulas
#s linked to previous cell, can be inputted
#s are exceptions to an otherwise homogenous set of cells
Key Switches
Operating Model Switch Located in cell L6 of the "LBO" sheet Used to toggle between the four operating model cases
LBO Switch Located in cell E6 of the "LBO" sheet Used to toggle between the five LBO financing cases
Model Checklist
Operations Source Documents Used:
Revenue Primary Case Forecast Method Management Forecasts 1 Company Presentation
COGS Primary Case Forecast Method Management Forecasts
SG&A Primary Case Forecast Method Management Forecasts
Tax Deduction on Interest on Shareholders' Note 0
NOL Benefit on Taxable Income No
Balance Sheet Accounts Forecast Method Management Forecasts
- Number of Secondary Cases 3
-- Nature of Secondary Cases (If applicable)
Case 1 Bull
Case 2 Bear
Case 3 Base
-- Secondary Cases Forecast Method TresVista Assumption
LBO & Financing
Funding Shortage Negative Cash Balance
Interest on Shareholders’ note PIK
No. of Cases for LBO 5
-- Case 1 Senior Secured Note
-- Case 2 Combination of Multiple Instruments
-- Case 3 Bank Debt
-- Case 4 Bank Debt
-- Case 5 Combination of Multiple Instruments
Shareholders' Note Include
Management Sweat Equity Include
-- Existing Sweat Equity Rollover (if applicable) Yes
*Note: Equity Infusion will be the plug after accomodating all the debt cases from above to
meet LBO funding requirements
LBO Pro-forma Year 1st Forecast Period
Departmental/segmental Exit No
2 of 20

Company ABC Valuation - LBO Control Sheet
All figures in EUR millions, unless otherwise stated
Control
LBO Financing Case Selected: 2 2 <-- Select between 1-5 Operating Model Case Selected: Management Case 1
Case 1: Senior Secured Notes Management 1
Case 2: Debt Tranches Target 2
Case 3-5: Dummy cases Low 3
Base 4
LBO Assumptions
Entry multiple 6.5x
Transaction Fees on Entry 2.0%
Financing Fees on Entry 1.0%
Leverage Multiple 2.0x
Exit year Year 7
Exit multiple 6.5x
Transaction Fees on Exit 2.0%
Minimum Cash Balance 7.0
Management Equity Rollover 0.0%
Transaction Summary Transaction Value
Cash 3.3 Year 4E EBITDA 20.6
Debt 41.2 Entry/Exit EBITDA Multiple 6.5x
Debt Like Items 3.9 Enterprise Value 133.9
Equity 91.9 Net Debt (62.1)
Total Financing 140.3 Pension Deficit (3.9)
Equity Value 67.9
% IRR 26.6%
CoC 2.0x Loan note -
Gross Capital Gain (€ millions) 91.0 Existing Owner 100.0% -
Management 0.0% -
Common equity 67.9
Existing Owner 100.0% 67.9
Management 0.0% -
Existing Owner 67.9
Management Equity -
Sources & Uses Goodwill and Equity
Sources Amount % of Capital Uses Amount % of Capital Goodwill Created
Cash, less min. 3.3 2.4% Purchase of Equity 67.9 48.4% Purchase of Equity 67.9
Payment of Existing Debt 65.5 46.7% Transaction & Financing Fees 3.1
Debt Transaction Fees 2.7 1.9% Existing Goodwill 33.9
Senior-secured bond - 0.0% Financing Fees 0.4 0.3% Less: Existing Book Value (11.5)
Debt Tranche A 20.6 14.7% Pension 3.9 2.8% Goodwill Calculated 93.4
Debt Tranche B 20.6 14.7%
Total Debt 41.2 29.4%
Debt Like Items Equity Calculations
Pension Deficit 3.9 2.8% Shareholder Loan Note 73.5
Total Debt 3.9 2.8% GP 73.5
Management -
Equity Common equity 18.4
Shareholders' Note 73.5 52.4% GP 14.7
Common Equity 18.4 13.1% Management 3.7
Total GP 88.2
GP Equity 88.2 62.9% Total Management 3.7
Management Equity 3.7 2.6% Total equity 91.9
Total Equity 91.9 65.5% Mgmt. equity roll over -
Total Sources 140.3 100.0% Total Uses 140.3 100.0%
3 of 20

Company ABC Valuation - LBO Control Sheet
All figures in EUR millions, unless otherwise stated
Financing Cases
Interest Case Options Case
Rates 1 2 3 4 5 Selected: 2 Repayment
Debt Amount
Senior-secured bond 7.50% 41.2 - - - 20.6 - Year 9 <-- Maturity
Debt Tranche A 7.50% - 20.6 41.2 - 10.3 20.6 0
Debt Tranche B 6.50% - 20.6 - 41.2 10.3 20.6 0 Sweep: 1=Yes; 0=No
Emergengy Loan note 20.00% - - - - - - 1
Total 41.2 41.2 41.2 41.2 41.2 41.2
Debt/EBITDA 2.0x 2.0x 2.0x 2.0x 2.0x 2.0x
Share in Total Debt
Senior-secured bond 100.0% 0.0% 0.0% 0.0% 50.0% 0.0%
Debt Tranche A 0.0% 50.0% 100.0% 0.0% 25.0% 50.0%
Debt Tranche B 0.0% 50.0% 0.0% 100.0% 25.0% 50.0%
Emergengy Loan note 0.0% 0.0% 0.0% 0.0% 0.0% 0.0%
Total 100.0% 100.0% 100.0% 100.0% 100.0% 100.0%
Equity
Equity 1 (Shareholders' Note) 73.5 73.5 73.5 73.5 73.5 73.5
Equity 2 (Common Equity) 18.4 18.4 18.4 18.4 18.4 18.4
Total 91.9 91.9 91.9 91.9 91.9 91.9
Share in Total Debt
Equity 1 (Shareholders' Note) 80.0% 80.0% 80.0% 80.0% 80.0% 80.0%
GP Share 100.0% 100.0% 100.0% 100.0% 100.0% 100.0%
Management Share 0.0% 0.0% 0.0% 0.0% 0.0% 0.0%
Equity 2 (Common Equity) 20.0% 20.0% 20.0% 20.0% 20.0% 20.0%
GP Share 80.0% 80.0% 80.0% 80.0% 80.0% 80.0%
Management Share 20.0% 20.0% 20.0% 20.0% 20.0% 20.0%
Shareholders' Note Interest Rate 10.0% 10.0% 10.0% 10.0% 10.0% 10.0%
Interest Expense On Shareholders' Note Tax Deductible? 0 (0=No;1=Yes)
Interest Expense On Emergency Loan Note Tax Deductible? 0 (0=No;1=Yes)
4 of 20

Company ABC Valuation - LBO Control Sheet
All figures in EUR millions, unless otherwise stated
LBO Returns
Year 5 E Year 6 E Year 7 E Year 8 E Year 9 E
Insolvency Check Insolvent Insolvent Insolvent Solvent Solvent
Exit Cascade
Exit year Year 7 - - Exit - -
EBITDA 23.5 31.8 34.7 37.8 41.4
Exit multiple 6.5x 6.5x 6.5x 6.5x 6.5x 6.5x
Enterprise Value - - 225.6 - -
Less: Exit costs 2.0% - - (4.5) - -
Enterprise Value (post exit costs) - - 221.1 - -
Less: Net debt - - (17.7) - -
Less: Pension Deficit - - (3.9) - -
Value attributable to shareholders - - 199.5 - -
Equity Distribution:
Equity 1 (Shareholders' Note) - - 97.9 - -
GP Share 100.0% - - 97.9 - -
Management Share 0.0% - - - - -
Equity 2 (Common Equity) - - 101.7 - -
GP Share 80.0% - - 81.3 - -
Management Share 20.0% - - 20.3 - -
Total Equity - - 199.5 - -
GP - - 179.2 - -
Management - - 20.3 - -
FWD EBITDA - - 37.8 - -
Implied FWD Multiple - - 6.0x - -
Returns (Common Equity Only) Entry Year 5 E Year 6 E Year 7 E Year 8 E Year 9 E
Initial Investment (88.2) - - - - -
Follow-on - - - - -
Cash Interest on Shareholders' Note - - - - -
Exit proceeds - - 179.2 - -
Total cash flows (88.2) - - 179.2 - -
% IRR 26.6%
CoC 2.0x
Gross Capital Gain (€ millions) 91.0
5 of 20

Company ABC Valuation - LBO Control Sheet
All figures in EUR millions, unless otherwise stated
Returns Sensitivity
IRR Sensitivity to Exit Multiple and Exit Year IRR Sensitivity to Exit Multiple and Entry Multiple IRR Sensitivity to Exit Multiple and Leverage
Exit Year Entry Multiple Leverage
26.6% Year 6 F Year 7 F Year 8 F 26.6% 9.5x 10.0x 10.5x 26.6% 2.0x 3.0x 4.0x
9.0x 57.2% 41.0% 33.6% 9.0x 20.6% 18.3% 16.2% 9.0x 41.0% 50.3% 64.6%
Exit 9.5x 61.7% 43.5% 35.3% Exit 9.5x 22.6% 20.3% 18.2% Exit 9.5x 43.5% 53.1% 67.9%
Multiple 10.0x 66.0% 46.0% 37.0% Multiple 10.0x 24.6% 22.2% 20.1% Multiple 10.0x 46.0% 55.9% 71.1%
10.5x 70.2% 48.3% 38.6% 10.5x 26.6% 24.1% 21.9% 10.5x 48.3% 58.6% 74.2%
11.0x 74.3% 50.6% 40.1% 11.0x 28.4% 25.9% 23.7% 11.0x 50.6% 61.2% 77.2%
CoC Sensitivity to Exit Multiple and Exit Year CoC Sensitivity to Exit Multiple and Entry Multiple CoC Sensitivity to Exit Multiple and Leverage
Exit Year Entry Multiple Leverage
2.0x Year 6 F Year 7 F Year 8 F 2.0x 9.5x 10.0x 10.5x 2.0x 2.0x 3.0x 4.0x
9.0x 2.5x 2.8x 3.2x 9.0x 1.8x 1.7x 1.6x 9.0x 2.8x 3.4x 4.5x
Exit 9.5x 2.6x 3.0x 3.4x Exit 9.5x 1.8x 1.7x 1.7x Exit 9.5x 3.0x 3.6x 4.7x
Multiple 10.0x 2.8x 3.1x 3.5x Multiple 10.0x 1.9x 1.8x 1.7x Multiple 10.0x 3.1x 3.8x 5.0x
10.5x 2.9x 3.3x 3.7x 10.5x 2.0x 1.9x 1.8x 10.5x 3.3x 4.0x 5.3x
11.0x 3.0x 3.4x 3.9x 11.0x 2.1x 2.0x 1.9x 11.0x 3.4x 4.2x 5.6x
Gross Capital Gain Sensitivity to Exit Multiple and Exit Year Gross Capital Gain Sensitivity to Exit Multiple and Entry Multiple Gross Capital Gain Sensitivity to Exit Multiple and Leverage
Exit Year Entry Multiple Leverage
$91.0 Year 6 F Year 7 F Year 8 F $91.0 9.5x 10.0x 10.5x $91.0 2.0x 3.0x 4.0x
9.0x 129.9 159.0 192.7 9.0x 111.9 104.1 96.2 9.0x 159.0 164.4 169.7
Exit 9.5x 142.4 172.6 207.5 Exit 9.5x 125.5 117.7 109.8 Exit 9.5x 172.6 178.0 183.3
Multiple 10.0x 154.9 186.2 222.3 Multiple 10.0x 139.1 131.3 123.4 Multiple 10.0x 186.2 191.6 196.9
10.5x 167.3 199.8 237.1 10.5x 152.7 144.9 137.0 10.5x 199.8 205.2 210.5
11.0x 179.8 213.4 251.9 11.0x 166.3 158.5 150.6 11.0x 213.4 218.8 224.1
6 of 20

Company ABC Valuation - DCF Valuation
All figures in EUR millions, unless otherwise stated
DCF Summary
Transaction Summary
Entry Assumptions DCF Output Exit Method Growth Method
Enterprise Value 140.3 Enterprise Value 132.8 45.5
Total Equity Value 71.0 Total Equity Value 98.6 11.3
Entry Multiple 6.5x Exit Multiple 6.5x
Perpetuity Growth Rate 2.0%
WACC 10.0% 10.0%
Returns Multiple 1.4x 0.2x
Projection - December Year End
Year 5 E Year 6 E Year 7 E Year 8 E Year 9 E Year 10 E Year 11 E
Revenues 193.0 227.9 246.1 267.6 293.3 316.1 335.1
Growth Rate 18.0% 8.0% 8.8% 9.6% 7.8% 6.0%
Operating Activities
EBITDA 23.5 31.8 34.7 37.8 41.4 44.6 47.3
Less: Depreciation & Amortization (9.1) (9.3) (8.6) (9.4) (10.3) (11.1) (11.7)
EBIT 32.6 41.1 43.3 47.1 51.6 55.7 59.0
Less: Taxes at Effective Tax Rate 68.6 17.9 15.5 16.8 18.4 19.9 21.1
Tax-effected EBIT (36.0) 23.3 27.8 30.3 33.2 35.8 37.9
Plus: Depreciation (9.1) (9.3) (8.6) (9.4) (10.3) (11.1) (11.7)
Changes in Other Assets and Liabilities (0.8) (0.8) (0.8) 0.4 0.5 - -
Less Change in Working Capital (1.8) (4.0) (5.3) (2.5) (3.0) (3.0) (3.0)
Less Capital Expenditures - PP&E (8.3) (9.3) (9.2) (10.0) (10.9) (11.8) (12.5)
Unlevered Free Cash Flow (56.0) (0.2) 4.0 8.9 9.5 10.0 10.8
Wcap (Growth)/Phase out (2.2) (1.3) 2.8 (0.5) - -
Capex as a % of Sales 4.3% 4.1% 3.7% 3.7% 3.7% 3.7% 3.7%
Effective Tax-rate 210.5% 43.4% 35.7% 35.7% 35.7% 35.7% 35.7%
Net Debt Calculations (As of December 31, Year 4 - Proforma)
Total Debt 41.2
Less: Cash (7.0)
Net Debt 34.2
Assumptions
Cost of Capital (WACC) 10.0%
Growth Rate 2.0%
Exit Multiple 6.5x
Page 7 of 20

Company ABC Valuation - DCF Valuation
All figures in EUR millions, unless otherwise stated
A + B = C
Discounted PV of Terminal Value as a
Cash Flow Multiple of Year 11 EBITDA Enterprise Value
Discount Rate Year 5 - Year 11 6.0x 6.5x 7.0x 6.0x 6.5x 7.0x
9.0% (€24.1) €155.2 €168.1 €181.0 €131.0 €144.0 €156.9
9.5% (24.5) 150.3 162.8 175.3 125.8 138.3 150.8
10.0% (24.9) 145.6 157.7 169.8 120.6 132.8 144.9
10.5% (25.3) 141.0 152.8 164.5 115.7 127.5 139.2
11.0% (25.6) 136.6 148.0 159.4 111.0 122.4 133.7
D = E
Net Debt Total Equity Value
Discount Rate Year 4 6.0x 6.5x 7.0x
9.0% €34.2 €96.8 €109.8 €122.7
9.5% 34.2 91.6 104.1 116.6
10.0% 34.2 86.4 98.6 110.7
10.5% 34.2 81.5 93.3 105.0
11.0% 34.2 76.8 88.2 99.5
Terminal Value as a % of Enterprise Value Implied Perpetuity Growth Rate
Discount Rate 6.0x 6.5x 7.0x 6.0x 6.5x 7.0x
9.0% 118.4% 116.7% 115.4% 5.0% 5.3% 5.6%
9.5% 119.5% 117.7% 116.3% 5.5% 5.8% 6.1%
10.0% 120.6% 118.8% 117.2% 6.0% 6.3% 6.5%
10.5% 121.8% 119.8% 118.2% 6.5% 6.8% 7.0%
11.0% 123.1% 121.0% 119.2% 6.9% 7.2% 7.5%
Page 8 of 20

Company ABC Valuation - DCF Valuation
All figures in EUR millions, unless otherwise stated
F + G = H
Discounted PV of Terminal Value as a
Cash Flow Perpetual Growth Rate Enterprise Value
Discount Rate Year 5 - Year 11 1.5% 2.0% 2.5% 1.5% 2.0% 2.5%
9.0% (€24.1) €79.6 €85.7 €92.8 €55.5 €61.6 €68.7
9.5% (24.5) 72.3 77.5 83.4 47.8 53.0 58.9
10.0% (24.9) 65.9 70.4 75.4 41.0 45.5 50.5
10.5% (25.3) 60.3 64.2 68.5 35.0 38.9 43.2
11.0% (25.6) 55.3 58.7 62.5 29.7 33.1 36.8
I = J
Net Debt Total Equity Value
Discount Rate Year 4 1.5% 2.0% 2.5%
9.0% €34.2 €21.3 €27.4 €34.5
9.5% 34.2 13.6 18.8 24.7
10.0% 34.2 6.8 11.3 16.3
10.5% 34.2 0.8 4.7 9.0
11.0% 34.2 (4.5) (1.1) 2.6
Terminal Value as a % of Enterprise Value Equivalent Terminal EBITDA Multiple
Discount Rate 1.5% 2.0% 2.5% 1.5% 2.0% 2.5%
9.0% 143.4% 139.1% 135.1% 3.1x 3.3x 3.6x
9.5% 151.3% 146.3% 141.6% 2.9x 3.1x 3.3x
10.0% 160.8% 154.8% 149.3% 2.7x 2.9x 3.1x
10.5% 172.2% 165.0% 158.5% 2.6x 2.7x 2.9x
11.0% 186.3% 177.5% 169.6% 2.4x 2.6x 2.7x
Page 9 of 20

Company ABC Valuation - Financials
All figures in EUR millions, unless otherwise stated
Income Statement Historical - December Year End Pro Forma Projection - December Year End CAGR
Year 1 A Year 2 A Year 3 A Year 4 A Year 4 A Year 5 E Year 6 E Year 7 E Year 8 E Year 9 E Year 4 - Year 9
Total Sales €155.9 €170.9 €172.3 €179.9 €179.9 €193.0 €227.9 €246.1 €267.6 €293.3 10.3%
Total Cost of Goods Sold (101.5) (114.8) (113.2) (117.8) (117.8) (127.0) (149.1) (161.4) (175.5) (192.4)
Gross Profit 54.3 56.1 59.1 62.1 62.1 66.0 78.8 84.7 92.1 100.9
SG&A (36.8) (37.4) (39.4) (82.7) (82.7) (89.5) (110.5) (119.4) (129.8) (142.3)
EBITDA 17.6 18.7 19.7 20.6 20.6 23.5 31.8 34.7 37.8 41.4 15.0%
Depreciation (9.3) (8.9) (9.5) (9.2) (9.2) (9.1) (9.3) (8.6) (9.4) (10.3)
Amortization (5.8) (5.9) (5.9) (6.1) (6.1) - - - - -
EBIT 2.4 4.0 4.4 5.2 5.2 14.4 22.4 26.1 28.4 31.1 42.7%
Non Recurring Expenses (4.4) (4.6) (4.1) (3.6) (3.6) (1.5) (1.5) (1.5) (1.6) (1.8)
Financial (Income)/Charges (4.7) (5.6) (4.3) (4.2) (4.2) (10.1) (13.4) (14.7) (15.9) (16.6)
EBT (6.6) (6.2) (4.0) (2.6) (2.6) 2.9 7.5 9.9 10.9 12.7
Tax (2.3) (2.7) (2.5) (2.9) (2.9) (21.5) (7.9) (8.0) (9.0) (10.2)
Net Profit/ (Loss) (€9.0) (€8.8) (€6.4) (€5.5) (€5.5) (€18.7) (€0.4) €1.9 €1.9 €2.5 NA
Margins Analysis
Gross Profit 34.9% 32.8% 34.3% 34.5% 34.5% 34.2% 34.6% 34.4% 34.4% 34.4%
EBITDA 11.3% 10.9% 11.4% 11.5% 11.5% 12.2% 13.9% 14.1% 14.1% 14.1%
EBIT 1.6% 2.3% 2.5% 2.9% 2.9% 7.5% 9.8% 10.6% 10.6% 10.6%
Net Profit/(Loss) (5.7%) (5.2%) (3.7%) (3.0%) (3.0%) (9.7%) (0.2%) 0.8% 0.7% 0.8%
Effective Tax Rate 35.5% 43.3% 62.0% 114.1% 114.1% 210.5% 43.4% 35.7% 35.7% 35.7%
Depreciation as a % of Sales 6.0% 5.2% 5.5% 5.1% 5.1% 4.7% 4.1% 3.5% 3.5% 3.5%
Amortization as a % of Sales 3.7% 3.4% 3.4% 3.4% 3.4% 2.9% 2.3% 2.4% 2.4% 2.4%
Non Recurring Expenses as a % of Sales 2.8% 2.7% 2.4% 2.0% 2.0% 0.8% 0.7% 0.6% 0.6% 0.6%
Growth Analysis
Sales 9.6% 0.8% 4.4% 4.4% 7.3% 18.0% 8.0% 8.8% 9.6%
Gross Profit 3.2% 5.4% 5.0% 5.0% 6.4% 19.3% 7.5% 8.8% 9.6%
EBITDA 6.4% 5.5% 4.4% 4.4% 14.1% 35.2% 9.2% 8.8% 9.6%
EBIT 62.9% 10.0% 20.0% 20.0% 174.9% 55.5% 16.3% 8.8% 9.6%
Net Profit/(Loss) (1.4%) (27.2%) (15.0%) (15.0%) 241.5% (97.8%) (560.2%) 2.7% 29.1%
Revenue Schedule
Core Automotive 91.0 100.0 110.0 124.0 124.0 136.4 168.0 183.7 202.6 225.3
Powertrain Lines & Assembles 6.0 9.7 11.1 13.5 13.5 18.1 44.4 55.4 69.1 86.3
Fluid Handling Lines-Chassis 44.7 44.1 49.5 57.5 57.5 65.2 70.6 75.8 81.4 87.4
HVAC Parts 34.7 33.7 34.2 37.5 37.5 38.8 40.7 40.9 41.1 41.3
Cooling Component 5.6 12.5 15.2 15.5 15.5 14.3 12.3 11.6 10.9 10.3
Other Automotives 37.5 41.2 39.1 38.1 38.1 38.1 39.6 40.2 40.8 41.4
Airbag 1.2 0.9 1.8 1.9 1.9 1.8 1.9 1.9 1.9 1.9
Seating Parts 10.6 9.2 10.8 10.5 10.5 9.9 8.0 8.0 8.0 8.0
Other Automotives 5.7 6.6 3.5 2.5 2.5 2.4 2.5 2.5 2.5 2.5
Die Casting - Automotive 20.0 24.5 23.0 23.2 23.2 24.0 27.2 27.8 28.4 29.0-
Industrial 24.4 25.9 19.3 15.9 15.9 16.6 18.2 20.1 22.2 24.5
Others 3.0 3.8 3.9 2.0 2.0 1.9 2.0 2.0 2.0 2.0
Total Revenue €155.9 €170.9 €172.3 €179.9 €179.9 €193.0 €227.9 €246.1 €267.6 €293.3
Revenue Segmented by Growth
Powertrain Lines & Assembles 61.7% 14.4% 21.5% 21.5% 34.4% 144.9% 24.8% 24.8% 24.8%
Fluid Handling Lines-Chassis (1.3%) 12.2% 16.2% 16.2% 13.5% 8.2% 7.4% 7.4% 7.4%
HVAC Parts (2.9%) 1.5% 9.7% 9.7% 3.4% 4.9% 0.5% 0.5% 0.5%
Cooling Component 123.2% 21.6% 1.7% 1.7% (7.8%) (13.7%) (5.7%) (5.7%) (5.7%)
Airbag (25.0%) 100.0% 3.9% 3.9% (4.1%) 5.9% (0.0%) (0.0%) (0.0%)
Seating Parts (13.2%) 17.4% (2.4%) (2.4%) (5.9%) (19.3%) (0.0%) (0.0%) (0.0%)
Other Automotives 15.8% (47.0%) (29.7%) (29.7%) (4.1%) 5.9% (0.0%) (0.0%) (0.0%)
Die Casting - Automotive 22.5% (6.1%) 1.0% 1.0% 3.2% 13.4% 2.2% 2.2% 2.2%
Industrial 6.1% (25.5%) (17.9%) (17.9%) 4.8% 9.5% 10.4% 10.4% 10.4%
Others 27.8% 1.8% (48.5%) (48.5%) (4.1%) 5.9% (0.0%) (0.0%) (0.0%)Others
10 of 20

Company ABC Valuation - Financials
All figures in EUR millions, unless otherwise stated
Income Statement Historical - December Year End Pro Forma Projection - December Year End CAGR
Year 1 A Year 2 A Year 3 A Year 4 A Year 4 A Year 5 E Year 6 E Year 7 E Year 8 E Year 9 E Year 4 - Year 9
Balance Sheet Historical - December Year End Pro Forma Projection - December Year End
Year 1 A Year 2 A Year 3 A Year 4 A Year 4 A Year 5 E Year 6 E Year 7 E Year 8 E Year 9 E
Assets
Current Assets:
Cash €7.5 €7.1 €6.9 €10.3 €7.0 €7.0 €7.0 €7.0 €7.0 €7.0
Inventory 19.8 18.1 21.4 21.8 21.8 23.8 26.5 29.4 32.0 35.1
Trade Receivables 32.6 32.3 25.6 24.6 24.6 26.9 30.0 34.0 37.0 40.5
Others 3.2 2.6 2.1 2.2 2.2 2.2 2.2 2.2 2.4 2.7
Total Current Assets 63.0 60.1 56.0 59.0 55.6 59.9 65.7 72.7 78.4 85.3
PP&E 31.3 29.3 28.2 25.7 25.7 24.9 24.9 25.5 26.1 26.7
Intangible Assets (Existing Goodwill) 57.5 49.6 41.8 33.9 - - - - - -
New Goodwill - 93.4 93.4 93.4 93.4 93.4 93.4
Financial Assets 0.0 0.0 0.0 0.0 0.0 0.0 0.0 0.0 0.0 0.0
Total Assets €151.9 €139.1 €126.0 €118.6 €174.7 €178.3 €184.0 €191.5 €197.9 €205.4
Liabilities
Current Liabilities:
Trade Payables €22.8 €23.9 €24.4 €23.7 €23.7 €26.1 €27.9 €29.6 €32.2 €35.3
Other Liabilities 10.0 10.3 10.8 7.7 7.7 7.7 7.7 7.7 8.4 9.2
Total Current Liabilities 32.8 34.2 35.2 31.4 31.4 33.9 35.6 37.3 40.6 44.5
Deferred Charges 3.8 1.0 1.2 3.4 3.4 3.0 2.7 2.5 2.7 2.9
Provision For Pensions 4.3 4.1 4.1 3.9 3.9 3.9 3.9 3.4 3.4 3.4
Other accruals 6.0 5.8 3.3 2.9 2.9 2.6 2.1 2.1 2.3 2.5
Bank Loan and Overdraft 76.0 73.4 68.1 65.5 - - - - - -
Senior Secured Bond - - - - - - -
Debt Tranche A - 20.6 20.6 16.5 12.4 6.2 -
Debt Tranche B - 20.6 20.6 16.5 12.4 6.2 -
Total Liabilities 123.0 118.4 111.8 107.1 82.8 84.5 77.3 69.9 61.2 53.2
Emergency Loan note - - 13.2 18.5 22.5 25.9 28.2
Shareholders' Note - 73.5 80.9 89.0 97.9 107.7 118.4
Owners Equity and Minority Interest 28.9 20.6 14.3 11.5 18.4 (0.3) (0.7) 1.2 3.1 5.5
Total Equity 28.9 20.6 14.3 11.5 91.9 93.8 106.8 121.6 136.6 152.1
Total Liabilities & Shareholder's Equity €151.9 €139.1 €126.0 €118.6 €174.7 €178.3 €184.0 €191.5 €197.9 €205.4
Check - - - - - - - - - -
11 of 20

Company ABC Valuation - Financials
All figures in EUR millions, unless otherwise stated
Income Statement Historical - December Year End Pro Forma Projection - December Year End CAGR
Year 1 A Year 2 A Year 3 A Year 4 A Year 4 A Year 5 E Year 6 E Year 7 E Year 8 E Year 9 E Year 4 - Year 9
Ratios and Assumptions
Working Capital 22.8 18.8 14.0 17.2 17.2 19.1 23.1 28.3 30.8 33.8
Net Debt 68.5 66.3 61.2 55.1 34.2 34.2 26.0 17.7 5.4 (7.0)
Deferred Charges as a % of Sales 2.4% 0.6% 0.7% 1.9% 1.9% 1.6% 1.2% 1.0% 1.0% 1.0%
Other accruals as a % of Sales 3.9% 3.4% 1.9% 1.6% 1.6% 1.3% 0.9% 0.8% 0.8% 0.8%
PP&E
Beginning Balance - 31.3 29.3 28.2 28.2 25.7 24.9 24.9 25.5 26.1
Capital Expenditure 6.9 8.3 6.7 6.7 8.3 9.3 9.2 10.0 10.9
Depreciation (9.3) (8.9) (9.5) (9.2) (9.2) (9.1) (9.3) (8.6) (9.4) (10.3)
Ending Balance 31.3 29.3 28.2 25.7 25.7 24.9 24.9 25.5 26.1 26.7
Capex as a % of Sales 0.0% 4.0% 4.8% 3.8% 3.8% 4.3% 4.1% 3.7% 3.7% 3.7%
Intangible Assets
Beginning Balance 57.5 49.6 41.8 41.8 - - - - -
Impairment (2.0) (1.9) (1.8) (35.7) - - - - -
Amortization (5.8) (5.9) (5.9) (6.1) (6.1) - - - - -
Ending Balance 57.5 49.6 41.8 33.9 - - - - - -
Impairment as a % of Beg. Intangibles 0.0% (3.5%) (3.8%) (4.4%) (85.3%) 5.5% 8.8% 5.7% 5.7% 5.7%
Inventory Days 71.0 57.4 69.0 67.5 67.5 68.5 64.8 66.5 66.5 66.5
Trade Receivables Days 76.2 69.0 54.3 49.9 49.9 50.8 48.0 50.4 50.4 50.4
Other Assets as a % of Sales 2.1% 1.5% 1.2% 1.2% 1.2% 1.2% 1.0% 0.9% 0.9% 0.9%
Trade Payables Days 53.5 51.0 51.6 48.0 48.0 49.4 44.7 43.9 43.9 43.9
Other Liabilities as a % of Sales 6.4% 6.0% 6.3% 4.3% 4.3% 4.0% 3.4% 3.1% 3.1% 3.1%
12 of 20

Company ABC Valuation - Financials
All figures in EUR millions, unless otherwise stated
Income Statement Historical - December Year End Pro Forma Projection - December Year End CAGR
Year 1 A Year 2 A Year 3 A Year 4 A Year 4 A Year 5 E Year 6 E Year 7 E Year 8 E Year 9 E Year 4 - Year 9
Cash Flow Historical - December Year End Pro Forma Projection - December Year End
Year 1 A Year 2 A Year 3 A Year 4 A Year 4 A Year 5 E Year 6 E Year 7 E Year 8 E Year 9 E
Cash Flow from Operations (CFO)
EBITDA €23.5 €31.8 €34.7 €37.8 €41.4
(Increase) / Decrease in Working Capital (1.8) (4.0) (5.3) (2.5) (3.0)
Tax Payments (21.5) (7.9) (8.0) (9.0) (10.2)
(Increase) / Decrease in Other Assets & Liabilities (0.8) (0.8) (0.8) 0.4 0.5
Total CFO (0.6) 19.1 20.7 26.7 28.7
Cash Flow from Investments (CFI)
Capex (8.3) (9.3) (9.2) (10.0) (10.9)
Total CFI (8.3) (9.3) (9.2) (10.0) (10.9)
FCF (8.9) 9.8 11.5 16.7 17.7
Cash Flow from Financing (CFF)
Increase / (Decrease) in Shareholders' Note - - - - -
Cash Based Other Expenses (1.5) (1.5) (1.5) (1.6) (1.8)
Issue / Repurchase of Equity in Common Equity - - - - -
Increase / (Decrease) in Debt 13.2 (5.6) (7.9) (13.5) (15.3)
Interest (Expense) / Income (2.7) (2.7) (2.1) (1.6) (0.7)
Total CFF 8.9 (9.8) (11.5) (16.7) (17.7)
Beginning Cash 7.0 7.0 7.0 7.0 7.0
Change in Cash - - - - -
Closing Cash €7.0 €7.0 €7.0 €7.0 €7.0
Debt Schedule
CFI+CFO (8.9) 9.8 11.5 16.7 17.7
Cash Based Other Expenses (1.5) (1.5) (1.5) (1.6) (1.8)
Plus: Beginning Cash Balance 7.0 7.0 7.0 7.0 7.0
Less: Cash Floor (7.0) (7.0) (7.0) (7.0) (7.0)
Equity Issued/Repurchased - - - - -
Interest (Expense) / Income (2.7) (2.7) (2.1) (1.6) (0.7)
Free Cash Flow Available to Pay Down Debt (13.2) 5.6 7.9 13.5 15.3
Issuance/(Repayment) of Long-term Debt - (8.2) (8.2) (12.4) (12.4)
Free Cash Flow Available for Equity (13.2) (2.7) (0.4) 1.1 2.9
Issuance/(Repayment) of Equity - - - - -
Free Cash Flow Available for Emergency Loan Note (13.2) (2.7) (0.4) 1.1 2.9
Bank Loan and Overdraft
Cash Available for Repayment of Total Debt (13.2) 5.6 7.9 13.5 15.3
Opening Balance - - - - -
Additions - - - - -
Repayments - - - - -
Closing Balance - - - - -
Interest Rate 6.3% 6.3% 6.3% 6.3% 6.3%
Interest Expense - - - - -
Senior-secured bond
Cash Available for Repayment of Senior-secured bond (13.2) 5.6 7.9 13.5 15.3
Opening Balance - - - - -
Additions - - - - -
Repayments - - - - -
Closing Balance - - - - -
Interest Rate 7.5% 7.5% 7.5% 7.5% 7.5%
Interest Expense - - - - -
13 of 20

Company ABC Valuation - Financials
All figures in EUR millions, unless otherwise stated
Income Statement Historical - December Year End Pro Forma Projection - December Year End CAGR
Year 1 A Year 2 A Year 3 A Year 4 A Year 4 A Year 5 E Year 6 E Year 7 E Year 8 E Year 9 E Year 4 - Year 9
Debt Tranche A
Cash Available for Repayment of Debt Tranche A (13.2) 5.6 7.9 13.5 15.3
Opening Balance 20.6 20.6 16.5 12.4 6.2
Accrued Interest - - - - -
Additions - - - - -
Scheduled Repayments - (4.1) (4.1) (6.2) (6.2)
Voluntary Repayments - - - - -
Closing Balance 20.6 16.5 12.4 6.2 -
Interest Rate 7.5% 7.5% 7.5% 7.5% 7.5%
Interest Expense 1.5 1.5 1.2 0.9 0.5
Interest Payment (1=Cash, 0 PIK) 1 1 1 1 1
Mandatory Repayment Schedule (% of Original Loan Amount) 0.0% 20.0% 20.0% 30.0% 30.0%
Debt Tranche B
Cash Available for Repayment of Debt Tranche B (13.2) 1.4 3.7 7.3 9.1
Opening Balance 20.6 20.6 16.5 12.4 6.2
Accrued Interest - - - - -
Additions - - - - -
Scheduled Repayments - (4.1) (4.1) (6.2) (6.2)
Voluntary Repayments - - - - -
Closing Balance 20.6 16.5 12.4 6.2 -
Interest Rate 6.5% 6.5% 6.5% 6.5% 6.5%
Interest Expense 1.3 1.3 1.1 0.8 0.4
Interest Payment (1=Cash, 0 PIK) 1 1 1 1 1
Mandatory Repayment Schedule (% of Original Loan Amount) 0.0% 20.0% 20.0% 30.0% 30.0%
Shareholders Note
Cash Available for Repayment of Shareholders Note (13.2) (2.7) (0.4) 1.1 2.9
Beginning Balance 73.5 80.9 89.0 97.9 107.7
Accrued Interest 7.4 8.1 8.9 9.8 10.8
Additional Borrowings - - - - -
Ending Balance 80.9 89.0 97.9 107.7 118.4
Interest Rate 10.0% 10.0% 10.0% 10.0% 10.0%
Interest Expense 7.4 8.1 8.9 9.8 10.8
Shareholder Loan Note Interest Payment 0 0 0 0 0
(1=Cash, 0 PIK)
Emergency Loan Note
Cash Available for Repayment of Emergency Loan Note (13.2) (2.7) (0.4) 1.1 2.9
Beginning Balance - 13.2 18.5 22.5 25.9
Accrued Interest - 2.6 3.7 4.5 5.2
Additions 13.2 2.7 0.4 - -
Repayments - - - (1.1) (2.9)
Ending Balance 13.2 18.5 22.5 25.9 28.2
Interest Rate 20.0% 20.0% 20.0% 20.0% 20.0%
Interest Expense - 2.6 3.7 4.5 5.2
Interest Payment (1=Cash, 0 PIK) 0 0 0 0 0
Cash
Beginning Cash Balance 7.0 7.0 7.0 7.0 7.0
Ending Cash Balance 7.0 7.0 7.0 7.0 7.0
Interest Rate for Cash 2.5% 2.5% 2.5% 2.5% 2.5%
Interest Income 0.2 0.2 0.2 0.2 0.2
Total Interest Expense 10.2 13.6 14.9 16.0 16.8
Total Interest Income from Cash 0.2 0.2 0.2 0.2 0.2
14 of 20

Company ABC Valuation - Assumptions
All figures in EUR millions, unless otherwise stated
Key Cases
Operating Model Case Selected: Management Case 1 <-- Select between 1-4
Management 1
Target 2
Low 3
Base 4
Projection - December Year End
Operating Model Case Selected: Management Case Year 5 E Year 6 E Year 7 E Year 8 E Year 9 E
Management Case
Gross Profit as a % of Sales 34.2% 34.6% 34.4% 34.4% 34.4%
EBITDA as a % of Sales 12.2% 13.9% 14.1% 14.1% 14.1%
Depreciation Charge as a % of Sales 4.7% 4.1% 3.5% 3.5% 3.5%
Amortization Charge as a % of Sales 2.9% 2.3% 2.4% 2.4% 2.4%
Non Recurring Expenses as a % of Sales 0.8% 0.7% 0.6% 0.6% 0.6%
Corporate Tax Rate 210.5% 43.4% 35.7% 35.7% 35.7%
Powertrain Lines & Assembles Sales Growth 34.4% 144.9% 24.8% 24.8% 24.8%
Fluid Handling Lines-Chassis Sales Growth 13.5% 8.2% 7.4% 7.4% 7.4%
HVAC Parts Sales Growth 3.4% 4.9% 0.5% 0.5% 0.5%
Cooling Component Sales Growth (7.8%) (13.7%) (5.7%) (5.7%) (5.7%)
Airbag Sales Growth (4.1%) 5.9% (0.0%) (0.0%) (0.0%)
Seating Parts Sales Growth (5.9%) (19.3%) (0.0%) (0.0%) (0.0%)
Other Automotives Sales Growth (4.1%) 5.9% (0.0%) (0.0%) (0.0%)
Die Casting - Automotive Sales Growth 3.2% 13.4% 2.2% 2.2% 2.2%
Industrial Sales Growth 4.8% 9.5% 10.4% 10.4% 10.4%
Others Sales Growth (4.1%) 5.9% (0.0%) (0.0%) (0.0%)
Other Assets as a % of Sales 1.2% 1.0% 0.9% 0.9% 0.9%
Days Inventory Turnover 68.5 64.8 66.5 66.5 66.5
Trade Receivables Days 50.8 48.0 50.4 50.4 50.4
Trade Payables Days 49.4 44.7 43.9 43.9 43.9
Other Liabilities as a % of Sales 4.0% 3.4% 3.1% 3.1% 3.1%
Deferred Charges as a % of Sales 1.6% 1.2% 1.0% 1.0% 1.0%
Other accruals 1.3% 0.9% 0.8% 0.8% 0.8%
Capex as a % of Sales 4.3% 4.1% 3.7% 3.7% 3.7%
Impairment of Intangibles as a % of Beg. Intangibles 5.5% 8.8% 5.7% 5.7% 5.7%
15 of 20

Company ABC Valuation - Assumptions
All figures in EUR millions, unless otherwise stated
Key Cases
Operating Model Case Selected: Management Case 1 <-- Select between 1-4
Management 1
Target 2
Low 3
Base 4
Projection - December Year End
Operating Model Case Selected: Management Case Year 5 E Year 6 E Year 7 E Year 8 E Year 9 E
Management Case
Gross Profit as a % of Sales 34.2% 34.6% 34.4% 34.4% 34.4%
EBITDA as a % of Sales 12.2% 13.9% 14.1% 14.1% 14.1%
Depreciation Charge as a % of Sales 4.7% 4.1% 3.5% 3.5% 3.5%
Amortization Charge as a % of Sales 2.9% 2.3% 2.4% 2.4% 2.4%
Non Recurring Expenses as a % of Sales 0.8% 0.7% 0.6% 0.6% 0.6%
Corporate Tax Rate 210.5% 43.4% 35.7% 35.7% 35.7%
Powertrain Lines & Assembles Sales Growth 34.4% 144.9% 24.8% 24.8% 24.8%
Fluid Handling Lines-Chassis Sales Growth 13.5% 8.2% 7.4% 7.4% 7.4%
HVAC Parts Sales Growth 3.4% 4.9% 0.5% 0.5% 0.5%
Cooling Component Sales Growth (7.8%) (13.7%) (5.7%) (5.7%) (5.7%)
Airbag Sales Growth (4.1%) 5.9% (0.0%) (0.0%) (0.0%)
Seating Parts Sales Growth (5.9%) (19.3%) (0.0%) (0.0%) (0.0%)
Other Automotives Sales Growth (4.1%) 5.9% (0.0%) (0.0%) (0.0%)
Die Casting - Automotive Sales Growth 3.2% 13.4% 2.2% 2.2% 2.2%
Industrial Sales Growth 4.8% 9.5% 10.4% 10.4% 10.4%
Others Sales Growth (4.1%) 5.9% (0.0%) (0.0%) (0.0%)
Other Assets as a % of Sales 1.2% 1.0% 0.9% 0.9% 0.9%
Days Inventory Turnover 68.5 64.8 66.5 66.5 66.5
Trade Receivables Days 50.8 48.0 50.4 50.4 50.4
Trade Payables Days 49.4 44.7 43.9 43.9 43.9
Other Liabilities as a % of Sales 4.0% 3.4% 3.1% 3.1% 3.1%
Deferred Charges as a % of Sales 1.6% 1.2% 1.0% 1.0% 1.0%
Other accruals 1.3% 0.9% 0.8% 0.8% 0.8%
Capex as a % of Sales 4.3% 4.1% 3.7% 3.7% 3.7%
Impairment of Intangibles as a % of Beg. Intangibles 5.5% 8.8% 5.7% 5.7% 5.7%
16 of 20

Company ABC Valuation - Assumptions
All figures in EUR millions, unless otherwise stated
Key Cases
Operating Model Case Selected: Management Case 1 <-- Select between 1-4
Management 1
Target 2
Low 3
Base 4
Projection - December Year End
Operating Model Case Selected: Management Case Year 5 E Year 6 E Year 7 E Year 8 E Year 9 E
29.2% 29.6% 29.4% 29.4% 29.4%
Target Case
Gross Profit as a % of Sales 29.2% 29.6% 29.4% 29.4% 29.4%
EBITDA as a % of Sales 9.7% 11.4% 11.6% 11.6% 11.6%
Depreciation Charge as a % of Sales 3.7% 3.1% 2.5% 2.5% 2.5%
Amortization Charge as a % of Sales 2.9% 2.3% 2.4% 2.4% 2.4%
Non Recurring Expenses as a % of Sales 1.3% 1.2% 1.1% 1.1% 1.1%
Corporate Tax Rate 215.5% 48.4% 40.7% 40.7% 40.7%
Powertrain Lines & Assembles Sales Growth 29.4% 139.9% 19.8% 19.8% 19.8%
Fluid Handling Lines-Chassis Sales Growth 11.5% 6.2% 5.4% 5.4% 5.4%
HVAC Parts Sales Growth 2.4% 3.9% (0.5%) (0.5%) (0.5%)
Cooling Component Sales Growth (10.8%) (16.7%) (8.7%) (8.7%) (8.7%)
Airbag Sales Growth (5.1%) 4.9% (1.0%) (1.0%) (1.0%)
Seating Parts Sales Growth (6.9%) (20.3%) (1.0%) (1.0%) (1.0%)
Other Automotives Sales Growth (5.1%) 4.9% (1.0%) (1.0%) (1.0%)
Die Casting - Automotive Sales Growth 1.2% 11.4% 0.2% 0.2% 0.2%
Industrial Sales Growth 1.8% 6.5% 7.4% 7.4% 7.4%
Others Sales Growth (5.1%) 4.9% (1.0%) (1.0%) (1.0%)
Other Assets as a % of Sales 1.7% 1.5% 1.4% 1.4% 1.4%
Days Inventory Turnover 73.5 69.8 71.5 71.5 71.5
Trade Receivables Days 55.8 53.0 55.4 55.4 55.4
Trade Payables Days 44.4 39.7 38.9 38.9 38.9
Other Liabilities as a % of Sales 3.0% 2.4% 2.1% 2.1% 2.1%
Deferred Charges as a % of Sales 0.6% 0.2% 0.0% 0.0% 0.0%
Other accruals 0.8% 0.4% 0.3% 0.3% 0.3%
Capex as a % of Sales 5.8% 5.6% 5.2% 5.2% 5.2%
Impairment of Intangibles as a % of Beg. Intangibles 4.5% 7.8% 4.7% 4.7% 4.7%
17 of 20

Company ABC Valuation - Assumptions
All figures in EUR millions, unless otherwise stated
Key Cases
Operating Model Case Selected: Management Case 1 <-- Select between 1-4
Management 1
Target 2
Low 3
Base 4
Projection - December Year End
Operating Model Case Selected: Management Case Year 5 E Year 6 E Year 7 E Year 8 E Year 9 E
Low Case
Gross Profit as a % of Sales 24.2% 24.6% 24.4% 24.4% 24.4%
EBITDA as a % of Sales 7.2% 8.9% 9.1% 9.1% 9.1%
Depreciation Charge as a % of Sales 2.7% 2.1% 1.5% 1.5% 1.5%
Amortization Charge as a % of Sales 2.9% 2.3% 2.4% 2.4% 2.4%
Non Recurring Expenses as a % of Sales 1.8% 1.7% 1.6% 1.6% 1.6%
Corporate Tax Rate 220.5% 53.4% 45.7% 45.7% 45.7%
Powertrain Lines & Assembles Sales Growth 24.4% 134.9% 14.8% 14.8% 14.8%
Fluid Handling Lines-Chassis Sales Growth 9.5% 4.2% 3.4% 3.4% 3.4%
HVAC Parts Sales Growth 1.4% 2.9% (1.5%) (1.5%) (1.5%)
Cooling Component Sales Growth (13.8%) (19.7%) (11.7%) (11.7%) (11.7%)
Airbag Sales Growth (6.1%) 3.9% (2.0%) (2.0%) (2.0%)
Seating Parts Sales Growth (7.9%) (21.3%) (2.0%) (2.0%) (2.0%)
Other Automotives Sales Growth (6.1%) 3.9% (2.0%) (2.0%) (2.0%)
Die Casting - Automotive Sales Growth (0.8%) 9.4% (1.8%) (1.8%) (1.8%)
Industrial Sales Growth (1.2%) 3.5% 4.4% 4.4% 4.4%
Others Sales Growth (6.1%) 3.9% (2.0%) (2.0%) (2.0%)
Other Assets as a % of Sales 2.2% 2.0% 1.9% 1.9% 1.9%
Days Inventory Turnover 78.5 74.8 76.5 76.5 76.5
Trade Receivables Days 60.8 58.0 60.4 60.4 60.4
Trade Payables Days 39.4 34.7 33.9 33.9 33.9
Other Liabilities as a % of Sales 2.0% 1.4% 1.1% 1.1% 1.1%
Deferred Charges as a % of Sales (0.4%) (0.8%) (1.0%) (1.0%) (1.0%)
Other accruals 0.3% (0.1%) (0.2%) (0.2%) (0.2%)
Capex as a % of Sales 7.3% 7.1% 6.7% 6.7% 6.7%
Impairment of Intangibles as a % of Beg. Intangibles 3.5% 6.8% 3.7% 3.7% 3.7%
18 of 20
Company ABC Valuation - Assumptions
All figures in EUR millions, unless otherwise stated
Key Cases
Operating Model Case Selected: Management Case 1 <-- Select between 1-4
Management 1
Target 2
Low 3
Base 4
Projection - December Year End
Operating Model Case Selected: Management Case Year 5 E Year 6 E Year 7 E Year 8 E Year 9 E
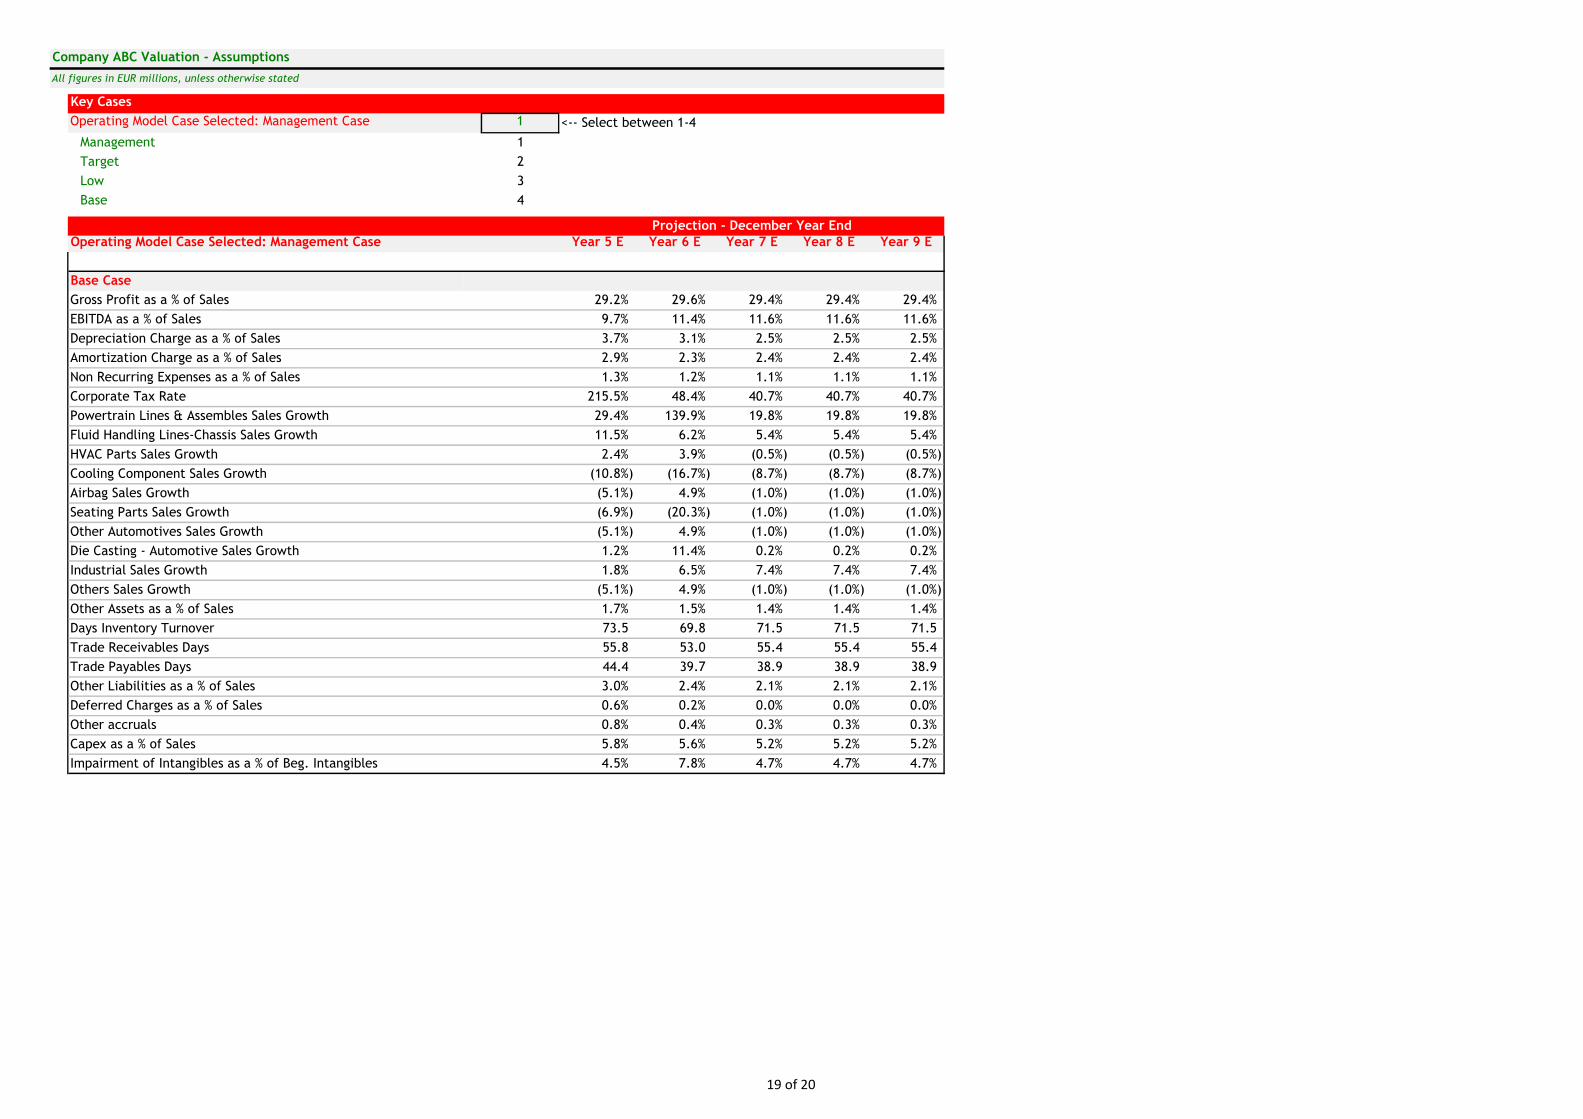
Base Case
Gross Profit as a % of Sales 29.2% 29.6% 29.4% 29.4% 29.4%
EBITDA as a % of Sales 9.7% 11.4% 11.6% 11.6% 11.6%
Depreciation Charge as a % of Sales 3.7% 3.1% 2.5% 2.5% 2.5%
Amortization Charge as a % of Sales 2.9% 2.3% 2.4% 2.4% 2.4%
Non Recurring Expenses as a % of Sales 1.3% 1.2% 1.1% 1.1% 1.1%
Corporate Tax Rate 215.5% 48.4% 40.7% 40.7% 40.7%
Powertrain Lines & Assembles Sales Growth 29.4% 139.9% 19.8% 19.8% 19.8%
Fluid Handling Lines-Chassis Sales Growth 11.5% 6.2% 5.4% 5.4% 5.4%
HVAC Parts Sales Growth 2.4% 3.9% (0.5%) (0.5%) (0.5%)
Cooling Component Sales Growth (10.8%) (16.7%) (8.7%) (8.7%) (8.7%)
Airbag Sales Growth (5.1%) 4.9% (1.0%) (1.0%) (1.0%)
Seating Parts Sales Growth (6.9%) (20.3%) (1.0%) (1.0%) (1.0%)
Other Automotives Sales Growth (5.1%) 4.9% (1.0%) (1.0%) (1.0%)
Die Casting - Automotive Sales Growth 1.2% 11.4% 0.2% 0.2% 0.2%
Industrial Sales Growth 1.8% 6.5% 7.4% 7.4% 7.4%
Others Sales Growth (5.1%) 4.9% (1.0%) (1.0%) (1.0%)
Other Assets as a % of Sales 1.7% 1.5% 1.4% 1.4% 1.4%
Days Inventory Turnover 73.5 69.8 71.5 71.5 71.5
Trade Receivables Days 55.8 53.0 55.4 55.4 55.4
Trade Payables Days 44.4 39.7 38.9 38.9 38.9
Other Liabilities as a % of Sales 3.0% 2.4% 2.1% 2.1% 2.1%
Deferred Charges as a % of Sales 0.6% 0.2% 0.0% 0.0% 0.0%
Other accruals 0.8% 0.4% 0.3% 0.3% 0.3%
Capex as a % of Sales 5.8% 5.6% 5.2% 5.2% 5.2%
Impairment of Intangibles as a % of Beg. Intangibles 4.5% 7.8% 4.7% 4.7% 4.7%
19 of 20

Company ABC Valuation - EBITDA Bridge
All figures in EUR millions, unless otherwise stated
Entry Year Year 4
Exit Year Year 7
EBITDA Bridge
20.6 34.7
66.2 43.6
57.6
(20.9)
(60.0)
(40.0)
(20.0)
20.0
40.0
60.0
80.0
100.0
Entry Year EBITDA Revenue Delta Cost of Goods Sold Delta Operating Cost Delta Depreciation Delta Exit Year EBITDA
20 of 20


![A smart artificial bee colony algorithm with distance-fitness-based …hebmlc.org/UploadFiles/201872983541770.pdf · 2018. 7. 29. · abc. [] abc abc abc [] abc [abc abc [] abc [abc](https://static.fdocuments.us/doc/165x107/5febef9cecac5951281b206e/a-smart-artificial-bee-colony-algorithm-with-distance-fitness-based-2018-7-29.jpg)