Companies’ Perception of Risk From
16
© 2013 Bloomberg Finance L.P. www.bgov.com | @BGOV Companies’ Perception of Risk From U.S. Government Actions on the Rise TONY COSTELLO Senior Managing Analyst JUNE 11, 2013 JORGE UQUILLAS Quantitative Analyst Director of Research ROBERT LITAN
Transcript of Companies’ Perception of Risk From

© 2013 Bloomberg Finance L.P. www.bgov.com | @BGOV
Companies’ Perception of Risk From
U.S. Government Actions on the Rise
TONY COSTELLO Senior Managing Analyst
JUNE 11, 2013
JORGE UQUILLAS Quantitative Analyst Director of Research
ROBERT LITAN

1
Th
e P
erc
ep
tio
n o
f G
ove
rnm
ent R
isk
//
© 2013 Bloomberg Finance L.P.
CAN THE RELATIONSHIP BETWEEN GOVERNMENT AND
BUSINESS BE MEASURED? HAS IT CHANGED OVER TIME?
Business Government ?
2
Th
e P
erc
ep
tio
n o
f G
ove
rnm
ent R
isk
//
© 2013 Bloomberg Finance L.P.
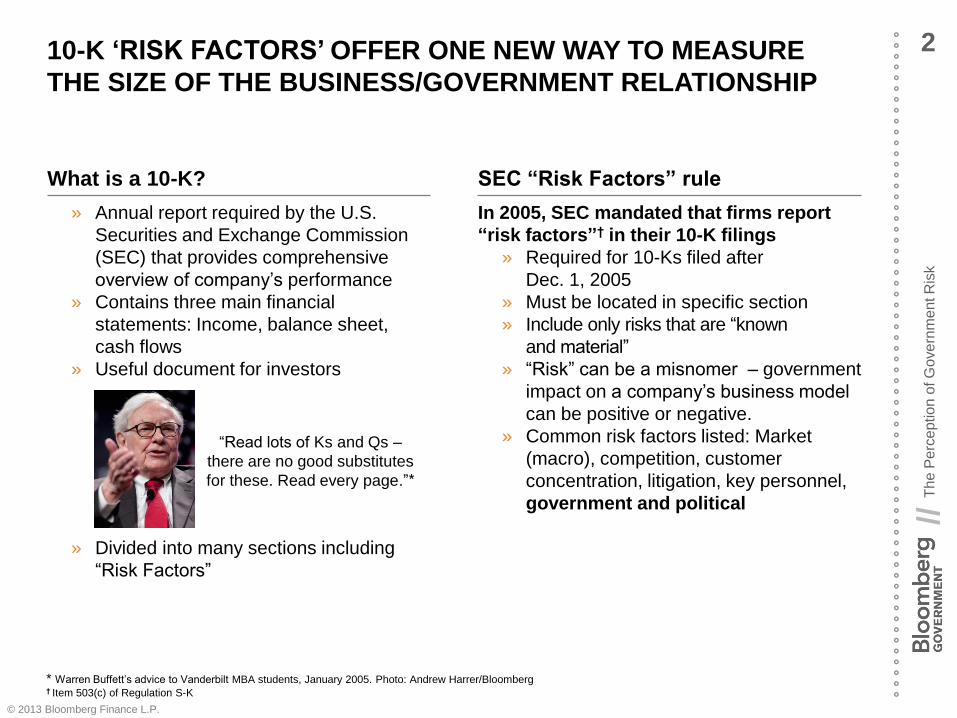
10-K ‘RISK FACTORS’ OFFER ONE NEW WAY TO MEASURE
THE SIZE OF THE BUSINESS/GOVERNMENT RELATIONSHIP
» Annual report required by the U.S.
Securities and Exchange Commission
(SEC) that provides comprehensive
overview of company’s performance
» Contains three main financial
statements: Income, balance sheet,
cash flows
» Useful document for investors
» Divided into many sections including
“Risk Factors”
What is a 10-K? SEC “Risk Factors” rule
In 2005, SEC mandated that firms report
“risk factors”† in their 10-K filings
» Required for 10-Ks filed after
Dec. 1, 2005
» Must be located in specific section
» Include only risks that are “known
and material”
» “Risk” can be a misnomer – government
impact on a company’s business model
can be positive or negative.
» Common risk factors listed: Market
(macro), competition, customer
concentration, litigation, key personnel,
government and political
* Warren Buffett’s advice to Vanderbilt MBA students, January 2005. Photo: Andrew Harrer/Bloomberg † Item 503(c) of Regulation S-K
“Read lots of Ks and Qs –
there are no good substitutes
for these. Read every page.”*

3
Th
e P
erc
ep
tio
n o
f G
ove
rnm
ent R
isk
//
© 2013 Bloomberg Finance L.P.
BGOV HAS DEVELOPED A UNIQUE METHODOLOGY USING
10-KS TO MEASURE PERCEIVED U.S. GOVERNMENT RISK
1 Selection of industries » Six industries generally viewed to be affected by government in different ways:
• Defense, Energy, Finance, Health Care, Industrials and Technology
2 Selection of companies » Ten companies per industry, 60 total
» Two companies per subindustry* -- one large-cap and one small-cap
• Large-cap is the highest market-cap company within a subindustry
• Small-cap is the lowest market-cap company within a subindustry, with a market
cap of at least $100 million
3 Periodicity » First year: 2005
» Three additional years: 2008, 2011 and 2012
» All 60 companies filed 10-Ks in 2008, 2011 and 2012
» 56 companies filed 10-Ks in all four years
* Bloomberg industry classification system (BICS) industries, excluding Defense. Defense does not have enough subindustries to perform this exercise. Therefore, the top
five market cap companies and the bottom five small-cap companies in the aerospace and defense BICS industry were selected.
4 Measurement of allocation and priority » Absolute word count of U.S. government risk language
» Relative word count: U.S. government risk language as a percent of overall risk
factors language
» Which number risk factor contains the first government or political risk language

4
Th
e P
erc
ep
tio
n o
f G
ove
rnm
ent R
isk
//
© 2013 Bloomberg Finance L.P.
BGOV FINDINGS: GOVERNMENT RISK IS MATERIAL
AND INCREASING IN ABSOLUTE TERMS
1 Government impact is perceived as important » In 2012, for five of the six industries, the average percent of the risk factors section
devoted to U.S. government risk was 25% or greater
2 Absolute growth » The total number of U.S. government-related risk words for all companies evaluated
in this study grew every year:
• 2005: 36,000 words
• 2008: 56,000 words
• 2011: 94,000 words
• 2012: 103,000 words
* For the four companies that were not public in 2005, this comparison was made between 2012 and 2008
32%
27% 30%
37%
27%
15%
Defense Energy Finance Healthcare Industrials Technology

5
Th
e P
erc
ep
tio
n o
f G
ove
rnm
ent R
isk
//
© 2013 Bloomberg Finance L.P.
BGOV FINDINGS: GOVERNMENT RISK IS AN INCREASINGLY
MATERIAL RISK RELATIVE TO OTHER RISK
1 Relative growth in aggregate » U.S. government-related risk words accounted for an increasing share of the risk factors
section words over time
2 Relative growth by company » In 2012, 50 out of the 60 companies allocated more words to U.S. government risk
relative to total risk factor language, compared to 2005*
* For the four companies that were not public in 2005, this comparison was made between 2012 and 2008
19% 18%
25% 27%
2005 2008 2011 2012

6
Th
e P
erc
ep
tio
n o
f G
ove
rnm
ent R
isk
//
© 2013 Bloomberg Finance L.P.
BGOV FINDINGS: ALL INDUSTRIES SHOWED AND INCREASED
RELATIVE ALLOCATION TO GOVERNMENT RISK WORDS
Percent of total risk factor words allocated to U.S. government risk,
2005 vs. 2012*
* Percentages in columns are the average of the five companies † For the four companies that were not public in 2005, 2008 percentages were used
32%
17%
41%
23%
Large Cap Small Cap
23% 18%
33%
21%
Large Cap Small Cap
17% 24%
32% 27%
Large Cap Small Cap
29%
17%
36% 37%
Large Cap Small Cap
13%
28% 23%
31%
Large Cap Small Cap
8% 7% 15% 15%
Large Cap Small Cap
117% 77%
Defense Energy Finance
Health Care Industrials Technology
2005† 2012 Percent change, 2005-2012
27%
37% 45%
19% 91% 12%
23% 112%
79%
12%
7
Th
e P
erc
ep
tio
n o
f G
ove
rnm
ent R
isk
//
© 2013 Bloomberg Finance L.P.
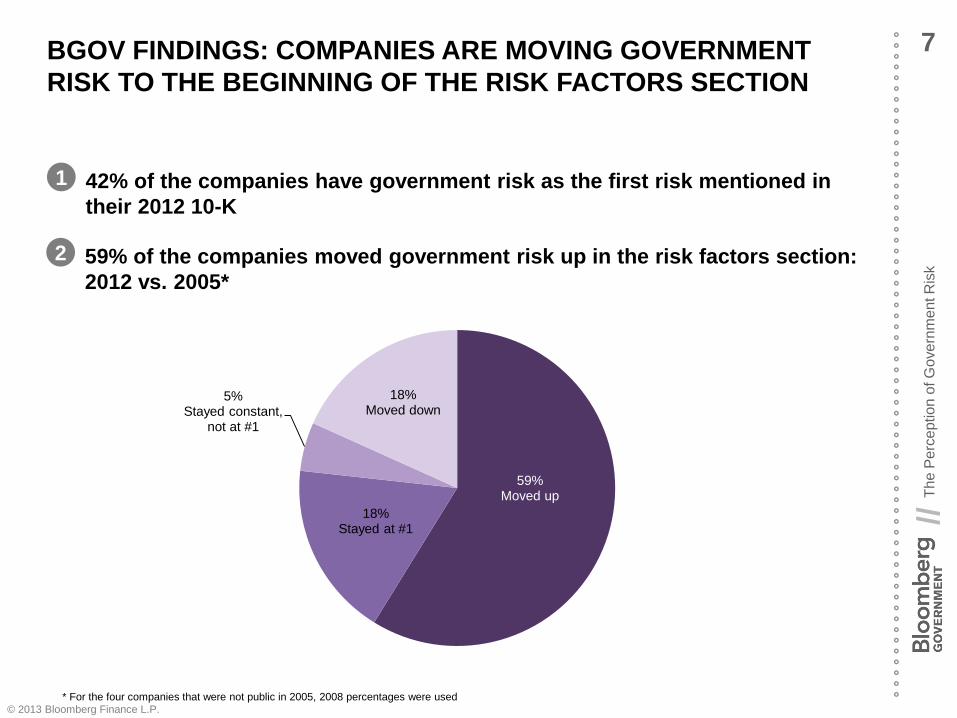
BGOV FINDINGS: COMPANIES ARE MOVING GOVERNMENT
RISK TO THE BEGINNING OF THE RISK FACTORS SECTION
1 42% of the companies have government risk as the first risk mentioned in
their 2012 10-K
2 59% of the companies moved government risk up in the risk factors section:
2012 vs. 2005*
59% Moved up
18% Stayed at #1
5% Stayed constant,
not at #1
18% Moved down
* For the four companies that were not public in 2005, 2008 percentages were used

8
Th
e P
erc
ep
tio
n o
f G
ove
rnm
ent R
isk
//
© 2013 Bloomberg Finance L.P.
BGOV FINDINGS: COMPANIES ARE USING MORE SPECIFIC
GOVERNMENT RISK LANGUAGE IN THEIR FILINGS
A look at government risks for Exxon-Mobil, as an example: 2005 vs. 2012
Source: Exxon-Mobil Corp. 10-K filings
2005 2012
Environmental:
» “Changes in environmental regulations or other
laws that increase our cost of compliance or
reduce or delay available business opportunities
(including changes in laws related to offshore
drilling operations, water use, or hydraulic
fracturing);”
Access:
» “A number of countries limit access to their oil
and gas resources, or may place resources off-
limits from development altogether. Restrictions
on foreign investment in the oil and gas sector
tend to increase in times of high commodity
prices, when national governments may have
less need of outside sources of private capital.
Many countries also restrict the import or export
of certain products based on point of origin…. As
a U.S. company, ExxonMobil is subject to laws
prohibiting U.S. companies from doing business
in certain countries, or restricting the kind of
business that may be conducted. Such
restrictions may provide a competitive advantage
to our non-U.S. competitors unless their own
home countries impose comparable restrictions.”
Environmental:
» “Environmental regulation;”
Access:
» “Restrictions on the Corporation’s ability to
do business with certain countries, or to
engage in certain areas of business within a
country;”

9
Th
e P
erc
ep
tio
n o
f G
ove
rnm
ent R
isk
//
© 2013 Bloomberg Finance L.P.
THOUGH THERE MAY BE AN ALTERNATIVE REASON FOR THIS
TREND, EVIDENCE POINTS TOWARDS INCREASING CONCERN
Evidence in support of
increasing sophistication
Counter-evidence in support of
increasing government concern
Larger absolute risk factor sections do
not explain the significant relative
increase of government-related risk
over time
There is no incentive or rule change
that would encourage companies to
expand this section of their 10-K
» There have been no changes to the
SEC guidelines on risk factors since
2005
» In general, the risk factors section is
intended to highlight for investors
what could negatively impact their
investment
Risk factor sections overall have
grown longer and more specific
Companies are doing more through
10-Ks to protect themselves against
shareholder lawsuits
Since inception of the SEC guidelines in 2005, companies
have become increasingly sophisticated in writing their
10-K risk factors sections
Alternative
Explanation
1
2
1
2

10
Th
e P
erc
ep
tio
n o
f G
ove
rnm
ent R
isk
//
© 2013 Bloomberg Finance L.P.
SUMMARY
1 U.S. government is currently perceived to have a significant impact on business » Varying degrees of perceived impact, but no industry is immune
2 Company perception of the risk of U.S. government actions has increased
over time » Absolute increase
» More importantly, government risk has grown relative to other risks
3 Higher priority has been given to government risk over time
5 Same trends observed across all industries and size of companies
4 Companies are using more specific language to describe government risks
11
Th
e P
erc
ep
tio
n o
f G
ove
rnm
ent R
isk
//
© 2013 Bloomberg Finance L.P.
APPENDIX

12
Th
e P
erc
ep
tio
n o
f G
ove
rnm
ent R
isk
//
© 2013 Bloomberg Finance L.P.
APPENDIX: RISK FACTOR DATA (1 OF 2)
Note: Companies highlighted in orange represent small-cap companies
Company
2012 2011 2008 2005
Percent of Risk
Factor Words
Devoted to
Government Risk
Number Risk
Factor
Government
Risk First
Mentioned
Percent of Risk
Factor Words
Devoted to
Government Risk
Number Risk
Factor
Government Risk
First Mentioned
Percent of Risk
Factor Words
Devoted to
Government
Risk
Number Risk
Factor
Government Risk
First Mentioned
Percent of Risk
Factor Words
Devoted to
Government Risk
Number Risk
Factor
Government
Risk First
Mentioned
Defense
United Technologies Corp. 32% 1 24% 1 31% 3 24% 1
Boeing Co. 30% 1 30% 1 19% 2 26% 2
Lockheed Martin Corp. 58% 1 50% 1 41% 1 43% 1
Precision Castparts Corp. 33% 2 33% 2 29% 2 29% 3
General Dynamics Corp. 52% 1 45% 1 37% 1 41% 1
National Presto Industries Inc. 37% 6 37% 6 24% 2 29% 1
Astronics Corp. 16% 1 16% 1 15% 13 15% 2
Anaren Inc. 19% 5 11% 4 11% 6 10% 5
LMI Aerospace Inc. 16% 7 15% 7 14% 3 20% 5
Ducommun Inc. 29% 8 26% 9 12% 2 13% 2
Energy
Exxon Mobil Corp. 39% 2 36% 2 9% 2 21% 3
Occidental Petroleum Corp. 24% 4 29% 4 23% 4 7% 4
Schlumberger Ltd. 54% 1 49% 1 24% 1 34% 1
First Solar Inc. 18% 4 14% 2 13% 8 NA NA
Duke Energy Corp. 32% 1 25% 1 27% 1 30% 3
Murphy Oil Corp. 14% 3 15% 3 9% 3 10% 8
Gastar Exploration Ltd. 26% 2 26% 2 13% 5 17% 1
Bolt Technology 17% 3 17% 3 4% 2 9% 2
Green Plains Renewable Energy Inc. 26% 1 23% 6 17% 35 16% 20
Unitil Corp. 23% 1 27% 1 33% 1 38% 1
Finance
Wells Fargo & Co. 32% 2 30% 2 29% 3 21% 8
Berkshire Hathaway Inc. 36% 8 30% 9 7% 9 8% 9
Visa Inc. 32% 1 31% 1 25% 1 NA NA
JPMorgan Chase & Co. 33% 1 32% 1 23% 6 16% 7
MetLife Inc. 25% 1 29% 1 16% 2 21% 2
Farmers National Banc Corp. 30% 1 21% 1 26% 8 21% 1
Eastern Insurance Holdings Inc. 19% 7 19% 8 17% 9 NA NA
First Marblehead Corp. 34% 2 32% 6 25% 16 29% 12
FBR & Co. 20% 12 14% 23 14% 26 NA NA
Phoenix Companies Inc. 33% 1 26% 1 24% 14 23% 11
13
Th
e P
erc
ep
tio
n o
f G
ove
rnm
ent R
isk
//
© 2013 Bloomberg Finance L.P.
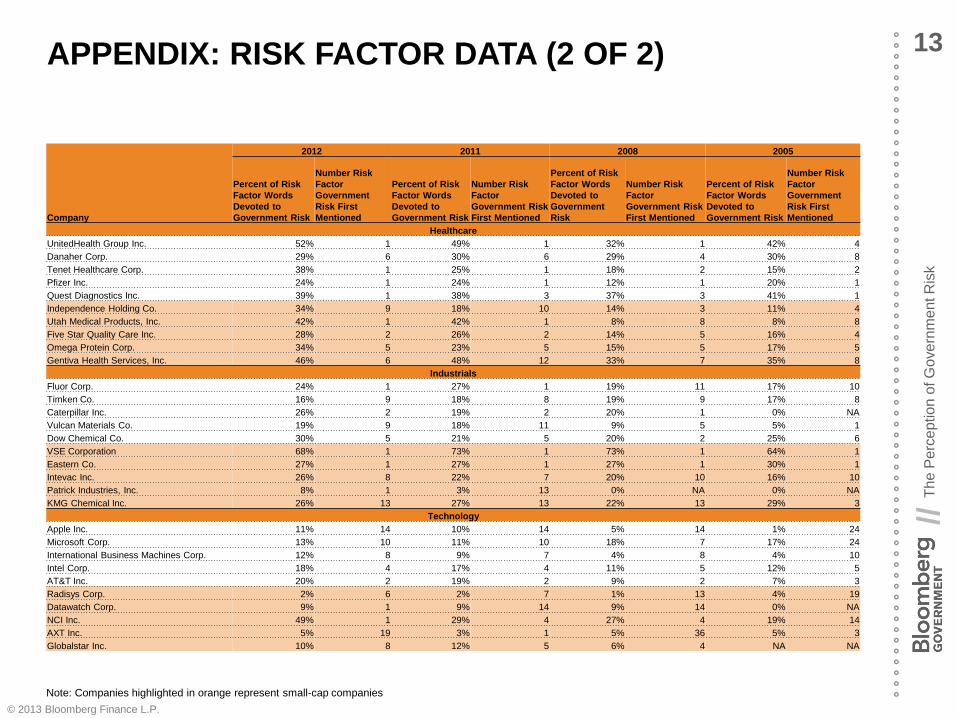
APPENDIX: RISK FACTOR DATA (2 OF 2)
Note: Companies highlighted in orange represent small-cap companies
Company
2012 2011 2008 2005
Percent of Risk
Factor Words
Devoted to
Government Risk
Number Risk
Factor
Government
Risk First
Mentioned
Percent of Risk
Factor Words
Devoted to
Government Risk
Number Risk
Factor
Government Risk
First Mentioned
Percent of Risk
Factor Words
Devoted to
Government
Risk
Number Risk
Factor
Government Risk
First Mentioned
Percent of Risk
Factor Words
Devoted to
Government Risk
Number Risk
Factor
Government
Risk First
Mentioned
Healthcare
UnitedHealth Group Inc. 52% 1 49% 1 32% 1 42% 4
Danaher Corp. 29% 6 30% 6 29% 4 30% 8
Tenet Healthcare Corp. 38% 1 25% 1 18% 2 15% 2
Pfizer Inc. 24% 1 24% 1 12% 1 20% 1
Quest Diagnostics Inc. 39% 1 38% 3 37% 3 41% 1
Independence Holding Co. 34% 9 18% 10 14% 3 11% 4
Utah Medical Products, Inc. 42% 1 42% 1 8% 8 8% 8
Five Star Quality Care Inc. 28% 2 26% 2 14% 5 16% 4
Omega Protein Corp. 34% 5 23% 5 15% 5 17% 5
Gentiva Health Services, Inc. 46% 6 48% 12 33% 7 35% 8
Industrials
Fluor Corp. 24% 1 27% 1 19% 11 17% 10
Timken Co. 16% 9 18% 8 19% 9 17% 8
Caterpillar Inc. 26% 2 19% 2 20% 1 0% NA
Vulcan Materials Co. 19% 9 18% 11 9% 5 5% 1
Dow Chemical Co. 30% 5 21% 5 20% 2 25% 6
VSE Corporation 68% 1 73% 1 73% 1 64% 1
Eastern Co. 27% 1 27% 1 27% 1 30% 1
Intevac Inc. 26% 8 22% 7 20% 10 16% 10
Patrick Industries, Inc. 8% 1 3% 13 0% NA 0% NA
KMG Chemical Inc. 26% 13 27% 13 22% 13 29% 3
Technology
Apple Inc. 11% 14 10% 14 5% 14 1% 24
Microsoft Corp. 13% 10 11% 10 18% 7 17% 24
International Business Machines Corp. 12% 8 9% 7 4% 8 4% 10
Intel Corp. 18% 4 17% 4 11% 5 12% 5
AT&T Inc. 20% 2 19% 2 9% 2 7% 3
Radisys Corp. 2% 6 2% 7 1% 13 4% 19
Datawatch Corp. 9% 1 9% 14 9% 14 0% NA
NCI Inc. 49% 1 29% 4 27% 4 19% 14
AXT Inc. 5% 19 3% 1 5% 36 5% 3
Globalstar Inc. 10% 8 12% 5 6% 4 NA NA
14
Th
e P
erc
ep
tio
n o
f G
ove
rnm
ent R
isk
//
© 2013 Bloomberg Finance L.P.
ABOUT THE ANALYSTS
Tony Costello is Bloomberg Government’s Senior Managing Analyst.
Costello spent four years as a buy-side investment analyst covering
energy at Osprey Partners and Mooring Financial, where he evaluated
energy-related securities and made recommendations to portfolio
managers. His undergraduate degree is in finance from George
Washington University and he holds an MBA from The Darden School at
the University of Virginia. He holds the Chartered Financial Analyst
designation.
+1-202-416-3393
Jorge Uquillas is a Quantitative Analyst with Bloomberg Government. He
previously worked at the Antitrust Division of the U.S. Department of
Justice as an economic research analyst performing statistical, regression
and geographic analysis to support antitrust investigations. He holds an
MBA from the University of Chicago Booth School of Business, an M.A. in
economics from The George Washington University, and a B.S. from the
University of Maryland.
+1-202-416-3542

15
Th
e P
erc
ep
tio
n o
f G
ove
rnm
ent R
isk
//
© 2013 Bloomberg Finance L.P.
ABOUT BLOOMBERG GOVERNMENT
DISCLAIMER
Copyright 2013 Bloomberg Finance L.P. Not for redistribution
except by an authorized BGOV user, and only as expressly
permitted in the Bloomberg Government terms of service. All
permitted uses shall cite BGOV as a source.
Bloomberg Government is a comprehensive web-based service that provides rich
data, analytical tools, timely news and in-depth policy analysis, for those who need to
understand the business impacts of federal government actions. For more information,
visit www.bgov.com or call +1 877 498 3587.
Follow us on Twitter: @BGOV