Commuting CO2 Emissions at UCDMCmae.engr.ucdavis.edu/jwpark/DavisSite/res/pdfs/UCDMC...
37
Joseph Lacap and Ernst Oehninger UNIVERSITY OF CALIFNORNIA, DAVIS | DAVIS, CA Commuting CO2 Emissions at UCDMC 2016 ESTIMATES
Transcript of Commuting CO2 Emissions at UCDMCmae.engr.ucdavis.edu/jwpark/DavisSite/res/pdfs/UCDMC...
Joseph Lacap and Ernst Oehninger UNIVERSITY OF CALIFNORNIA, DAVIS | DAVIS, CA
Commuting CO2 Emissions at UCDMC 2016 ESTIMATES

1
1 Contents 2 Table of Figures ..................................................................................................................................... 2
3 List of Tables ......................................................................................................................................... 2
4 Introduction .......................................................................................................................................... 2
4.1 The Green Commuter Program .................................................................................................... 2
4.2 Baseline Definition ........................................................................................................................ 3
4.3 Assumptions .................................................................................................................................. 3
5 The Data ................................................................................................................................................ 3
5.1 Parking Permit Data ...................................................................................................................... 3
5.2 Parking Lot Data ............................................................................................................................ 4
5.3 Transportation Survey Data .......................................................................................................... 4
5.4 Shuttle Data .................................................................................................................................. 6
6 Data Analysis ......................................................................................................................................... 6
6.1 Parking Permit Data ...................................................................................................................... 6
6.1.1 Zip Codes ............................................................................................................................... 6
6.1.2 Travel Modes (Permit Types) ................................................................................................ 6
6.2 Travel Survey ................................................................................................................................. 7
6.3 Mode Split and CO2 Analysis ......................................................................................................... 7
6.3.1 Baseline CO2 Calculations ...................................................................................................... 7
6.3.2 Current Mode Split CO2 Calculations .................................................................................... 7
7 Results ................................................................................................................................................... 8
7.1 Shuttles ......................................................................................................................................... 8
7.2 Baseline Case ................................................................................................................................ 8
7.3 Current Mode Split ...................................................................................................................... 10
8 Recommendations .............................................................................................................................. 13
9 References .......................................................................................................................................... 14
10 Appendix ......................................................................................................................................... 15
10.1 A1: Matlab Code to Extract Data from Original Excel Format .................................................... 15
10.2 A2: Matlab Code to Look Up Driving Distance ............................................................................ 18
10.3 A3: Matlab Code to Bin Zip Codes by Distance and Determine Mode Split ............................... 21
10.4 A4: Vehicle Type Survey Table .................................................................................................... 24
10.5 A5: Permits per Zip Code Table ................................................................................................... 28
10.6 A6: Binned Zip Code and Permit Data ......................................................................................... 36

2
2 Table of Figures Figure 1: Mode split results from the 2014 travel survey. Source [3]. ......................................................... 5
Figure 2: Travel distance to campus of students (left) and of faculty and staff (right). Source [3]. ............. 6
Figure 3: Commute distance distribution for the baseline case (everyone drives). This is also the overall
distribution of how far affiliates live from campus....................................................................................... 9
Figure 4: Distance from campus that the 800 students commute from. Students live closer to campus
than employees and staff. ............................................................................................................................ 9
Figure 5: Travel mode share by distance from UCDMC based on only the parking permit data. .............. 10
Figure 6: Travel mode share by distance from UCDMC based on the parking permit data and corrected to
account for the travel survey. ..................................................................................................................... 11
Figure 7: Distance distribution of each travel mode. ................................................................................. 12
3 List of Tables Table 1: Distance bins for zip codes in driving miles to UCDMC................................................................... 6
Table 2: Shuttle operational data from, total fuel used during 2014 by fuel type. ...................................... 8
Table 3: One-way commute miles of each mode, parking permit data only. ............................................ 13
Table 4: Summary of CO2 reduction from baseline case. ........................................................................... 13
4 Introduction The University of California, Davis Medical Center (UCDMC) in Sacramento has a large population of
commuters, resulting in significant annual carbon emissions. The population of the campus is
approximately 13,500, most of which commute via personal occupancy vehicle (POV). The goal of this
report was to quantify the CO2 emissions resulting from the annual transport of the large UCDMC
population. Working with the UCDMC Transportation and Parking Services (TPS), data and information
regarding commuting habits and the Green Commuter Program (GCP) was gathered.
4.1 The Green Commuter Program The Green Commuter Program at UCDMC is a combination of several incentives to entice
commuters to consider alternate modes of transportation [1]. The goal of the program is to reduce the
carbon footprint of the UCDMC by reducing the number of vehicles on the road. The program includes
those commuters who are willing to commute by carpooling, Sacramento Regional Transit (RT), UCDMC
shuttles, Amtrak, ZipCar, vanpools, walking, or biking.
There are several benefits to all members of the Green Commuter Program. All are eligible to
access free rides home six times a year in case of emergency, with a very generous definition of
“emergency”. Members of carpools and vanpools are each offered a free ride share pass which allows
them to dive alone to UCDMC 24 times per fiscal year. An additional 24 days can be purchased for $3.50
per day [1,2]. Anyone commuting by transit can get $65 subsidized off of the $100 monthly pass for RT,
or other transit agencies. Should a member of the Green Commuter Program register with the
Sacramento Regional Commuter Club and log their trips, they earn raffle entries for prizes such as gift
cards.

3
While the Green Commuter Program does not provide benefits solely for those commuting to work
via zero carbon fashion (i.e. biking, walking or telecommuting), it advocates methods with a lower
carbon intensity than driving alone. While these incentives will work to reduce the carbon footprint of
the UCDMC, they will not be sufficient to reduce commuting emissions to zero.
4.2 Baseline Definition At the request of the sponsor, the baseline CO2 emissions were defined to be the emissions that
would result if all commuters drove alone. While this is not a realistic scenario, it allows estimation of
the avoided CO2 emissions of the current mode split of the campus commuters. Effectiveness of the
Green Commuter Program in terms of further reducing CO2 beyond the no-incentive mode split will be
assessed in a separate report.
4.3 Assumptions Several assumptions had to be made during the data analysis process, they were:
1. All commutes are less than 100 mi. a. There was some data showing longer distances, these were considered in error. See
section 2.1 2. The average commuter travels to the UCDMC 4 times a week.
a. Longer work days result in fewer work days per week at the hospital. 3. Carpools consist of 2 people.
a. This is an underestimate, but 3 people would likely be an over-estimate since most carpools are 2 people.
4. All commutes originate from the center of the given zip code, and go to: UC Davis Medical Center, 2315 Stockton Boulevard, Sacramento, CA 95817.
a. No more detailed data was available. b. The exception was for people commuting from a location on campus, where the
distance was assumed to be 0.5mi. 5. Fuel Economy is equivalent to the EPA city MPG rating. 6. Fuel Economy of public transit is 6 MPG 7. There are 18 people per ‘transit’ (bus occupancy)
a. This is the average number of people commuting by transit from a given zip code 8. All personal vehicles and carpools run off gasoline 9. All transit vehicle run off of diesel
5 The Data Commute data was obtained from parking permit applications and the 2014 campus travel survey
[3].
5.1 Parking Permit Data Parking permit data was the primary data source used in the analysis. Some limitations of this
data included that the population was self-selecting for those who were more likely to want to drive.
The data also included those who were members of the GCP, but this was unlikely to capture all those
who commute via “green” methods. Additionally, it was known to the UCDMC TPS that there were a
substantial number of campus affiliates who drove alone and parked on public streets around the

4
campus to avoid paying for parking permits. (Some also admitted to this in our survey). These drivers
were not taken into account as there was no way to collect reliable data on them.
The parking permit data was a list of all parking permits distributed to UCDMC affiliates. It
included parking permit numbers, zip codes of the applicants, and the permit type. Below is a list of
permit types that had zip codes associated with them:
1. CP: Carpool Permits a. 1 Permit per carpool group, but with each person in the carpool tagged as CP.
2. BIKE: Permits that allow regular bikers to drive to work a limited number of times per year.
3. PDBR: Type B permit for resident doctors 4. PDD: Type D permit, for parking garage 5. PDB: Type B permit 6. SHMO: Inter-campus shuttle pass 7. TRANS: Transit permit
a. For those taking public transit other than Sacramento RT. 8. RTMO: Regional Transit Monthly Pass
a. For those taking Regional Transit
The parking permit data for those who usually walk to campus did not include zip code data.
There were several issues with the parking permit data. There were permits with missing zip
codes, which meant commute distance could not be calculated. There were several zip codes that were
outside of the US, or unreasonably far from campus. It was suspected that some permit applicants used
their permanent address when applying for permits rather than the address from which they commute
to campus. This issue was resolved by assumption 1, that all commutes are less than 100 miles.
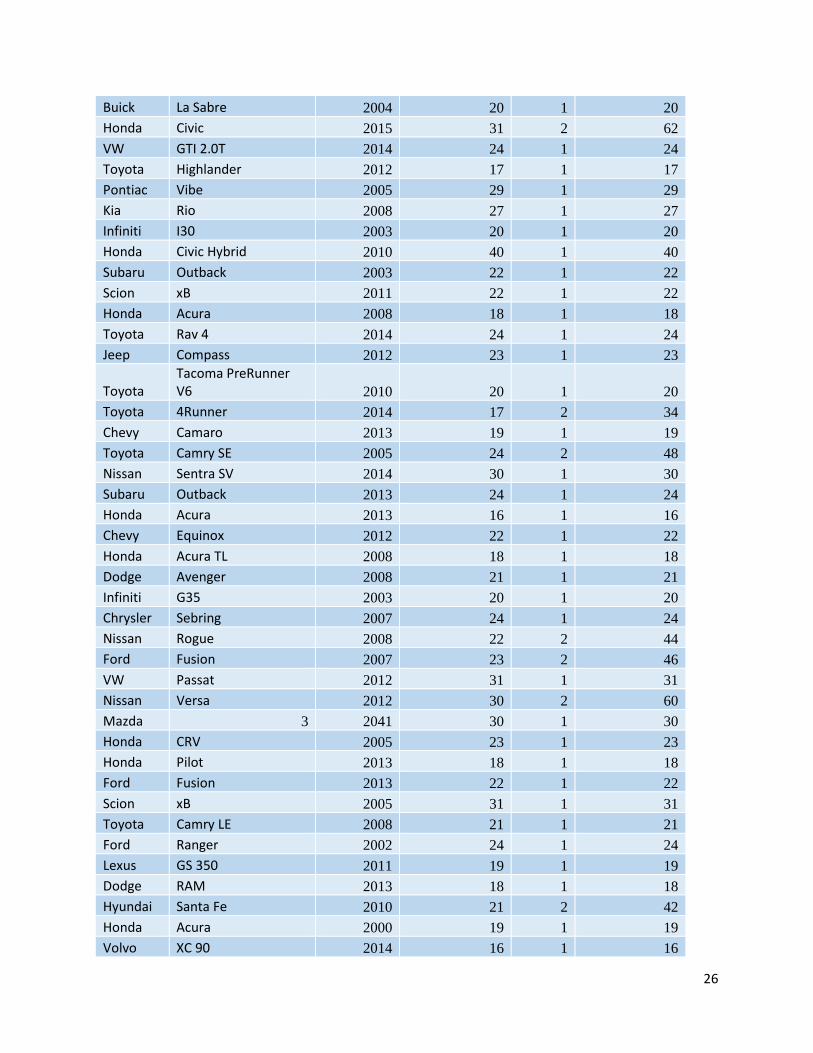
5.2 Parking Lot Data In order to calculate the CO2 resulting from commuting a given distance, fuel economy data was
needed. This was not available from the parking permit data or the transportation survey. To collect this
data, 197 vehicles across four UCDMC parking lots were identified. Pictures were taken of the rear of the
vehicle, then the model and year were looked up to obtain EPA City MPG. The city MPG was used for all
vehicles despite many commutes occurring on the highway. This one done because vehicles tend to get
worse than advertised fuel economy, especially if they are old, and traffic during commute hours
significantly reduces duel economy. The weighted (for number of each vehicle type) average fuel
economy was found to be 24.4 MPG. This was in good agreement with the average fuel economy in
California of 25.2MPG [9].
5.3 Transportation Survey Data The UCDMC 2014 Travel Survey was the secondary source of data for the analysis. It provided a
check for overall mode share, as well as a less self-selecting group of commuters, since it was not
restricted to those who applied for a parking permit. The survey represented 4802 responses, a ~32%
response rate. Unfortunately, the data used for the transportation survey was not available due to it
having been conducted by an external consulting firm, so only the summary results could be analyzed.
The mode share results from the travel survey are shown below in Figure 1.
5
Figure 1: Mode split results from the 2014 travel survey. Source [3].
Another advantage of the travel survey was that it separated students from the faculty and staff in
the mode split and travel distance analysis. As can be seen from the mode split results in Figure 1, the
student mode share is significantly different (and ‘greener’) than the faculty and staff. Part of the reason
for this can be seen in the travel distance distribution in Figure 2. More than half of the students travel
from less than 2 miles from campus, whereas only 12% of the faculty and staff travel from less than 2
miles from campus. This alone is enough to significantly reduce the number of people who are willing to
walk or bike commute rather than drive.

6
Figure 2: Travel distance to campus of students (left) and of faculty and staff (right). Source [3].
5.4 Shuttle Data Additional data was obtained regarding the shuttles operated by UCDMC. The TPS provided fuel
usage data for the shuttles, allowing relatively accurate calculation of the CO2 emissions resulting from
shuttle operations. The data was given in terms of gallons of diesel and gasoline purchased.
6 Data Analysis
6.1 Parking Permit Data The parking permit data was processed using Matlab R2014a [5]. The data was first reformatted
into a form more workable with Matlab.
6.1.1 Zip Codes The list of zip codes associated with a parking permit was used to create a list of unique zip codes.
For data validation, this list was checked against a list of all US zip codes [4], zip codes that failed this
check were marked as invalid and their data was ignored. Using the MapQuest directions service API [6],
the driving distance and driving time from each of the unique zip codes to the UCDMC was found. The
directions look up was set to find the route with the fastest travel time.
6.1.2 Travel Modes (Permit Types) The permit types were equated with travel mode. To determine the travel mode split for each zip
code, each permit’s zip code was compared against the list of unique zip codes, and when a match was
found, that zip code was given a ‘tick’ for the given travel mode. To make the data more legible, the zip
codes were binned by distance from the UCDMC. The distance bins (in miles) are show in Table 1.
1 2 3 5 7 10 15 20 25 30 35 40 45 50 60 70 80 90 100 Table 1: Distance bins for zip codes in driving miles to UCDMC.
These values were the upper limit of each bin, so for example, 1 => 0 − 1 𝑚𝑖 and 100 => 90 −
100 𝑚𝑖 from campus. The values used for the distance of each bin from the UCDMC was the weighted
average of the distance of all the zip codes that fell within each bin, weighted for the number of people
in each zip code. The result was a list of zip codes with the corresponding driving distances from campus,
and the number of each permit type for that zip code. This data was then exported to Excel 2016 for
final analysis.

7
6.2 Travel Survey The travel survey data was entered into Excel 2016 from the Figure 1 and Figure 2. The primary
purpose of the travel survey data was to check if the parking permit data aligned with its results
reasonably well, and to provide an estimate for including those who walk in the parking permit data.
6.3 Mode Split and CO2 Analysis From the data in Appendix A6: Binned Zip Code and Permit Data mode split data was calculated.
For each mode, the fraction of commutes using that mode were calculated for each distance (mode
distance distribution). Additionally, the fraction of all commutes at a given distance that were done by a
given mode was calculated (mode split by distance). The mode split data was then used for CO2
calculations.
6.3.1 Baseline CO2 Calculations To estimate CO2 emissions from a vehicle, distance traveled and fuel economy are needed. The
distance was provided by the zip code data, and the MPG was found from the parking lot survey.
According to the U.S. EIA (Energy Information Administration) [7], for every gallon of gasoline
combusted, 8.89kg CO2 is released, and for every gallon of diesel, 10.16kg CO2 is released. Combined
with MPG, the kg CO2/mi can be calculated:
8.89𝑘𝑔𝐶𝑂2
𝑔𝑎𝑙
24.4𝑚𝑖
𝑔𝑎𝑙
= 0.364𝑘𝑔𝐶𝑂2
𝑚𝑖
A similar calculation can be done for diesel, but the baseline emissions assume everyone drives.
The population of the UCDMC is 13,333. This was multiplied by the driving distance distribution
(the fraction of all driving trips that occur at each distance), to obtain the total number of people
commuting from each distance. The commute distance was the multiplied by 2, since people also have to
go home at the end of the day. In accordance with assumption 2, this number was multiplied by 4 (four
commute days per week), and then by 52 work weeks per year. This provides the total number of miles
driven per year in the baseline case, which is converted to CO2 based on the above 0.364 kgCO2/mi.
6.3.2 Current Mode Split CO2 Calculations The calculations for the current mode split CO2 emissions were done using the mode share by
distance data. This calculates the number of people commuting by each mode at each distance from
campus. The carpool data counted the total number of people who carpool, not the number of carpools
from each zip code. So using assumption 3, when carpool miles were calculated, they were divided by 2.
Similarly, for transit, the miles traveled were divided by the number of people on each vehicle. Since
people who registered for green commuting parking permits were allowed to drive 24 days per year,
this CO2 was also added to account for green commuters not always commuting ‘greenly’.
The total CO2 emissions generated by the campus shuttles is known, so calculating the shuttle miles
and estimating CO2 emissions via MPG was unnecessary. This however brought up another question
about the scope of these calculations. If the scope were to only include emissions directly from
commuting, then the MPG would be used to extract only the fuel used for commuting to or from work.
But the shuttles run even when there are not commuters, may be empty, and have to drive when not in
service. This still results in emissions related to commuting that UCDMC is responsible for, but may not
be directly related to the commuting of affiliates as a standard means of transportation.

8
As a compromise solution, the full fuel use for the shuttles was included in both the ‘everyone
drives’ baseline scenario, and the current mode split data. The reasoning being that even if everyone
drove to work, the shuttles would still be running for guests of the UCDMC, or to transport affiliates
around the campus. This means that if a driver from the baseline case switched their primary mode to
taking the shuttle, a car would have been removed from the road at no cost. So this approach amplifies
the benefit of a commuter switching to a greener mode, but also increases the total emissions for which
UCDMC is responsible.
7 Results
7.1 Shuttles From the shuttle operational data, the fuel use and CO2 emissions based on the fuel type are
shown in table (Table 2).
Fuel (gal) CO2 (kg)
Gasoline 3174.2 28219
Diesel 25432.9 258398
Total 28607.1 286616 Table 2: Shuttle operational data from, total fuel used during 2014 by fuel type.
7.2 Baseline Case The simplest case is the baseline case. All commuters at a given distance were assumed to drive,
giving the following commute distance distribution (Figure 3: Commute distance distribution for the
baseline case (everyone drives). This is also the overall distribution of how far affiliates live from
campus.), which can also be used as an overall measure of how far away people live from campus. Note
the first smaller peak before the main peak of the distribution. Comparing this to the results of the
travel survey (Figure 4), it can be seen that this peak is mostly due to the 800 students who study at
UCDMC.
9
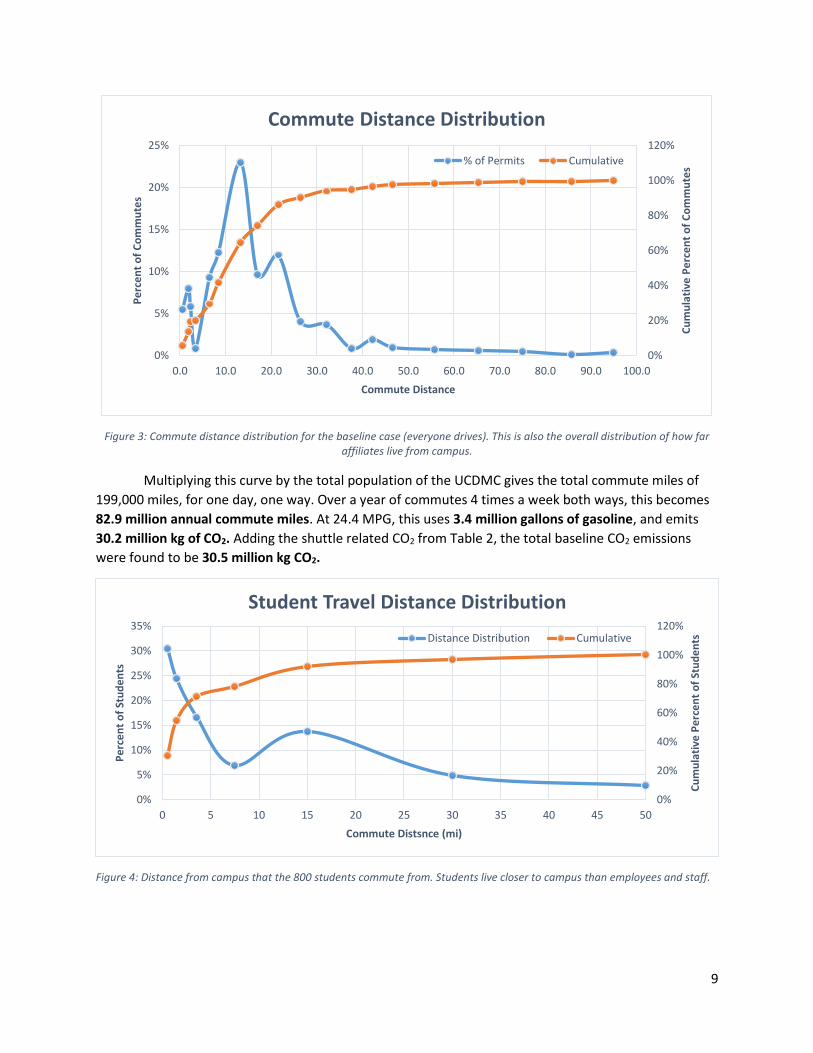
Figure 3: Commute distance distribution for the baseline case (everyone drives). This is also the overall distribution of how far affiliates live from campus.
Multiplying this curve by the total population of the UCDMC gives the total commute miles of
199,000 miles, for one day, one way. Over a year of commutes 4 times a week both ways, this becomes
82.9 million annual commute miles. At 24.4 MPG, this uses 3.4 million gallons of gasoline, and emits
30.2 million kg of CO2. Adding the shuttle related CO2 from Table 2, the total baseline CO2 emissions
were found to be 30.5 million kg CO2.
Figure 4: Distance from campus that the 800 students commute from. Students live closer to campus than employees and staff.
0%
20%
40%
60%
80%
100%
120%
0%
5%
10%
15%
20%
25%
0.0 10.0 20.0 30.0 40.0 50.0 60.0 70.0 80.0 90.0 100.0
Cu
mu
lati
ve P
erc
en
t o
f C
om
mu
tes
Pe
rce
nt
of
Co
mm
ute
s
Commute Distance
Commute Distance Distribution
% of Permits Cumulative
0%
20%
40%
60%
80%
100%
120%
0%
5%
10%
15%
20%
25%
30%
35%
0 5 10 15 20 25 30 35 40 45 50
Cu
mu
lati
ve P
erc
en
t o
f St
ud
en
ts
Pe
rce
nt
of
Stu
de
nts
Commute Distsnce (mi)
Student Travel Distance Distribution
Distance Distribution Cumulative
10
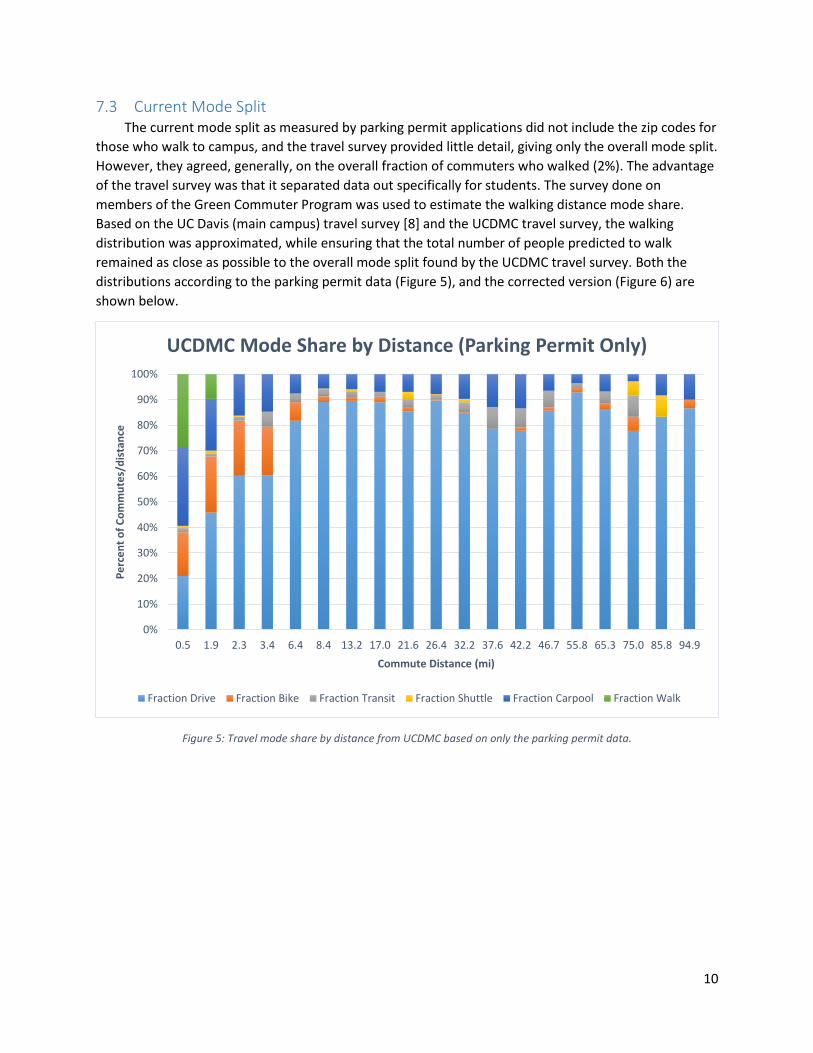
7.3 Current Mode Split The current mode split as measured by parking permit applications did not include the zip codes for
those who walk to campus, and the travel survey provided little detail, giving only the overall mode split.
However, they agreed, generally, on the overall fraction of commuters who walked (2%). The advantage
of the travel survey was that it separated data out specifically for students. The survey done on
members of the Green Commuter Program was used to estimate the walking distance mode share.
Based on the UC Davis (main campus) travel survey [8] and the UCDMC travel survey, the walking
distribution was approximated, while ensuring that the total number of people predicted to walk
remained as close as possible to the overall mode split found by the UCDMC travel survey. Both the
distributions according to the parking permit data (Figure 5), and the corrected version (Figure 6) are
shown below.
Figure 5: Travel mode share by distance from UCDMC based on only the parking permit data.
0%
10%
20%
30%
40%
50%
60%
70%
80%
90%
100%
0.5 1.9 2.3 3.4 6.4 8.4 13.2 17.0 21.6 26.4 32.2 37.6 42.2 46.7 55.8 65.3 75.0 85.8 94.9
Pe
rce
nt
of
Co
mm
ute
s/d
ista
nce
Commute Distance (mi)
UCDMC Mode Share by Distance (Parking Permit Only)
Fraction Drive Fraction Bike Fraction Transit Fraction Shuttle Fraction Carpool Fraction Walk

11
Figure 6: Travel mode share by distance from UCDMC based on the parking permit data and corrected to account for the travel survey.
Another way to look at the mode split is to see how each mode changes with distance. Figure 7 shows
what fraction of each mode occurs at each distance from the UCDMC. This data multiplied by the
percent of all trips that are from each distance and the population provides the number of people
commuting by each mode from each distance, and thus the total commute miles of each mode as
shown in Table 3. Note that there are two very large peaks in the number of commuters taking the
UCDMC shuttle at 13 and 21 miles. This is because both the zip codes associated with those distances
were located in Davis, CA where the shuttle stops were at UC Davis. It made sense then that a large
number of commuters would take the inter-campus shuttle at those distances. This also explains why
such a large number of the total commuters, as seen in Figure 3 commute from 13 miles, since this was
the zip code for northern Davis.
0%
10%
20%
30%
40%
50%
60%
70%
80%
90%
100%
0.5 1.9 2.3 3.4 6.4 8.4 13.2 17.0 21.6 26.4 32.2 37.6 42.2 46.7 55.8 65.3 75.0 85.8 94.9
Pe
rce
nt
of
Co
mm
ute
/Dis
tan
ce
Commute Distance (mi)
UCDMC Mode Share by Distance (Corrected for Travel Survey)
Fraction Drive Fraction Bike Fraction Transit Fraction Shuttle Fraction Carpool Fraction Walk

12
Figure 7: Distance distribution of each travel mode.
Distance Drive Miles Carpool miles Transit miles Shuttle Miles
0.5 79.2 46.5 0.3 0.3
1.9 921.8 163.3 1.2 2.2
2.3 1124.6 121.4 1.6 0.8
3.4 239.9 23.4 1.3 0.0
6.4 6673.7 247.5 14.7 1.1
8.4 12544.5 317.9 22.5 2.9
13.2 37002.7 980.7 53.0 31.8
17.0 19921.1 622.0 22.8 0.0
21.6 30105.4 981.2 59.9 100.4
26.4 13011.1 454.9 15.2 4.5
32.2 13531.0 621.1 33.9 22.2
37.6 3565.0 233.3 21.6 0.0
42.2 8432.4 581.5 44.4 0.0
46.7 5304.1 160.7 22.3 0.0
55.8 4998.7 76.9 5.3 0.0
65.3 4275.2 135.0 12.5 0.0
0%
5%
10%
15%
20%
25%
30%
35%
40%
45%
0.0 10.0 20.0 30.0 40.0 50.0 60.0
% o
f Ea
ch M
od
e
Commute Distance (mi)
UCDMC Travel Mode Distance Distribution
% of Drive % of Bike % of Transit % of Shuttle % of Carpool

13
75.0 3618.8 51.7 21.5 25.8
85.8 1477.6 59.1 0.0 14.8
94.9 4251.3 196.2 0.0 0.0
Sum (mi) 171,078 6074 354 206
CO2 (kg) 62,331 2213 600 525 Table 3: One-way commute miles of each mode, parking permit data only.
The CO2 emissions from one way commuting, including only shuttle emissions related to
commuting to and from work was 65,670 kg CO2. Over a year of two way commuting four times a day,
52 weeks a year, this was 27.07 million kg CO2. Counting all shuttle CO2 emissions from Table 2, the
current mode split CO2 emissions were 27.1 million kg CO2 per year. The CO2 emissions avoided
compared to the baseline case was 2.7 million kg CO2/year.
Correcting the distributions shown in Figure 7 according to the travel survey, as in Figure 6 adds 610
‘walk miles’ to the daily commute, or 254,000 walk miles per year, reducing yearly commute related CO2
emissions to 26.1 million kg CO2. This was a reduction of 2.6 million kg CO2 per year over the corrected
baseline value. Note that the savings in the corrected case were found to be lower than the uncorrected
case. This is because the corrected case included students who do not commute as far, which
significantly reduced the carbon footprint of the corrected baseline case. Even though the relative
savings compared to the corrected bassline were smaller, the total emissions were much lower than the
emissions from the uncorrected case.
Summary of
Results CO2
(Mkg/year) Reduction from Baseline
(Mkg/year)
Baseline 29.8 0
Baseline (Corrected) 28.7 0
Current 27.1 2.7
Current (Corrected) 26.1 2.6 Table 4: Summary of CO2 reduction from baseline case.
8 Conclusions The UCDMC was found to be avoiding the emission on 2.7 million kg of CO2 per year from the
baseline case of everyone driving to UCDMC. While this is not a particularly realistic approach to
calculating real reductions in CO2, it provides a measure of the ‘green-ness’ on the current mode split.
To evaluate the ‘actual’ CO2 savings the UCDMC gets, a measure of the Green Commuter Program’s
effectiveness is required. This will be addressed using the results of the survey in the next report.
The campus travel survey results are far too imprecise to accurately calculate CO2 emissions. Either
the raw data from travel surveys should be made available, or the results summary should include plots
such as Figure 5. This will enable more accurate calculation of CO2 emissions.
14
9 References 1. UC Davis Medical Center Transportation and Parking Services, “Green Commuter Program”,
Accessed 5/13/2016. http://www.ucdmc.ucdavis.edu/parking/green/ 2. UC Davis Medical Center Transportation and Parking Services, “Carpool Program Guidelines”, FY
2015-2016. Accessed 5/13/2016. http://www.ucdmc.ucdavis.edu/parking/downloads/Carpool_Program_Guidelines.pdf
3. University of California Davis Health System, “Existing Conditions Review: Travel Survey Results.” Fall 2014. Report provided by Sarah T. Janus ([email protected]).
4. unitedstateszipcodes.org, (2014, February 1). ZIP Code Database. Retrieved May 7,
2016, from http://www.unitedstateszipcodes.org/zip-code-database/
5. Mathworks. MATLAB & SIMULINK (Version R2014a) [Computer software]. Website:
http://www.mathworks.com/products/matlab/
6. MapQuest Directions API (Version December 18, 2013 Update) [Program
documentation]. (n.d.). Retrieved May 7, 2016, from
http://www.mapquestapi.com/directions/releasenotes.html
7. United States, Energy Information Administration. (2016, February 2). Carbon Dioxide
Emissions Coefficients. Retrieved May 5, 2016, from
http://www.eia.gov/environment/emissions/co2_vol_mass.cfm
8. Popovich, N. (2014). Results of the 2013-14 campus travel survey. Technical report. UC
Davis Institute for Transpiration Studies.
9. Ferrell, C. E., & Reinke, D. B. (2015). Household Income and Vehicle Fuel Economy in
California.
15
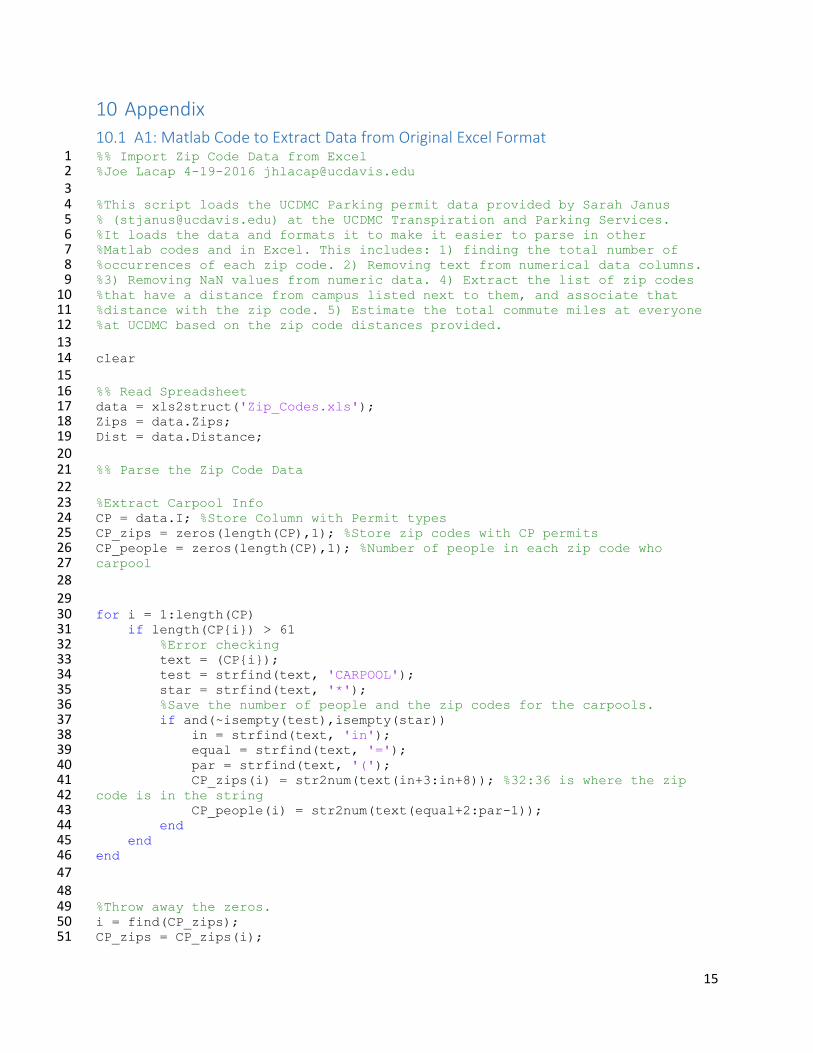
10 Appendix
10.1 A1: Matlab Code to Extract Data from Original Excel Format %% Import Zip Code Data from Excel 1 %Joe Lacap 4-19-2016 [email protected] 2 3 %This script loads the UCDMC Parking permit data provided by Sarah Janus 4 % ([email protected]) at the UCDMC Transpiration and Parking Services. 5 %It loads the data and formats it to make it easier to parse in other 6 %Matlab codes and in Excel. This includes: 1) finding the total number of 7 %occurrences of each zip code. 2) Removing text from numerical data columns. 8 %3) Removing NaN values from numeric data. 4) Extract the list of zip codes 9 %that have a distance from campus listed next to them, and associate that 10 %distance with the zip code. 5) Estimate the total commute miles at everyone 11 %at UCDMC based on the zip code distances provided. 12 13 clear 14 15 %% Read Spreadsheet 16 data = xls2struct('Zip_Codes.xls'); 17 Zips = data.Zips; 18 Dist = data.Distance; 19 20 %% Parse the Zip Code Data 21 22 %Extract Carpool Info 23 CP = data.I; %Store Column with Permit types 24 CP_zips = zeros(length(CP),1); %Store zip codes with CP permits 25 CP_people = zeros(length(CP),1); %Number of people in each zip code who 26 carpool 27 28 29 for i = 1:length(CP) 30 if length(CP{i}) > 61 31 %Error checking 32 text = (CP{i}); 33 test = strfind(text, 'CARPOOL'); 34 star = strfind(text, '*'); 35 %Save the number of people and the zip codes for the carpools. 36 if and(~isempty(test),isempty(star)) 37 in = strfind(text, 'in'); 38 equal = strfind(text, '='); 39 par = strfind(text, '('); 40 CP_zips(i) = str2num(text(in+3:in+8)); %32:36 is where the zip 41 code is in the string 42 CP_people(i) = str2num(text(equal+2:par-1)); 43 end 44 end 45 end 46 47 48 %Throw away the zeros. 49 i = find(CP_zips); 50 CP_zips = CP_zips(i); 51

16
i = find(CP_people); 52 CP_people=CP_people(i); 53 54 55 56 %rename NAN, ZIP, and NO ZIP to 0. 57 for i = 1:length(Zips) 58 if strcmp(Zips{i}, 'ZIP') 59 Zips(i) = {'00000'}; 60 end 61 62 if strcmp(Zips{i}, '*NO ZIP*') 63 Zips(i) = {'00000'}; 64 end 65 66 if isnan(Zips{i}) 67 Zips(i) = {'00000'}; 68 end 69 70 Zips{i} = str2double(Zips{i}); 71 72 end 73 74 Zips = cell2mat(Zips); 75 76 %Throw away things that aren't zip codes 77 ind = find(Zips); 78 Cleaned = Zips(ind); 79 clear Zips 80 zips = Cleaned; 81 clear Cleaned ind i; 82 83 %% Clean up and parse distance data 84 85 for i = 1:length(Dist) 86 if isnumeric(Dist{i}) 87 Temp(i) = Dist{i}; 88 end 89 end 90 clear Dist 91 %Remove NaN's 92 Dist = NoNaNs(Temp); 93 clear Temp 94 %Dist is now a double 95 96 %% Extract Zip Codes Coresponding to Distance 97 98 %Get only numeric data 99 zipDist=data.Zip_Dist; 100 for i = 1:length(zipDist) 101 if isnumeric(zipDist{i}) 102 Zip_Dist(i) = zipDist{i}; 103 end 104 end 105
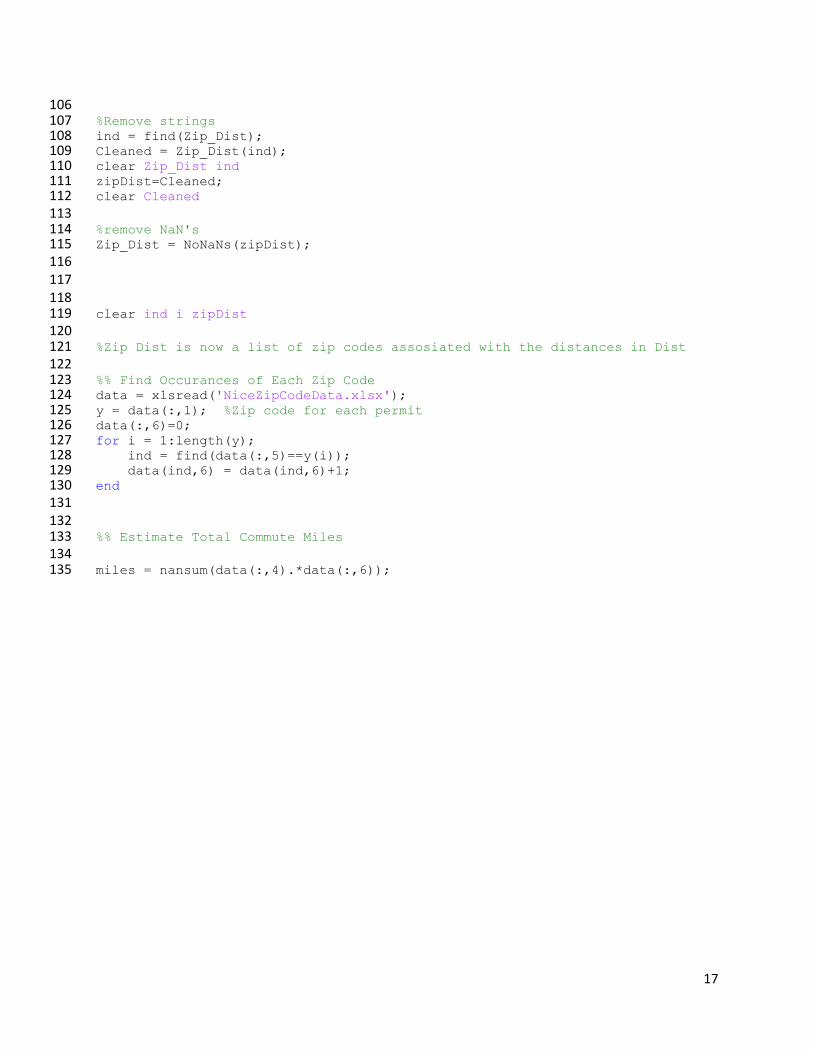
17
106 %Remove strings 107 ind = find(Zip_Dist); 108 Cleaned = Zip_Dist(ind); 109 clear Zip_Dist ind 110 zipDist=Cleaned; 111 clear Cleaned 112 113 %remove NaN's 114 Zip_Dist = NoNaNs(zipDist); 115 116 117 118 clear ind i zipDist 119 120 %Zip Dist is now a list of zip codes assosiated with the distances in Dist 121 122 %% Find Occurances of Each Zip Code 123 data = xlsread('NiceZipCodeData.xlsx'); 124 y = data(:,1); %Zip code for each permit 125 data(:,6)=0; 126 for i = 1:length(y); 127 ind = find(data(:,5)==y(i)); 128 data(ind,6) = data(ind,6)+1; 129 end 130 131 132 %% Estimate Total Commute Miles 133 134 miles = nansum(data(:,4).*data(:,6));135
18
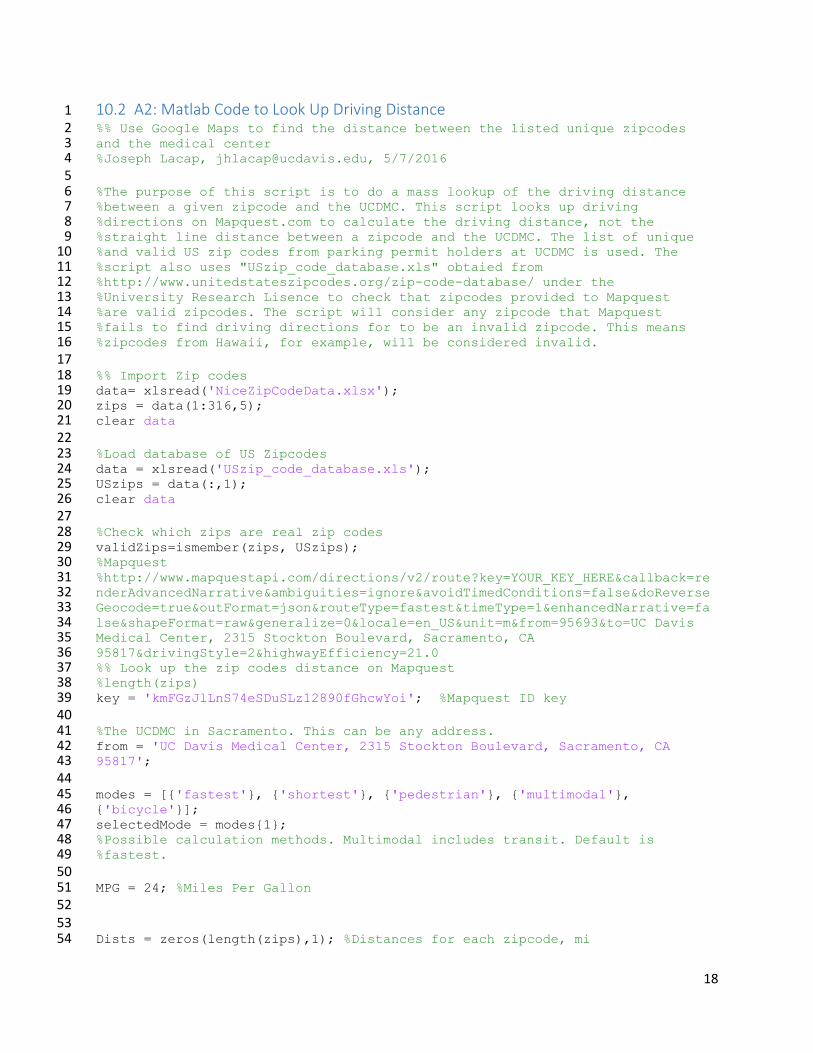
10.2 A2: Matlab Code to Look Up Driving Distance 1 %% Use Google Maps to find the distance between the listed unique zipcodes 2 and the medical center 3 %Joseph Lacap, [email protected], 5/7/2016 4 5 %The purpose of this script is to do a mass lookup of the driving distance 6 %between a given zipcode and the UCDMC. This script looks up driving 7 %directions on Mapquest.com to calculate the driving distance, not the 8 %straight line distance between a zipcode and the UCDMC. The list of unique 9 %and valid US zip codes from parking permit holders at UCDMC is used. The 10 %script also uses "USzip_code_database.xls" obtaied from 11 %http://www.unitedstateszipcodes.org/zip-code-database/ under the 12 %University Research Lisence to check that zipcodes provided to Mapquest 13 %are valid zipcodes. The script will consider any zipcode that Mapquest 14 %fails to find driving directions for to be an invalid zipcode. This means 15 %zipcodes from Hawaii, for example, will be considered invalid. 16 17 %% Import Zip codes 18 data= xlsread('NiceZipCodeData.xlsx'); 19 zips = data(1:316,5); 20 clear data 21 22 %Load database of US Zipcodes 23 data = xlsread('USzip_code_database.xls'); 24 USzips = data(:,1); 25 clear data 26 27 %Check which zips are real zip codes 28 validZips=ismember(zips, USzips); 29 %Mapquest 30 %http://www.mapquestapi.com/directions/v2/route?key=YOUR_KEY_HERE&callback=re31 nderAdvancedNarrative&ambiguities=ignore&avoidTimedConditions=false&doReverse32 Geocode=true&outFormat=json&routeType=fastest&timeType=1&enhancedNarrative=fa33 lse&shapeFormat=raw&generalize=0&locale=en_US&unit=m&from=95693&to=UC Davis 34 Medical Center, 2315 Stockton Boulevard, Sacramento, CA 35 95817&drivingStyle=2&highwayEfficiency=21.0 36 %% Look up the zip codes distance on Mapquest 37 %length(zips) 38 key = 'kmFGzJlLnS74eSDuSLz12890fGhcwYoi'; %Mapquest ID key 39 40 %The UCDMC in Sacramento. This can be any address. 41 from = 'UC Davis Medical Center, 2315 Stockton Boulevard, Sacramento, CA 42 95817'; 43 44 modes = [{'fastest'}, {'shortest'}, {'pedestrian'}, {'multimodal'}, 45 {'bicycle'}]; 46 selectedMode = modes{1}; 47 %Possible calculation methods. Multimodal includes transit. Default is 48 %fastest. 49 50 MPG = 24; %Miles Per Gallon 51 52 53 Dists = zeros(length(zips),1); %Distances for each zipcode, mi 54

19
%travelTime = zeros(length(zips),1);%travel time from each zipcode, sec 55 invalidZips = zeros(length(zips),1); %Store the index of invalid zip codes 56 57 58 for i = 1:length(zips) 59 60 if and(validZips(i), zips(i) > 10000) %Make sure is a 5 digit zipcode 61 62 if zips(i) == 95817; %This is the UCDMC zipcode 63 Dists(i) =0.5; 64 TravelTime{i} = '120'; 65 66 else %If this is NOT the UCDMC zip code 67 68 %Put the zipcode in the search 69 to = num2str(zips(i)); 70 %url = 71 strcat('http://www.mapquestapi.com/directions/v2/route?key=', key, 72 '&callback=renderAdvancedNarrative&ambiguities=ignore&avoidTimedConditions=fa73 lse&doReverseGeocode=true&outFormat=json&routeType=',selectedMode,'&timeType=74 1&enhancedNarrative=false&shapeFormat=raw&generalize=0&locale=en_US&unit=m&fr75 om=', from,'&to=',to,'&drivingStyle=2&highwayEfficiency=', num2str(MPG)); 76 url = 77 strcat('http://www.mapquestapi.com/directions/v2/route?key=', key, 78 '&callback=renderAdvancedNarrative&ambiguities=ignore&avoidTimedConditions=fa79 lse&doReverseGeocode=true&outFormat=json&routeType=',selectedMode,'&timeType=80 1&narrativeType=html&enhancedNarrative=true&generalize=0&locale=en_US&unit=m&81 from=', from,'&to=',to,'&drivingStyle=2&highwayEfficiency=', num2str(MPG)); 82 %Get the data from Mapquest 83 Mapquest = urlread(url); 84 85 %% Parse the URL 86 87 %error checking 88 noRoute = 'We are unable to route with the given locations'; 89 ohNo = strfind(Mapquest, noRoute); 90 if and(exist('ohNo'), ~isempty(ohNo)) %Invalid zipcode 91 Dists(i) = 0; 92 travelTime{i} = '0'; 93 invalidZips(i) = i; 94 clear ohNo 95 else %There is a route 96 97 %Find the driving distance 98 distIndex = strfind(Mapquest,'distance'); 99 Dists(i) = str2num(Mapquest(distIndex(1)+10:distIndex(1)+14)); 100 101 %Find the travel time 102 timeInd = strfind(Mapquest, 'realTime'); 103 travelTime{i} = Mapquest(timeInd+10:timeInd+13); 104 end 105 end 106 107 else %If the zipcode is invalid 108 Dists(i)=0; 109

20
travelTime{i} = '0'; 110 invalidZips(i) = i; %Store the index of invalid zip codes 111 end 112 pause(5); %Wait 5 seconds to avoid overloading Mapquest server 113 end 114 115 %% Find all the invalid zipcodes 116 invalidZipcodes(:,1) = find(invalidZips); 117 for i=1:length(invalidZipcodes) 118 invalidZipcodes(i,2) = invalidZips(invalidZipcodes(i,1)); 119 end 120 %InvalidZipcodes stores the index of the bad zip codes in column 1, and the 121 %value of the invalid zipcode in column 2. 122 123 clear distIndex i key Mapquest modes timeInd url noRoute 124

21
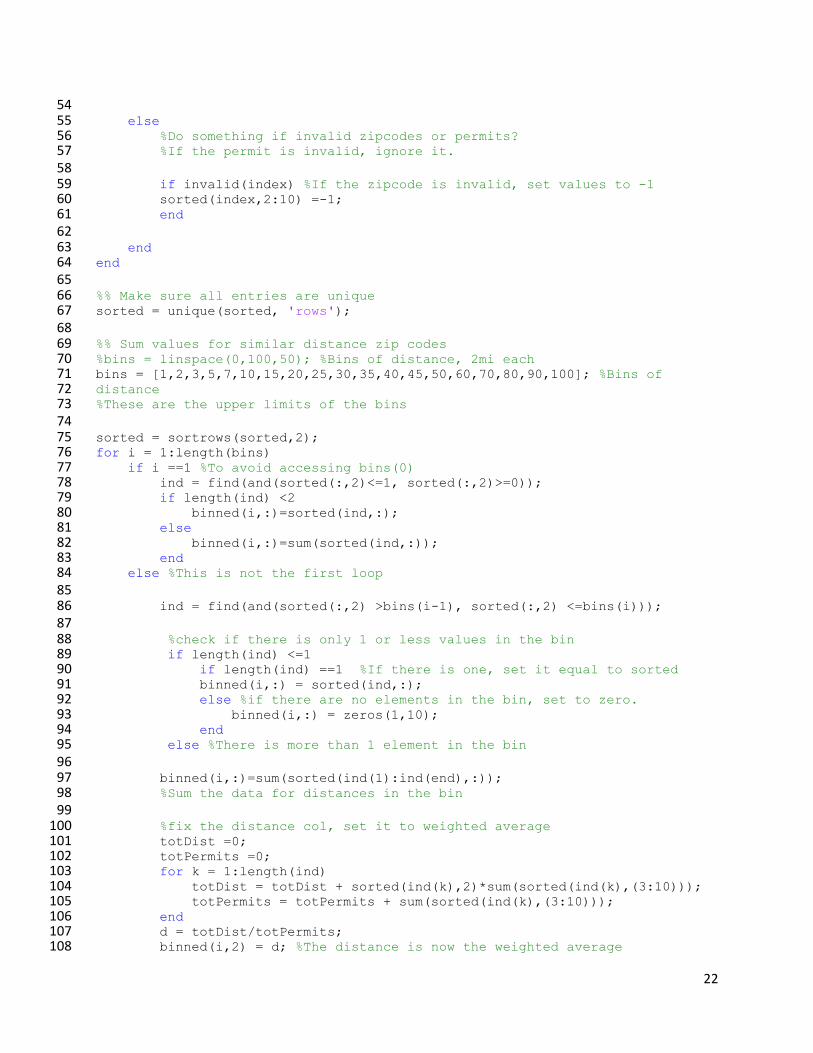
10.3 A3: Matlab Code to Bin Zip Codes by Distance and Determine Mode Split 1 %% Analyze Mode Distribution for UCDMC 2 %Joseph Lacap 5/7/2016 [email protected] 3 4 %This uses the data saved in the spreadsheet "NiceZipCodeData" that was 5 %generated using "ParseZipData.m", then modified a little manually. It also 6 %uses data from "ZipCodeDistanceMapQuest.m", which was saved to a Matlab 7 %data file manually (as in the save command is not part of that script). 8 %The purpose of this script is to: 1) count the number of each permit type 9 %held in each zipcode. 2) Bin the zipcodes that are similar distances away 10 %from the UCDMC campus to make data analysis easier. The results from this 11 %spreadsheet were manually saved using xlswrite() and can be seen in 12 %"UCDMCModeDist3.xlsx". 13 14 clear 15 %% Load Data 16 data = xlsread('NiceZipCodeData.xlsx'); 17 data2 = xls2struct('NiceZipCodeData.xlsx'); 18 data3 = load('MapquestDistanceCalculation.mat'); 19 20 21 %% Filter Mode Data 22 modes = ['PDB '; 'CP '; 'BIKE '; 'PDBR '; 'PDD '; 'SHMO '; 'TRANS'; 'RTMO 23 ']; 24 modes=cellstr(modes); 25 modeData = data2.Mode0x2FPermit; 26 27 checkPermit = ismember(modeData, modes); 28 29 30 %% Get Valid Zipcodes 31 uniZips = data3.zips; %all unique zip codes 32 invalid = data3.invalidZips; 33 34 35 %% Loop throuh all zip codes 36 sorted = zeros(length(uniZips),length(modes)+2); 37 %Sorted = [Zipcode, distance, PDB, CP, Bike, PDBR, PDD, SHMO, Trans, RTMO] 38 39 sorted(:,1) = uniZips; 40 sorted(:,2) = data3.Dists; 41 42 %Look for each mode, then add ticks to each zip for each mode found 43 for i = 1:length(modeData) 44 index = find(uniZips== data(i,1)); 45 46 if and(invalid(index) ==0, checkPermit(i)) %If this is a valid zipcode 47 and permit type 48 49 %Determine the mode 50 x=strcmp(modes, modeData(i)); 51 modeInd = find(x); 52 sorted(index,modeInd+2) = sorted(index,modeInd+2)+1; 53
22
54 else 55 %Do something if invalid zipcodes or permits? 56 %If the permit is invalid, ignore it. 57 58 if invalid(index) %If the zipcode is invalid, set values to -1 59 sorted(index,2:10) =-1; 60 end 61 62 end 63 end 64 65 %% Make sure all entries are unique 66 sorted = unique(sorted, 'rows'); 67 68 %% Sum values for similar distance zip codes 69 %bins = linspace(0,100,50); %Bins of distance, 2mi each 70 bins = [1,2,3,5,7,10,15,20,25,30,35,40,45,50,60,70,80,90,100]; %Bins of 71 distance 72 %These are the upper limits of the bins 73 74 sorted = sortrows(sorted,2); 75 for i = 1:length(bins) 76 if i ==1 %To avoid accessing bins(0) 77 ind = find(and(sorted(:,2)<=1, sorted(:,2)>=0)); 78 if length(ind) <2 79 binned(i,:)=sorted(ind,:); 80 else 81 binned(i,:)=sum(sorted(ind,:)); 82 end 83 else %This is not the first loop 84 85 ind = find(and(sorted(:,2) >bins(i-1), sorted(:,2) <=bins(i))); 86 87 %check if there is only 1 or less values in the bin 88 if length(ind) <=1 89 if length(ind) ==1 %If there is one, set it equal to sorted 90 binned(i,:) = sorted(ind,:); 91 else %if there are no elements in the bin, set to zero. 92 binned(i,:) = zeros(1,10); 93 end 94 else %There is more than 1 element in the bin 95 96 binned(i,:)=sum(sorted(ind(1):ind(end),:)); 97 %Sum the data for distances in the bin 98 99 %fix the distance col, set it to weighted average 100 totDist =0; 101 totPermits =0; 102 for k = 1:length(ind) 103 totDist = totDist + sorted(ind(k),2)*sum(sorted(ind(k),(3:10))); 104 totPermits = totPermits + sum(sorted(ind(k),(3:10))); 105 end 106 d = totDist/totPermits; 107 binned(i,2) = d; %The distance is now the weighted average 108

23
end 109 110 111 end 112 113 end 114

24
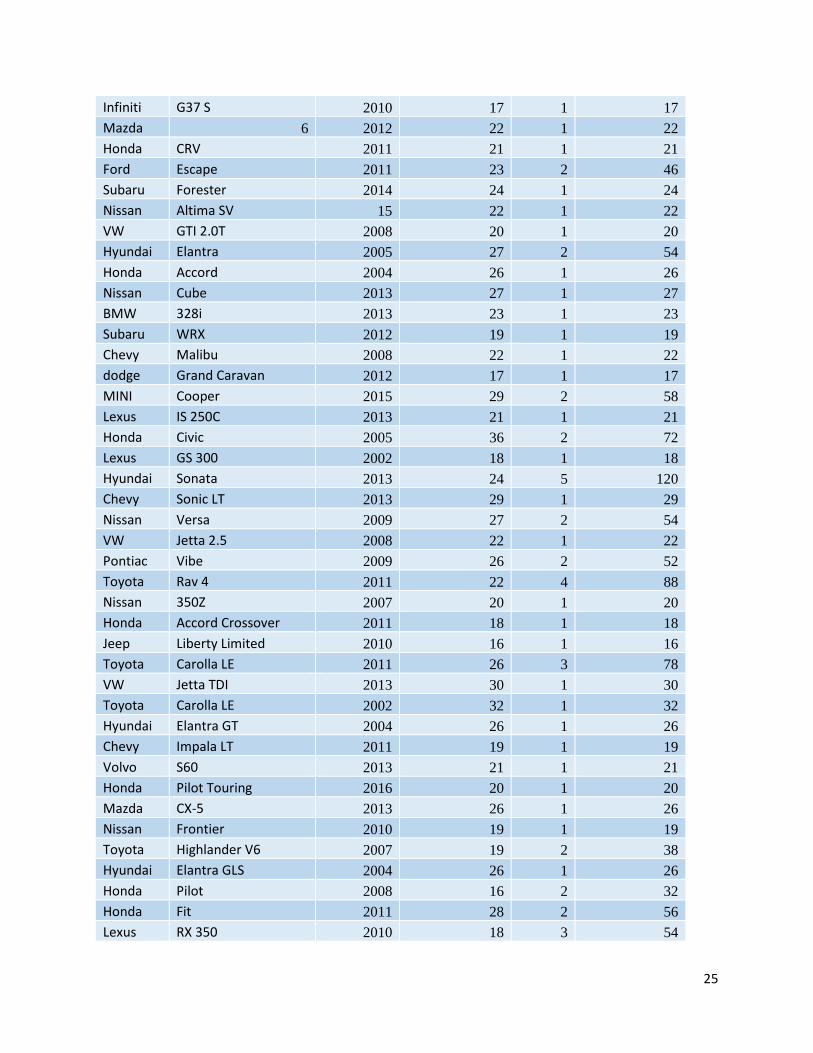
10.4 A4: Vehicle Type Survey Table
Maker Model Year MPG (EPA City) # Weighted MPG
Hyundai Elantra 2010 24 1 24
Lexus RX 330 2006 18 2 36
Toyota Carolla LE 2008 28 11 308
Nissan Altima SL 2013 27 1 27
Mercedes E320 4matic 2004 17 1 17
Nissan Rogue 2014 26 1 26
Honda Insight 2014 41 1 41
Honda Accord 2005 29 3 87
Honda Accord 2007 26 3 78
Kia Optima Gdi 2015 20 1 20
BMW 335i 2012 23 1 23
Mercedes C300 2012 17 1 17
Lexus ES 350 2007 21 3 63
Nissan Pathfinder 2005 16 1 16
Honda Civic 2012 29 4 116
GMC Envoy XL 2006 16 1 16
Nissan Altima S 2012 23 4 92
Honda Prius 2014 51 5 255
Subaru Outback 2015 25 2 50
Honda Accord 2012 23 4 92
Nissan Pathfinder Platinum 2013 20 1 20
Lexus RX 400h 2006 33 1 33
Mazda 3 2013 28 4 112
Mercury Mariner 2008 20 1 20
Chrysler PT Cruiser 2004 21 3 63
Infiniti EX 35 2012 17 1 17
Toyota Camry SE 2012 25 6 150
Dodge Durango 2011 16 1 16
Subaru Outback 3.6R 2015 20 1 20
Mercury Sable LS 2005 20 1 20
Chevy Traverse LT 2009 17 1 17
Nissan Sentra GXE 2003 28 2 56
Honda Civic Hybrid 2015 44 1 44
Jeep Grand Cherokee 2013 17 1 17
Toyota Tacoma PreRunner V6 2015 17 2 34
Ford Edge 2013 21 1 21
Ford Fiesta 2014 26 2 52
25
Infiniti G37 S 2010 17 1 17
Mazda 6 2012 22 1 22
Honda CRV 2011 21 1 21
Ford Escape 2011 23 2 46
Subaru Forester 2014 24 1 24
Nissan Altima SV 15 22 1 22
VW GTI 2.0T 2008 20 1 20
Hyundai Elantra 2005 27 2 54
Honda Accord 2004 26 1 26
Nissan Cube 2013 27 1 27
BMW 328i 2013 23 1 23
Subaru WRX 2012 19 1 19
Chevy Malibu 2008 22 1 22
dodge Grand Caravan 2012 17 1 17
MINI Cooper 2015 29 2 58
Lexus IS 250C 2013 21 1 21
Honda Civic 2005 36 2 72
Lexus GS 300 2002 18 1 18
Hyundai Sonata 2013 24 5 120
Chevy Sonic LT 2013 29 1 29
Nissan Versa 2009 27 2 54
VW Jetta 2.5 2008 22 1 22
Pontiac Vibe 2009 26 2 52
Toyota Rav 4 2011 22 4 88
Nissan 350Z 2007 20 1 20
Honda Accord Crossover 2011 18 1 18
Jeep Liberty Limited 2010 16 1 16
Toyota Carolla LE 2011 26 3 78
VW Jetta TDI 2013 30 1 30
Toyota Carolla LE 2002 32 1 32
Hyundai Elantra GT 2004 26 1 26
Chevy Impala LT 2011 19 1 19
Volvo S60 2013 21 1 21
Honda Pilot Touring 2016 20 1 20
Mazda CX-5 2013 26 1 26
Nissan Frontier 2010 19 1 19
Toyota Highlander V6 2007 19 2 38
Hyundai Elantra GLS 2004 26 1 26
Honda Pilot 2008 16 2 32
Honda Fit 2011 28 2 56
Lexus RX 350 2010 18 3 54
26
Buick La Sabre 2004 20 1 20
Honda Civic 2015 31 2 62
VW GTI 2.0T 2014 24 1 24
Toyota Highlander 2012 17 1 17
Pontiac Vibe 2005 29 1 29
Kia Rio 2008 27 1 27
Infiniti I30 2003 20 1 20
Honda Civic Hybrid 2010 40 1 40
Subaru Outback 2003 22 1 22
Scion xB 2011 22 1 22
Honda Acura 2008 18 1 18
Toyota Rav 4 2014 24 1 24
Jeep Compass 2012 23 1 23
Toyota Tacoma PreRunner V6 2010 20 1 20
Toyota 4Runner 2014 17 2 34
Chevy Camaro 2013 19 1 19
Toyota Camry SE 2005 24 2 48
Nissan Sentra SV 2014 30 1 30
Subaru Outback 2013 24 1 24
Honda Acura 2013 16 1 16
Chevy Equinox 2012 22 1 22
Honda Acura TL 2008 18 1 18
Dodge Avenger 2008 21 1 21
Infiniti G35 2003 20 1 20
Chrysler Sebring 2007 24 1 24
Nissan Rogue 2008 22 2 44
Ford Fusion 2007 23 2 46
VW Passat 2012 31 1 31
Nissan Versa 2012 30 2 60
Mazda 3 2041 30 1 30
Honda CRV 2005 23 1 23
Honda Pilot 2013 18 1 18
Ford Fusion 2013 22 1 22
Scion xB 2005 31 1 31
Toyota Camry LE 2008 21 1 21
Ford Ranger 2002 24 1 24
Lexus GS 350 2011 19 1 19
Dodge RAM 2013 18 1 18
Hyundai Santa Fe 2010 21 2 42
Honda Acura 2000 19 1 19
Volvo XC 90 2014 16 1 16

27
Toyota Solara 2000 23 1 23
Subaru Empreza 2012 27 2 54
Honda Accord V6 2006 20 1 20
Chevy TrailBlazer 2006 16 1 16
Hyundai Tucson 2012 22 1 22
BMW 325i 2005 20 1 20

28
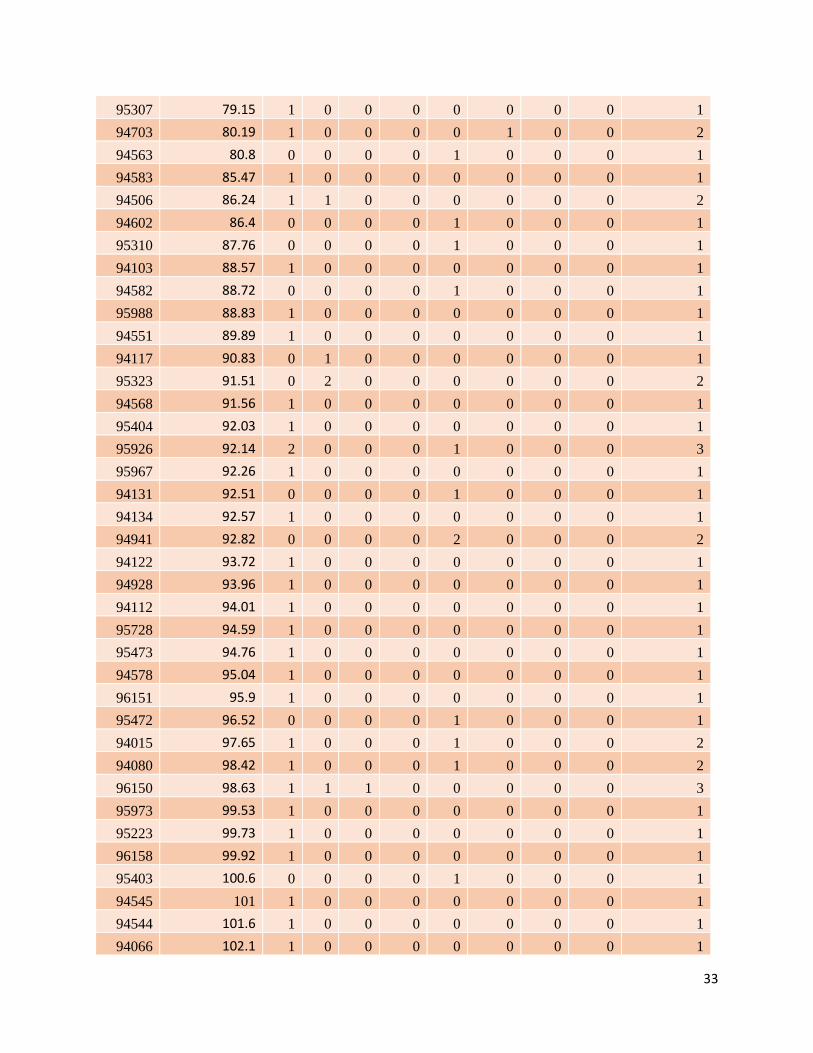
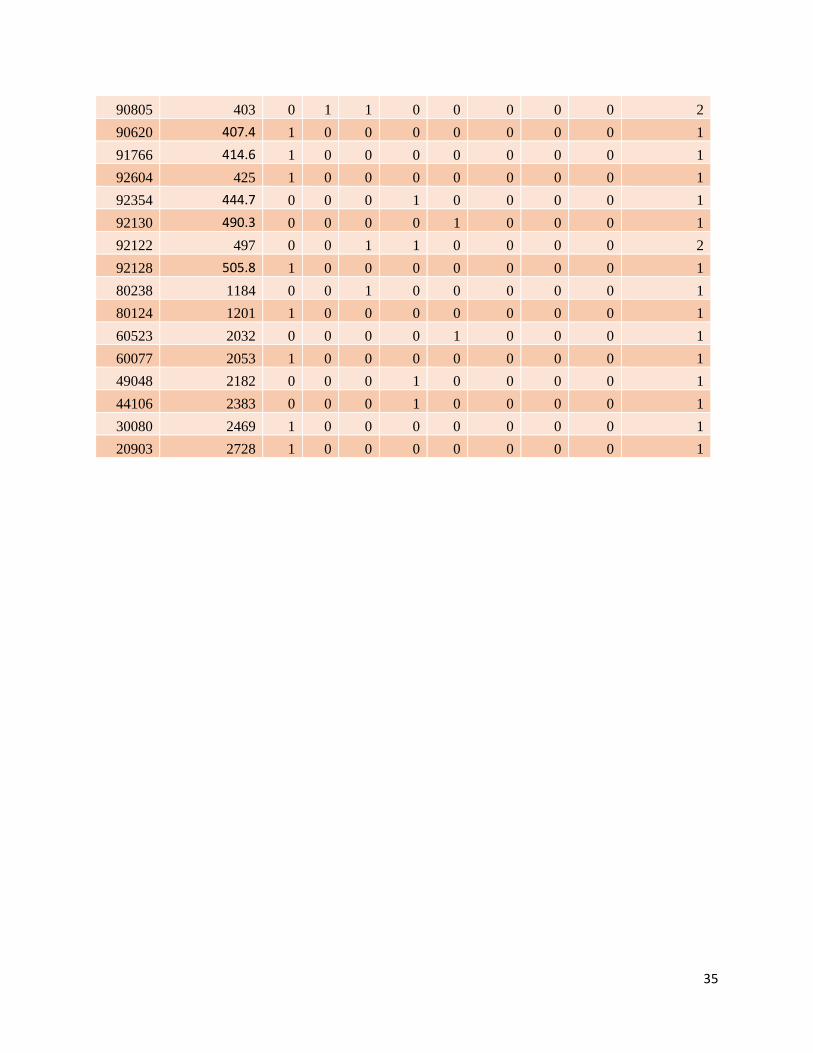
10.5 A5: Permits per Zip Code Table
ZipCode Travel Dist (mi) PDB CP Bike PDBR PDD SHMO Trans RTMO
Total Permits
95817 0.5 57 133 75 5 30 4 2 5 311
95820 1.753 81 60 45 6 32 4 0 6 234
95816 1.919 80 74 94 31 59 3 0 1 342
95818 2.033 59 17 38 4 42 0 0 2 162
95819 2.46 57 57 61 9 63 1 1 1 250
95824 2.803 31 2 1 0 13 1 0 3 51
95811 3.397 18 10 13 14 9 0 0 4 68
95813 5.009 0 0 0 0 1 0 0 0 1
95851 5.009 1 0 0 0 1 0 0 0 2
95860 5.009 1 0 0 0 0 0 0 0 1
95814 5.338 31 21 7 3 7 0 0 4 73
95815 5.948 21 1 0 3 1 0 0 1 27
95822 6.191 72 12 8 1 42 0 0 5 140
95826 6.462 92 12 23 6 35 0 0 6 174
95605 6.526 22 5 2 2 6 0 0 0 37
95828 6.799 105 8 2 2 28 0 2 4 151
95825 6.816 71 7 12 21 29 1 0 2 143
95691 7.23 134 15 8 5 38 0 0 5 205
95833 7.713 59 9 2 8 39 0 0 4 121
95864 8.251 59 7 5 4 87 1 0 0 163
95838 8.641 31 0 1 0 15 0 0 2 49
95823 8.668 123 19 0 0 40 0 0 8 190
95827 8.711 38 14 2 1 16 0 0 6 77
95821 9.691 52 5 1 3 21 1 0 3 86
95834 9.702 60 10 2 4 31 0 0 0 107
95831 10.21 99 11 3 12 75 0 0 3 203
95652 11.16 0 0 0 0 1 0 0 0 1
95660 11.89 20 2 0 0 5 0 0 1 28
95841 12.03 19 0 0 0 10 0 0 0 29
95832 12.04 10 2 0 0 4 0 0 4 20
95759 12.19 2 0 0 0 3 0 0 0 5
95608 12.28 81 6 3 2 76 0 0 2 170
95741 12.32 0 1 1 0 0 0 0 1 3
95673 12.34 10 4 0 0 11 0 0 1 26
95835 12.34 129 15 1 7 51 0 0 1 204

29
95829 13.18 68 19 0 2 36 1 1 1 128
95830 13.38 1 0 0 0 2 0 0 0 3
95670 13.72 90 18 1 3 42 0 0 15 169
95758 13.75 181 30 6 3 94 0 2 3 319
95655 13.83 11 0 0 0 4 0 0 0 15
95842 13.86 23 1 0 0 9 0 0 3 36
95624 14.59 140 39 3 0 70 1 2 0 255
95618 14.6 107 19 7 8 108 12 1 1 263
95611 14.87 1 1 2 0 0 0 0 0 4
95837 15.69 1 0 0 0 0 0 0 0 1
95843 16.09 73 13 1 0 23 0 0 0 110
95621 16.14 41 1 4 0 19 0 0 0 65
95742 16.68 43 2 2 2 13 0 0 2 64
95628 16.89 67 12 3 1 35 0 0 4 122
95757 17.02 184 42 4 3 81 0 3 2 319
95610 17.96 25 3 3 1 12 0 0 3 47
95612 19.24 1 0 0 1 0 0 0 0 2
95661 19.67 27 7 0 1 25 0 0 0 60
95626 20.18 7 0 0 0 5 0 0 0 12
95662 20.35 44 3 2 1 16 0 0 1 67
95747 21.19 104 24 1 0 39 0 4 0 172
95763 21.21 0 1 0 0 2 0 0 1 4
95630 21.28 119 21 3 0 84 0 0 17 244
95678 21.29 40 3 0 0 12 0 1 0 56
95671 21.6 0 2 0 0 0 0 0 0 2
95616 21.95 104 23 7 9 72 26 0 0 241
95683 22.03 11 0 0 0 18 0 0 1 30
95776 22.11 33 3 0 0 5 1 2 0 44
95677 22.4 19 6 2 0 10 0 0 0 37
95617 22.7 4 2 0 0 2 0 0 0 8
95746 23 27 9 1 0 23 0 1 1 62
95632 25.27 31 2 0 0 16 0 2 0 51
95668 25.49 2 0 0 0 1 0 0 0 3
95765 25.61 44 17 0 0 25 0 1 0 87
95650 26.44 9 4 0 0 6 0 0 0 19
95693 26.72 13 3 0 0 2 0 0 0 18
95762 27.09 50 12 1 2 47 0 2 1 115
95620 27.28 23 2 0 0 11 1 0 0 37

30
95615 27.69 0 0 0 0 1 0 0 0 1
95663 28.92 3 2 0 0 0 0 0 0 5
95695 30.2 24 5 1 1 17 3 3 0 54
95638 31.31 1 2 0 0 1 0 1 1 6
95658 31.39 4 4 0 0 4 0 0 0 12
95648 31.5 43 13 0 0 11 0 1 0 68
95682 31.54 29 11 1 0 19 0 0 4 64
95258 32.7 1 0 0 0 1 0 0 0 2
95220 33.31 1 0 0 0 3 0 0 0 4
95672 33.35 5 1 0 0 4 0 0 1 11
95690 33.82 6 0 0 0 2 0 0 0 8
95241 34.04 0 0 0 0 1 0 0 0 1
95694 34.44 6 0 0 0 4 0 0 0 10
95603 34.71 13 0 0 0 7 0 0 0 20
95688 34.76 22 4 0 1 11 1 0 0 39
95604 34.79 1 0 0 0 0 0 0 0 1
95625 34.86 1 0 0 0 0 0 0 0 1
95669 35.82 1 0 0 0 0 0 0 0 1
95240 36.27 2 3 0 0 2 0 2 0 9
95698 36.76 0 0 0 0 1 0 0 0 1
95687 36.79 19 4 0 0 8 0 0 0 31
95640 38.86 2 2 0 0 1 0 1 1 7
95664 38.93 0 1 0 0 0 0 0 1 2
95242 39.04 14 1 0 0 5 0 1 0 21
95961 40.21 12 0 0 0 3 0 0 0 15
95212 40.86 4 4 0 0 1 0 1 0 10
95619 41.18 1 1 1 0 3 0 0 0 6
95703 41.57 2 0 0 0 0 0 0 0 2
95623 41.64 1 3 1 0 1 0 0 0 6
95667 41.7 19 6 0 0 14 0 0 1 40
95681 42.1 1 0 0 0 0 0 0 0 1
95602 42.12 3 8 0 0 4 0 3 0 18
95722 42.33 2 0 0 0 1 0 0 0 3
95991 42.52 4 2 0 0 3 0 4 0 13
95614 42.54 1 0 0 0 1 0 0 0 2
95210 43.44 3 1 0 0 0 0 0 0 4
95209 43.49 7 1 0 0 5 0 1 0 14
95651 43.5 1 0 0 0 0 0 0 0 1

31
95685 43.98 1 1 0 0 2 0 1 0 5
94533 44.51 12 0 0 0 4 0 0 0 16
95993 45.13 7 0 0 0 6 0 1 0 14
95627 45.29 0 0 0 0 1 0 0 0 1
95692 45.32 1 0 0 0 1 0 0 0 2
95205 45.57 0 0 0 0 1 0 0 0 1
95219 46.12 14 1 1 1 4 0 1 0 22
95629 46.52 1 0 0 0 1 0 0 0 2
95207 46.8 3 3 0 0 2 0 1 0 9
95642 47.2 1 0 0 0 0 0 0 0 1
95656 47.31 3 0 0 0 0 0 0 0 3
94534 47.32 10 0 0 0 3 0 0 0 13
95204 48.66 1 1 0 0 1 0 1 0 4
94571 49.23 0 0 0 1 0 0 0 0 1
95949 49.56 2 0 0 0 0 0 0 0 2
95709 49.81 0 1 0 0 0 0 1 0 2
95215 49.83 0 0 0 0 1 0 0 0 1
95713 50.35 2 0 0 0 3 0 0 0 5
94585 50.75 0 0 0 1 0 0 0 0 1
95912 51.11 0 0 0 0 1 0 0 0 1
95633 52.05 1 0 0 0 1 0 0 0 2
95901 52.16 8 0 0 0 2 0 0 0 10
95982 54.19 1 0 0 0 0 0 0 0 1
95206 54.52 1 0 0 0 0 0 0 0 1
95726 55.62 6 0 0 0 0 0 0 0 6
95336 55.87 5 0 0 0 1 0 0 0 6
94503 56.89 1 0 0 0 0 0 0 0 1
95606 56.93 1 0 0 0 0 0 0 0 1
94589 58.78 1 0 0 0 0 0 0 0 1
94590 59.4 1 0 0 0 0 0 0 0 1
95631 59.51 2 2 0 0 3 0 0 0 7
95634 59.54 1 0 1 0 1 0 0 0 3
94591 59.6 5 0 0 0 3 0 0 0 8
95330 59.95 0 1 0 0 0 0 1 0 2
95252 60.01 1 0 0 0 0 0 0 0 1
94510 61.09 2 0 1 0 0 0 0 0 3
95684 61.37 1 0 0 0 0 0 0 0 1
95948 61.72 0 1 0 0 0 0 1 0 2

32
94559 61.85 1 0 0 0 1 0 0 0 2
95337 61.92 2 0 0 0 0 0 0 0 2
95945 62.58 2 2 0 0 1 0 0 0 5
95366 62.78 2 0 0 0 0 0 0 0 2
95245 64.64 0 0 0 0 1 0 0 0 1
95320 65.02 1 0 0 0 0 0 0 0 1
95946 65.4 1 0 0 0 1 0 0 0 2
95918 66.12 0 0 0 0 2 0 0 0 2
95959 67 2 1 0 0 0 0 1 0 4
95917 67.03 1 0 0 0 0 0 0 0 1
94558 67.32 2 0 0 0 3 0 0 0 5
95987 67.77 1 0 0 0 0 0 0 0 1
95304 68.59 1 0 0 0 0 0 0 0 1
94509 68.73 3 0 0 0 0 0 0 0 3
94505 69.42 1 0 0 0 0 0 0 0 1
94531 69.47 2 0 0 0 0 0 0 0 2
95356 69.77 0 0 0 0 1 0 0 0 1
94553 69.95 2 0 0 0 0 0 0 0 2
95376 70.16 2 0 0 0 0 0 0 0 2
94523 70.17 1 0 0 0 0 1 0 0 2
95932 72.1 1 0 0 0 0 0 0 0 1
94597 72.19 2 0 0 0 0 0 0 0 2
94518 72.36 1 0 0 0 1 0 0 0 2
95962 72.94 0 1 1 0 1 0 0 0 3
95358 73.96 1 0 0 0 0 0 0 0 1
94521 74.15 0 0 0 1 0 0 0 0 1
94598 74.38 1 0 0 0 0 0 1 0 2
95351 75.05 2 0 0 0 0 0 0 0 2
94530 75.21 3 0 0 0 0 0 0 0 3
95355 75.52 1 0 0 0 1 0 0 0 2
94596 76.13 0 0 0 0 0 0 1 0 1
94706 77.14 0 0 0 0 0 0 1 0 1
95385 77.29 0 0 0 0 1 0 0 0 1
94945 77.38 0 0 0 0 1 0 0 0 1
94565 78.5 1 0 0 0 0 0 0 0 1
95391 78.57 2 0 0 0 0 0 0 0 2
94954 78.73 1 0 1 0 0 1 0 0 3
95361 78.89 2 0 0 0 0 0 0 0 2
33
95307 79.15 1 0 0 0 0 0 0 0 1
94703 80.19 1 0 0 0 0 1 0 0 2
94563 80.8 0 0 0 0 1 0 0 0 1
94583 85.47 1 0 0 0 0 0 0 0 1
94506 86.24 1 1 0 0 0 0 0 0 2
94602 86.4 0 0 0 0 1 0 0 0 1
95310 87.76 0 0 0 0 1 0 0 0 1
94103 88.57 1 0 0 0 0 0 0 0 1
94582 88.72 0 0 0 0 1 0 0 0 1
95988 88.83 1 0 0 0 0 0 0 0 1
94551 89.89 1 0 0 0 0 0 0 0 1
94117 90.83 0 1 0 0 0 0 0 0 1
95323 91.51 0 2 0 0 0 0 0 0 2
94568 91.56 1 0 0 0 0 0 0 0 1
95404 92.03 1 0 0 0 0 0 0 0 1
95926 92.14 2 0 0 0 1 0 0 0 3
95967 92.26 1 0 0 0 0 0 0 0 1
94131 92.51 0 0 0 0 1 0 0 0 1
94134 92.57 1 0 0 0 0 0 0 0 1
94941 92.82 0 0 0 0 2 0 0 0 2
94122 93.72 1 0 0 0 0 0 0 0 1
94928 93.96 1 0 0 0 0 0 0 0 1
94112 94.01 1 0 0 0 0 0 0 0 1
95728 94.59 1 0 0 0 0 0 0 0 1
95473 94.76 1 0 0 0 0 0 0 0 1
94578 95.04 1 0 0 0 0 0 0 0 1
96151 95.9 1 0 0 0 0 0 0 0 1
95472 96.52 0 0 0 0 1 0 0 0 1
94015 97.65 1 0 0 0 1 0 0 0 2
94080 98.42 1 0 0 0 1 0 0 0 2
96150 98.63 1 1 1 0 0 0 0 0 3
95973 99.53 1 0 0 0 0 0 0 0 1
95223 99.73 1 0 0 0 0 0 0 0 1
96158 99.92 1 0 0 0 0 0 0 0 1
95403 100.6 0 0 0 0 1 0 0 0 1
94545 101 1 0 0 0 0 0 0 0 1
94544 101.6 1 0 0 0 0 0 0 0 1
94066 102.1 1 0 0 0 0 0 0 0 1

34
94542 102.5 0 2 0 0 0 0 0 0 2
94030 102.6 1 0 0 0 0 0 0 0 1
96161 102.9 1 0 0 0 1 0 0 0 2
94010 104.4 1 0 0 0 0 0 0 0 1
95492 106.3 1 0 0 0 0 0 0 0 1
94539 106.4 0 1 0 0 0 0 0 0 1
94538 107.6 1 0 0 0 0 0 0 0 1
94536 108.1 1 0 0 0 0 0 0 0 1
95035 112.3 0 0 0 0 1 0 0 0 1
95348 112.4 1 0 0 0 0 0 0 0 1
95134 114.3 1 0 0 0 0 0 0 0 1
95341 115.1 2 0 0 0 0 0 0 0 2
95132 116.1 1 0 0 0 0 0 0 0 1
94019 116.5 1 0 0 0 0 0 0 0 1
94061 116.5 1 0 0 0 0 0 0 0 1
89450 119 1 0 0 0 0 0 0 0 1
94085 119.3 0 0 0 1 0 0 0 0 1
95128 121 1 0 0 0 0 0 0 0 1
95158 121.9 1 0 0 0 0 0 0 0 1
94043 122 1 0 0 0 0 0 0 0 1
95148 122.3 0 0 0 0 1 0 0 0 1
95008 124.9 0 1 0 0 0 0 0 0 1
95111 125.1 1 0 0 0 0 0 0 0 1
95014 126.5 2 0 0 0 0 0 0 0 2
95118 127.5 1 0 0 0 0 0 0 0 1
95120 131.5 0 1 0 0 0 0 0 0 1
89506 142.8 0 0 0 0 1 0 0 0 1
96122 151.5 1 0 0 0 0 0 0 0 1
96007 154.9 1 0 0 0 0 0 0 0 1
96002 161.1 1 0 0 0 0 0 0 0 1
96001 168 1 0 0 0 0 0 0 0 1
96003 170.3 3 0 0 0 0 0 0 0 3
95456 193.5 1 0 0 0 0 0 0 0 1
93927 216.8 1 0 0 0 0 0 0 0 1
95519 329.6 1 0 0 0 0 0 0 0 1
90049 380.9 0 0 0 0 1 0 0 0 1
90045 389.5 0 1 0 0 0 0 0 0 1
91803 391.7 0 1 0 0 0 0 0 0 1
35
90805 403 0 1 1 0 0 0 0 0 2
90620 407.4 1 0 0 0 0 0 0 0 1
91766 414.6 1 0 0 0 0 0 0 0 1
92604 425 1 0 0 0 0 0 0 0 1
92354 444.7 0 0 0 1 0 0 0 0 1
92130 490.3 0 0 0 0 1 0 0 0 1
92122 497 0 0 1 1 0 0 0 0 2
92128 505.8 1 0 0 0 0 0 0 0 1
80238 1184 0 0 1 0 0 0 0 0 1
80124 1201 1 0 0 0 0 0 0 0 1
60523 2032 0 0 0 0 1 0 0 0 1
60077 2053 1 0 0 0 0 0 0 0 1
49048 2182 0 0 0 1 0 0 0 0 1
44106 2383 0 0 0 1 0 0 0 0 1
30080 2469 1 0 0 0 0 0 0 0 1
20903 2728 1 0 0 0 0 0 0 0 1

36
10.6 A6: Binned Zip Code and Permit Data
0.5 57 135 75 5 30 4 2 5 313
1.9 161 128 139 37 91 7 0 7 570
2.3 147 75 100 13 118 2 1 6 462
3.4 18 10 13 14 9 0 0 4 68
6.4 416 56 54 38 150 1 2 22 739
8.4 556 55 21 25 287 2 0 28 974
13.2 992 108 27 37 601 14 6 36 1821
17.0 462 53 17 9 208 0 3 11 763
21.6 512 66 16 10 288 27 8 21 948
26.4 175 25 1 2 109 1 5 1 319
32.2 157 28 2 2 85 4 5 6 289
37.6 38 9 0 0 17 0 4 2 70
42.2 74 20 2 0 42 0 10 1 149
46.7 43 5 1 2 21 0 5 0 77
55.8 36 2 1 1 15 0 1 0 56
65.3 28 3 1 0 10 0 2 0 44
75.0 22 1 2 1 5 2 3 0 36
85.8 6 1 0 0 4 1 0 0 12
94.9 19 3 1 0 7 0 0 0 30