Community Risk Exposure to COVID-19 in Scotland€¦ · data is required on how exposed each...
23
Community Risk Exposure to COVID-19 in Scotland: Analysis and Strategy at the National Level Project leader Samuel MacKinnon Researcher Emma Macfarlane April 2020 Copyright Scotianomics Limited
Transcript of Community Risk Exposure to COVID-19 in Scotland€¦ · data is required on how exposed each...

1
Community Risk Exposure to COVID-19 in Scotland: Analysis and Strategy at the National Level
Project leader Samuel MacKinnon Researcher Emma Macfarlane April 2020 Copyright Scotianomics Limited

2
Contents3 About Scotianomics
4 Executive summary
5 Introduction
6 Caution
7 Methodology
7 Transmission probability
9 Fatality probability
10 Results
11 Analysis
14 Key conclusions and strategy
15 Appendix

3
About Scotianomics In the 21st century data is everywhere but it is the analysis that transforms data into valuable, actionable knowledge that is key to success.
Organisations, both in Scotland’s private and public sectors, lack access to useful, reliable data and value-added analysis of the kind that most advanced countries take for granted. This creates a hidden but real disadvantage for Scottish business, limits public policy and disrupts the pursuit of shared prosperity.
Scotianomics aims to spark a knowledge revolution and inform the decision makers on Scotland’s economy. We provide cutting-edge intelligence and strategic planning resources so that stakeholders can gain a wide view of the threats and opportunities in the world through our geopolitical, economic and policy analysis, unique historical datasets, risk and opportunity forecasts, Geographic Information System mapping solutions and strategic planning services.
Gordon MacIntyre-Kemp
Director

4
Executive summary• This report introduces a new dataset identifying the level of exposure to
COVID-19 in each of Scotland’s 354 council wards.
• The dataset is built using data concerning community economic and social connectivity as well as community health data.
• This data can be used by government, local government and health officials concerned with public resource allocation and containment, community stakeholders building resilience and local response measures and individuals, to inform their behaviour in particular localities.
• We conclude that government strategy should focus on ensuring that the geographic spread of high-risk regions remains small while national health resources should be concentrated on high-risk regions to have the most impact in tackling the virus.
• When the time is right, it should be possible for the Scottish Government to consider a staged reopening of the country, beginning firstly with low-risk areas. It must be pointed out that although some areas are currently identified as low risk areas, this should not imply that people in those low-risk areas should now begin to unilaterally relax their compliance with social distancing / lockdown rules, as this could transform their communities into high-risk areas.
• Defining when the time is right to lift restrictions on movement and commerce will depend on further risk threshold analysis and a review of the capacity of the Scottish NHS to cope with a potential second wave of infections. Other nations are ahead of Scotland in terms of the progression of COVID-19 in their communities and data from those nations, as they begin to ease their own restrictions, will therefore be key to the analysis.

5
IntroductionAs cases of COVID-19 and deaths related to the virus continue to rise in Scotland and as resources become increasingly stretched, the efficient allocation of those resources, for containment and treatment of people, is ever more essential. To achieve that, data is required on how exposed each community is in Scotland, to aid community stakeholders undertaking resilience measures and government officials managing state resources.
That is why we have created this resource, the COVID-19 Community Risks Index, which provides data for Scotland’s 354 local authority wards. It is an intelligence resource that can aid organisations formulating strategies to address the pandemic, but it can also inform and encourage individuals on appropriate behaviour to protect their local communities. Our findings should serve as a guide to strategies for containment and resource allocation.
This is the first version of the index. Using two components — transmission probability and potential for fatalities — it compares the risk exposure of Scotland’s council wards to the virus. As this is an early and experimental version, it will also be refined as the crisis unfolds, when new data/information becomes available.
Although this document provides the initial version of the index and a community comparison, users should consult the version on our website scotianomics.org as this will be updated as new information becomes available. This report will describe our methodologies and reasoning. However, because the virus moves so quickly, data will always be behind it. The data can and should be used to anticipate outcomes and to guide policy and resources allocation procedures.

6
CautionUsers of this data should be cautious. It is not a map of COVID-19 cases across Scotland and does not imply that some places necessarily have more cases than others. It is a map primarily of how easy the virus may spread in particular communities, due to their population, connectivity and economic characteristics.
This means that if an area that we have identified as high-risk currently has a low incidence of COVID-19 infections, we can predict that the propensity for the rapid spread of the disease in that area is higher than in others, especially if restrictions are lifted, either partially or in full.
These variables have the greatest weight in calculating the level of risk. Variables such as health and age structure also come into play: that is, the factors that determine how affected members of a community would be if they caught the virus. But these have a lesser weight as health issues matter less than the ability of the virus to spread.
The index is not built using data on the movement and behaviour of people during the virus, such as how seriously they have taken the lockdown; this data does not exist.
Most of the data used to construct this index, especially data related to connectivity, is taken from surveys published before the outbreak of the virus in Scotland. This is the most recent data available and is used to assume, depending on the levels of connectivity during the year of publishing, that these areas are still more connected today. This is a limitation, but it is one that cannot be overcome until new public data comes available on connectivity and the movement of people during the virus. Nonetheless, the index is still a reliable picture of how the COVID-19 virus and other future viruses may spread and the impact it can have across Scotland.
Users of the data in this report should be cautious. It is not a map of COVID-19 cases across Scotland and does not imply that some places necessarily have more cases than others.
The index is not built using data on the movement and behaviour of people during the virus, such as how seriously they have taken the lockdown; this data does not exist.

7
Methodology
Transmission probability Transmission probability refers to the ability of the virus to spread through human interaction. Several variables, each weighted to reflect their importance, are used to calculate this. They are listed in order of importance, with descriptions underneath.
Existing COVID-19 cases as a share of local population
Using an average taken from relevant NHS boards, we determine how exposed a community is to the virus already.1
Population density
We measure how many people live in a community by its total area. More compact populations are assumed to more effectively facilitate the spread of the virus. The population input data is sourced from the National Records of Scotland and the land area data from the Office for National Statistics.2
Accessibility
This measure uses the accessibility ranking from the Scottish Index for Multiple Deprivation, which measures how close members of a community are to essential services.3 While this includes health services, which a citizen may need to access sooner if they contract the virus, in this case better accessibility is assumed to facilitate the spread of the virus. This is because members of communities with greater accessibility are assumed to travel more and come into contact with one another more frequently.
1 Scottish Government (2020) ‘Coronavirus (COVID-19): Tests and Cases in Scotland’, Available Online: [https://www.gov.scot/publications/coronavirus-covid-19-tests-and-cases-in-scotland/?fbclid=IwAR0uHc-5MNfuMgmt47DH8DrtUPEXX6uTtqbv9AalWENZdF4M1I_5MJRlztJg].
2 National Records of Scotland (2020) ‘Electoral Ward Population Estimates’, Available Online: [https://www.nrscotland.gov.uk/statistics-and-data/statistics/statistics-by-theme/population/population-esti-mates/2011-based-special-area-population-estimates/electoral-ward-population-estimates]; Office for Na-tional Statistics (2020) ‘Wards Full Clipped Boundaries in Great Britain’, Available Online: [http://geoportal.statistics.gov.uk/datasets/07194e4507ae491488471c84b23a90f2_0].
3 Scottish Government (2020) ‘Scottish Index of Multiple Deprivation’, Available Online: [https://simd.scot/#/simd2020/BTTTFTT/9/-4.0000/55.9000/].
8
GDP per capita
Communities with higher GDP per capita are assumed to have more local economic activity, and thus more human interaction through trade. They are also assumed to trade more with people from outside their community — that is, importing and exporting with groups outside of their community, meaning there is greater potential for the virus to spread through the transportation or delivery of goods and services. The input data is sourced from the Office for National Statistics.4
Rail transport passengers relative to total population
Travellers on trains tend to be in close proximity to one another. Regions with greater numbers of travellers by rail are therefore assumed to be more at risk to the virus spreading. The data is sourced from Scottish Transport Statistics.5
Frequency of road travel
Road travel can be a more private mode of transport as community members may travel by car — although buses may be used. Nonetheless, more people travelling as a share of the population also means greater potential for the virus to spread. The data is sourced from Scottish Transport Statistics.6
Total population
Population size itself does not facilitate the spread of the virus, but the above factors combined with population size do. The data is produced by the National Records of Scotland.7
4 Office for National Statistics (2019) ‘Regional Gross Value Added (Balanced) Per Head and Income Compo-nents’, Available Online: [https://www.ons.gov.uk/economy/grossvalueaddedgva/datasets/nominalregional-grossvalueaddedbalancedperheadandincomecomponents].
5 Scottish Government (2018) ‘Scottish Transport Statistics – No 36 – Datasets: Chapter 7, Rail’, Available Online: [https://www.transport.gov.scot/publication/scottish-transport-statistics-no-36-datasets/].
6 Scottish Government (2018) ‘Scottish Transport Statistics – No 36 – Datasets: Chapter 5, Road Traffic’, Avail-able Online: [https://www.transport.gov.scot/publication/scottish-transport-statistics-no-36-datasets/].
7 National Records of Scotland (2020) ‘Electoral Ward Population Estimates’, Available Online: [https://www.nrscotland.gov.uk/statistics-and-data/statistics/statistics-by-theme/population/population-esti-mates/2011-based-special-area-population-estimates/electoral-ward-population-estimates].
9
Fatality probabilityPotential for fatalities refers to how many members of a community are at risk of death if they were to contract the virus. This is calculated using two variables, also ranked according to importance and with description underneath.
Existing community health issues
Analysis has shown that people with existing health issues are more likely to die as a result of catching the virus. We identify community health by using the Scottish Index of Multiple Deprivation’s health ranking.8
Community age structure
Analysis has also shown that older people are more likely to die from the virus. Thus, we calculate the probability of death of various age groups. Communities with older populations are more at risk of death if many of their members contracted the virus. Yet often older populations in Scotland are located in remote and peripheral regions. Therefore, they are also at less risk of catching it. The data is produced by the National Records of Scotland.9
Further research
Future publications of this index will offer more detailed analysis of the situation at the individual local authority level, offering recommendations to local governments on how to allocate their resources.
8 Scottish Government (2020) ‘Scottish Index of Multiple Deprivation’, Available Online: [https://simd.scot/#/simd2020/BTTTFTT/9/-4.0000/55.9000/].
9 National Records of Scotland (2020) ‘Electoral Ward Population Estimates’, Available Online: [https://www.nrscotland.gov.uk/statistics-and-data/statistics/statistics-by-theme/population/population-esti-mates/2011-based-special-area-population-estimates/electoral-ward-population-estimates].

10
ResultsTh e map below (Figure 1) summarises the distribution of risk across Scotland. Areas in red are the most at risk; areas in blue the least. Please note that “red” does not necessarily imply that the situation in an area has reached an extreme stage, that many people are dying or infected, or that the economy of that area has collapsed completely while other economies are functioning as normal.
Th e colours simply distinguish between particular levels of exposure. In a red area, it is more likely that it will be transmitted among a community’s population and/or that more members of that community are at risk of dying or demonstrating severe symptoms if they catch it.
Th e high-risk areas in red were likely to be high-risk even during the early stages of crisis when there was an insignifi cant number of cases across the country. However, a high-risk designation does imply that members of that community should be more cautious in their daily activities.
Figure 1. COVID-19 Community Risk Exposure Heatmap for Scotland
Th e map below (Figure 1) summarises the distribution of risk across Scotland. Areas in red are the most at risk; areas in blue the least. Please note that “red” does not necessarily imply that the situation in an area has reached an extreme stage, that many people are dying or infected, or that the economy of that area has collapsed completely while other economies are functioning as
Th e colours simply distinguish between particular levels of exposure. In a red area, it is more likely that it will be transmitted among a community’s population and/or that more members of that community are at risk of dying or demonstrating severe symptoms if they catch it.
Th e high-risk areas in red were likely to be high-risk even during the early stages of crisis when there was an insignifi cant number of cases across the country. However, a high-risk designation does imply that members of that
should be more
Community Risk Exposure Heatmap for Scotland
Lowest risk
Low risk
Medium risk
High risk
Highest risk

11
Analysis Th e purpose of this report is to introduce this resource and provide a national overview. Further publications will look more specifi cally at regional issues, breaking down each local authority area. But it is worth taking a brief look at some of the regional insights.
Figure 2. Inverclyde and Glasgow Regions
Most of the risk is concentrated in Scotland’s more densely populated urban areas. Particularly at risk are areas around the Clyde: these communities have high levels of connectivity and population density, while existing health issues are more frequent, relative to the rest of Scotland, among their members. Due to their high levels of connectivity and larger populations, they also have had more numbers of cases of the virus, meaning more chance that it will be spread.

12
Figure 3. Highlands and Islands and North East Regions
Scotland’s northern rural regions, such as the Highlands and Islands and the North East, are least at risk. While their older population structure means that many of their members are vulnerable to the virus in the sense that, if they were to catch it, they could die, there is less risk of the virus spreading among their communities due to decreased levels of connectivity and their geographically spread-out populations. Th e one exception to this is Shetland which early on had a high number of cases relative to its population. Th is may be due to Shetland’s increased contact with the rest of the UK as a result of the activities of the oil industry on the islands.

13
Figure 4. Regions Near the Scottish Borders
Regions south of the Central Belt also have higher levels of risk, as there is greater accessibility between them and the Central Belt, while they are also located at the bottleneck of Scotland’s international and domestic trade routes.

14
Key conclusions and strategy 1. Government strategy should focus on maintaining the current distribution of risk
across the country: that is, ensuring that low-risk areas remain low risk. By doing so, the crisis will be easier to manage, and resources will not become even more stretched.
2. To do this, public services such as the police and institutions concerned with transportation management should be used to contain the spread of the virus from high-risk urban areas to lower risk rural areas. This can be done through policies that manage flows of people at urban boundaries and thus need to be considered when travel restrictions are lifted and we enter a new potential stage of the virus’s transmission in Scotland.
3. Meanwhile, the government should continue to concentrate on directing national health resources toward those more populated areas with high levels of risk and where the cases are being contained. If the geographic spread of risk remains concentrated in high-population areas and the maximum possible national health resources are targeted at these areas, this will have a positive impact on the efficiency of the response at a national level. The virus may eventually reach all parts of Scotland but at different timescales, so as the pressure on resources in the most populous areas reduces, resources will become available to meet the needs of the areas that were less at risk and therefore benefited most from the lockdown and social distancing rules.
4. This data also suggests, when the virus begins to be brought under control, that a gradual, regionally staged opening up of the country and loosening of restrictions is a possibility. Lower risk regions could see restrictions loosened at a faster pace than high-risk regions. An example would be the staged reopening of schools and childcare facilities in low-risk areas or construction work being phased back in with appropriate social distancing protections in place. This is not to say that such relaxations of the rules should be imminent or that people living in low-risk regions should begin to go about their ordinary lives at this time, as this could turn their communities into high-risk regions. Rather, it must be controlled, done in parallel to a mass testing programme and only when the government feels the time is right, after further research to establish risk thresholds.

15
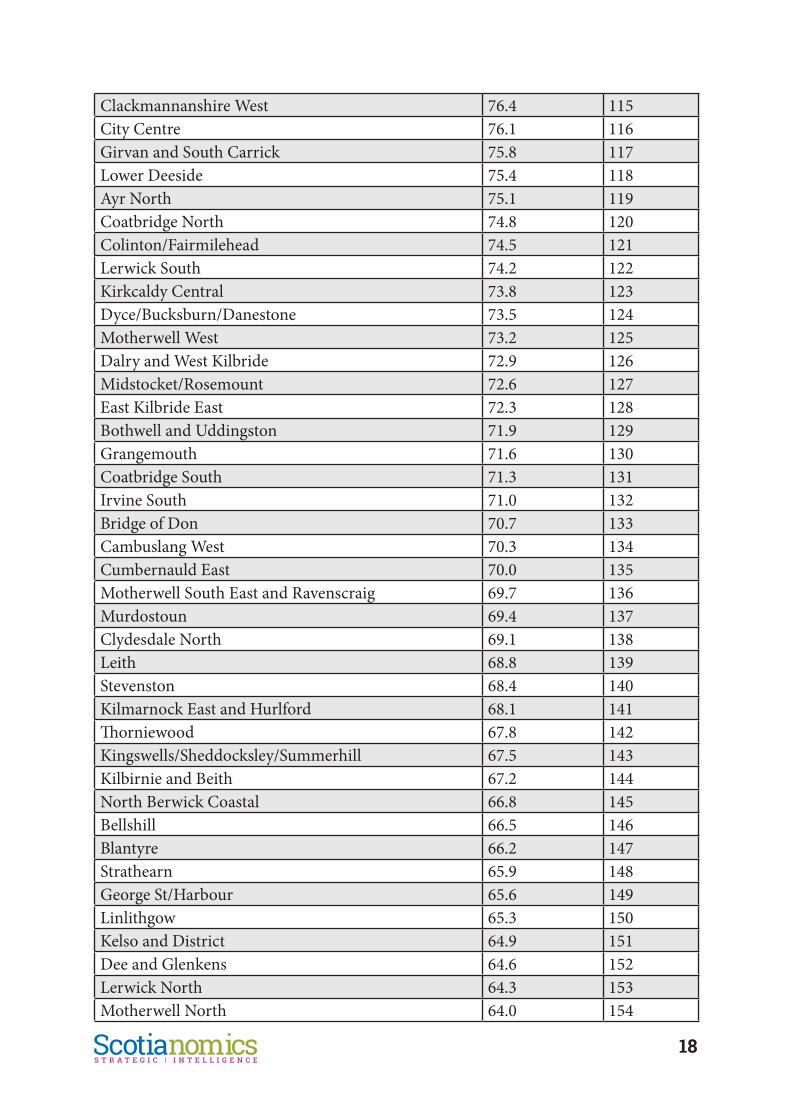
AppendixCOVID-19 Community Risk Rankings (Higher Scores are Worse)
Council Ward Risk Score Rank
Inverclyde North 112.7 1Inverclyde West 112.4 2Inverclyde East 112.0 3Inverclyde South 111.7 4Inverclyde East Central 111.4 5Clydebank Central 111.1 6Inverclyde Central 110.8 7Clydebank Waterfront 110.4 8Dumbarton 110.1 9Lomond 109.8 10Inverclyde South West 109.5 11Partick East/Kelvindale 109.2 12Kilpatrick 108.9 13Leven 108.5 14Langside 108.2 15Garscadden/Scotstounhill 107.9 16East Centre 107.6 17The Ferry 107.3 18Hillhead 106.9 19Giffnock and Thornliebank 106.6 20Cardonald 106.3 21Bearsden South 106.0 22Clarkston, Netherlee and Williamwood 105.7 23Southside Central 105.4 24Pollokshields 105.0 25Victoria Park 104.7 26Coldside 104.4 27Leith Walk 104.1 28Paisley Southeast 103.8 29Paisley Northeast and Ralston 103.4 30Drumchapel/Anniesland 103.1 31Shettleston 102.8 32Bearsden North 102.5 33Ayr West 102.2 34Maryhill 101.9 35

16
Bishopbriggs South 101.5 36Renfrew South and Gallowhill 101.2 37Linn 100.9 38Springburn/Robroyston 100.6 39Calton 100.3 40Newlands/Auldburn 99.9 41Greater Pollok 99.6 42Anderston/City/Yorkhill 99.3 43Erskine and Inchinnan 99.0 44North Coast and Cumbraes 98.7 45Baillieston 98.4 46Newton Mearns South and Eaglesham 98.0 47Milngavie 97.7 48Paisley Southwest 97.4 49East End 97.1 50Canal 96.8 51Govan 96.4 52Dennistoun 96.1 53Johnstone South and Elderslie 95.8 54Maryfield 95.5 55Hilton/Woodside/Stockethill 95.2 56Barrhead, Liboside and Uplawmoor 94.9 57Corstorphine/Murrayfield 94.5 58Renfrew North and Braehead 94.2 59Bonnyrigg 93.9 60Lochee 93.6 61Bishopbriggs North and Campsie 93.3 62Airyhall/Broomhill/Garthdee 92.9 63Johnstone North, Kilbarchan, Howwood and Lochwinnoch
92.6 64
Bishopton, Bridge of Weir and Langbank 92.3 65Lenzie and Kirkintilloch South 92.0 66Paisley East and Central 91.7 67Houston, Crosslee and Linwood 91.4 68Strathmartine 91.0 69Inverleith 90.7 70Newton Mearns North and Neilston 90.4 71Midlothian West 90.1 72East Kilbride Central South 89.8 73Penicuik 89.4 74

17
North East 89.1 75Kirkintilloch East and North and Twechar 88.8 76Paisley Northwest 88.5 77Morningside 88.2 78West End 87.8 79Troon 87.5 80East Kilbride Central North 87.2 81Midlothian East 86.9 82Forth 86.6 83Clackmannanshire North 86.3 84Northfield/Mastrick North 85.9 85Prestwick 85.6 86Ayr East 85.3 87Ardrossan and Arran 85.0 88Clackmannanshire South 84.7 89Craigentinny/Duddingston 84.3 90Southside/Newington 84.0 91Saltcoats 83.7 92Clackmannanshire Central 83.4 93Clackmannanshire East 83.1 94Rutherglen South 82.8 95North Isles 82.4 96Cumbernauld South 82.1 97North East 81.8 98Fountainbridge/Craiglockhart 81.5 99Coatbridge West 81.2 100Rutherglen Central and North 80.8 101Dalkeith 80.5 102Airdrie Central 80.2 103Hamilton South 79.9 104Sighthill/Gorgie 79.6 105Liberton/Gilmerton 79.3 106Irvine West 78.9 107Portobello/Craigmillar 78.6 108Midlothian South 78.3 109Drum Brae/Gyle 78.0 110Torry/Ferryhill 77.7 111Wishaw 77.3 112Hazlehead/Queens Cross/Countesswells 77.0 113Falkirk South 76.7 114
18
Clackmannanshire West 76.4 115City Centre 76.1 116Girvan and South Carrick 75.8 117Lower Deeside 75.4 118Ayr North 75.1 119Coatbridge North 74.8 120Colinton/Fairmilehead 74.5 121Lerwick South 74.2 122Kirkcaldy Central 73.8 123Dyce/Bucksburn/Danestone 73.5 124Motherwell West 73.2 125Dalry and West Kilbride 72.9 126Midstocket/Rosemount 72.6 127East Kilbride East 72.3 128Bothwell and Uddingston 71.9 129Grangemouth 71.6 130Coatbridge South 71.3 131Irvine South 71.0 132Bridge of Don 70.7 133Cambuslang West 70.3 134Cumbernauld East 70.0 135Motherwell South East and Ravenscraig 69.7 136Murdostoun 69.4 137Clydesdale North 69.1 138Leith 68.8 139Stevenston 68.4 140Kilmarnock East and Hurlford 68.1 141Thorniewood 67.8 142Kingswells/Sheddocksley/Summerhill 67.5 143Kilbirnie and Beith 67.2 144North Berwick Coastal 66.8 145Bellshill 66.5 146Blantyre 66.2 147Strathearn 65.9 148George St/Harbour 65.6 149Linlithgow 65.3 150Kelso and District 64.9 151Dee and Glenkens 64.6 152Lerwick North 64.3 153Motherwell North 64.0 154

19
Almond 63.7 155Blairgowrie and Glens 63.3 156Hamilton North and East 63.0 157Kincorth/Nigg/Cove 62.7 158Kilmarnock West and Crosshouse 62.4 159Perth City South 62.1 160Kilwinning 61.7 161Broxburn, Uphall and Winchburgh 61.4 162Whitburn and Blackburn 61.1 163Falkirk North 60.8 164Kyle 60.5 165Annandale East and Eskdale 60.2 166Tillydrone/Seaton/Old Aberdeen 59.8 167Highland 59.5 168East Neuk and Landward 59.2 169Clydesdale South 58.9 170Monifieth and Sidlaw 58.6 171Cowal 58.2 172Pentland Hills 57.9 173Maybole, North Carrick and Coylton 57.6 174Airdrie South 57.3 175Larkhall 57.0 176Strathmore 56.7 177Stepps, Chryston and Muirhead 56.3 178Kilsyth 56.0 179Kirkcaldy North 55.7 180Fortissat 55.4 181Lower Braes 55.1 182Annandale North 54.7 183Livingston North 54.4 184Hawick and Hermitage 54.1 185Mid Galloway and Wigtown West 53.8 186Cupar 53.5 187East Kilbride South 53.2 188Shetland South 52.8 189Livingston South 52.5 190Castle Douglas and Crocketford 52.2 191Ballochmyle 51.9 192Bo’ness and Blackness 51.6 193Fauldhouse and the Breich Valley 51.2 194

20
Cumbernauld North 50.9 195Abbey 50.6 196Kilmarnock South 50.3 197Mossend and Holytown 50.0 198Shetland West 49.7 199Leven, Kennoway and Largo 49.3 200Clydesdale East 49.0 201Shetland Central 48.7 202Avondale and Stonehouse 48.4 203Stranraer and the Rhins 48.1 204Helensburgh Central 47.7 205Clydesdale West 47.4 206Elgin City North 47.1 207Forfar and District 46.8 208Cumnock and New Cumnock 46.5 209Bathgate 46.2 210Shetland North 45.8 211Kirkcaldy East 45.5 212Jedburgh and District 45.2 213Arbroath West, Letham and Friockheim 44.9 214Armadale and Blackridge 44.6 215Irvine East 44.2 216Keith and Cullen 43.9 217Dunfermline North 43.6 218Perth City Centre 43.3 219Airdrie North 43.0 220East Livingston and East Calder 42.7 221Irvine Valley 42.3 222Isle of Bute 42.0 223Bonnybridge and Larbert 41.7 224North West Dumfries 41.4 225Mid Berwickshire 41.1 226Annick 40.7 227Selkirkshire 40.4 228Nith 40.1 229Musselburgh 39.8 230Carnoustie and District 39.5 231Buckie 39.2 232Mid and Upper Nithsdale 38.8 233Denny and Banknock 38.5 234

21
Carse, Kinnaird and Tryst 38.2 235Doon Valley 37.9 236Speyside Glenlivet 37.6 237Forres 37.2 238Brechin and Edzell 36.9 239Howe of Fife and Tay Coast 36.6 240East Sutherland and Edderton 36.3 241Inverkeithing and Dalgety Bay 36.0 242Montrose and District 35.6 243Kirriemuir and Dean 35.3 244Strathallan 35.0 245Hamilton West and Earnock 34.7 246Buckhaven, Methil and Wemyss Villages 34.4 247Stirling West 34.1 248Annandale South 33.7 249East Berwickshire 33.4 250Burntisland, Kinghorn and Western Kirkcaldy 33.1 251Forth and Endrick 32.8 252East Kilbride West 32.5 253Haddington and Lammermuir 32.1 254Cowdenbeath 31.8 255Glenrothes North, Leslie and Markinch 31.5 256Elgin City South 31.2 257Kilmarnock North 30.9 258Tweeddale West 30.6 259Steòrnabhagh a Deas 30.2 260Gartcosh, Glenboig and Moodiesburn 29.9 261Fochabers Lhanbryde 29.6 262Leaderdale and Melrose 29.3 263Preston, Seton and Gosford 29.0 264South Kintyre 28.6 265Strathtay 28.3 266Hawick and Denholm 28.0 267Upper Braes 27.7 268Kinross-shire 27.4 269Trossachs and Teith 27.1 270Dunblane and Bridge of Allan 26.7 271Glenrothes Central and Thornton 26.4 272Tay Bridgehead 26.1 273Inverness Central 25.8 274

22
Dunoon 25.5 275Tweeddale East 25.1 276Lochgelly, Cardenden and Benarty 24.8 277West Fife and Coastal Villages 24.5 278Dunfermline South 24.2 279Dunfermline Central 23.9 280Lochar 23.6 281Glenrothes West and Kinglassie 23.2 282Perth City North 22.9 283Kintyre and the Islands 22.6 284Stirling East 22.3 285Dunbar and East Linton 22.0 286Na Hearadh agus Ceann a Deas nan Loch 21.6 287Wester Ross, Strathpeffer and Lochalsh 21.3 288Arbroath East and Lunan 21.0 289Sgir’Uige agus Ceann a Tuath nan Loch 20.7 290St Andrews 20.4 291North, West and Central Sutherland 20.1 292Heldon and Laich 19.7 293Rosyth 19.4 294Cambuslang East 19.1 295An Taobh Siar agus Nis 18.8 296Nairn and Cawdor 18.5 297Oban North and Lorn 18.1 298Galashiels and District 17.8 299Almond and Earn 17.5 300Tranent, Wallyford and Macmerry 17.2 301Carse of Gowrie 16.9 302Thurso and Northwest Caithness 16.6 303Mid Argyll 16.2 304Tain and Easter Ross 15.9 305Bannockburn 15.6 306Black Isle 15.3 307North Isles 15.0 308Inverness West 14.6 309Inverness Ness-side 14.3 310Inverness Millburn 14.0 311Eilean á Chèo 13.7 312Badenoch and Strathspey 13.4 313Barraigh, Bhatarsaigh, Eirisgeigh agus Uibhist a Deas 13.1 314

23
Helensburgh and Lomond South 12.7 315Stromness and South Isles 12.4 316Aird and Loch Ness 12.1 317Aboyne, Upper Deeside and Donside 11.8 318Wick and East Caithness 11.5 319Dingwall and Seaforth 11.1 320Oban South and the Isles 10.8 321Beinn na Foghla agus Uibhist a Tuath 10.5 322Stirling North 10.2 323Caol and Mallaig 9.9 324Banff and District 9.5 325Fort William and Ardnamurchan 9.2 326Banchory and Mid Deeside 8.9 327Sgire an Rubha 8.6 328Huntly, Strathbogie and Howe of Alford 8.3 329Cromarty Firth 8.0 330Steòrnabhagh a Tuath 7.6 331West Mainland 7.3 332Stonehaven and Lower Deeside 7.0 333Lomond North 6.7 334Inverurie and District 6.4 335Culloden and Ardersier 6.0 336Fraserburgh and District 5.7 337Kirkwall East 5.4 338Turriff and District 5.1 339Peterhead North and Rattray 4.8 340Loch a Tuath 4.5 341Ellon and District 4.1 342Troup 3.8 343Kirkwall West and Orphir 3.5 344Central Buchan 3.2 345Peterhead South and Cruden 2.9 346East Mainland, South Ronaldsay and Burray 2.5 347West Garioch 2.2 348Mearns 1.9 349Inverness South 1.6 350Westhill and District 1.3 351Mid Formartine 1.0 352North Kincardine 0.6 353East Garioch 0.3 354