Community Medical Center Market, Utilization, and...
70
Community Medical Center – Market, Utilization, and Financial Projections – Discussion Draft Coast Life Support District Gualala, California December 17, 2013
Transcript of Community Medical Center Market, Utilization, and...

Community Medical Center – Market,
Utilization, and Financial Projections –
Discussion Draft
Coast Life Support District
Gualala, California
December 17, 2013

THE CAMDEN GROUP | 12/17/2013 | DISCUSSION DRAFT 1
Table of Contents
Page
Background 2
Licensing and Regulatory Requirements 5
Market and Volume Projections 9
Financial Projections 33
Recommendations 48
Appendices:
A. Terms
B. Emergency Medical Services Requirements
C. Financial Assumption Detail

Background

THE CAMDEN GROUP | 12/17/2013 | DISCUSSION DRAFT 3
On October 29 and 30, 2013, The Camden Group met with
the Engagement Task Force, which includes members from
Coast Life Support District (“CLSD” or “Coast Life”), Redwood
Coast Medical Services (“RCMS”), and the community, to
review the service area’s Situation Assessment, and to
identify options for a financially sustainable healthcare model.
At the conclusion of the meeting, the following options were
identified to explore further:
Option 1: Expand urgent care hours (a preliminary financial
analysis for this option was completed prior to the October 29,
2013 meeting)
Option 2: Build a community medical center (less than 25 beds)
with a 24/7 emergency room
Option 3: Develop a robust ambulatory services strategy
Background

THE CAMDEN GROUP | 12/17/2013 | DISCUSSION DRAFT 4
This document presents utilization and financial projections
associated with building a community medical center (less than
25 beds) with a 24/7 emergency room.
Background
Licensing and Regulatory Requirements

THE CAMDEN GROUP | 12/17/2013 | DISCUSSION DRAFT 6
California Licensing Regulations C
om
mu
nit
y M
ed
ical C
en
ter
Req
uir
em
en
ts
General acute care hospitals are required to provide eight essential
services:
Medical services
Nursing
Surgical
Anesthesia
Minimum registered nurse (“RN”) staffing ratios:
Critical care - 1:2
Emergency department (“ED”) - 1:4
Medical/Surgical - 1:5
Post-anesthesia - 1:2
Hospital must have at least one operating room to support 25 or fewer
licensed beds.
Laboratory
Radiology
Pharmacy
Dietary
Step-down – 1:3
Telemetry – 1:4
No fewer than two RNs
physically present per unit

THE CAMDEN GROUP | 12/17/2013 | DISCUSSION DRAFT 7
Critical Access Designation Requirements C
riti
cal A
ccess D
esig
nati
on
Req
uir
em
en
ts Be located more than a 35-mile drive from the nearest hospital or more than
a 15-mile drive in areas with mountainous terrain or other secondary roads.
Provide no more than 25 inpatient acute care beds.
Beds can be used as inpatient or swing
Hospital can also operate a distinct part rehabilitation or psychiatric unit,
each with up to ten beds.
Furnish 24/7 emergency care services, using on-site or on-call staff.
Have an ALOS of 96 hours or less per patient for acute care.
Excludes patients in swing beds or beds within a distinct part unit
Medicare pays 101 percent of reasonable patient costs.
Typically takes 12 to 18 months to receive critical access designation from
submission of application.
THE CAMDEN GROUP | 12/17/2013 | DISCUSSION DRAFT 8
California Licensing Regulations D
isti
nct
Part
Skil
led
Nu
rsin
g F
acil
ity
Req
uir
em
en
ts
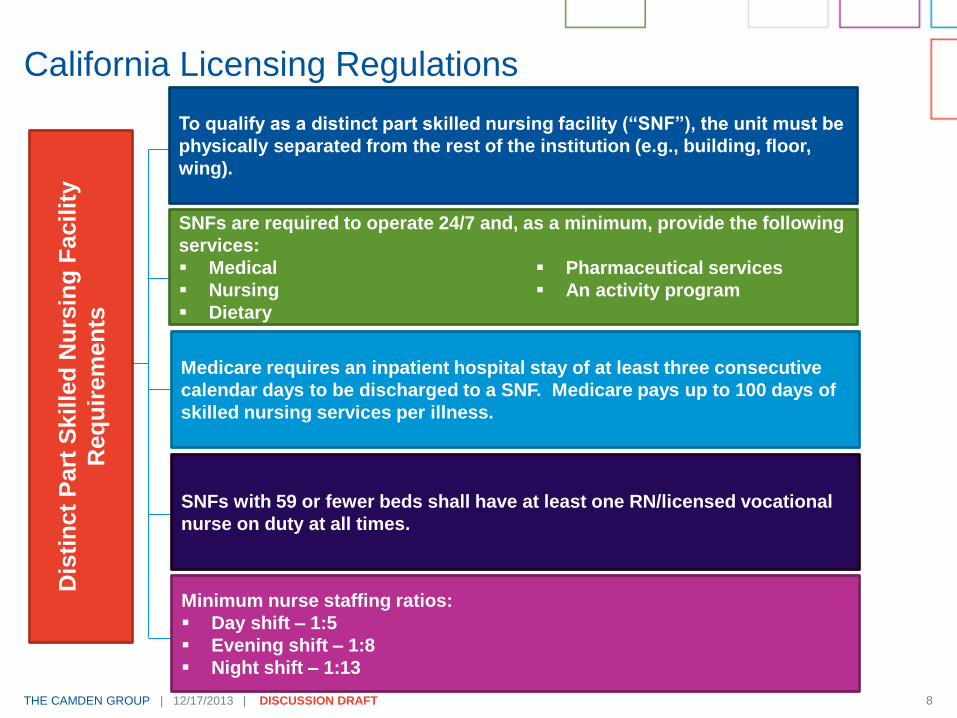
To qualify as a distinct part skilled nursing facility (“SNF”), the unit must be
physically separated from the rest of the institution (e.g., building, floor,
wing).
SNFs are required to operate 24/7 and, as a minimum, provide the following
services:
Medical
Nursing
Dietary
Medicare requires an inpatient hospital stay of at least three consecutive
calendar days to be discharged to a SNF. Medicare pays up to 100 days of
skilled nursing services per illness.
Pharmaceutical services
An activity program
SNFs with 59 or fewer beds shall have at least one RN/licensed vocational
nurse on duty at all times.
Minimum nurse staffing ratios:
Day shift – 1:5
Evening shift – 1:8
Night shift – 1:13

Market and Volume Projections

THE CAMDEN GROUP | 12/17/2013 | DISCUSSION DRAFT 10
The service area (shown on the following page) was defined at
the engagement kick-off meeting on September 10, 2013. It was
used to develop the utilization and financial projections for the
community medical center.
Population and Demographics

THE CAMDEN GROUP | 12/17/2013 | DISCUSSION DRAFT 11
Service Area Map Area Hospitals Mendocino Coast District Hospital
(49 beds)
59.6 miles driving (98 min. drive time)
47.6 miles direct
Ukiah Valley Medical Center (78 beds)
65.9 miles driving (122 min. drive time)
31.5 miles direct
Healdsburg District Hospital (26 beds)
69.9 miles driving (131 min. drive time)
27.3 miles direct
Kaiser Foundation Hospital – Santa
Rosa (173 beds)
79.8 miles driving (140 min. drive time)
48.1 miles direct
Sutter Medical Center of Santa Rosa
(135 beds)
80.8 miles driving (142 min. drive time)
48.3 miles direct
Santa Rosa Memorial Hospital –
Montgomery (278 beds)
82.8 miles driving (144 min. drive time)
49.7 miles direct
Frank R. Howard Memorial Hospital
(25 beds)
87.4 miles driving (143 min. drive time)
44.4 miles direct
Palm Drive Hospital (37 beds)
75.5 miles driving (138 min. drive time)
46.0 miles direct
1
2
3
4
5
6
7
1
7
2
3
4 5
6
Gualala
Boonville
Geyserville
Guernville
Elk
Manchester
Sea Ranch
Stewart’s Point
Albion
Yorkville
Duncans Mills
Source: The Camden Group
Note: Beds represents licensed acute care beds.
8
Area Hospitals Mendocino Coast District Hospital
(49 beds)
59.6 miles driving (98 min. drive time)
47.6 miles direct
Ukiah Valley Medical Center (78 beds)
65.9 miles driving (122 min. drive time)
31.5 miles direct
Healdsburg District Hospital (26 beds)
69.9 miles driving (131 min. drive time)
27.3 miles direct
Kaiser Foundation Hospital – Santa
Rosa (173 beds)
79.8 miles driving (140 min. drive time)
48.1 miles direct
Sutter Medical Center of Santa Rosa
(135 beds)
80.8 miles driving (142 min. drive time)
48.3 miles direct
Santa Rosa Memorial Hospital –
Montgomery (278 beds)
82.8 miles driving (144 min. drive time)
49.7 miles direct
Frank R. Howard Memorial Hospital
(25 beds)
87.4 miles driving (143 min. drive time)
44.4 miles direct
8
Denotes overlap between
Cazadero and Jenner ZIP
Codes with the Timber Cove
census defined place. This
analysis estimates population
and inpatient and outpatient
volume to reflect 29.5 percent
of both ZIP Codes.

THE CAMDEN GROUP | 12/17/2013 | DISCUSSION DRAFT 12
Per discussions with the Engagement Task Force, population estimates based on the school districts were determined to be the most accurate. The population will be held flat at 2010 levels as there has not been growth in the area.
Information provided by CLSD shows seasonal population varies from 760 – 3,000 depending on the time of year. A weighted average was applied to estimate the average increase in the population on an annual basis (~1,400 residents). This incremental population would affect urgent care and ED the most.
Service Area Population Profile
Coast Life Support District
Calendar Year 2010
Estimated 2010
Age Cohort (Years) CAGR(1) Number
Percent
of Total
Service Area
0 - 14 0.9% 769 12.4%
15 - 44 0.5% 1,576 25.4%
45 - 64 -0.8% 2,358 38.1%
65 + 4.4% 1,491 24.1%
Total 1.2% 6,194 100.0%
Women 15 - 44 0.6% 727 11.7%
Median Age 0.5% 54.5
California
0 - 14 0.6% 7,580,558 20.3%
15 - 44 0.1% 16,113,601 43.2%
45 - 64 1.0% 9,380,347 25.2%
65 + 3.3% 4,200,171 11.3%
Total 0.8% 37,274,677 100.0%
Women 15 - 44 0.0% 7,891,481 21.2%
Median Age 0.6% 35.2
Source: Claritas, Inc.
Service Area reflects the total population from Primary Service Area,
Secondary Service Area North, and 29.5 percent of the population from
Secondary Service Area South.
Service Area versus the State of California - Population by Age
Cohort
Clients/Coast_Life_Support_District /Business_Plan_2013/Planning/Claritas/[Pop_by_Age_and_Sex
_CLSD.xlsx]Pop Table
THE CAMDEN GROUP | 12/17/2013 | DISCUSSION DRAFT 13
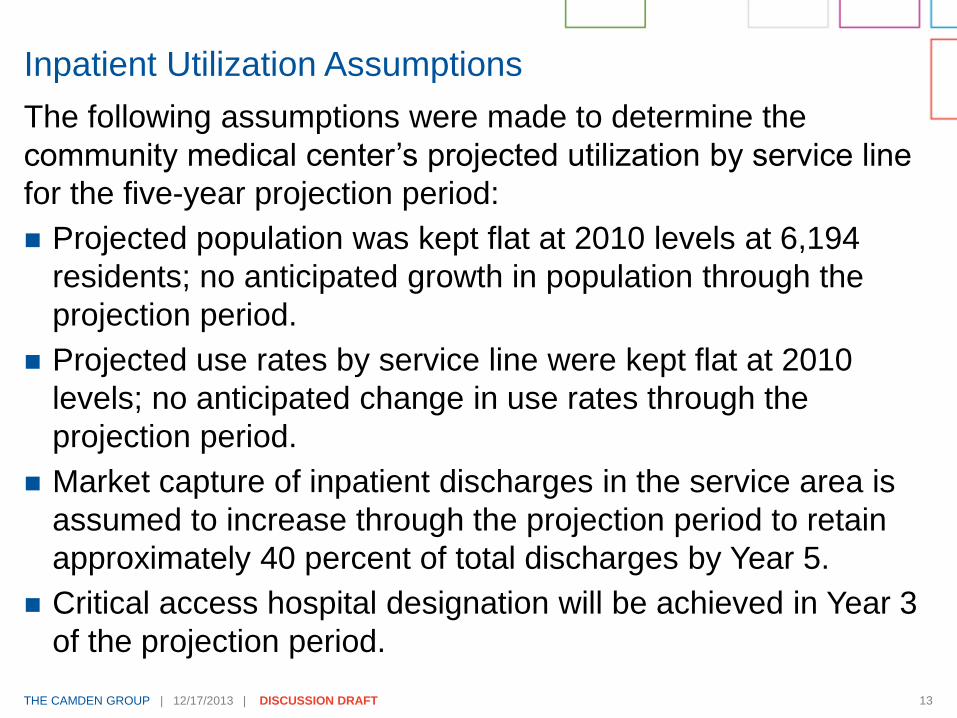
The following assumptions were made to determine the
community medical center’s projected utilization by service line
for the five-year projection period:
Projected population was kept flat at 2010 levels at 6,194
residents; no anticipated growth in population through the
projection period.
Projected use rates by service line were kept flat at 2010
levels; no anticipated change in use rates through the
projection period.
Market capture of inpatient discharges in the service area is
assumed to increase through the projection period to retain
approximately 40 percent of total discharges by Year 5.
Critical access hospital designation will be achieved in Year 3
of the projection period.
Inpatient Utilization Assumptions
THE CAMDEN GROUP | 12/17/2013 | DISCUSSION DRAFT 14
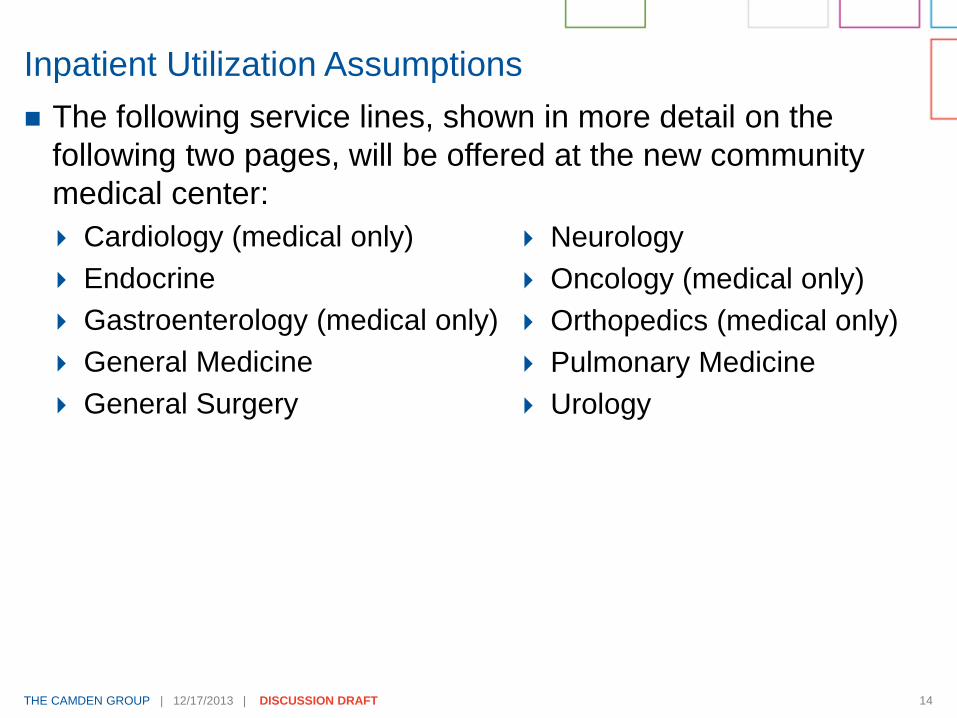
The following service lines, shown in more detail on the
following two pages, will be offered at the new community
medical center:
Cardiology (medical only)
Endocrine
Gastroenterology (medical only)
General Medicine
General Surgery
Inpatient Utilization Assumptions
Neurology
Oncology (medical only)
Orthopedics (medical only)
Pulmonary Medicine
Urology

THE CAMDEN GROUP | 12/17/2013 | DISCUSSION DRAFT 15
Inpatient Utilization Assumptions Coast Life Support District
Opportunity for Retained Inpatient Volume
Calendar Year 2011
Target Volume 100 Percent Potential Target Volume
Service Line Patient Days
Average Daily
Census
Cardiology - Diagnostic/Interventional No 0 14 0 0 0 0 0.0
Cardiology - Medical Potentially 3 21 0 0 24 71 0.2
Cardiology - Surgery No 0 8 0 0 0 0 0.0
Chemical Dependency No 1 0 0 1 0 0 0.0
Endocrine Potentially 2 1 1 0 4 18 0.1
ENT No 0 2 1 0 0 0 0.0
Gastroenterology Potentially 8 18 3 2 30 164 0.4
General Medicine Potentially 3 8 4 2 17 100 0.3
General Surgery Potentially 9 15 2 2 28 191 0.5
Gynecology No 3 4 2 0 0 0 0.0
Neonatal Intensive Care No 1 5 2 0 0 0 0.0
Neurology Potentially 3 11 2 0 16 54 0.1
Neurosurgery No 0 3 0 0 0 0 0.0
Obstetrics & Deliveries No 9 21 12 0 0 0 0.0
Oncology (Medical) Potentially 4 4 0 0 8 23 0.1
Ophthalmology No Cases 0 0 0 0 0 0 0.0
Orthopedics Potentially 8 31 0 1 40 131 0.4
Plastic Surgery No Cases 0 0 0 0 0 0 0.0
Psychiatry No Cases 0 0 0 0 0 0 0.0
Pulmonary Medicine Potentially 15 21 3 1 41 183 0.5
Rehabilitation No Cases 0 0 0 0 0 0 0.0
Spine Surgery No 0 1 0 1 0 0 0.0
Thoracic & Vascular Surgery No 0 9 0 0 0 0 0.0
Transplant No Cases 0 0 0 0 0 0 0.0
Urology Potentially 0 7 1 0 8 27 0.1
Total 69 204 33 10 215 962 2.6
Average Length-of-Stay 4.5
Clients/Coast_Life_Support_District /Business_Plan_2013/Planning/[CLSD_Assessment_Tables.xlsx]Opportunity
Source: OSHPD Inpatient Discharge Database, 2011
Notes: Service lines defined by The Camden Group; excludes normal new borns (MS-DRG 795). Includes acute care only.
(1) "No Cases" indicates no volume in the service area for that service line in calendar year 2011; "No" denotes service line w ill not be provided at the new community medical center
Santa Rosa Hospitals include Santa Rosa Memorial Hospital - Montgomery and Sutter Medical Center of Santa Rosa
Ukiah Valley
Medical
Center
Santa Rosa
Hospitals
Potential to
Retain
Market
Volume (1)
Discharges
Mendocino
Coast District
Hospital
Palm Drive
Hospital

THE CAMDEN GROUP | 12/17/2013 | DISCUSSION DRAFT 16
Inpatient Utilization Assumptions Coast Life Support District
Service Area Opportunity for Retained Inpatient Volume - Market Share Sensitivity Analysis
Calendar Year 2011
Market Share Range Scenarios Resultant Discharges
Service Line
Cardiology - Medical 26 24 45.0% 60.0% 75.0% 11 14 18
Endocrine 5 4 35.0% 50.0% 65.0% 2 2 3
Gastroenterology 33 30 40.0% 55.0% 70.0% 12 17 21
General Medicine 24 17 45.0% 60.0% 75.0% 8 10 13
General Surgery 37 28 35.0% 50.0% 65.0% 10 14 18
Neurology 18 16 35.0% 50.0% 65.0% 5 8 10
Oncology (Medical) 16 8 20.0% 35.0% 50.0% 2 3 4
Orthopedics 50 40 25.0% 40.0% 55.0% 10 16 22
Pulmonary Medicine 42 41 50.0% 65.0% 80.0% 20 26 33
Urology 9 8 25.0% 40.0% 55.0% 2 3 4
Volume from other Service Lines 115 0
Total 374 215 81 114 146
57.5% 21.7% 30.5% 39.0%
Patient Days 962 370 514 658
Average Length-of-Stay 4.5 4.5 4.5 4.5
Average Daily Census 2.6 1.0 1.4 1.8
Bed Need At 80% Occupancy 4.0 2.0 2.0 3.0
Clients/Coast_Life_Support_District /Business_Plan_2013/Planning/[CLSD_Assessment_Tables.xlsx]Opportunity (2)
Notes: Service lines defined by The Camden Group; excludes normal new borns (MS-DRG 795). Includes acute care only.
Total Service
Area Inpatient
Discharges
Sources: OSHPD Inpatient Discharge Database, 2011, and The Camden Group
Coast Life
Potential
Retained
Inpatient
Discharges Low Medium HighMedium HighLow
Overall Market Share for Target Areas

THE CAMDEN GROUP | 12/17/2013 | DISCUSSION DRAFT 17
In order to treat patients locally and have physicians available
for emergency consults, significant subsidies would be
required to attract and retain physicians in the area, as shown
in the table on the following page.
This could be an understatement, as it is assumed that 100
percent of patient volume would not stay in the service area.
Subsidies could take the form of ED on-call, relocation expense,
income guarantee, medical directorships or other contractual
arrangements.
Estimated Physician Subsidies

THE CAMDEN GROUP | 12/17/2013 | DISCUSSION DRAFT 18
Estimated Physician Subsidies
Coast Life Support District
Estimated Physician Subsidy Analysis
Calendar Year 2011
Specialty
Physician
Need (1)
MGMA Median
Physician
Compensation
Assumed
Physician Full-
Time Equivalents
("FTE")
Estimated
Annual
Physician
Subsidy (2)
Cardiology - Medical 0.21 $432,620 1.0 $340,966
Endocrine 0.05 232,965 1.0 220,353
Gastroenterology 0.17 494,853 1.0 408,856
General Surgery 0.62 351,509 1.0 133,784
Neurology 0.15 264,469 1.0 225,659
Oncology (Medical) 0.24 385,283 1.0 293,259
Orthopedics 0.40 562,594 1.0 335,723
Pulmonary Medicine 0.10 341,119 1.0 308,402
Urology 0.22 400,000 1.0 313,644
Emergency Medicine (3)
0.38 334,398 3.0 620,854
Certified Registered Nurse Anesthetist (4)
0.62 152,146 1.0 57,907
Total 13.0 $3,259,407
Clients/Coast_Life_Support_District /Business_Plan_2013/Planning/[CLSD_Assessment_Tables.xlsx]M D Subsidies
(1) Based on total service area population of 6,194 residents.
(4) Service area physician need assumed to be equivalent to general surgery
Sources: GMENAC 1990; Merritt, Haw kins & Assoc. 2002; Claritas, Inc., MGMA Physician Compensation and Production Survey: 2013
Based on 2012 Data (Western Geography), and The Camden Group
(2) Assuming 1.0 full-time physician available locally (assuming 3.0 full-time physicians specif ic to emergency medicine).
(3) Physician need reflects a ratio of service area emergency department visits projected by Year 5 to median MGMA emergency
medicine hospital encounters.
THE CAMDEN GROUP | 12/17/2013 | DISCUSSION DRAFT 19
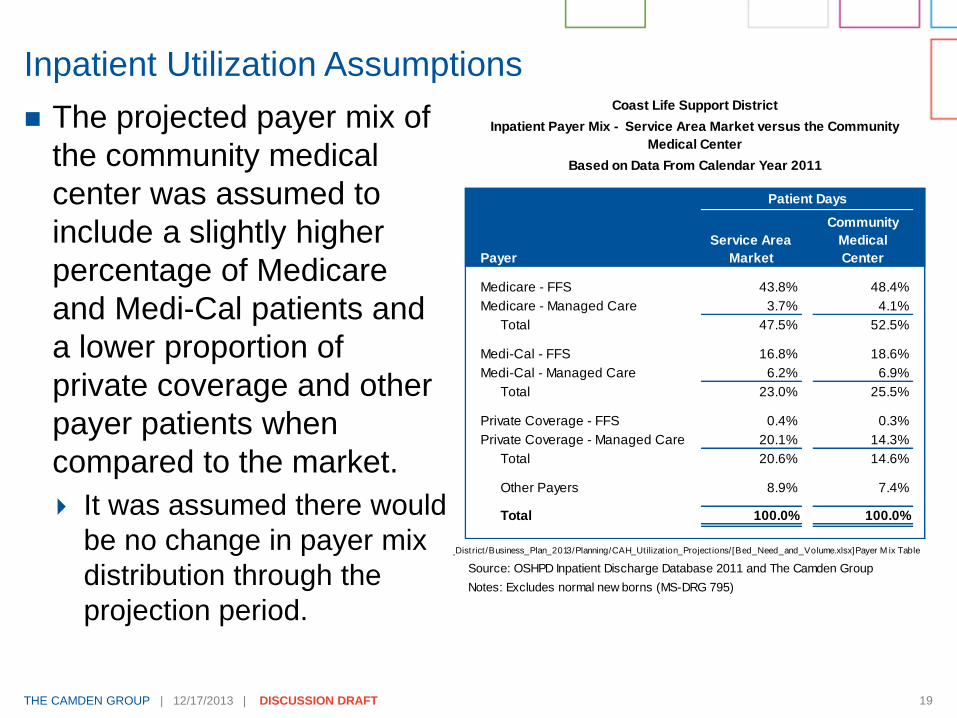
Inpatient Utilization Assumptions Coast Life Support District
Based on Data From Calendar Year 2011
Patient Days
Payer
Service Area
Market
Community
Medical
Center
Medicare - FFS 43.8% 48.4%
Medicare - Managed Care 3.7% 4.1%
Total 47.5% 52.5%
Medi-Cal - FFS 16.8% 18.6%
Medi-Cal - Managed Care 6.2% 6.9%
Total 23.0% 25.5%
Private Coverage - FFS 0.4% 0.3%
Private Coverage - Managed Care 20.1% 14.3%
Total 20.6% 14.6%
Other Payers 8.9% 7.4%
Total 100.0% 100.0%
Clients/Coast_Life_Support_District/Business_Plan_2013/Planning/CAH_Utilizat ion_Project ions/[Bed_Need_and_Volume.xlsx]Payer M ix Table
Source: OSHPD Inpatient Discharge Database 2011 and The Camden Group
Notes: Excludes normal new borns (MS-DRG 795)
Inpatient Payer Mix - Service Area Market versus the Community
Medical Center
The projected payer mix of
the community medical
center was assumed to
include a slightly higher
percentage of Medicare
and Medi-Cal patients and
a lower proportion of
private coverage and other
payer patients when
compared to the market.
It was assumed there would
be no change in payer mix
distribution through the
projection period.

THE CAMDEN GROUP | 12/17/2013 | DISCUSSION DRAFT 20
Inpatient acute care ALOS at the community medical center
was reduced from the market ALOS of 4.6 days down to 4.0
days to meet Critical Access Hospital designation
requirements, and because higher acuity patients, requiring
longer stays in a hospital bed, were assumed to continue to
migrate outside of the service area for care.
Inmigration of inpatient hospital services was assumed to be
zero.
Swing bed projections were based on hospital inpatients
categorized as skilled nursing type of care. Swing beds can
be used for acute care patients or skilled nursing patients.
Due to low projected volume of acute care patients, it is
assumed that the patient volume utilizing the swing beds will
be primarily skilled nursing patients.
Inpatient Utilization Assumptions

THE CAMDEN GROUP | 12/17/2013 | DISCUSSION DRAFT 21
Coast Life Support District
Community Medical Center - Inpatient Medical/Surgical Bed Need
Year 1 - Year 5
Projected Year
Medical/Surgical Beds 1 2 3 4 5
Discharges 81 97 123 136 147
Patient Days 324 391 494 546 588
Average Length-of-Stay 4.0 4.0 4.0 4.0 4.0
Average Daily Census 0.9 1.1 1.4 1.5 1.6
Bed Need at 70 Percent Functional Occupancy 2.0 2.0 2.0 3.0 3.0
Assumed Number of Beds (1)
5.0 5.0 5.0 5.0 5.0
Clients/Coast_Life_Support_District/Business_Plan_2013/Planning/CAH_Utilizat ion_Project ions/[Bed_Need_and_Volume.xlsx]Bed Need M odel Report
(1) For minimum staff ing requirements
Medical/Surgical Bed Need
Based on an average daily census of 0.9 to 1.6, there is a
need for three medical/surgical beds. However, because
California RN staffing ratios mandate one nurse to support five
medical/surgical beds with a minimum of two RNs per unit, we
assumed building five general acute care beds and five swing
beds for a total of ten beds in the acute care unit. The two
staffed RNs will cover both acute care and swing beds.
Swing bed detail is available on the following page.

THE CAMDEN GROUP | 12/17/2013 | DISCUSSION DRAFT 22
Swing Bed Need
Swing bed utilization is estimated below assuming similar
market share capture assumptions.
Coast Life Support District
Community Medical Center - Inpatient Swing Bed Need
Year 1 - Year 5
Projected Year
Swing Beds 1 2 3 4 5
Discharges 3 4 5 5 5
Patient Days 35 42 53 59 64
Average Length-of-Stay 11.7 11.7 11.7 11.7 11.7
Average Daily Census 0.1 0.1 0.1 0.2 0.2
Bed Need at 95 Percent Functional Occupancy 1.0 1.0 1.0 1.0 1.0
Assumed Number of Beds (1)
5.0 5.0 5.0 5.0 5.0
Clients/Coast_Life_Support_District/Business_Plan_2013/Planning/CAH_Utilizat ion_Project ions/[Bed_Need_and_Volume.xlsx]Bed Need M odel Report
(1) For minimum staff ing requirements
THE CAMDEN GROUP | 12/17/2013 | DISCUSSION DRAFT 23
Many smaller hospitals utilize skilled nursing beds to assist
with staffing and to expand service offerings to the
community.
We assumed the community medical center will have a five-
bed distinct part SNF and would reach capacity within the first
three years of the projection period.
These patients will be predominantly Medi-Cal, as shown in
the table on the following page.
Skilled Nursing Assumptions

THE CAMDEN GROUP | 12/17/2013 | DISCUSSION DRAFT 24
Skilled Nursing Assumptions
Coast Life Support District
Calendar Year 2012
Payer Distribution
Medi-Cal 62.5%
Medicare 12.9%
Managed Care(2) 11.5%
Private Insurance 2.0%
Self-Pay 6.4%
All Other 4.7%
Total 100.0%
Freestanding Skilled Nursing Facility
Payer Mix in Mendocino and Sonoma
Counties (1)
Source: OSHPD Annual Utilization Report of Long-term Care Facilities, 2012; OSHPD Long-Term
Care Facility Annual Financial Data: Report periods ended March 31, 2012 through December 31,
2012
Note: Includes skilled nursing facilities licensed by the State as "open." Excludes inpatient skilled
nursing beds and volume attributed to hospital licenses.
(1) Payer Mix is based off of number of patients in the facility on December 31, whose principal
source of payment was from each of the above payers.
(2) Includes patients enrolled in Medicare and Medi-Cal managed care plans.

THE CAMDEN GROUP | 12/17/2013 | DISCUSSION DRAFT 25
Total ED activity consists of encounters resulting in a hospital
admission and encounters that were treated and released.
Approximately 56 percent of service area inpatients were
admitted through an ED in CY 2011. Due to the lower acuity
patients assumed to utilize the community medical center and
the limited breadth of services offered, it was assumed that a
smaller proportion, 28 percent, of the inpatients admitted to
the community medical center will come through the ED.
CLSD was assumed to capture 75 percent of ED visits that
were treated and released without a hospital admission.
Current ED service area market share is shown on page 29.
ED Assumptions

THE CAMDEN GROUP | 12/17/2013 | DISCUSSION DRAFT 26
The ED at the community medical center will be designated
as standby. Key differences between standby and basic EDs
are provided in Appendix B.
It was assumed that the community medical center could
utilize the existing waiver already in place at RCMS regarding
911 transfers.
ED Assumptions

THE CAMDEN GROUP | 12/17/2013 | DISCUSSION DRAFT 27
Service Area ED Market Share
Coast Life Support District
Service Area Emergency Department Visits Market Share by Hospital
Calendar Year 2011
Service Area
Hospital Visits
Percent of
Total Visits
Percent of
Total Visits
Percent of
Total Visits
Percent of
Total
Mendocino Coast District Hospital 333 41.7% 283 43.7% 50 63.3% 0 0.0%
Santa Rosa Memorial Hospital-Montgomery 106 13.3% 95 14.7% 3 3.8% 8 11.2%
Ukiah Valley Medical Center/Hospital Drive 98 12.3% 74 11.4% 24 30.4% 0 0.0%
Sutter Medical Center Of Santa Rosa 84 10.5% 72 11.1% 0 0.0% 12 16.1%
Kaiser Foundation Hospitals 60 7.6% 37 5.7% 0 0.0% 23 32.6%
Palm Drive Hospital 41 5.2% 17 2.6% 0 0.0% 24 33.9%
Healdsburg District Hospital 27 3.4% 25 3.9% 0 0.0% 2 2.5%
Petaluma Valley Hospital 7 0.9% 6 0.9% 0 0.0% 1 1.2%
Sutter Lakeside Hospital 6 0.7% 5 0.8% 0 0.0% 1 0.8%
Sutter Auburn Faith Hospital 4 0.5% 2 0.3% 2 2.5% 0 0.0%
Frank R Howard Memorial Hospital 4 0.5% 4 0.6% 0 0.0% 0 0.0%
Eden Medical Center 4 0.5% 4 0.6% 0 0.0% 0 0.0%
Community Hospital Monterey Peninsula 3 0.4% 3 0.5% 0 0.0% 0 0.0%
Alta Bates Summit Med Ctr-Alta Bates Campus 3 0.4% 3 0.5% 0 0.0% 0 0.0%
Arroyo Grande Community Hospital 2 0.3% 2 0.3% 0 0.0% 0 0.0%
John Muir Medical Center-Walnut Creek Campus 2 0.3% 2 0.3% 0 0.0% 0 0.0%
Grossmont Hospital 2 0.3% 2 0.3% 0 0.0% 0 0.0%
California Pacific Med Ctr-Pacific Campus 2 0.3% 2 0.3% 0 0.0% 0 0.0%
Sutter Roseville Medical Center 2 0.3% 2 0.3% 0 0.0% 0 0.0%
St. Joseph Hospital - Orange 2 0.3% 2 0.3% 0 0.0% 0 0.0%
Valleycare Medical Center 2 0.3% 2 0.3% 0 0.0% 0 0.0%
Marin General Hospital 2 0.3% 2 0.3% 0 0.0% 0 0.0%
Alameda Hospital 2 0.3% 2 0.3% 0 0.0% 0 0.0%
San Joaquin General Hospital 1 0.1% 0 0.0% 0 0.0% 1 0.8%
St. Helena Hospital 1 0.1% 0 0.0% 0 0.0% 1 0.8%
Total 798 100.0% 648 100.0% 79 100.0% 71 100.0%
ED Station Need at 2,000 Visits per Station 0.4 0.3 0.0 0.0
Clients/Coast_Life_Support_District /Business_Plan_2013/Planning/[ED_Tables.xlsx]M arket Share
Source: OSHPD Emergency Department Database, 2011
Note: Numbers may not foot due to rounding.
(1) Secondary Service Area - South ED visits w ere calculated as 29.5 percent of total ED visits
Total Primary Secondary - North Secondary - South(1)

THE CAMDEN GROUP | 12/17/2013 | DISCUSSION DRAFT 28
Payer mix was assumed to mirror the market
ED Assumptions
Coast Life Support District
Service Area Emergency Department Visits Payer Mix
Calendar Year 2011
Service Area
Payer Visits
Percent of
Total Visits
Percent of
Total Visits
Percent of
Total Visits
Percent of
Total
Medicare 169 21.1% 141 21.8% 20 25.3% 8 10.7%
Medicare Managed Care 26 3.3% 20 3.1% 0 0.0% 6 9.1%
Subtotal 195 24.4% 161 24.8% 20 25.3% 14 19.8%
Medi-Cal 201 25.2% 169 26.1% 16 20.3% 16 22.3%
Commercial - HMO 57 7.1% 37 5.7% 6 7.6% 14 19.4%
Commercial - PPO 18 2.2% 13 2.0% 3 3.8% 2 2.5%
Commercial - Other 173 21.7% 145 22.4% 22 27.8% 6 8.3%
Subtotal 248 31.0% 195 30.1% 31 39.2% 22 30.2%
Self-pay 117 14.7% 96 14.8% 8 10.1% 13 18.6%
Other Payers 37 4.7% 27 4.2% 4 5.1% 6 9.1%
Total 798 100.0% 648 100.0% 79 100.0% 71 100.0%
Clients/Coast_Life_Support_District/Business_Plan_2013/Planning/[ED_Tables.xlsx]Payer M ix
Source: OSHPD Emergency Department Database, 2011
Note: Numbers may not foot due to rounding.
(1) Secondary Service Area - South ED visits w ere calculated as 29.5 percent of total ED visits
Total Primary Secondary - North Secondary - South(1)

THE CAMDEN GROUP | 12/17/2013 | DISCUSSION DRAFT 29
To account for the notable volume of tourists visiting the
service area each year, an inmigration factor of ten percent
was applied to the ED visits that were treated and released
without a hospital admission.
Based on a station need benchmark of 1,800 visits per
station, there is a need for one ED station in the service area.
However, due to the random nature of emergencies, we
assumed building two ED stations, one station to serve for
back-up purposes.
ED Assumptions and Station Need
Coast Life Support District
Community Medical Center - Emergency Department Station Need
Year 1 - Year 5
Projected Year
Emergency Department 1 2 3 4 5
Visits 555 595 638 677 706
Station Need at 1,800 Visits Per Station 1.0 1.0 1.0 1.0 1.0
Assumed Number of Stations 2.0 2.0 2.0 2.0 2.0
Clients/Coast_Life_Support_District/Business_Plan_2013/Planning/CAH_Utilizat ion_Project ions/[Bed_Need_and_Volume.xlsx]Bed Need M odel Report
THE CAMDEN GROUP | 12/17/2013 | DISCUSSION DRAFT 30
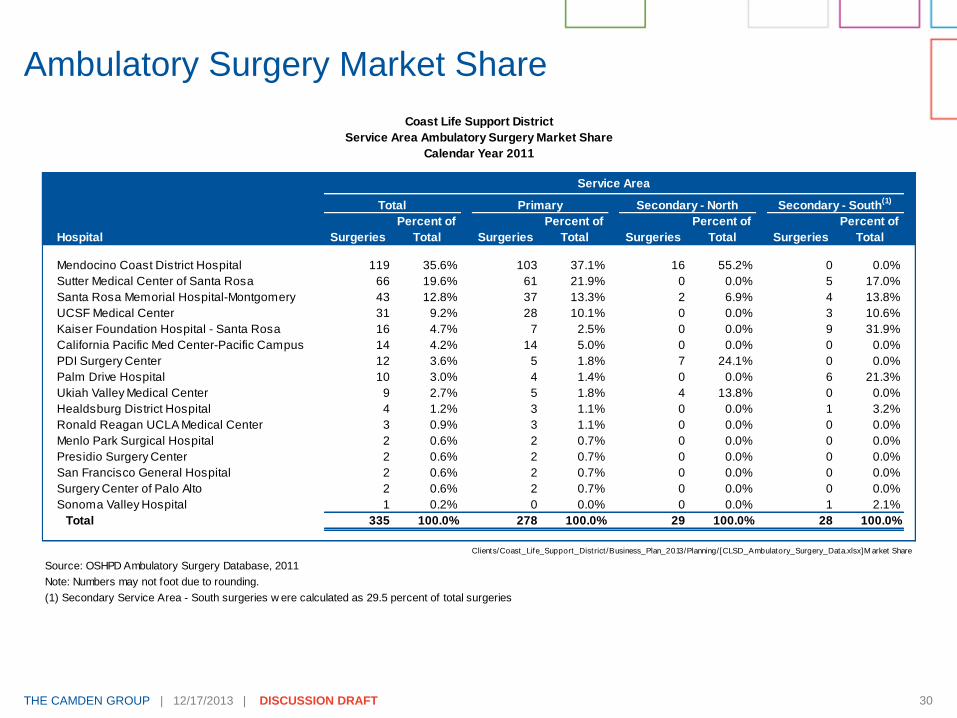
Ambulatory Surgery Market Share
Coast Life Support District
Service Area Ambulatory Surgery Market Share
Calendar Year 2011
Service Area
Hospital Surgeries
Percent of
Total Surgeries
Percent of
Total Surgeries
Percent of
Total Surgeries
Percent of
Total
Mendocino Coast District Hospital 119 35.6% 103 37.1% 16 55.2% 0 0.0%
Sutter Medical Center of Santa Rosa 66 19.6% 61 21.9% 0 0.0% 5 17.0%
Santa Rosa Memorial Hospital-Montgomery 43 12.8% 37 13.3% 2 6.9% 4 13.8%
UCSF Medical Center 31 9.2% 28 10.1% 0 0.0% 3 10.6%
Kaiser Foundation Hospital - Santa Rosa 16 4.7% 7 2.5% 0 0.0% 9 31.9%
California Pacific Med Center-Pacific Campus 14 4.2% 14 5.0% 0 0.0% 0 0.0%
PDI Surgery Center 12 3.6% 5 1.8% 7 24.1% 0 0.0%
Palm Drive Hospital 10 3.0% 4 1.4% 0 0.0% 6 21.3%
Ukiah Valley Medical Center 9 2.7% 5 1.8% 4 13.8% 0 0.0%
Healdsburg District Hospital 4 1.2% 3 1.1% 0 0.0% 1 3.2%
Ronald Reagan UCLA Medical Center 3 0.9% 3 1.1% 0 0.0% 0 0.0%
Menlo Park Surgical Hospital 2 0.6% 2 0.7% 0 0.0% 0 0.0%
Presidio Surgery Center 2 0.6% 2 0.7% 0 0.0% 0 0.0%
San Francisco General Hospital 2 0.6% 2 0.7% 0 0.0% 0 0.0%
Surgery Center of Palo Alto 2 0.6% 2 0.7% 0 0.0% 0 0.0%
Sonoma Valley Hospital 1 0.2% 0 0.0% 0 0.0% 1 2.1%
Total 335 100.0% 278 100.0% 29 100.0% 28 100.0%
Clients/Coast_Life_Support_District /Business_Plan_2013/Planning/[CLSD_Ambulatory_Surgery_Data.xlsx]M arket Share
Source: OSHPD Ambulatory Surgery Database, 2011
Note: Numbers may not foot due to rounding.
(1) Secondary Service Area - South surgeries w ere calculated as 29.5 percent of total surgeries
Total Primary Secondary - North Secondary - South(1)

THE CAMDEN GROUP | 12/17/2013 | DISCUSSION DRAFT 31
Surgical Volume Assumptions
Payer mix was assumed to trend similar to the inpatient market.
Coast Life Support District
Based on Data From Calendar Year 2011
Surgeries
Payer
Service Area
Market
Community
Medical
Center
Medicare 43.4% 49.4%
Medicare Managed Care 2.2% 1.2%
Subtotal 45.7% 50.6%
Medi-Cal 20.6% 23.1%
Commercial - HMO 6.2% 4.3%
Commercial - PPO 1.7% 0.9%
Commercial - Other 23.4% 20.1%
Subtotal 31.3% 25.3%
Other Payers 2.4% 0.9%
Total 100.0% 100.0%
Clients/Coast_Life_Support_District/Business_Plan_2013/Planning/CAH_Utilizat ion_Project ions/[Bed_Need_and_Volume.xlsx]Payer M ix AS
Source: OSHPD Ambulatory Surgery Database, 2011 and The Camden Group
Numbers may not foot due to rounding
Ambulatory Surgery Payer Mix - Service Area Market versus
the Community Medical Center

THE CAMDEN GROUP | 12/17/2013 | DISCUSSION DRAFT 32
Surgical Volume Assumptions
Market share of ambulatory surgeries was assumed to reflect
similar capture assumptions as inpatient surgeries,
approximately 48 percent of the service area’s surgeries.
Coast Life Support District
Community Medical Center - Summary of Surgical Volume
Year 1 - Year 5
Projected Year
Surgery 1 2 3 4 5
Ambulatory 86 102 126 136 159
Inpatient 10 12 16 17 18
Total 95 114 142 153 177
Clients/Coast_Life_Support_District/Business_Plan_2013/Planning/CAH_Utilizat ion_Project ions/[Bed_Need_and_Volume.xlsx]Bed Need M odel Report

Financial Projection

THE CAMDEN GROUP | 12/17/2013 | DISCUSSION DRAFT 34
Assumes
Critical Access
designation in
Year 3 of
projected
period with an
increase in
Medicare
reimburse-
ment to 101
percent of cost.
Financial Projection: Start-up and Five-Years
General Acute Care Hospital Critical Access Hospital
Pre-opening Projected Year
Financial Statement 2-Years 1 2 3 4 5
Discharges
Medical/Surgical 81 97 123 136 147
Swing Bed 3 4 5 5 5
Skilled Nursing Facility 8 11 13 13 13
Net Revenue
Net Revenue $0 $2,953,275 $3,631,924 $7,234,404 $7,576,893 $7,881,664
Revenue Loss Prior to CMS Approval 0 (728,205) 0 0 0 0
Total $0 $2,225,070 $3,631,924 $7,234,404 $7,576,893 $7,881,664
Operating Expenses
Salaries, Wages, Benefits, and Professional Fees $6,753,301 $6,191,886 $6,377,643 $6,568,972 $6,568,972 $6,568,972
Physician Professional Fees 0 3,259,407 3,259,407 3,259,407 3,259,407 3,259,407
Supplies 0 273,235 325,655 385,874 405,465 424,246
Purchased Services 0 533,450 597,616 669,871 697,150 724,022
Lease and Rentals 0 40,836 47,066 54,156 56,571 58,923
Other Direct Expenses 0 287,657 300,177 313,757 324,066 334,529
Total $6,753,301 $10,586,472 $10,907,564 $11,252,038 $11,311,630 $11,370,099
EBITDA ($6,753,301) ($8,361,401) ($7,275,640) ($4,017,634) ($3,734,738) ($3,488,435)
Depreciation 0 1,314,232 1,315,008 1,319,125 1,319,516 1,319,865
Interest Expense 0 2,265,818 2,223,718 2,179,974 2,134,520 2,087,289
Net Operating Income ($6,753,301) ($11,941,451) ($10,814,366) ($7,516,733) ($7,188,774) ($6,895,589)
High-level Cash Flow
Net Income ($6,753,301) ($11,941,451) ($10,814,366) ($7,516,733) ($7,188,774) ($6,895,589)
Add: Depreciation Expense 0 1,314,232 1,315,008 1,319,125 1,319,516 1,319,865
Less: Capital Additions (45,880,000) 0 0 0 0 0
Less: Working Capital/Other Debt Financing Costs (11,450,650) 0 0 0 0 0
Less: Routine Capital Expenditures 0 (118,131) (145,277) (289,376) (303,076) (315,267)
Add: Income from Financing/Funding 64,083,951 0 0 0 0 0
Less: Principal Payments 0 (1,077,169) (1,119,269) (1,163,013) (1,208,467) (1,255,698)
Estimated Cash Flow $0 ($11,822,519) ($10,763,904) ($7,649,997) ($7,380,801) ($7,146,688)
Cumulative Cash Flow $0 ($11,822,519) ($22,586,423) ($30,236,420) ($37,617,221) ($44,763,909)
Clients/Coast_Life_Support_District /Business_Plan_2013/Financial/ [OSHPD_Financial_Benchmarks.xlsx]CAH_Project ions
THE CAMDEN GROUP | 12/17/2013 | DISCUSSION DRAFT 35
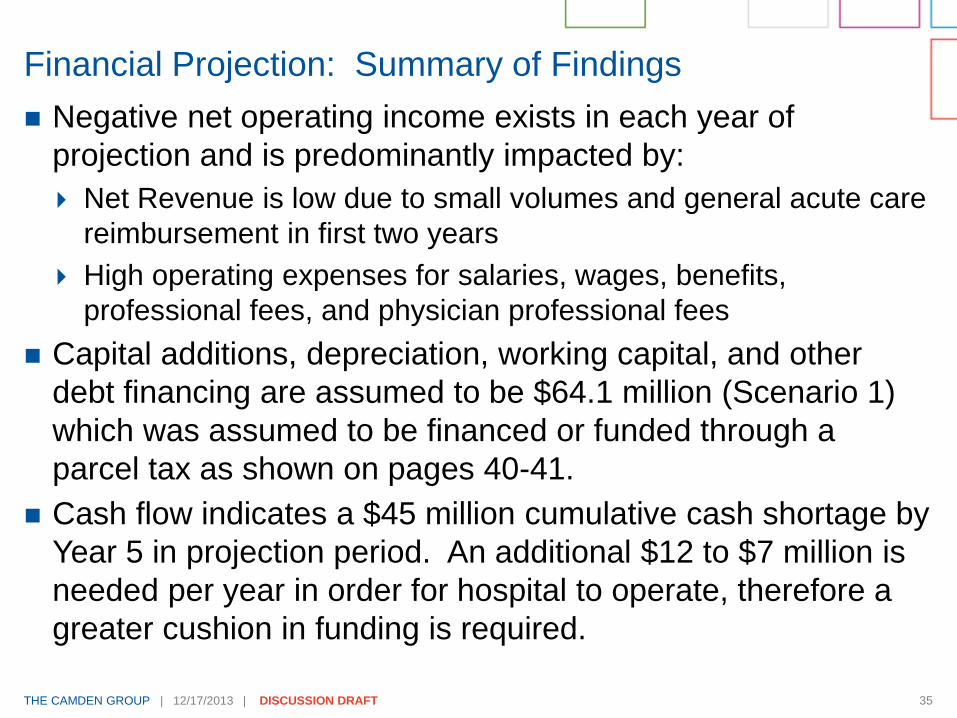
Negative net operating income exists in each year of
projection and is predominantly impacted by:
Net Revenue is low due to small volumes and general acute care
reimbursement in first two years
High operating expenses for salaries, wages, benefits,
professional fees, and physician professional fees
Capital additions, depreciation, working capital, and other
debt financing are assumed to be $64.1 million (Scenario 1)
which was assumed to be financed or funded through a
parcel tax as shown on pages 40-41.
Cash flow indicates a $45 million cumulative cash shortage by
Year 5 in projection period. An additional $12 to $7 million is
needed per year in order for hospital to operate, therefore a
greater cushion in funding is required.
Financial Projection: Summary of Findings

THE CAMDEN GROUP | 12/17/2013 | DISCUSSION DRAFT 36
Two scenarios of project capital costs were reviewed based
on a 37,000 square foot building with building, architecture
and engineering, equipment, and information technology
costs ranging between $46 and $57 million, including
contingency.
Ten percent of the project cost is assumed to be raised
through funding through a parcel tax.
Ninety percent of the project cost is assumed to be financed
through a loan.
Working capital requirements includes:
Ninety-days of cash for revenue loss during licensing period
Three months of start-up salaries, wages, and benefits (“SWB”)
Two years of an estimated administrator SWB
Estimated consulting and legal fees as 10.0 percent of project cost
Assumptions: Capital and Debt Service

THE CAMDEN GROUP | 12/17/2013 | DISCUSSION DRAFT 37
2.5 percent issuance cost
10.0 percent debt reserve fund
30-year term loan with two years capitalized interest and two
years principal deferment in the two-year start-up period
3.84 percent government interest rate
All estimates for inflation are in today’s dollars and would
need to be adjusted for inflation.
Assumptions: Capital and Debt Service

THE CAMDEN GROUP | 12/17/2013 | DISCUSSION DRAFT 38
Assumptions: Capital and Debt Service
Multiple scenarios were shown for capital costs.
Scenario 1 shows lower capital expenditures based on $800
per square foot and was used in the financial projections.
Equity contribution from parcel tax equates to $414 per unit
based on 11,069 tax units.
Sources and Uses Scenario 1
Coast Life Support District
Community Medical Center - Scenario 1 Sources and Uses
Pre-opening and Year 1 - Year 5
Sources Amount Uses Amount
Bond proceeds $59,495,951 Capital expenditures (1)
$45,880,000
Equity contribution (Parcel Tax) 4,588,000 Working capital requirement 9,363,664
Debt service reserve fund 4,557,481
Cost of issuance 1,032,300
Capitalized interest 3,250,506
Total $64,083,951 Total $64,083,951
Clients/Coast_Life_Support_District/Business_Plan_2013/Financial/[OSHPD_Financial_Benchmarks.xlsx]Sources_Uses
(1) Capital expenditures include building costs, architecture and engineering, equipment, information technology, and
contingency

THE CAMDEN GROUP | 12/17/2013 | DISCUSSION DRAFT 39
Assumptions: Capital and Debt Service
Scenario 2 shows higher capital expenditures based on
$1,000 per square foot.
Equity contribution from parcel tax equates to $518 per unit
based on 11,069 tax units.
Sources and Uses Scenario 2
Coast Life Support District
Community Medical Center - Scenario 2 Sources and Uses
Pre-opening and Year 1 - Year 5
Sources Amount Uses Amount
Bond proceeds $72,029,023 Capital expenditures (1)
$57,350,000
Equity contribution (Parcel Tax) 5,735,000 Working capital requirement 9,363,664
Debt service reserve fund 5,696,851
Cost of issuance 1,290,375
Capitalized interest 4,063,133
Total $77,764,023 Total $77,764,023
Clients/Coast_Life_Support_District/Business_Plan_2013/Financial/[OSHPD_Financial_Benchmarks.xlsx]Sources_Uses
(1) Capital expenditures include building costs, architecture and engineering, equipment, information technology, and
contingency

THE CAMDEN GROUP | 12/17/2013 | DISCUSSION DRAFT 40
Total Debt Service in scenarios ranges from $3.3 to $4 million.
Cash available for debt service is based on negative net
operating revenue and the debt service coverage ratio is
negative.
Mendocino County’s Standard and Poor’s credit rating is AA-
and a hospital with a similar rating would have a debt service
coverage ratio of 5.8. The debt service coverage ratio for
speculative grade is 2.1 to 2.6.
Assumptions: Capital and Debt Service
Coast Life Support District
Community Medical Center -Projected Capital Costs
Pre-opening and Year 1 - Year 5
Pre-Opening YearBond 2-Years 1 2 3 4 5
Scenario 1: Cash Available for Debt Service $0 ($8,361,401) ($7,315,676) ($4,068,102) ($3,790,466) ($3,548,503)
$59,495,951 Total Debt Service $0 $3,342,987 $3,342,987 $3,342,987 $3,342,987 $3,342,987
Debt Service Coverage Ratio (2.50) (2.19) (1.22) (1.13) (1.06)
Scenario 2: Cash Available for Debt Service $0 ($8,361,401) ($7,315,676) ($4,068,102) ($3,790,466) ($3,548,503)
$72,029,023 Total Debt Service $0 $4,047,201 $4,047,201 $4,047,201 $4,047,201 $4,047,201
Debt Service Coverage Ratio (2.07) (1.81) (1.01) (0.94) (0.88)
Clients/Coast_Life_Support_District/Business_Plan_2013/Financial/[OSHPD_Financial_Benchmarks.xlsx]Sources_Uses
Note 1: 30 year term loan with two years capitalized interest and two years principal deferment for the start-up period

THE CAMDEN GROUP | 12/17/2013 | DISCUSSION DRAFT 41
A “New Critical Access Hospital Economic Feasibility Analysis”
in Gualala, California was completed by Stroudwater
Associates (“Stroudwater”) in May 2010. The analysis required
a set of assumptions to estimate annual utilization of services,
revenue, expenses, profit/loss, and the cost for building and
servicing the debt of a new facility. The Stroudwater Report
differed from the Camden Group’s assumptions for a
community medical center in the following areas, shown on the
next five pages.
Stroudwater Report Assumptions

THE CAMDEN GROUP | 12/17/2013 | DISCUSSION DRAFT 42
Stroudwater Report Assumptions
Assumption Category The Camden Group Stroudwater
Service Area Included Timber Cove Excluded Timber Cove
Population Size/Population
Growth
6,194/No Growth 8,000/10 percent growth
over 10 years
Historical Utilization Office of Statewide
Health Planning and
Development (“OSHPD”)
Truven (formally
Thomson-Reuters)
healthcare services
database
Market Share 39 percent in Year 5 34 percent
Average Daily Census 1.6 days in Year 5 for
acute inpatients
0.2 days in Year 5 for
swing bed inpatients
2.71 days for acute
inpatients
1.0 days for swing beds
inpatients
Licensed Bed Number 5 acute care beds
5 swing beds
5 skilled nursing beds
6 swing beds
Critical Access Designation Year 3 Year 1
THE CAMDEN GROUP | 12/17/2013 | DISCUSSION DRAFT 43
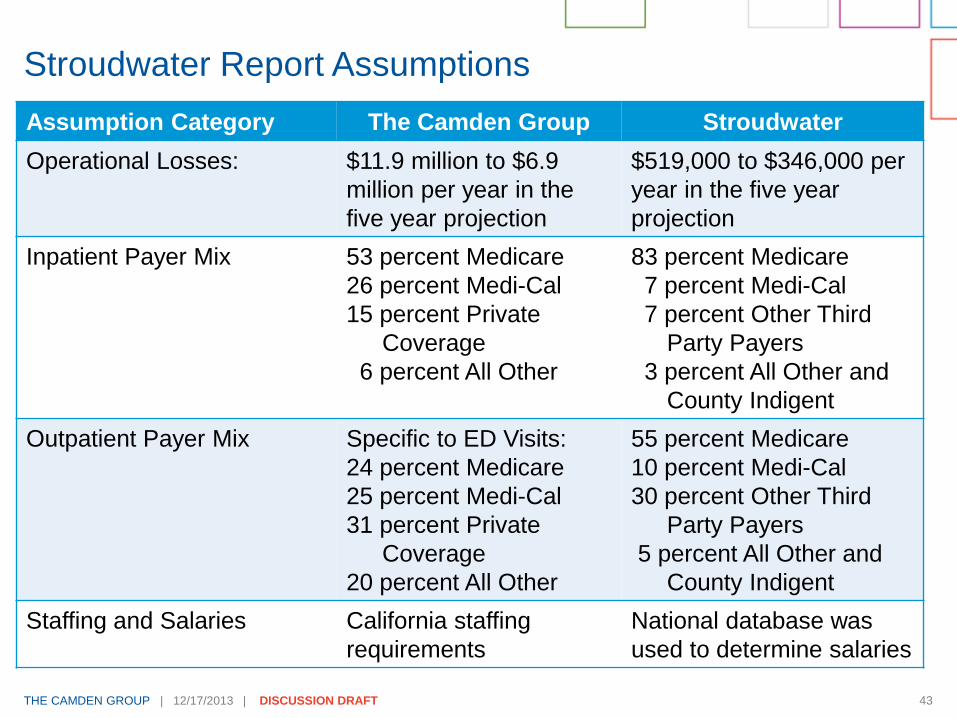
Stroudwater Report Assumptions
Assumption Category The Camden Group Stroudwater
Operational Losses: $11.9 million to $6.9
million per year in the
five year projection
$519,000 to $346,000 per
year in the five year
projection
Inpatient Payer Mix 53 percent Medicare
26 percent Medi-Cal
15 percent Private
Coverage
6 percent All Other
83 percent Medicare
7 percent Medi-Cal
7 percent Other Third
Party Payers
3 percent All Other and
County Indigent
Outpatient Payer Mix Specific to ED Visits:
24 percent Medicare
25 percent Medi-Cal
31 percent Private
Coverage
20 percent All Other
55 percent Medicare
10 percent Medi-Cal
30 percent Other Third
Party Payers
5 percent All Other and
County Indigent
Staffing and Salaries California staffing
requirements
National database was
used to determine salaries

THE CAMDEN GROUP | 12/17/2013 | DISCUSSION DRAFT 44
Stroudwater Report Assumptions
Assumption Category The Camden Group Stroudwater
Reimbursement Medicare: 101 percent of
reasonable costs with
assumption that 10
percent of operating costs
non-reasonable
Other Third Party Payer:
80 percent gross revenue
and 3 percent increase per
year in projection period.
Medi-Cal: based on APR-
DRG rate for rural
hospitals; rate remains flat
through projection period
All Other Payers: 20
percent of gross revenue
and rate remains flat
through projection period
Medicare: 101 percent
cost reimbursement with
no loss and 1 percent
profit
Other Third Party Payer:
60 percent of gross
revenue
County Indigent: 20
percent of gross revenue
while
All Other Payers: 40
percent of gross revenue

THE CAMDEN GROUP | 12/17/2013 | DISCUSSION DRAFT 45
Stroudwater Report Assumptions
Assumption
Category
The Camden Group Stroudwater
Costs Facility: ranges from $45.9
million to $57.4 million based
on cost per square foot
Start-up costs: $6.7million
Additional financing: $18.2
million to $20.4 million
Construction: $800 to $1,000
per square foot for a 37,000
square foot facility
Loan payments: $3.3 million to
$4.0 million for a 30 year term
loan with two years capitalized
interest and two years principal
deferment for projection period
Facility: ranges from $33
million (without primary
care clinic) to $37 million
(with primary care clinic)
Start-up costs: $2 million
Recruitment and
housing: $200,000
Additional Emergency
Department staffing:
$100,000 per year
Construction: $600 per
square foot for a 38,000
square foot facility
Monthly loan payments:
$165,000

THE CAMDEN GROUP | 12/17/2013 | DISCUSSION DRAFT 46
Stroudwater Report Assumptions
Assumption Category The Camden Group Stroudwater
Funding and Financing $4.6 million to $5.7
million of local funds
raised through parcel
tax
$59.5 million to $72.0
million bond issuance
Loan rate for 30 years
at 3.84 percent interest
Debt service coverage
ratio is negative
$5 million of local funds
raised
$34 million bond issuance
Loan rate for 40 years at
6.0 percent interest
Debt service coverage
ratio of 1.46

THE CAMDEN GROUP | 12/17/2013 | DISCUSSION DRAFT 47
New Community Medical Center Critical Success Factors
Critical Success Factors Likelihood
Critical access designation Probably
Part of System Potentially
High Medicare payer mix (60+ percent) Probably not
High occupancy levels and critical
mass No
Adequate physician supply and select
specialist coverage Probably not
Support tax, donations, and other non-
operating revenue to support facilities To Be Determined

Recommendations

THE CAMDEN GROUP | 12/17/2013 | DISCUSSION DRAFT 49
The Camden Group does not believe that building a small
community medical center (less than 25 licensed beds) in
CLSD’s service area would serve as a financially sustainable
healthcare model for the community due to the following
factors:
High start-up costs to build a new facility due to California’s
regulatory environment.
Low inpatient occupancy levels hinder the community medical
center’s ability to provide consistently high quality, keep clinical
competencies, and maintain enough critical mass to be
financially sustainable.
Delays in cost-based reimbursement methodologies at the new
community medical center caused by the 12 to 18 month
qualification period for critical access designation will translate
into significant financial losses during the initial years of
operation.
Recommendations

THE CAMDEN GROUP | 12/17/2013 | DISCUSSION DRAFT 50
The payer mix of the market will most likely not yield a high
enough proportion of Medicare patients, which will contribute to
the financial unsustainability of the hospital
Significant household parcel tax increases to provide start-up
and ongoing funds to support a community medical center
The above listed factors will reduce CLSD’s ability to attract a
health system partner, which is critical to the success of this
new facility.
In addition, ongoing challenges would persist in the
recruitment and retention of physicians, hospital
management, and technical staff needed for the community
medical center to succeed locally.
Would require subsidies and premiums to attract and retain talent
in the service area.
Recommendations

THE CAMDEN GROUP | 12/17/2013 | DISCUSSION DRAFT 51
The anticipated future trends in the healthcare environment
(e.g., reimbursement levels, declining inpatient use, physician
and clinical shortages) will continue to make it difficult to
successfully operate and maintain financially viable hospitals
in general, and smaller hospital players in particular.
The Camden Group believes the use of valuable financial
resources and management would be better served to
support the expansion of urgent care and outpatient services
at this point-in-time.
Recommendations
https://sharepoint.thecamdengroup.com/Clients/Coast_Life_Support_District/Business_Plan_2013/Presentations/Camden_CLSD_Community_Medical_Center_Discussion-Draft_12_17_13.pptx

Appendix A
Terms

THE CAMDEN GROUP | 12/17/2013 | DISCUSSION DRAFT 53
General Services - The non-revenue producing cost centers
for those services generally associated with the operation and
maintenance of a hospital, including such cost centers as
laundry and linen, housekeeping and plant operations, and
maintenance.
Fiscal Services - The non-revenue producing cost centers for
those services generally associated with the fiscal operations
of a hospital, including such cost centers as general
accounting, patient accounting, and admitting.
Administrative Services - The non-revenue producing cost
centers for those services generally associated with the
overall management and administration of a hospital, such as
hospital administration, personnel, and medical records.
Terms
THE CAMDEN GROUP | 12/17/2013 | DISCUSSION DRAFT 54
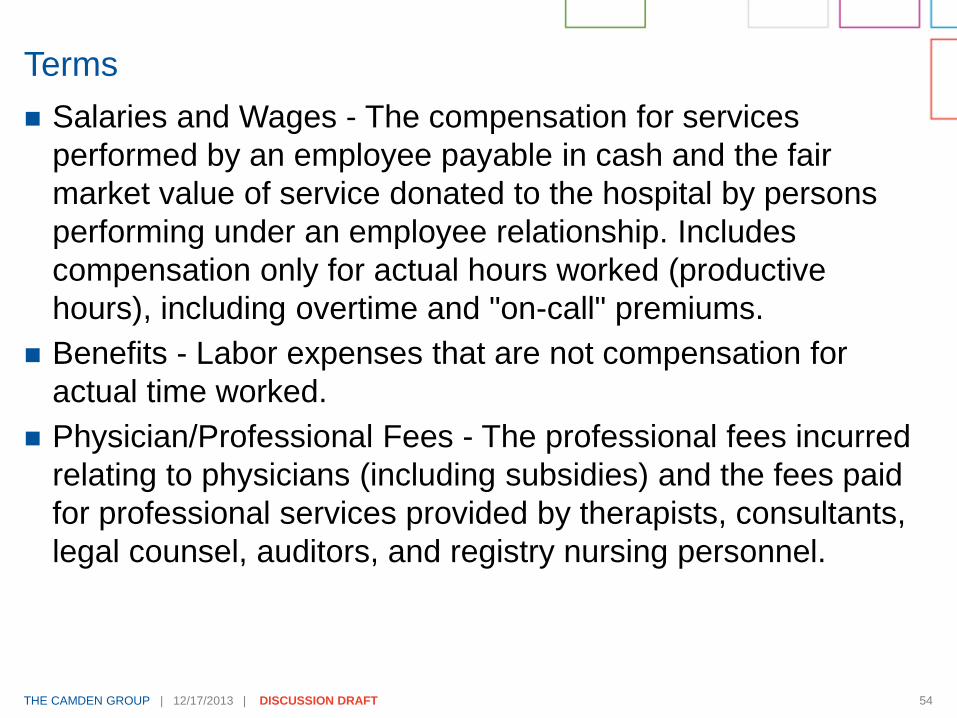
Salaries and Wages - The compensation for services
performed by an employee payable in cash and the fair
market value of service donated to the hospital by persons
performing under an employee relationship. Includes
compensation only for actual hours worked (productive
hours), including overtime and "on-call" premiums.
Benefits - Labor expenses that are not compensation for
actual time worked.
Physician/Professional Fees - The professional fees incurred
relating to physicians (including subsidies) and the fees paid
for professional services provided by therapists, consultants,
legal counsel, auditors, and registry nursing personnel.
Terms

THE CAMDEN GROUP | 12/17/2013 | DISCUSSION DRAFT 55
Supplies - The cost of various types of supplies used by the
hospital, including medical supplies, drugs, food, and office
supplies.
Purchased Services - The expenses incurred relating to
services purchased from an outside contractor or vendor,
such as diagnostic imaging services, equipment repairs and
maintenance, and collection services. Also includes fees paid
to a related organization for management services and
inpatient services purchased from another hospital.
Leases and Rentals - The cost related to the lease and rental
of buildings, equipment, and leasehold improvements.
Terms
Appendix B
Emergency Medical Services Requirements

THE CAMDEN GROUP | 12/17/2013 | DISCUSSION DRAFT 57
Standby and Basic ED Requirements
Standby and Basic Emergency Medical Services Requirements
Emergency Department
Facility Requirements Standby Basic
General Space Requirements
Designated
emergency room area Treatment room
Specific Space Requirements:
Cast room X
Nursing station X
Medication room X
Public toilets X
Observation room X X
Staff support rooms including toilets, showers, and lounge X
Waiting room X
Reception area X X
Observation beds in the emergency medical service shall not be
counted in the total licensed bed capacity of the hospital.X X
https:/ /sharepoint.thecamdengroup.com/Clients/Coast_Life_Support_District/Business_Plan_2013/Planning/[ER_Requirements.xls]M atrix
Sources: California Administrative Code Title 22

THE CAMDEN GROUP | 12/17/2013 | DISCUSSION DRAFT 58
Standby and Basic ED Requirements
Standby and Basic Emergency Medical Services Requirements
Emergency Department
General Requirements Standby Basic
Written policies and procedures developed and maintained by
the person responsible for the service in consultation with other
appropriate health professionals and administration. Policies
shall be approved by the governing body. Procedures shall be
approved by the administration and med staff where appropriate.
X X
The responsibility and the accountability of the emergency
medical service to the medical staff and administration shall be
defined.
X X
There shall be a roster of names of physicians and their
telephone numbers who are available to provide emergency
service.
X
The emergency medical service shall be so located in the
hospital as to have ready access to all necessary services.
X
A communication system employing telephones, radiotelephone
or similar means shall be in use to establish and maintain
contact with the police department, rescue squads and other
emergency services of the community.
X X
The emergency medical service shall have a defined emergency
and mass casualty plan in concert with the hospital's capabilities
and the capabilities of the community served.
X X
The hospital shall require continuing education of all emergency
medical service personnel.
X X
Medical records shall be maintained on all patients presenting
themselves for emergency medical care. These shall become
part of the patient's hospital medical record. Past hospital records
shall be available to the emergency medical service.
X X
https:/ /sharepoint.thecamdengroup.com/Clients/Coast_Life_Support_District /Business_Plan_2013/Planning/[ER_Requirements.xls]M atrix
Sources: California Administrative Code Title 22
THE CAMDEN GROUP | 12/17/2013 | DISCUSSION DRAFT 59
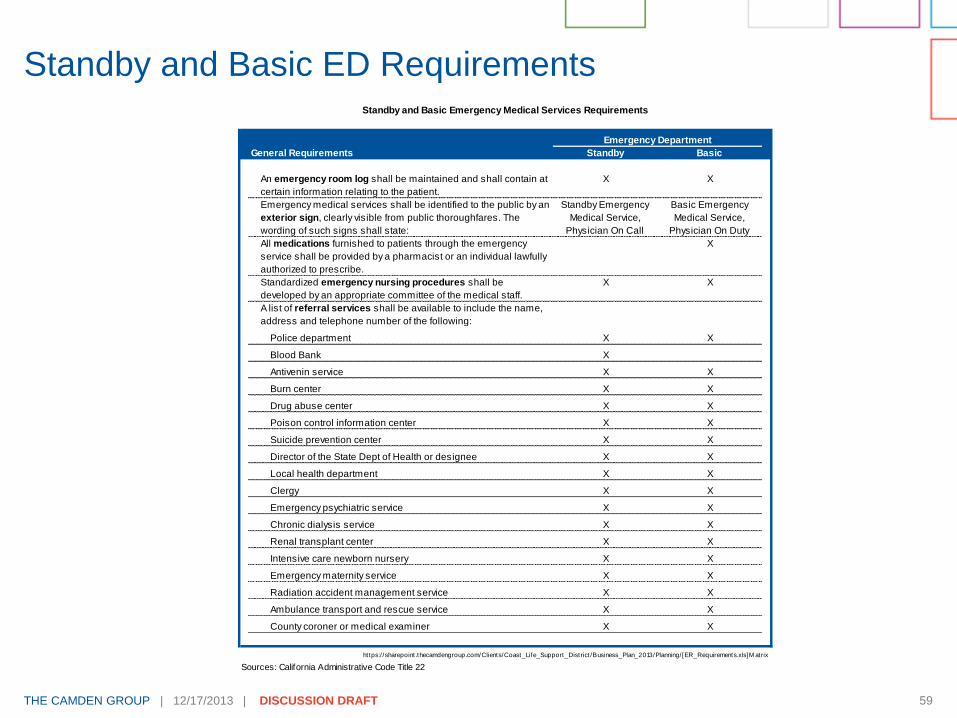
Standby and Basic ED Requirements Standby and Basic Emergency Medical Services Requirements
Emergency Department
General Requirements Standby Basic
An emergency room log shall be maintained and shall contain at
certain information relating to the patient.
X X
Emergency medical services shall be identified to the public by an
exterior sign, clearly visible from public thoroughfares. The
wording of such signs shall state:
Standby Emergency
Medical Service,
Physician On Call
Basic Emergency
Medical Service,
Physician On Duty
All medications furnished to patients through the emergency
service shall be provided by a pharmacist or an individual lawfully
authorized to prescribe.
X
Standardized emergency nursing procedures shall be
developed by an appropriate committee of the medical staff.
X X
A list of referral services shall be available to include the name,
address and telephone number of the following:
Police department X X
Blood Bank X
Antivenin service X X
Burn center X X
Drug abuse center X X
Poison control information center X X
Suicide prevention center X X
Director of the State Dept of Health or designee X X
Local health department X X
Clergy X X
Emergency psychiatric service X X
Chronic dialysis service X X
Renal transplant center X X
Intensive care newborn nursery X X
Emergency maternity service X X
Radiation accident management service X X
Ambulance transport and rescue service X X
County coroner or medical examiner X X
https:/ /sharepoint.thecamdengroup.com/Clients/Coast_Life_Support_District /Business_Plan_2013/Planning/[ER_Requirements.xls]M atrix
Sources: California Administrative Code Title 22

THE CAMDEN GROUP | 12/17/2013 | DISCUSSION DRAFT 60
Standby and Basic ED Requirements
Standby and Basic Emergency Medical Services Requirements
Emergency Department
General Requirements Standby Basic
Periodically, an appropriate committee of the medical staff shall
evaluate the services provided and make appropriate
recommendations to the executive committee of the medical
staff and administration.
X X
The hospital shall have the following service capabilities:
Intensive care service with adequate monitoring and
therapeutic equipment.
X
Laboratory service with the capability of performing blood gas
analysis and electrolyte determinations.
X
Radiological service shall be capable of providing the
necessary support for the emergency service.
X
Surgical services shall be immediately available for life-
threatening situations.
X
Post anesthesia recovery service. X
The hospital shall have readily available the services of a
blood bank containing common types of blood and blood
derivatives. Blood storage facilities shall be in or adjacent to
the emergency service.
X
https:/ /sharepoint.thecamdengroup.com/Clients/Coast_Life_Support_District /Business_Plan_2013/Planning/[ER_Requirements.xls]M atrix
Sources: California Administrative Code Title 22
THE CAMDEN GROUP | 12/17/2013 | DISCUSSION DRAFT 61
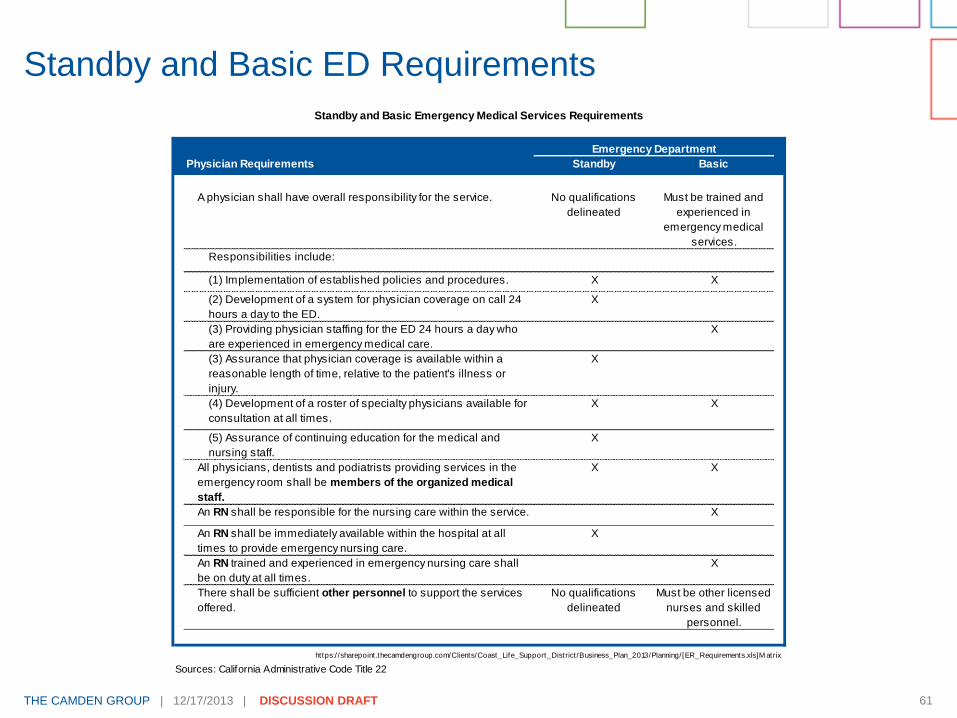
Standby and Basic ED Requirements
Standby and Basic Emergency Medical Services Requirements
Emergency Department
Physician Requirements Standby Basic
A physician shall have overall responsibility for the service. No qualifications
delineated
Must be trained and
experienced in
emergency medical
services.
Responsibilities include:
(1) Implementation of established policies and procedures. X X
(2) Development of a system for physician coverage on call 24
hours a day to the ED.
X
(3) Providing physician staffing for the ED 24 hours a day who
are experienced in emergency medical care.
X
(3) Assurance that physician coverage is available within a
reasonable length of time, relative to the patient's illness or
injury.
X
(4) Development of a roster of specialty physicians available for
consultation at all times.
X X
(5) Assurance of continuing education for the medical and
nursing staff.
X
All physicians, dentists and podiatrists providing services in the
emergency room shall be members of the organized medical
staff.
X X
An RN shall be responsible for the nursing care within the service. X
An RN shall be immediately available within the hospital at all
times to provide emergency nursing care.
X
An RN trained and experienced in emergency nursing care shall
be on duty at all times.
X
There shall be sufficient other personnel to support the services
offered.
No qualifications
delineated
Must be other licensed
nurses and skilled
personnel.
https:/ /sharepoint.thecamdengroup.com/Clients/Coast_Life_Support_District /Business_Plan_2013/Planning/[ER_Requirements.xls]M atrix
Sources: California Administrative Code Title 22

THE CAMDEN GROUP | 12/17/2013 | DISCUSSION DRAFT 62
Standby and Basic ED Requirements
Standby and Basic Emergency Medical Services Requirements
Emergency Department
Equipment Requirements Standby Basic
All equipment and supplies necessary for life support shall be
available, including but not limited to:
Airway control and ventilation equipment X X
Suction devices X X
Cardiac monitor defibrillator X X
Pacemaker capability X
Apparatus to est. central venous pressure monitoring X
IV fluids and administration devices X X
Blood expanders X X
https:/ /sharepoint.thecamdengroup.com/Clients/Coast_Life_Support_District/Business_Plan_2013/Planning/[ER_Requirements.xls]M atrix
Sources: California Administrative Code Title 22

Appendix C
Financial Assumption Detail

THE CAMDEN GROUP | 12/17/2013 | DISCUSSION DRAFT 64
The financial projection baseline was based on the comparable
hospitals selected for their related characteristics (e.g., region,
size, ownership, critical access status) to the community
medical center.
Financial Assumption Detail
Hospital
Type of
Control County Beds
Medicare
Case Mix
Index
Critical
Access
Status
Eight
Essential
Services
Emergency
Services
Rural
Health
Clinic
Catalina Island
Medical
Non-profit
Corporation
Los Angeles 4 Acute
12 Long-term
0.7706 Yes All except
Surgery
Standby Yes
Community Hospital
of San Bernardino
Non-profit
Corporation
San
Bernardino
26 Intensive
229 Acute
88 Long-term
0.9527 Yes All Basic No
Eastern Plumas
District Hospital
District Plumas 10 Acute
66 Long-term
0.9269 Yes All Basic Yes
Mammoth Hospital District Mono 2 Intensive
13 Acute
1.1398 Yes All Standby Yes
Mendocino Coast
Hospital
District Mendocino 4 Intensive
16 Acute
5 Long-term
1.4256 Yes All Basic Yes
Seneca District
Hospital
District Plumas 10 Acute
16 Long-term
0.9842 Yes All Standby Yes
Bear Valley
Community Hospital
District San
Bernardino
9 Acute
21 Long-term
1.0881 No All Standby Yes

THE CAMDEN GROUP | 12/17/2013 | DISCUSSION DRAFT 65
The baseline assumptions for revenue and costs are based on
Fiscal Year 2012 OSHPD Annual Financial Disclosure Reports.
The baseline assumptions do not include an inflation factor, as
the timing of the opening had not been estimated.
Financial Assumption Detail

THE CAMDEN GROUP | 12/17/2013 | DISCUSSION DRAFT 66
Financial projection shows a two-year pre-opening period and five-year operational projection period. The first two years of operations assumed to be general acute care until critical access designation obtained.
Medicare payment for general acute care hospital is the acute inpatient prospective payment system (“PPS”) and the hospital outpatient PPS. Payment for inpatient services were assumed to be an average Medicare Severity-Diagnosis Related Group (“MS-DRG”) payment for case mix index of 1.0 based on comparable hospitals.
Medicare payment for critical access hospital for inpatient and outpatient services are assumed at 101 percent of reasonable costs (e.g., lesser of costs or charges, costs for provision of services that exceed average costs of similar hospitals). Ninety percent of total operating expenses on page 36 were assumed to be reasonable costs.
Financial Assumption Detail

THE CAMDEN GROUP | 12/17/2013 | DISCUSSION DRAFT 67
Medi-Cal payment is based on the APR-DRG pricing for
remote and rural locations based on the California
Department of Health Care Services and the outpatient fee
schedules. Medi-Cal rate remains flat through the projection
period.
Commercial reimbursement assumed at 80 percent of gross
revenue, and assumed to increase by three percent each
year.
Self-pay and other reimbursement assumed at 20 percent of
gross revenue. Self-pay rate remains flat through the
projection period.
Financial Assumption Detail

THE CAMDEN GROUP | 12/17/2013 | DISCUSSION DRAFT 68
The costs associated with operating expense include SWB, professional fees, physician professional fees, supplies, purchased services, leases, rentals, and other direct costs.
Services include the eight essential services as well as respiratory, fiscal, general, and administrative services.
Operating expense increases by 3.0 percent inflation per year.
Financial Assumption Detail

THE CAMDEN GROUP | 12/17/2013 | DISCUSSION DRAFT 69
FTE projections are based on expected inpatient and
outpatient volume and ancillary utilization and on comparable
hospitals’ staffing. The minimum requirements for staffing
units are included.
SWB are based on FTEs and additional professional fees
range from $6.2 to $7.0 million in Years 1 to 5 and are
included in total operating expense.
Financial Assumption Detail
Coast Life Support District
Community Medical Center - Full Time Equivalents
Year 1 - Year 5
Projected Year
Department 1 2 3 4 5
Medical/Surgical 8.4 8.4 8.4 8.4 8.4
Skilled Nursing 8.4 8.4 8.4 8.4 8.4
Emergency Department 8.4 8.4 8.4 8.4 8.4
Clinical Laboratory 4.2 4.2 4.2 4.2 4.2
Diagnostic Radiology 4.2 4.2 4.2 4.2 4.2
Physical Therapy 2.0 2.0 2.0 2.0 2.0
Respiratory Therapy 4.2 4.2 4.2 4.2 4.2
Surgery and Anesthesia 4.2 4.2 4.2 4.2 4.2
Pharmacy 4.2 4.2 4.2 4.2 4.2
Dietary 1.5 1.5 1.5 1.5 1.5
Fiscal Services 2.0 2.0 2.0 2.0 2.0
General Services 4.0 4.0 4.0 4.0 4.0
Administrative Services 2.0 2.0 2.0 2.0 2.0
Total Productive FTEs 57.8 57.8 57.8 57.8 57.8
Total Paid FTEs 65.3 65.3 65.3 65.3 65.3
Clients/Coast_Life_Support_District/Business_Plan_2013/Financial/[OSHPD_Financial_Benchmarks.xlsx]Labor
https://sharepoint.thecamdengroup.com/Clients/Coast_Life_Support_District/Business_Plan_2013/Presentations/Camden_CLSD_Community_Medical_Center_Discussion-Draft_12_17_13.pptx