
Community Health Needs Assessment Report - Rush … · Community Health Needs Assessment Report...
32
Community Health Needs Assessment Report FY2016
-
Upload
truongdung -
Category
Documents
-
view
215 -
download
2
Transcript of Community Health Needs Assessment Report - Rush … · Community Health Needs Assessment Report...
Community Health Needs
Assessment Report
FY2016
2
Outline
• Executive Summary
• Introduction
• Community Served
• Identified Community Health Needs
• Evaluation of Impact of the FY13 Implementation Strategy

3
Executive Summary
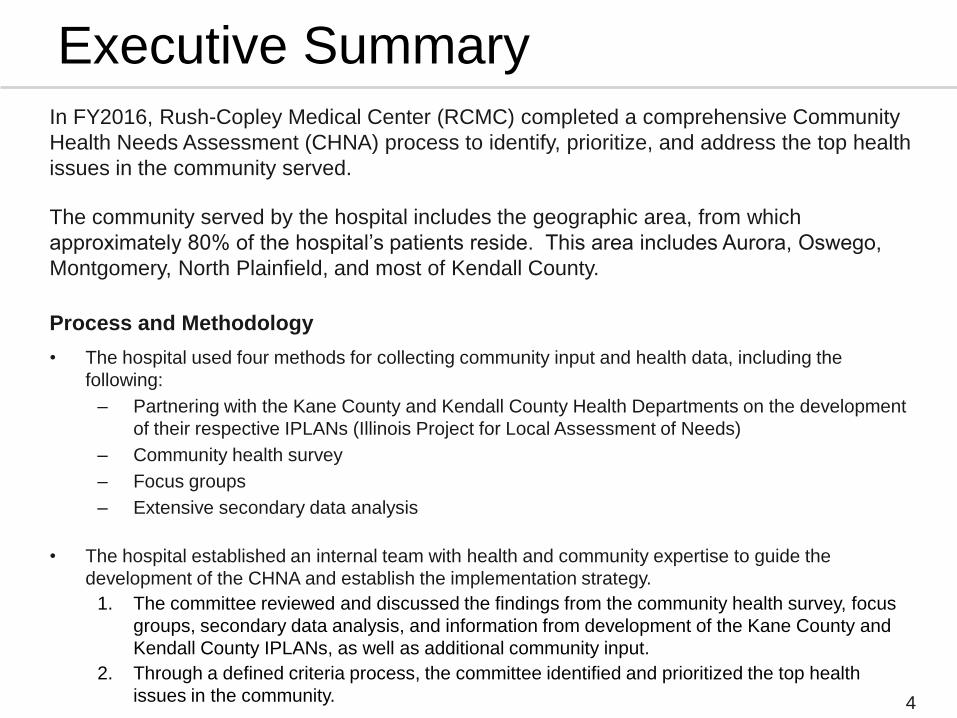
In FY2016, Rush-Copley Medical Center (RCMC) completed a comprehensive Community
Health Needs Assessment (CHNA) process to identify, prioritize, and address the top health
issues in the community served.
The community served by the hospital includes the geographic area, from which
approximately 80% of the hospital’s patients reside. This area includes Aurora, Oswego,
Montgomery, North Plainfield, and most of Kendall County.
Process and Methodology
• The hospital used four methods for collecting community input and health data, including the
following:
– Partnering with the Kane County and Kendall County Health Departments on the development
of their respective IPLANs (Illinois Project for Local Assessment of Needs)
– Community health survey
– Focus groups
– Extensive secondary data analysis
• The hospital established an internal team with health and community expertise to guide the
development of the CHNA and establish the implementation strategy.
1. The committee reviewed and discussed the findings from the community health survey, focus
groups, secondary data analysis, and information from development of the Kane County and
Kendall County IPLANs, as well as additional community input.
2. Through a defined criteria process, the committee identified and prioritized the top health
issues in the community.
4
Executive Summary
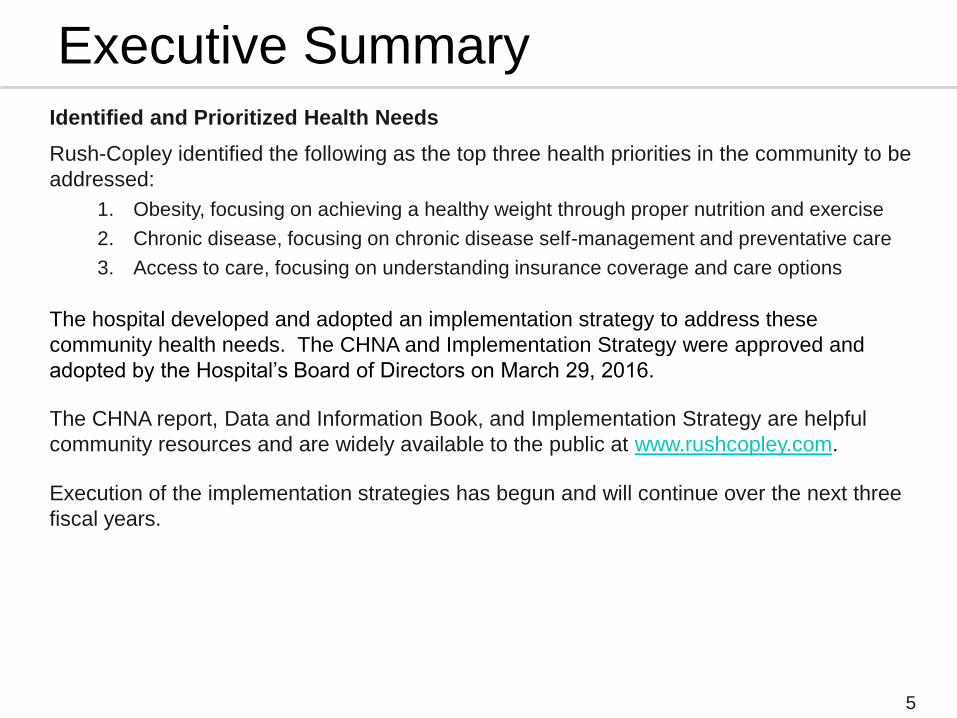
Identified and Prioritized Health Needs
Rush-Copley identified the following as the top three health priorities in the community to be
addressed:
1. Obesity, focusing on achieving a healthy weight through proper nutrition and exercise
2. Chronic disease, focusing on chronic disease self-management and preventative care
3. Access to care, focusing on understanding insurance coverage and care options
The hospital developed and adopted an implementation strategy to address these
community health needs. The CHNA and Implementation Strategy were approved and
adopted by the Hospital’s Board of Directors on March 29, 2016.
The CHNA report, Data and Information Book, and Implementation Strategy are helpful
community resources and are widely available to the public at www.rushcopley.com.
Execution of the implementation strategies has begun and will continue over the next three
fiscal years.
5
Executive Summary

6
Introduction
• Since its founding (originally as Aurora City Hospital) in 1886, Copley Memorial Hospital has
been committed to serving the health needs of the greater Aurora community.
• Copley Memorial Hospital, otherwise known as Rush-Copley Medical Center (RCMC),
– Is a 210 bed, not-for-profit hospital with 525 physicians on staff and over 2,000 employees
– Offers inpatient specialty care as well as comprehensive outpatient services
– Provides services to over 90,000 individual patients annually
– Holds more accreditations and disease specific certifications than any other area hospital
– Recognized nationally, regionally, and locally for providing an outstanding workplace
– Is the most preferred hospital by area consumers for key specialties and overall quality of care
• The hospital’s mission is to provide advanced medicine with quality outcomes and
extraordinary care. To that end, the medical center seeks to serve the community in ways that
engage, educate, and empower. Annually the hospital:
– Sponsors, partners, or participates in well over 300 community-based programs and events,
specifically groups aimed at improving the lives of children, women, or the underserved
– Provides free educational programs and seminars including hand hygiene, diabetes, heart health,
cancer prevention, weight control, smoking cessation, and more
– Provides free and reduced cost health screenings
– Provides language assistance services, volunteer programs, and professional education
• In FY2014, the hospital provided over $7 million in charity care and nearly $27 million in
uncompensated government sponsored indigent health care. Additional discounts and
expenses associated with the hospital providing care to the uninsured and underinsured
totaled $41.6 million during the same time period. 7
Rush-Copley Medical Center

• The Patient Protection and Affordable Care Act of 2010 requires private, not-for-profit
hospitals to conduct a Community Health Needs Assessment (CHNA) at least once
every three years and to adopt an implementation strategy to address the identified
community needs.
• A CHNA provides information so that communities may identify issues of greatest
concern and decide to commit resources to those areas, thereby making the greatest
possible impact on community health status.
• The purpose of this Community Health Needs Assessment is to objectively identify and
prioritize the health needs of the community served.
– This will be accomplished through a systematic, data-driven approach to determining the health
status, behaviors, and needs of residents in the RCMC service area, including input from
community stakeholders.
– The assessment results will be used to develop and implement strategies and action plans to
address the identified needs.
8
Assessment Overview
• Rush-Copley’s goals of the Community Health Needs Assessment include:
1. Determine and establish information about the health status of the community.
The information acquired and assembled for this assessment will be used to help
establish trends in future CHNAs.
2. Identify all of the health needs of the community
3. Prioritize the identified community health needs
4. Develop and implement strategies and action plans to address the identified and
prioritized community health needs
9
Assessment Goals
• The hospital conducted the Community Health Needs Assessment in FY2016.
Community partnerships related to many of the components in the assessment process
were established and on-going since the FY2013 assessment.
• The hospital developed and adopted an implementation strategy to address the identified
community health needs. The Community Health Needs Assessment and Implementation
Strategy were approved and adopted by the Hospital’s Board of Directors on
March 29, 2016.
• In order to conduct a comprehensive and efficient Community Health Needs Assessment,
the hospital used the Association of Community Health Improvement’s (ACHI) framework
for developing a Community Health Needs Assessment, which includes the following six
steps:
1. Establishing the assessment infrastructure
2. Defining the purpose and scope of the assessment
3. Collecting and analyzing data
4. Identifying needs and selecting priorities
5. Documenting and communicating results
6. Planning for action and monitoring progress
10
Process and Framework
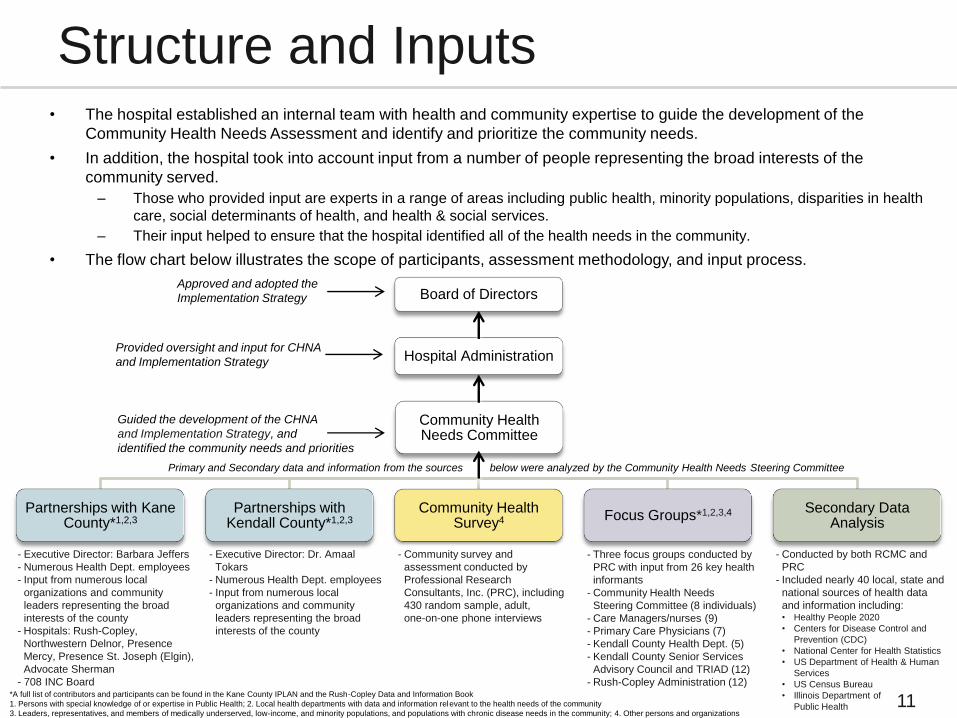
• The hospital established an internal team with health and community expertise to guide the development of the
Community Health Needs Assessment and identify and prioritize the community needs.
• In addition, the hospital took into account input from a number of people representing the broad interests of the
community served.
– Those who provided input are experts in a range of areas including public health, minority populations, disparities in health
care, social determinants of health, and health & social services.
– Their input helped to ensure that the hospital identified all of the health needs in the community.
• The flow chart below illustrates the scope of participants, assessment methodology, and input process.
Board of Directors
Partnerships with Kane County*1,2,3
Partnerships with Kendall County*1,2,3
Community Health Survey4 Focus Groups*1,2,3,4 Secondary Data
Analysis
Community Health Needs Committee
Hospital Administration
Primary and Secondary data and information from the sources below were analyzed by the Community Health Needs Steering Committee
11
Structure and Inputs
Approved and adopted the
Implementation Strategy
Guided the development of the CHNA
and Implementation Strategy, and
identified the community needs and priorities
Provided oversight and input for CHNA
and Implementation Strategy
- Executive Director: Barbara Jeffers
- Numerous Health Dept. employees
- Input from numerous local
organizations and community
leaders representing the broad
interests of the county
- Hospitals: Rush-Copley,
Northwestern Delnor, Presence
Mercy, Presence St. Joseph (Elgin),
Advocate Sherman
- 708 INC Board
- Executive Director: Dr. Amaal
Tokars
- Numerous Health Dept. employees
- Input from numerous local
organizations and community
leaders representing the broad
interests of the county
- Community survey and
assessment conducted by
Professional Research
Consultants, Inc. (PRC), including
430 random sample, adult,
one-on-one phone interviews
- Three focus groups conducted by
PRC with input from 26 key health
informants
- Community Health Needs
Steering Committee (8 individuals)
- Care Managers/nurses (9)
- Primary Care Physicians (7)
- Kendall County Health Dept. (5)
- Kendall County Senior Services
Advisory Council and TRIAD (12)
- Rush-Copley Administration (12)
- Conducted by both RCMC and
PRC
- Included nearly 40 local, state and
national sources of health data
and information including: • Healthy People 2020
• Centers for Disease Control and
Prevention (CDC)
• National Center for Health Statistics
• US Department of Health & Human
Services
• US Census Bureau
• Illinois Department of
Public Health
*A full list of contributors and participants can be found in the Kane County IPLAN and the Rush-Copley Data and Information Book
1. Persons with special knowledge of or expertise in Public Health; 2. Local health departments with data and information relevant to the health needs of the community
3. Leaders, representatives, and members of medically underserved, low-income, and minority populations, and populations with chronic disease needs in the community; 4. Other persons and organizations

Identified Community Health Needs
• In order to identify the community health needs, the hospital used a number of analytical methods,
including both qualitative and quantitative processes.
• There were four key methods used in the data and information collection and analysis component of
the assessment process that were critical in developing an accurate picture of the health of the
community served. The four key methods include the following:
12
Analytical Methodology
Partnering with the local county health departments
in the development of their IPLANs
(IPLAN development & implementation and partnerships are on-going)
– The hospital collaborated with the Kane County and Kendall County
health departments, as well as other community partners and health
experts, to develop and implement their respective IPLANs.
– Through these collaborations, the hospital actively participated in the
identification and prioritization of needs and the development of
improvement strategies for key topics that would
improve the health and well‐being of the
residents of the respective counties.
Community Health Survey (December 2014)
– The hospital contracted with Professional Research Consultants, Inc.
(PRC) to conduct a health status phone survey of adult residents from
the community served, using both landlines and cell phones.
– The survey questions were based largely on the CDC’s Behavioral Risk
Factor Surveillance System (BRFSS), as well as additional questions,
in order to obtain state and national comparative data and address
identified gaps.
– 430 one-on-one adult phone surveys were completed using a random
sample. The survey results provided the hospital
with a comprehensive and comparative view of
the health status and behaviors of the community.
Focus Groups (November 2014 – June 2015)
– Nine focus groups were conducted by or on behalf of the hospital.
– Each focus group provided insights on different segments of the
population and reflected the unique perspectives of the health needs of
the community from residents, community health leaders/experts,
hospital care managers and nurses, and primary care physicians. o PRC conducted three Kane County based focus groups. Key informant
participants representing the broad interests of the community included
physicians, other health professionals, social service providers, and other
business and community leaders.
o The hospital conducted six focus groups. Key informant participants included
Care Managers, Primary Care Physicians, Senior Services Organizations,
Kendall County Health Department Leadership, and Hospital Leadership .
Extensive Data Analysis (January-June 2014)
– An extensive secondary data analysis was conducted, which included
internal utilization data, IHA COMPdata, local public health data,
statewide and nationwide behavioral risk assessments data, and Healthy
People 2020 goals and baseline data.
– When available, the data indicators for the community, IL, and U.S. were
aligned and compared to both the Healthy People 2020 national baseline
data and goals, as well as the FY2013 Rush-Copley CHNA data and
findings. These comparisons helped with the identification of community
health needs from a quantitative perspective.
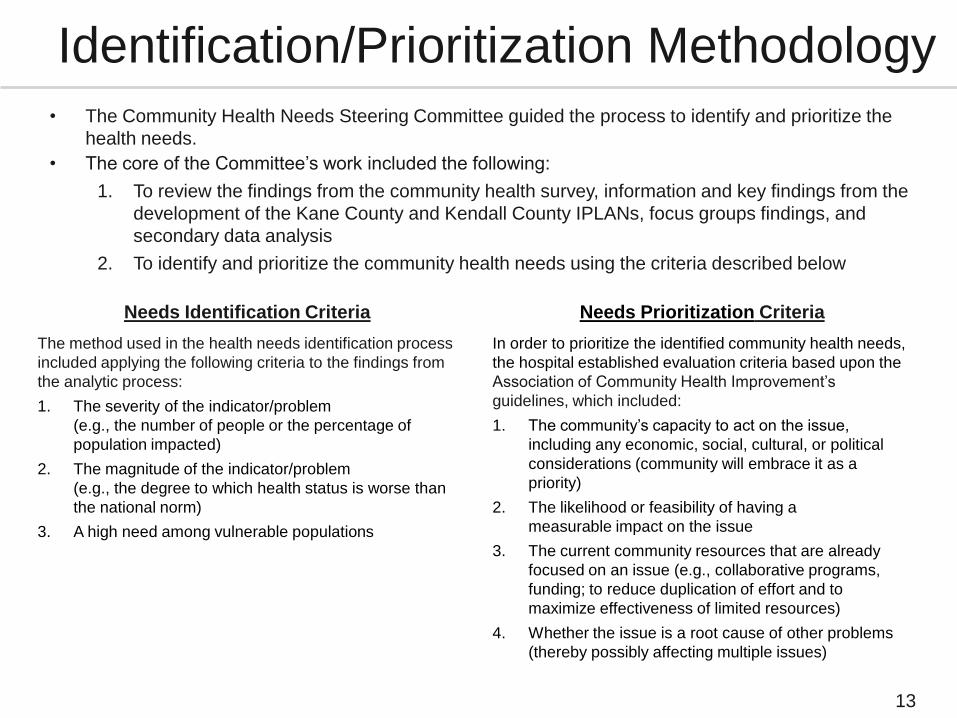
• The Community Health Needs Steering Committee guided the process to identify and prioritize the
health needs.
• The core of the Committee’s work included the following:
1. To review the findings from the community health survey, information and key findings from the
development of the Kane County and Kendall County IPLANs, focus groups findings, and
secondary data analysis
2. To identify and prioritize the community health needs using the criteria described below
Needs Identification Criteria
The method used in the health needs identification process
included applying the following criteria to the findings from
the analytic process:
1. The severity of the indicator/problem
(e.g., the number of people or the percentage of
population impacted)
2. The magnitude of the indicator/problem
(e.g., the degree to which health status is worse than
the national norm)
3. A high need among vulnerable populations
13
Identification/Prioritization Methodology
Needs Prioritization Criteria
In order to prioritize the identified community health needs,
the hospital established evaluation criteria based upon the
Association of Community Health Improvement’s
guidelines, which included:
1. The community’s capacity to act on the issue,
including any economic, social, cultural, or political
considerations (community will embrace it as a
priority)
2. The likelihood or feasibility of having a
measurable impact on the issue
3. The current community resources that are already
focused on an issue (e.g., collaborative programs,
funding; to reduce duplication of effort and to
maximize effectiveness of limited resources)
4. Whether the issue is a root cause of other problems
(thereby possibly affecting multiple issues)
14
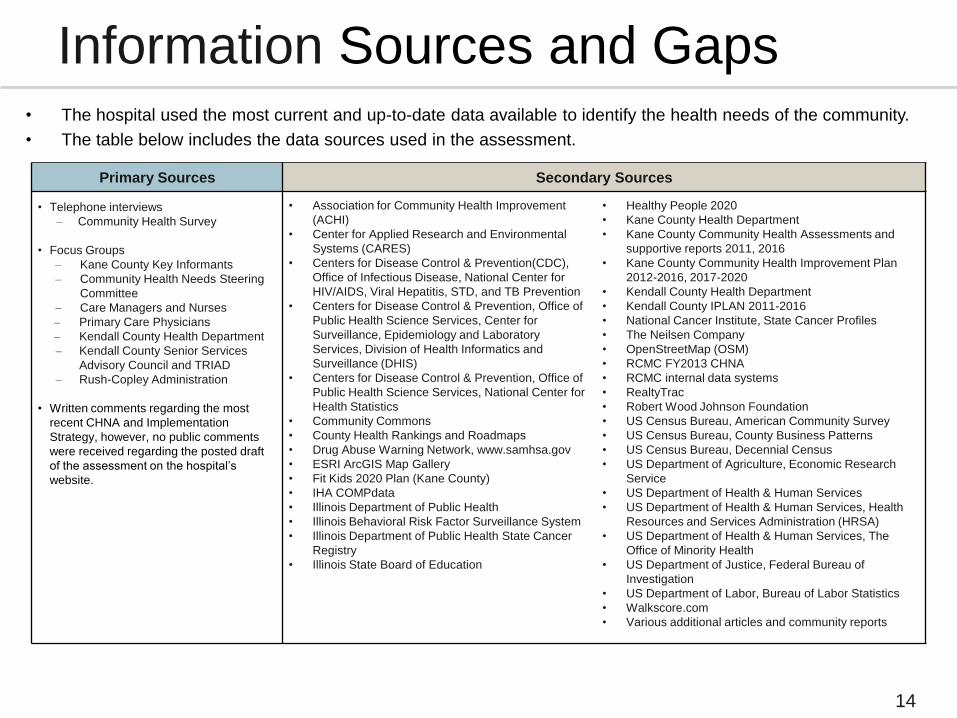
Information Sources and Gaps
Primary Sources Secondary Sources
• Telephone interviews
– Community Health Survey
• Focus Groups
– Kane County Key Informants
– Community Health Needs Steering
Committee
– Care Managers and Nurses
– Primary Care Physicians
– Kendall County Health Department
– Kendall County Senior Services
Advisory Council and TRIAD
– Rush-Copley Administration
• Written comments regarding the most
recent CHNA and Implementation
Strategy, however, no public comments
were received regarding the posted draft
of the assessment on the hospital’s
website.
• Association for Community Health Improvement
(ACHI)
• Center for Applied Research and Environmental
Systems (CARES)
• Centers for Disease Control & Prevention(CDC),
Office of Infectious Disease, National Center for
HIV/AIDS, Viral Hepatitis, STD, and TB Prevention
• Centers for Disease Control & Prevention, Office of
Public Health Science Services, Center for
Surveillance, Epidemiology and Laboratory
Services, Division of Health Informatics and
Surveillance (DHIS)
• Centers for Disease Control & Prevention, Office of
Public Health Science Services, National Center for
Health Statistics
• Community Commons
• County Health Rankings and Roadmaps
• Drug Abuse Warning Network, www.samhsa.gov
• ESRI ArcGIS Map Gallery
• Fit Kids 2020 Plan (Kane County)
• IHA COMPdata
• Illinois Department of Public Health
• Illinois Behavioral Risk Factor Surveillance System
• Illinois Department of Public Health State Cancer
Registry
• Illinois State Board of Education
• Healthy People 2020
• Kane County Health Department
• Kane County Community Health Assessments and
supportive reports 2011, 2016
• Kane County Community Health Improvement Plan
2012-2016, 2017-2020
• Kendall County Health Department
• Kendall County IPLAN 2011-2016
• National Cancer Institute, State Cancer Profiles
• The Neilsen Company
• OpenStreetMap (OSM)
• RCMC FY2013 CHNA
• RCMC internal data systems
• RealtyTrac
• Robert Wood Johnson Foundation
• US Census Bureau, American Community Survey
• US Census Bureau, County Business Patterns
• US Census Bureau, Decennial Census
• US Department of Agriculture, Economic Research
Service
• US Department of Health & Human Services
• US Department of Health & Human Services, Health
Resources and Services Administration (HRSA)
• US Department of Health & Human Services, The
Office of Minority Health
• US Department of Justice, Federal Bureau of
Investigation
• US Department of Labor, Bureau of Labor Statistics
• Walkscore.com
• Various additional articles and community reports
• The hospital used the most current and up-to-date data available to identify the health needs of the community.
• The table below includes the data sources used in the assessment.
15
Information Sources and Gaps • While an extensive amount of data was gathered and analyzed, it cannot measure all possible aspects of
health in the community, nor can it adequately represent all possible populations of interest.
Identified data gaps include:
1. Limited data for the community served was available for many of the health needs topics by demographic subgroups
and socio-economic subgroups (i.e., race, ethnicity, age, gender, income, education attainment, homeless, etc.).
2. Very limited to no data was available for undocumented residents in the community.
3. Health status and behaviors data was not available specific to children in the community served. However, it was
available for children residing in Kane County.
4. While this assessment was designed to provide a comprehensive and broad picture of the health of the overall
community, there are a number of medical conditions that are not specifically addressed.
• In order to address most of the data gaps mentioned above, the hospital asked questions regarding health
disparities in the community through focus groups facilitated by the hospital.
16
Community Served
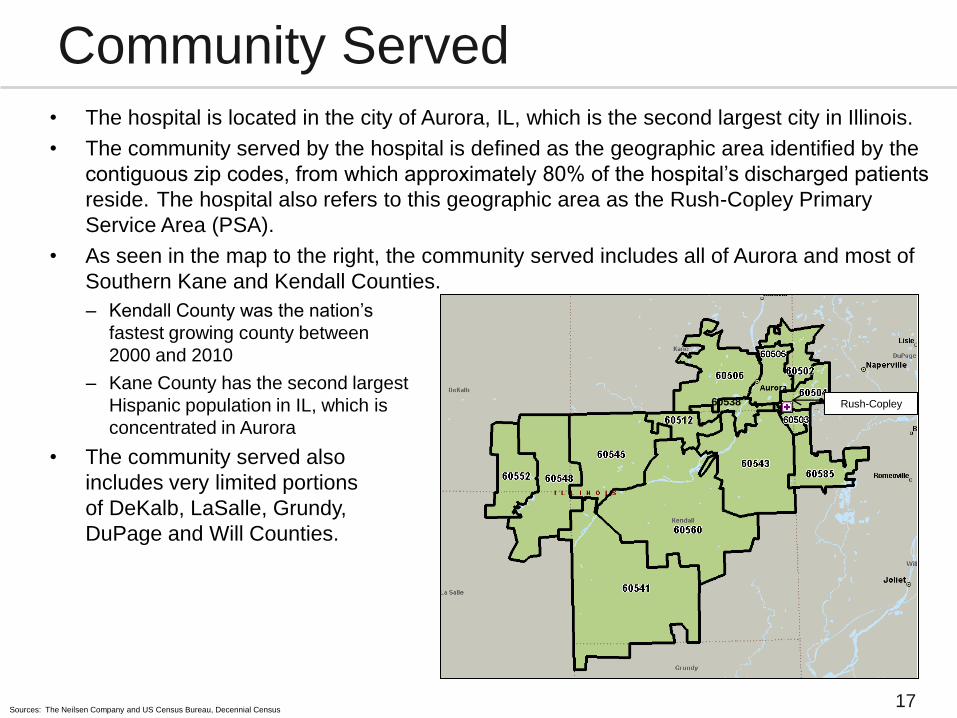
• The hospital is located in the city of Aurora, IL, which is the second largest city in Illinois.
• The community served by the hospital is defined as the geographic area identified by the
contiguous zip codes, from which approximately 80% of the hospital’s discharged patients
reside. The hospital also refers to this geographic area as the Rush-Copley Primary
Service Area (PSA).
• As seen in the map to the right, the community served includes all of Aurora and most of
Southern Kane and Kendall Counties.
– Kendall County was the nation’s
fastest growing county between
2000 and 2010
– Kane County has the second largest
Hispanic population in IL, which is
concentrated in Aurora
• The community served also
includes very limited portions
of DeKalb, LaSalle, Grundy,
DuPage and Will Counties.
60538
17
Community Served
Sources: The Neilsen Company and US Census Bureau, Decennial Census
Rush-Copley
18
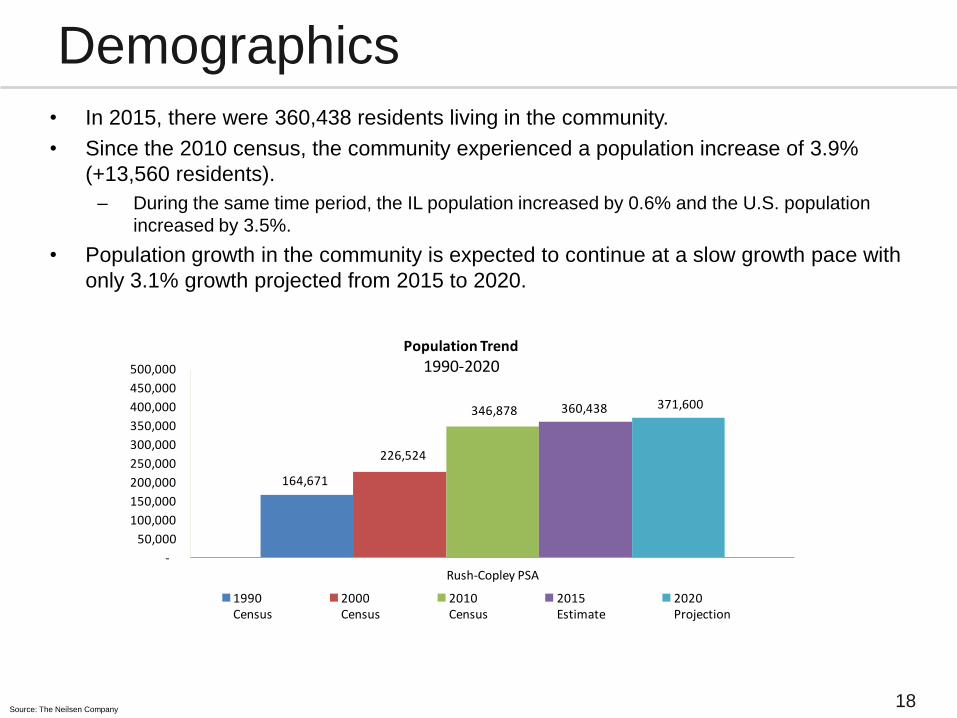
Demographics • In 2015, there were 360,438 residents living in the community.
• Since the 2010 census, the community experienced a population increase of 3.9%
(+13,560 residents).
– During the same time period, the IL population increased by 0.6% and the U.S. population
increased by 3.5%.
• Population growth in the community is expected to continue at a slow growth pace with
only 3.1% growth projected from 2015 to 2020.
Source: The Neilsen Company
164,671
226,524
346,878 360,438 371,600
-
50,000
100,000
150,000
200,000
250,000
300,000
350,000
400,000
450,000
500,000
Rush-Copley PSA
Population Trend
1990-2020
1990Census
2000Census
2010Census
2015Estimate
2020Projection
-
20,000
40,000
60,000
80,000
100,000
120,000
140,000
160,000
180,000
0-17 18-44 45-64 65+
2010
2015
2020
19
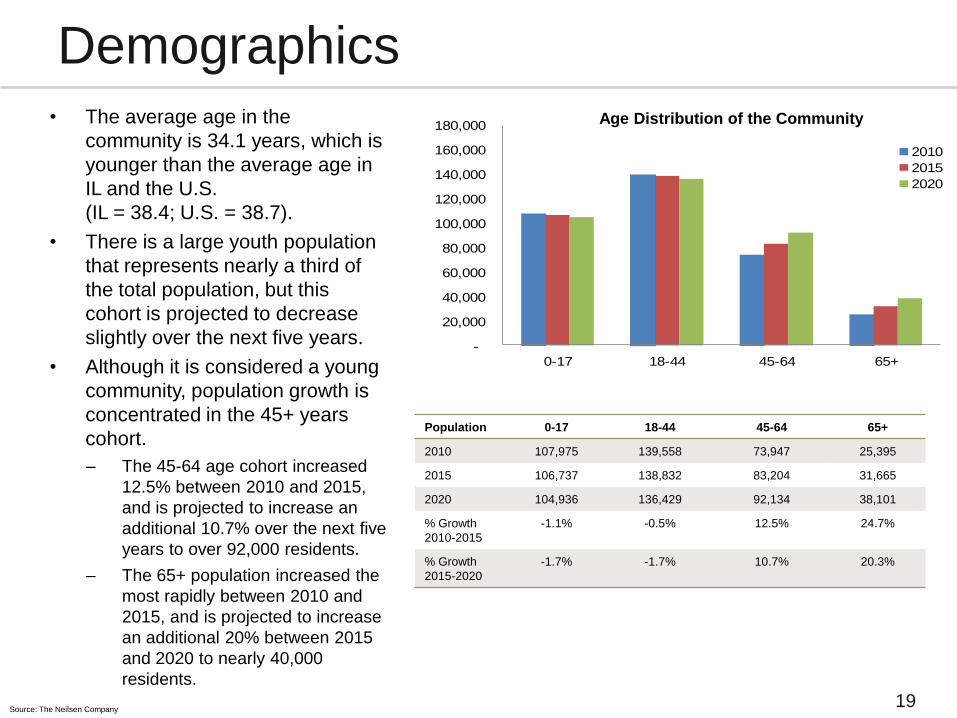
Demographics • The average age in the
community is 34.1 years, which is
younger than the average age in
IL and the U.S.
(IL = 38.4; U.S. = 38.7).
• There is a large youth population
that represents nearly a third of
the total population, but this
cohort is projected to decrease
slightly over the next five years.
• Although it is considered a young
community, population growth is
concentrated in the 45+ years
cohort.
– The 45-64 age cohort increased
12.5% between 2010 and 2015,
and is projected to increase an
additional 10.7% over the next five
years to over 92,000 residents.
– The 65+ population increased the
most rapidly between 2010 and
2015, and is projected to increase
an additional 20% between 2015
and 2020 to nearly 40,000
residents.
Age Distribution of the Community
Source: The Neilsen Company
Population 0-17 18-44 45-64 65+
2010 107,975 139,558 73,947 25,395
2015 106,737 138,832 83,204 31,665
2020 104,936 136,429 92,134 38,101
% Growth
2010-2015
-1.1% -0.5% 12.5% 24.7%
% Growth
2015-2020
-1.7% -1.7% 10.7% 20.3%

-
50,000
100,000
150,000
200,000
White -Not Hispanic
Hispanic or Latino -Any Race
Black or African American -
Not Hispanic
Asian - Not Hispanic *Other Races - Not Hispanic
2010 2015 2020 20
Demographics • Between, 2000 and 2010 the service area experienced rapidly changing demographics as the
community became more diverse. However, between 2010 and 2015, the rate of change
slowed and is projected to continue at a slower rate through 2020.
– The population of the combined minority races increased by 11.1% between 2010 and 2015, and it is
projected to increase an additional 9.9% by 2020 (+5,439 for a total of 60,442 residents).*
– The Hispanic population increased by 8.4% between 2010 and 2015, and it is projected to increase
an additional 7.5% by 2020 (+8,780 for a total of 125,322 residents).
• Hispanic and Latinos account for 32% of the population, which is nearly double the national
and state rates (IL= 17%; U.S.=18%)
• Approximately 26% of the residents in the community speak Spanish at home.**
Source: The Neilsen Company
*Does not include the Hispanic or Latino population
**Primary language based on residents ages 5 and older
Race/Ethnicity Distribution of the Community

21
Socioeconomics Characteristics • The economic downturn had a negative impact on the community served, however, there is
progress toward a recovery. Since, 2012*:
– Median housing values increased 7.7%
– Median household income increased by 3.6%
– Foreclosure rate improved significantly, however, IL currently has the 2nd highest rate in the nation.
Kendall County has the fifth highest foreclosure rate in IL. 24
– Unemployment rates are also improving in the local counties, and continue to be comparable to the
IL and national rates (Kane = 6.1%; Kendall = 5.8%).
• Poverty rates in Kane County, Kendall County, IL, and U.S. have remained fairly consistent
since 2010.
Rush-Copley
PSA
Kane
County
Kendall
County IL U.S.
Median housing value – 2015 $200,439 $222,808 $232,133 $186,870 $191,227
Foreclosure rate (as of 3/2015)24 Not available 1:471 1:306 1:453 1:1,082
Median household income (2015) $69,436 $68,242 $81,045 $57,978 $53,706
% Unemployment rate (as of 3/2015)25 Not available 6.1 5.8 6.0 5.5
% Poverty rate of the total population (2013)22 Not available 11.1 4.8 14.1 15.4
% Achieved a bachelor’s degree or higher
(2015)
31% 32% 33% 31% 29%
Source: The Neilsen Company, unless otherwise noted, which can be found in the FY2016 RCMC CHNA Data and Information Book
*2012 data can be found in the FY2013 Rush-Copley Community Health Needs Assessment
22
Existing Health Care Facilities & Resources
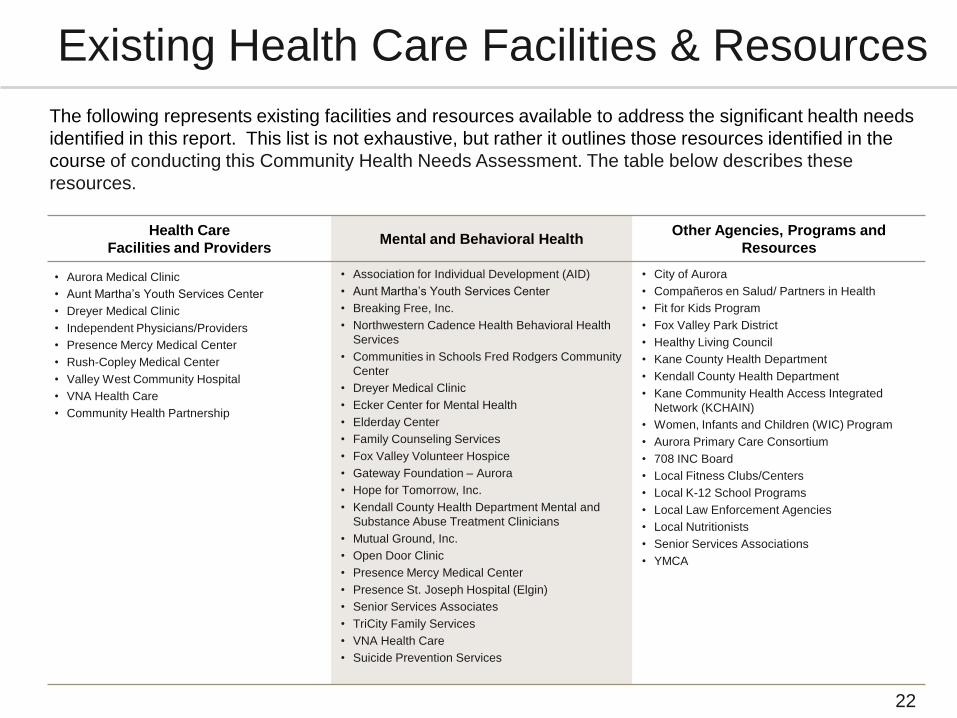
The following represents existing facilities and resources available to address the significant health needs
identified in this report. This list is not exhaustive, but rather it outlines those resources identified in the
course of conducting this Community Health Needs Assessment. The table below describes these
resources.
Health Care
Facilities and Providers Mental and Behavioral Health
Other Agencies, Programs and
Resources
• Aurora Medical Clinic
• Aunt Martha’s Youth Services Center
• Dreyer Medical Clinic
• Independent Physicians/Providers
• Presence Mercy Medical Center
• Rush-Copley Medical Center
• Valley West Community Hospital
• VNA Health Care
• Community Health Partnership
• Association for Individual Development (AID)
• Aunt Martha’s Youth Services Center
• Breaking Free, Inc.
• Northwestern Cadence Health Behavioral Health
Services
• Communities in Schools Fred Rodgers Community
Center
• Dreyer Medical Clinic
• Ecker Center for Mental Health
• Elderday Center
• Family Counseling Services
• Fox Valley Volunteer Hospice
• Gateway Foundation – Aurora
• Hope for Tomorrow, Inc.
• Kendall County Health Department Mental and
Substance Abuse Treatment Clinicians
• Mutual Ground, Inc.
• Open Door Clinic
• Presence Mercy Medical Center
• Presence St. Joseph Hospital (Elgin)
• Senior Services Associates
• TriCity Family Services
• VNA Health Care
• Suicide Prevention Services
• City of Aurora
• Compañeros en Salud/ Partners in Health
• Fit for Kids Program
• Fox Valley Park District
• Healthy Living Council
• Kane County Health Department
• Kendall County Health Department
• Kane Community Health Access Integrated
Network (KCHAIN)
• Women, Infants and Children (WIC) Program
• Aurora Primary Care Consortium
• 708 INC Board
• Local Fitness Clubs/Centers
• Local K-12 School Programs
• Local Law Enforcement Agencies
• Local Nutritionists
• Senior Services Associations
• YMCA
23
Identified Community
Health Needs

24
Identified and Prioritized Health Needs
• The Community Health Needs Steering Committee identified and prioritized the following
community needs using the process and methodology outlined on page 13 of this report.
• As part of a collaborative community process, the Committee agreed to include all of the
top health needs/threats identified by Kane County in their IPLAN.
Identified Community Health Needs (listed in order of importance from highest to lowest)
Obesity: Achieving a healthy weight through proper nutrition and exercise
Chronic disease1: Chronic disease self-management and preventative care
Access to care: Understanding insurance coverage and care options
Behavioral health, including mental health and substance abuse1
Access to care: Transportation for health care services
Income, job-ready workforce, and education1
1: Identified as one of the top three health priorities in the Kane County 2017-2020 IPLAN
Please note: At the time of the RCMC assessment process, Kendall County was in the beginning phases of their latest IPLAN and had not yet determined the top health needs in the County. Therefore, those needs are not identified in this
assessment. However, input provided by Kendall County was taken into consideration when determining the top health needs in the community served by RCMC.
25
Identified and Prioritized Health Needs
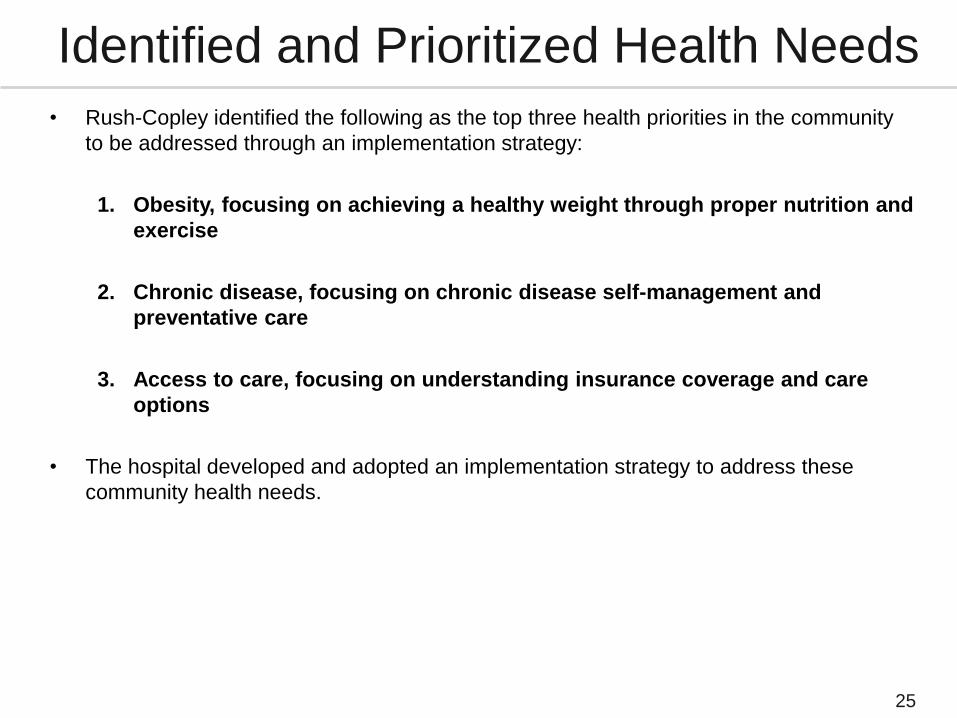
• Rush-Copley identified the following as the top three health priorities in the community
to be addressed through an implementation strategy:
1. Obesity, focusing on achieving a healthy weight through proper nutrition and
exercise
2. Chronic disease, focusing on chronic disease self-management and
preventative care
3. Access to care, focusing on understanding insurance coverage and care
options
• The hospital developed and adopted an implementation strategy to address these
community health needs.
26
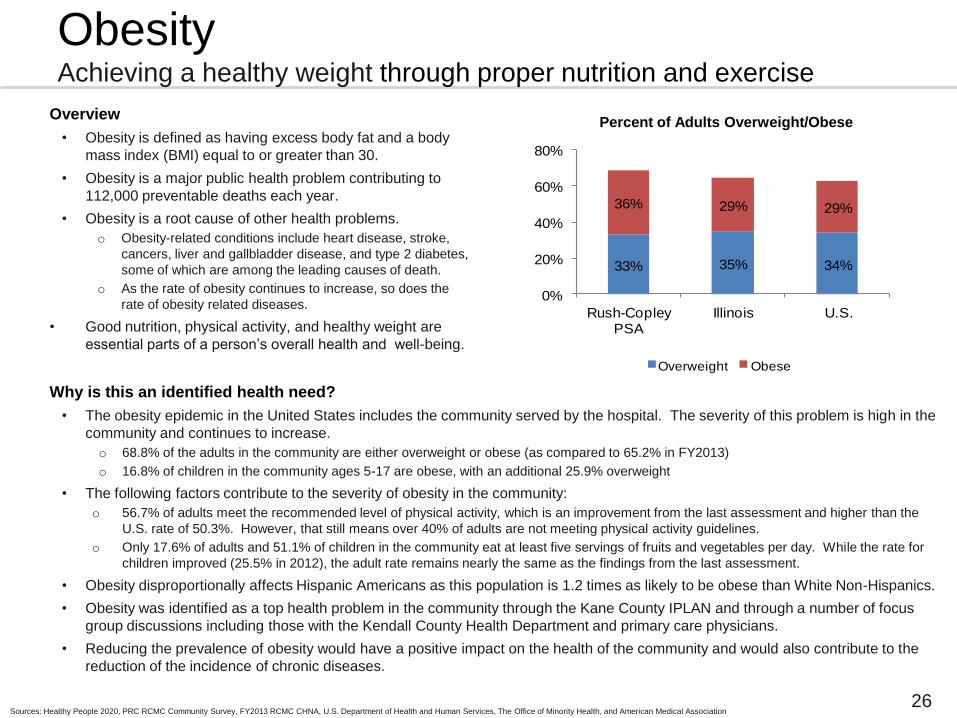
Overview
• Obesity is defined as having excess body fat and a body
mass index (BMI) equal to or greater than 30.
• Obesity is a major public health problem contributing to
112,000 preventable deaths each year.
• Obesity is a root cause of other health problems.
o Obesity-related conditions include heart disease, stroke,
cancers, liver and gallbladder disease, and type 2 diabetes,
some of which are among the leading causes of death.
o As the rate of obesity continues to increase, so does the
rate of obesity related diseases.
• Good nutrition, physical activity, and healthy weight are
essential parts of a person’s overall health and well-being.
Why is this an identified health need?
• The obesity epidemic in the United States includes the community served by the hospital. The severity of this problem is high in the
community and continues to increase.
o 68.8% of the adults in the community are either overweight or obese (as compared to 65.2% in FY2013)
o 16.8% of children in the community ages 5-17 are obese, with an additional 25.9% overweight
• The following factors contribute to the severity of obesity in the community:
o 56.7% of adults meet the recommended level of physical activity, which is an improvement from the last assessment and higher than the
U.S. rate of 50.3%. However, that still means over 40% of adults are not meeting physical activity guidelines.
o Only 17.6% of adults and 51.1% of children in the community eat at least five servings of fruits and vegetables per day. While the rate for
children improved (25.5% in 2012), the adult rate remains nearly the same as the findings from the last assessment.
• Obesity disproportionally affects Hispanic Americans as this population is 1.2 times as likely to be obese than White Non-Hispanics.
• Obesity was identified as a top health problem in the community through the Kane County IPLAN and through a number of focus
group discussions including those with the Kendall County Health Department and primary care physicians.
• Reducing the prevalence of obesity would have a positive impact on the health of the community and would also contribute to the
reduction of the incidence of chronic diseases.
33% 35% 34%
36% 29% 29%
0%
20%
40%
60%
80%
Rush-Copley PSA
Illinois U.S.
Overweight Obese
Percent of Adults Overweight/Obese
Sources: Healthy People 2020, PRC RCMC Community Survey, FY2013 RCMC CHNA, U.S. Department of Health and Human Services, The Office of Minority Health, and American Medical Association
Obesity Achieving a healthy weight through proper nutrition and exercise
27
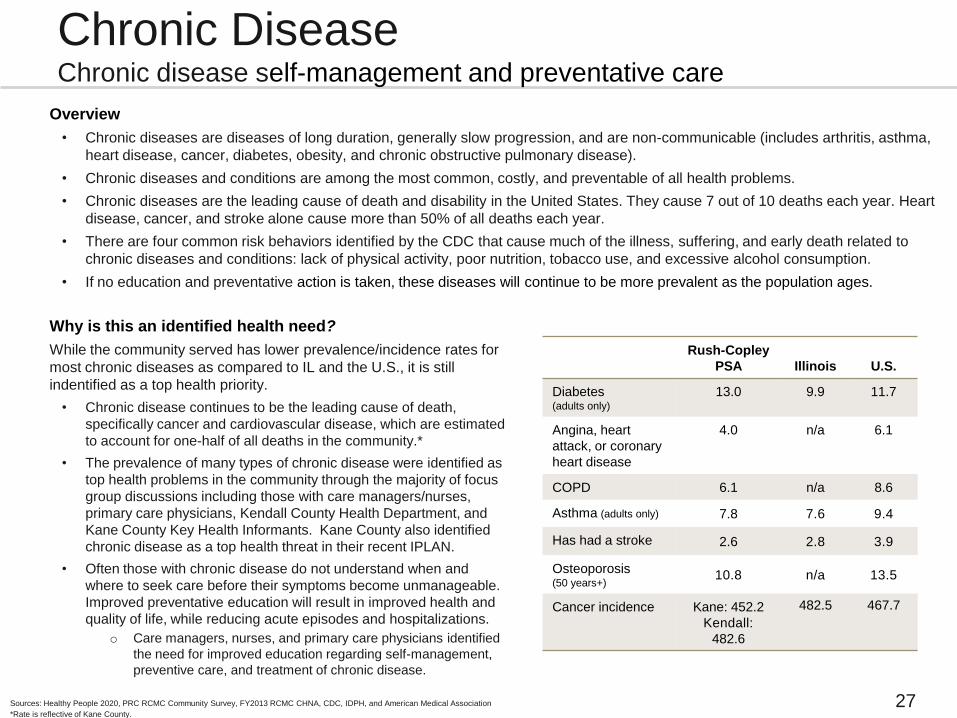
Chronic Disease Chronic disease self-management and preventative care
Rush-Copley
PSA Illinois U.S.
Diabetes (adults only)
13.0 9.9 11.7
Angina, heart
attack, or coronary
heart disease
4.0 n/a 6.1
COPD 6.1 n/a 8.6
Asthma (adults only) 7.8 7.6 9.4
Has had a stroke 2.6 2.8 3.9
Osteoporosis (50 years+)
10.8 n/a 13.5
Cancer incidence Kane: 452.2
Kendall:
482.6
482.5 467.7
Overview
• Chronic diseases are diseases of long duration, generally slow progression, and are non-communicable (includes arthritis, asthma,
heart disease, cancer, diabetes, obesity, and chronic obstructive pulmonary disease).
• Chronic diseases and conditions are among the most common, costly, and preventable of all health problems.
• Chronic diseases are the leading cause of death and disability in the United States. They cause 7 out of 10 deaths each year. Heart
disease, cancer, and stroke alone cause more than 50% of all deaths each year.
• There are four common risk behaviors identified by the CDC that cause much of the illness, suffering, and early death related to
chronic diseases and conditions: lack of physical activity, poor nutrition, tobacco use, and excessive alcohol consumption.
• If no education and preventative action is taken, these diseases will continue to be more prevalent as the population ages.
Why is this an identified health need?
While the community served has lower prevalence/incidence rates for
most chronic diseases as compared to IL and the U.S., it is still
indentified as a top health priority.
• Chronic disease continues to be the leading cause of death,
specifically cancer and cardiovascular disease, which are estimated
to account for one-half of all deaths in the community.*
• The prevalence of many types of chronic disease were identified as
top health problems in the community through the majority of focus
group discussions including those with care managers/nurses,
primary care physicians, Kendall County Health Department, and
Kane County Key Health Informants. Kane County also identified
chronic disease as a top health threat in their recent IPLAN.
• Often those with chronic disease do not understand when and
where to seek care before their symptoms become unmanageable.
Improved preventative education will result in improved health and
quality of life, while reducing acute episodes and hospitalizations.
o Care managers, nurses, and primary care physicians identified
the need for improved education regarding self-management,
preventive care, and treatment of chronic disease.
Sources: Healthy People 2020, PRC RCMC Community Survey, FY2013 RCMC CHNA, CDC, IDPH, and American Medical Association
*Rate is reflective of Kane County.

28
Access to Care Understanding insurance coverage and care options
Overview
• Regardless of age, geography, or socioeconomic
circumstance, quality health care should be available to
everyone.
o Access to care is important for the achievement of
health equity and for increasing the quality of a healthy
life for everyone.
o Access to health services encompasses four
components: coverage, services, timeliness, and
workforce.
o Barriers and disparities in access to health services
negatively affect individuals and society.
• Barriers to care and health services include:
o Lack of availability
o High costs and lack of insurance coverage
o Language and cultural barriers
o Lack of transportation
• In addition to the barriers listed above, a critical component
of access is being able to effectively navigate the health
care system. This means understanding insurance
coverage, the health care services and care options
available, and how to receive care in the appropriate setting.
11.9
19.4
15.1
0
5
10
15
20
25
Adults (age 18-64)
Rush-Copley PSA Illinois U.S.
Percent of Adults ages 18-64
Who Lack Health Insurance
Sources: Healthy People 2020, Robert Wood Johnson Foundation, Kaiser Health News, “Many Patients Struggling to Understand New Health Insurance”, http://obamacarefacts.com, JAMA, “Why Health Insurance Literacy Matters”
Rush-
Copley
PSA U.S.
% of adults who had difficultly accessing
health care in the past year (composite)
34.6 39.9
% due to inconvenient hours 14.7 15.4
% cost prevented physician visit 13.6 18.2
% difficulty finding a physician 8.9 11.0
% transportation hindered physician
visit
6.1 9.4
% of adults who have a specific source
of ongoing care
76.2 76.3
% of adults that had two or more ER
visits in the past year 8.9 8.9
29
Access to Care Understanding insurance coverage and care options
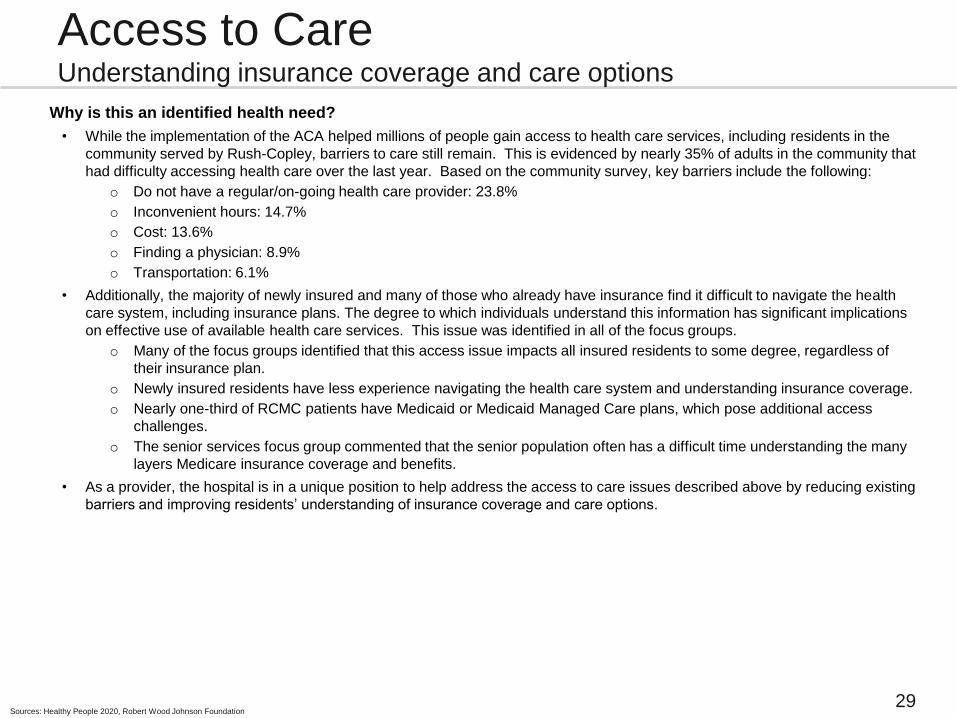
Why is this an identified health need?
• While the implementation of the ACA helped millions of people gain access to health care services, including residents in the
community served by Rush-Copley, barriers to care still remain. This is evidenced by nearly 35% of adults in the community that
had difficulty accessing health care over the last year. Based on the community survey, key barriers include the following:
o Do not have a regular/on-going health care provider: 23.8%
o Inconvenient hours: 14.7%
o Cost: 13.6%
o Finding a physician: 8.9%
o Transportation: 6.1%
• Additionally, the majority of newly insured and many of those who already have insurance find it difficult to navigate the health
care system, including insurance plans. The degree to which individuals understand this information has significant implications
on effective use of available health care services. This issue was identified in all of the focus groups.
o Many of the focus groups identified that this access issue impacts all insured residents to some degree, regardless of
their insurance plan.
o Newly insured residents have less experience navigating the health care system and understanding insurance coverage.
o Nearly one-third of RCMC patients have Medicaid or Medicaid Managed Care plans, which pose additional access
challenges.
o The senior services focus group commented that the senior population often has a difficult time understanding the many
layers Medicare insurance coverage and benefits.
• As a provider, the hospital is in a unique position to help address the access to care issues described above by reducing existing
barriers and improving residents’ understanding of insurance coverage and care options.
Sources: Healthy People 2020, Robert Wood Johnson Foundation

30
Evaluation of Impact of the
FY13 Implementation Strategy
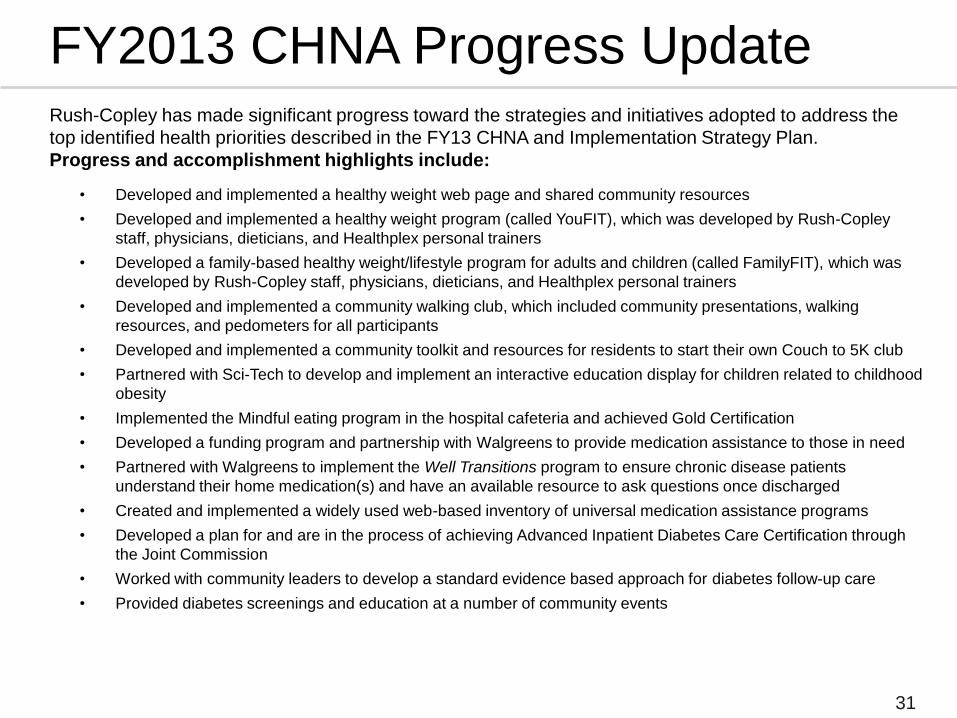
Rush-Copley has made significant progress toward the strategies and initiatives adopted to address the
top identified health priorities described in the FY13 CHNA and Implementation Strategy Plan.
Progress and accomplishment highlights include:
• Developed and implemented a healthy weight web page and shared community resources
• Developed and implemented a healthy weight program (called YouFIT), which was developed by Rush-Copley
staff, physicians, dieticians, and Healthplex personal trainers
• Developed a family-based healthy weight/lifestyle program for adults and children (called FamilyFIT), which was
developed by Rush-Copley staff, physicians, dieticians, and Healthplex personal trainers
• Developed and implemented a community walking club, which included community presentations, walking
resources, and pedometers for all participants
• Developed and implemented a community toolkit and resources for residents to start their own Couch to 5K club
• Partnered with Sci-Tech to develop and implement an interactive education display for children related to childhood
obesity
• Implemented the Mindful eating program in the hospital cafeteria and achieved Gold Certification
• Developed a funding program and partnership with Walgreens to provide medication assistance to those in need
• Partnered with Walgreens to implement the Well Transitions program to ensure chronic disease patients
understand their home medication(s) and have an available resource to ask questions once discharged
• Created and implemented a widely used web-based inventory of universal medication assistance programs
• Developed a plan for and are in the process of achieving Advanced Inpatient Diabetes Care Certification through
the Joint Commission
• Worked with community leaders to develop a standard evidence based approach for diabetes follow-up care
• Provided diabetes screenings and education at a number of community events
31
FY2013 CHNA Progress Update
32
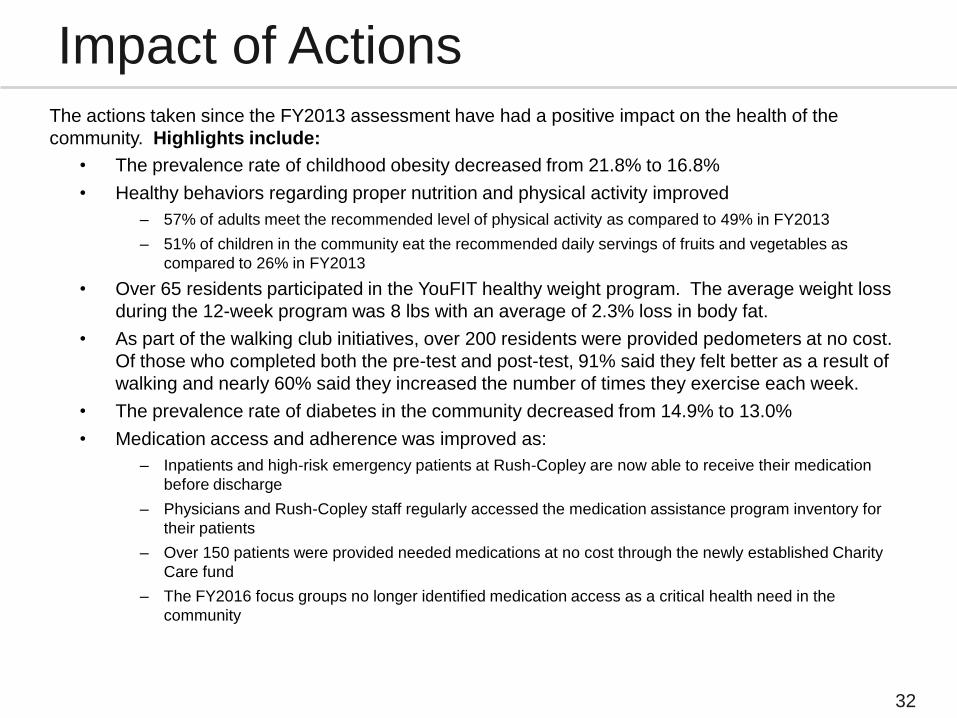
Impact of Actions The actions taken since the FY2013 assessment have had a positive impact on the health of the
community. Highlights include:
• The prevalence rate of childhood obesity decreased from 21.8% to 16.8%
• Healthy behaviors regarding proper nutrition and physical activity improved
– 57% of adults meet the recommended level of physical activity as compared to 49% in FY2013
– 51% of children in the community eat the recommended daily servings of fruits and vegetables as
compared to 26% in FY2013
• Over 65 residents participated in the YouFIT healthy weight program. The average weight loss
during the 12-week program was 8 lbs with an average of 2.3% loss in body fat.
• As part of the walking club initiatives, over 200 residents were provided pedometers at no cost.
Of those who completed both the pre-test and post-test, 91% said they felt better as a result of
walking and nearly 60% said they increased the number of times they exercise each week.
• The prevalence rate of diabetes in the community decreased from 14.9% to 13.0%
• Medication access and adherence was improved as:
– Inpatients and high-risk emergency patients at Rush-Copley are now able to receive their medication
before discharge
– Physicians and Rush-Copley staff regularly accessed the medication assistance program inventory for
their patients
– Over 150 patients were provided needed medications at no cost through the newly established Charity
Care fund
– The FY2016 focus groups no longer identified medication access as a critical health need in the
community


