Community Energy Master Planning Arlington County (VA ...
56
Community Energy Master Planning Community Energy Master Planning Arlington County (VA) & City of Holland (MI) © Garforth International llc Army Net Zero Conference 18-20th January 2012, Chicago, Illinois Creating Globally Competitive Communities
Transcript of Community Energy Master Planning Arlington County (VA ...
Community Energy Master PlanningCommunity Energy Master Planning
Arlington County (VA) & City of Holland (MI)
© Garforth International llc
Army Net Zero Conference18-20th January 2012, Chicago, Illinois
Creating Globally Competitive Communities
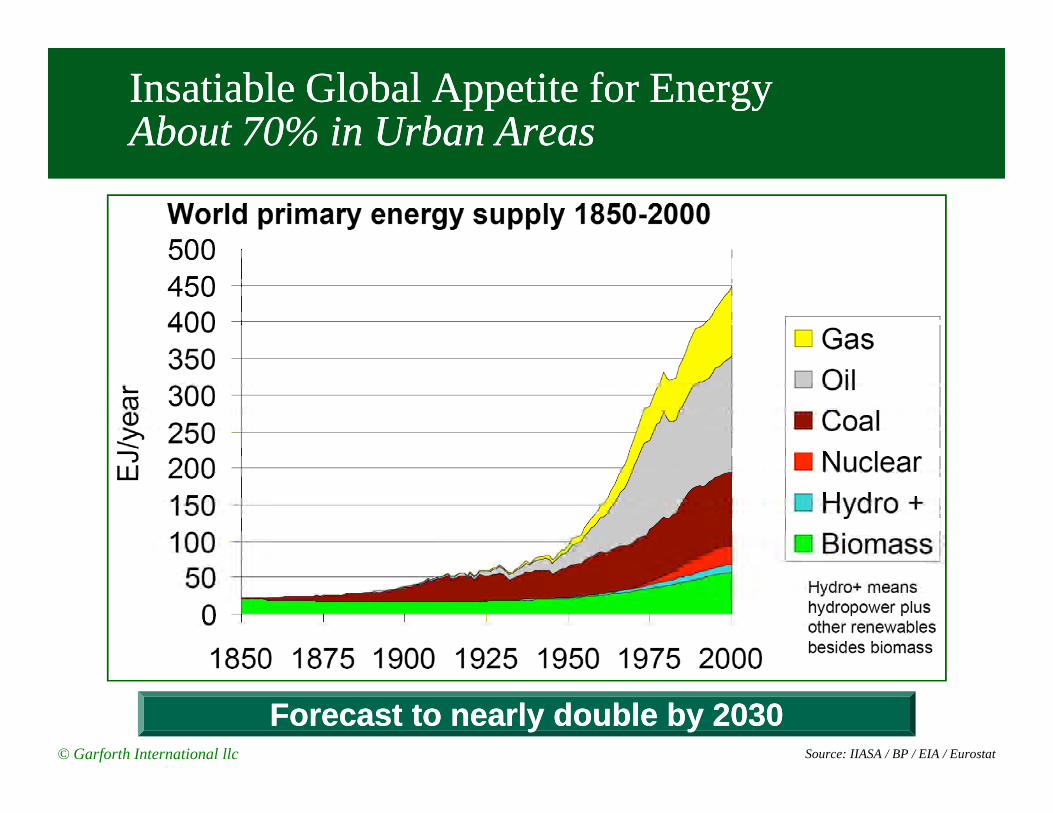
Insatiable Global Appetite for EnergyInsatiable Global Appetite for EnergyAbout 70% in Urban AreasAbout 70% in Urban Areas
© Garforth International llc
Forecast to Forecast to nearly double nearly double by 2030by 2030Source: IIASA / BP / EIA / Eurostat
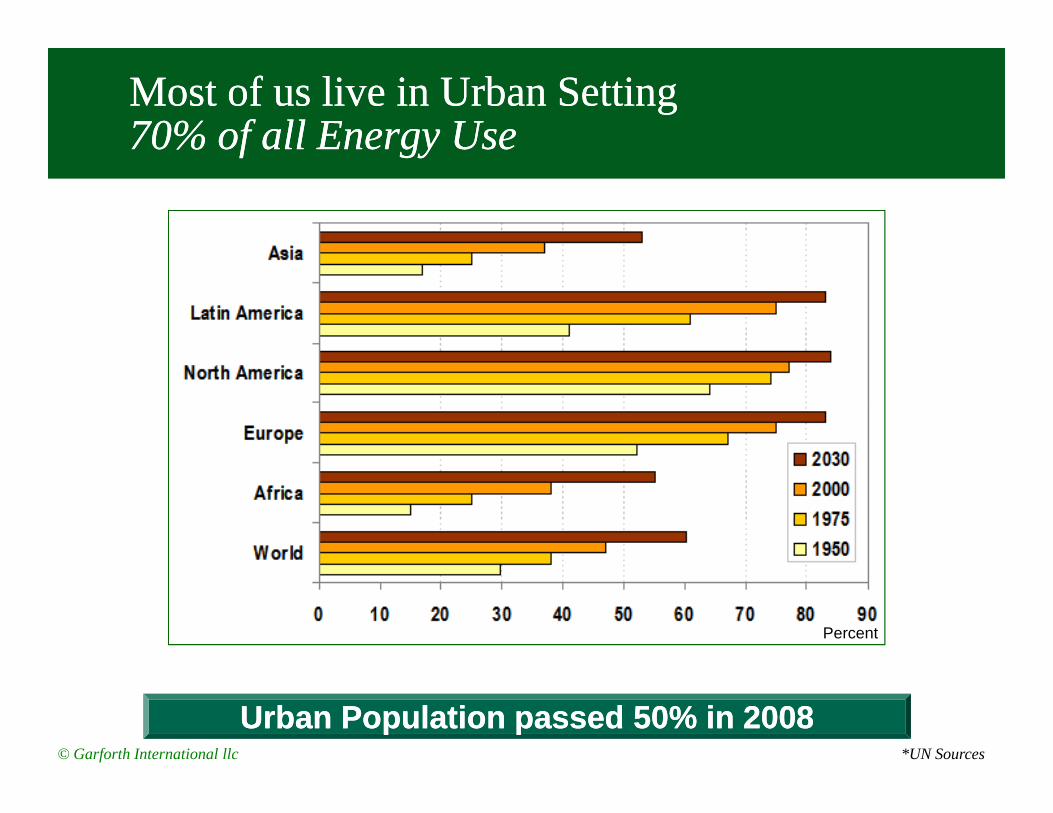
Most of us live in Urban SettingMost of us live in Urban Setting70% of all Energy Use70% of all Energy Use
© Garforth International llc *UN Sources
Urban Population passed 50% in 2008Urban Population passed 50% in 2008
Percent
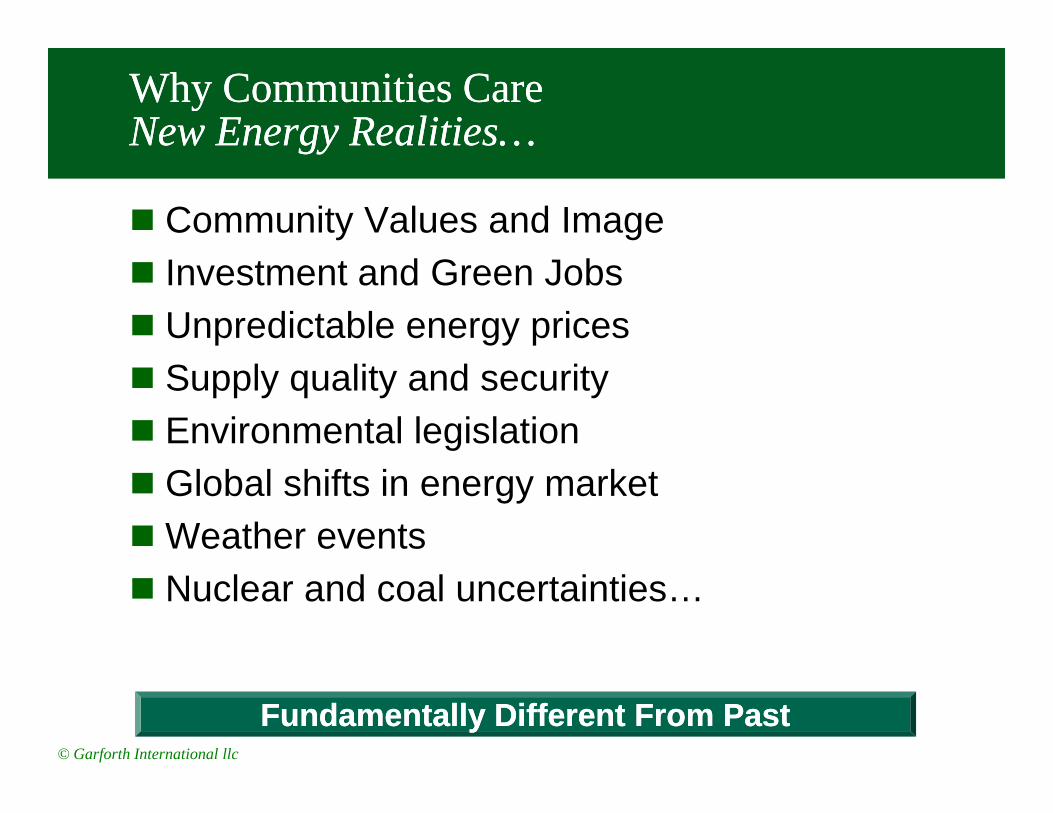
Why Communities CareWhy Communities CareNew Energy Realities…New Energy Realities…
� Community Values and Image� Investment and Green Jobs� Unpredictable energy prices� Supply quality and security
© Garforth International llc
� Environmental legislation � Global shifts in energy market� Weather events� Nuclear and coal uncertainties…
Fundamentally Different From PastFundamentally Different From Past
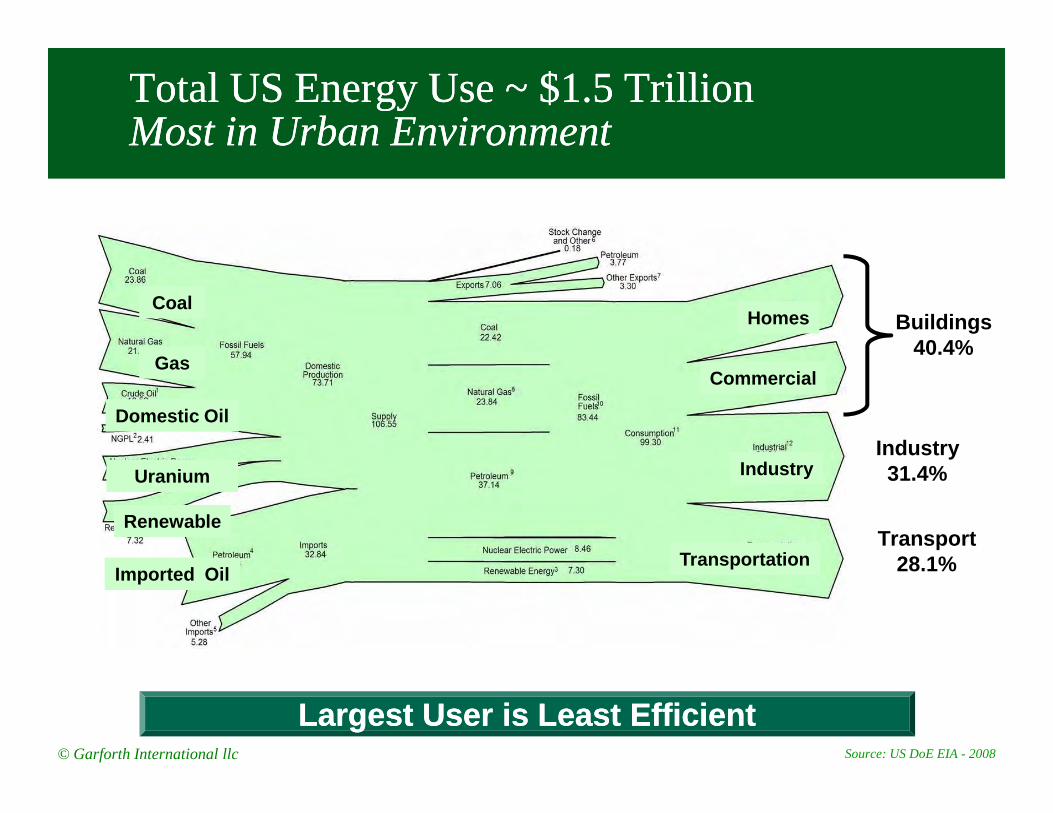
Total US Energy Total US Energy Use ~ $1.5 TrillionUse ~ $1.5 TrillionMost in Urban EnvironmentMost in Urban Environment
Buildings40.4%
CoalCoal
GasGas
Domestic OilDomestic Oil
HomesHomes
CommercialCommercial
© Garforth International llc Source: US DoE EIA - 2008
Industry31.4%
Transport28.1%
Domestic OilDomestic Oil
Imported OilImported Oil
UraniumUranium
RenewableRenewable
IndustryIndustry
TransportationTransportation
Largest User is Largest User is Least EfficientLeast Efficient
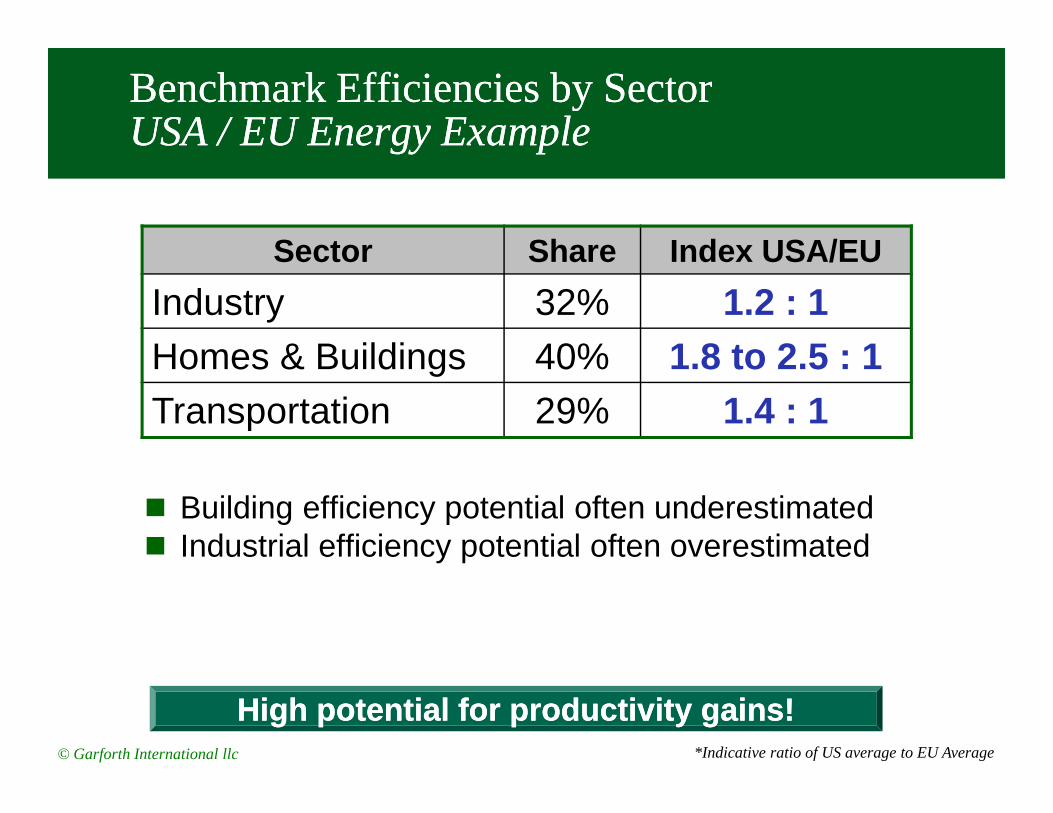
Benchmark Efficiencies by SectorBenchmark Efficiencies by SectorUSA / EU Energy ExampleUSA / EU Energy Example
Sector Share Index USA/EU
Industry 32% 1.2 : 1Homes & Buildings 40% 1.8 to 2.5 : 1Transportation 29% 1.4 : 1
© Garforth International llc
� Building efficiency potential often underestimated� Industrial efficiency potential often overestimated
Transportation 29% 1.4 : 1
High potential for productivity gains!High potential for productivity gains!*Indicative ratio of US average to EU Average
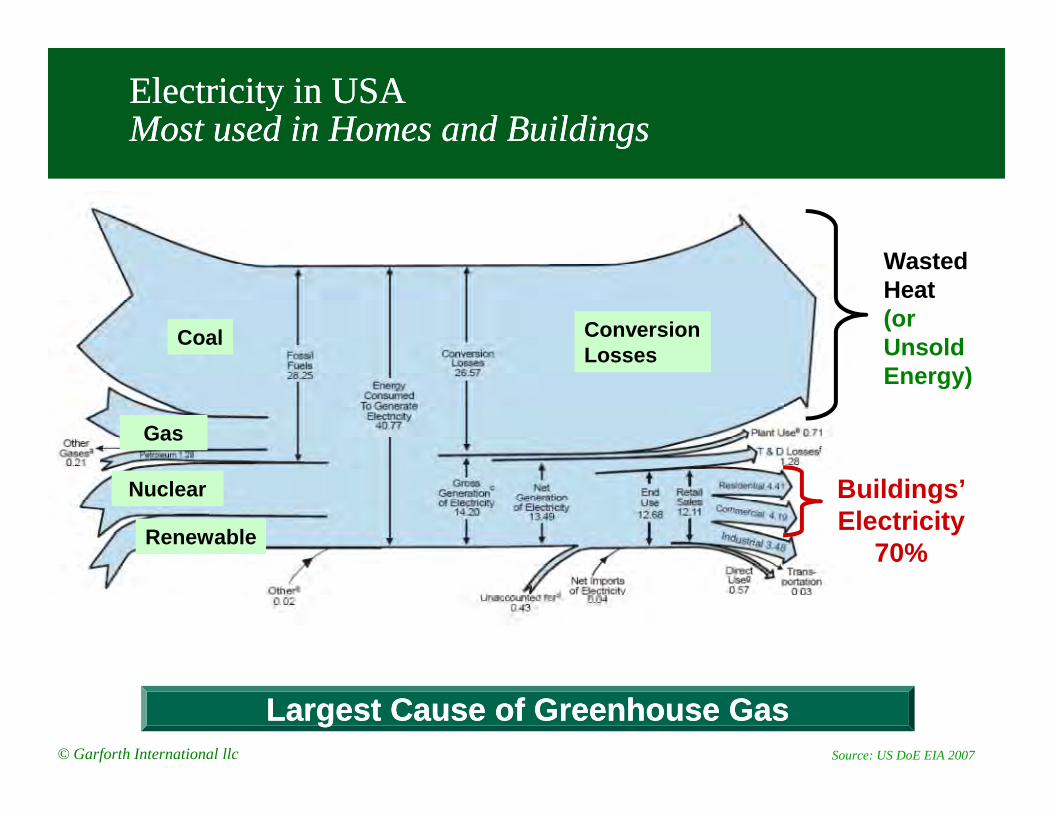
Electricity in USAElectricity in USAMost used in Homes and BuildingsMost used in Homes and Buildings
Coal ConversionLosses
Wasted Heat (or Unsold Energy)
© Garforth International llc
Largest Cause of Greenhouse GasLargest Cause of Greenhouse GasSource: US DoE EIA 2007
Gas
Nuclear
Renewable
Buildings’Electricity
70%
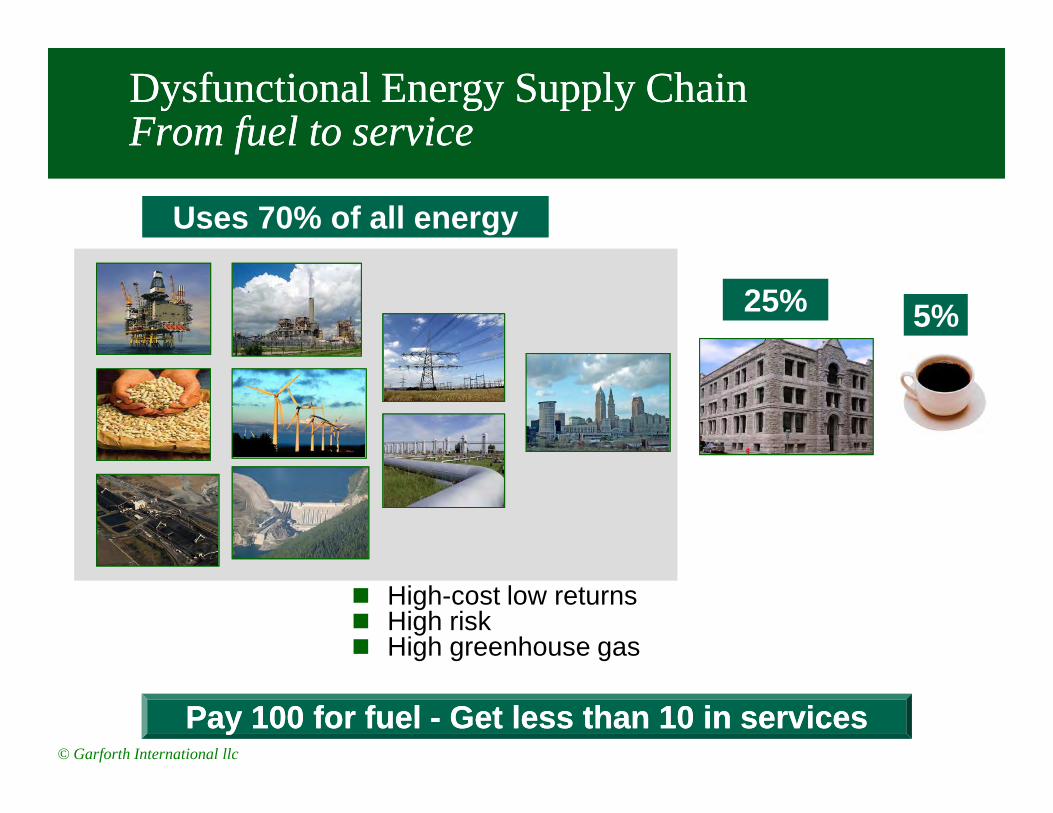
Dysfunctional Energy Supply ChainDysfunctional Energy Supply ChainFrom fuel to serviceFrom fuel to service
Uses 70% of all energy
25% 5%
© Garforth International llc
� High-cost low returns� High risk� High greenhouse gas
Pay 100 for fuel Pay 100 for fuel -- Get less than 10 in servicesGet less than 10 in services
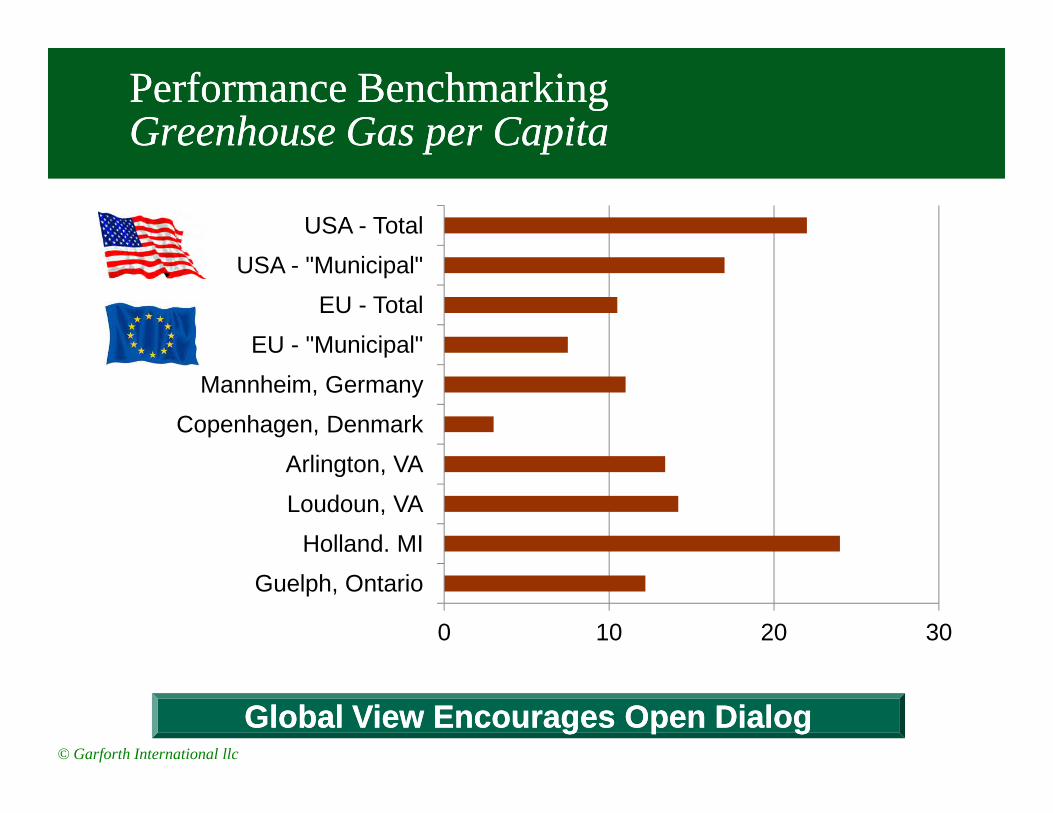
Mannheim, Germany
EU - "Municipal"
EU - Total
USA - "Municipal"
USA - Total
Performance Benchmarking Performance Benchmarking Greenhouse Gas per CapitaGreenhouse Gas per Capita
© Garforth International llc
0 10 20 30
Guelph, Ontario
Holland. MI
Loudoun, VA
Arlington, VA
Copenhagen, Denmark
Global View Encourages Open DialogGlobal View Encourages Open Dialog
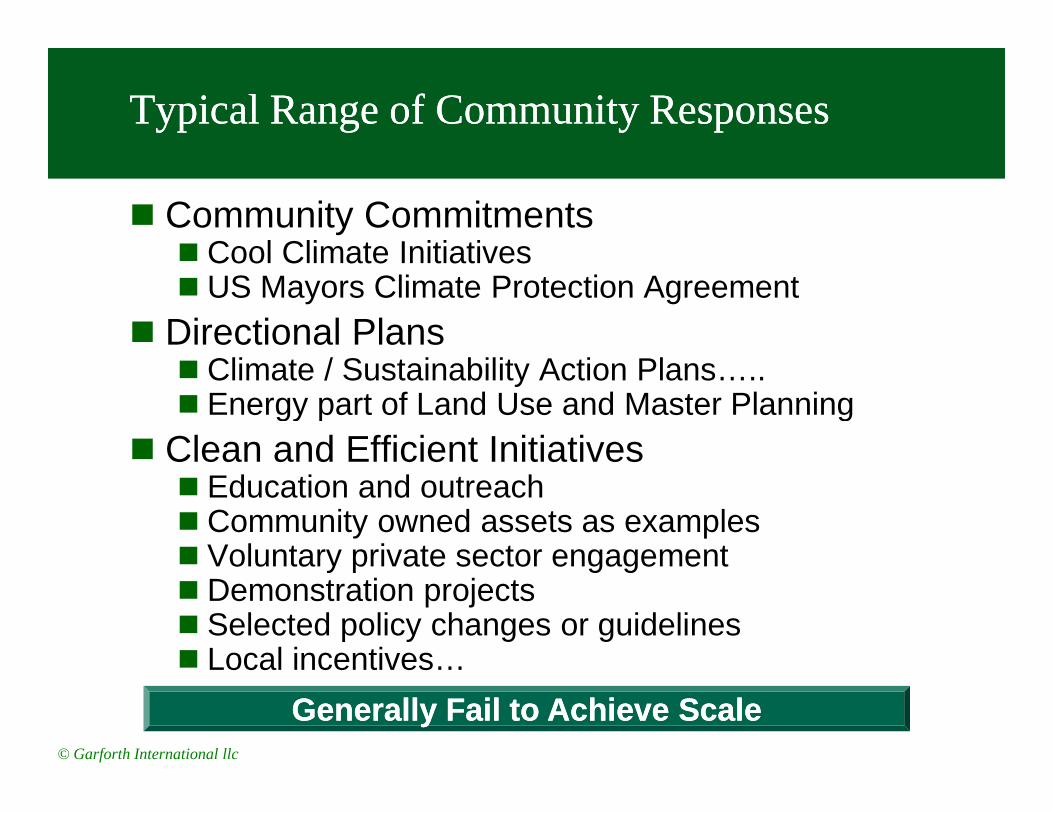
Typical Range of Community ResponsesTypical Range of Community Responses
� Community Commitments� Cool Climate Initiatives� US Mayors Climate Protection Agreement
� Directional Plans� Climate / Sustainability Action Plans…..� Energy part of Land Use and Master Planning
© Garforth International llc
� Energy part of Land Use and Master Planning
� Clean and Efficient Initiatives� Education and outreach� Community owned assets as examples� Voluntary private sector engagement� Demonstration projects� Selected policy changes or guidelines� Local incentives…
Generally Fail to Achieve ScaleGenerally Fail to Achieve Scale
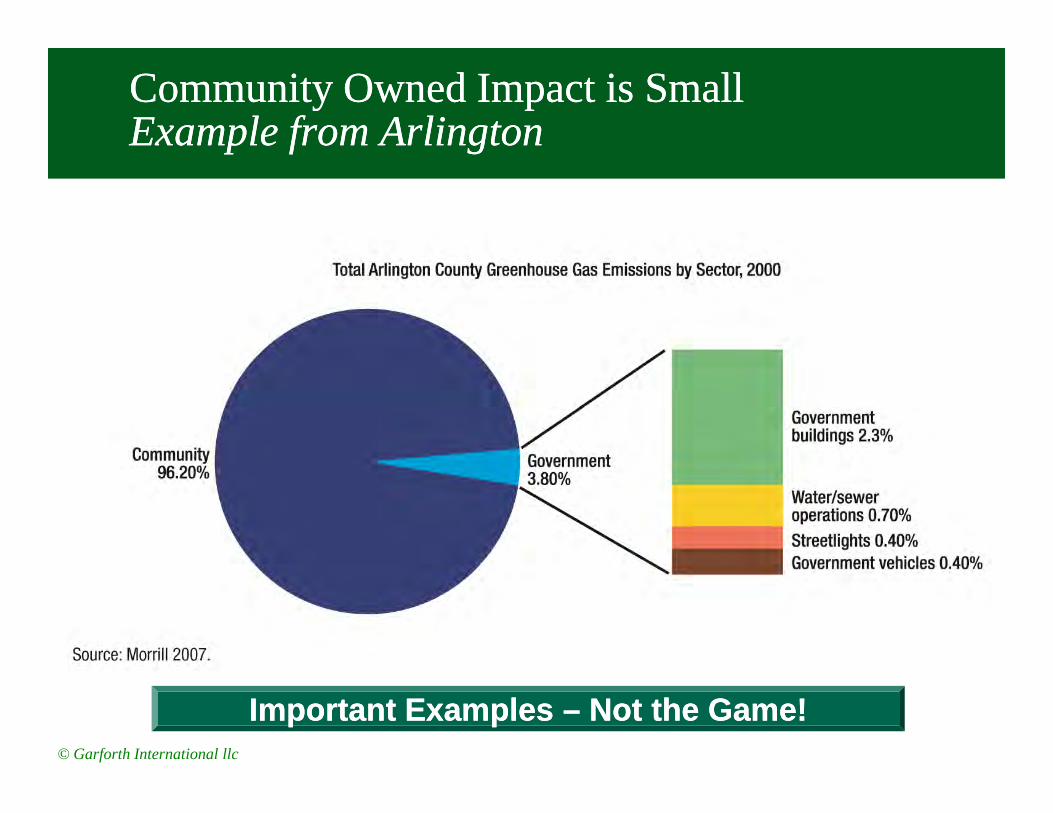
Community Owned Impact is SmallCommunity Owned Impact is SmallExample from ArlingtonExample from Arlington
© Garforth International llc
Important Examples Important Examples –– Not the Not the GameGame!!
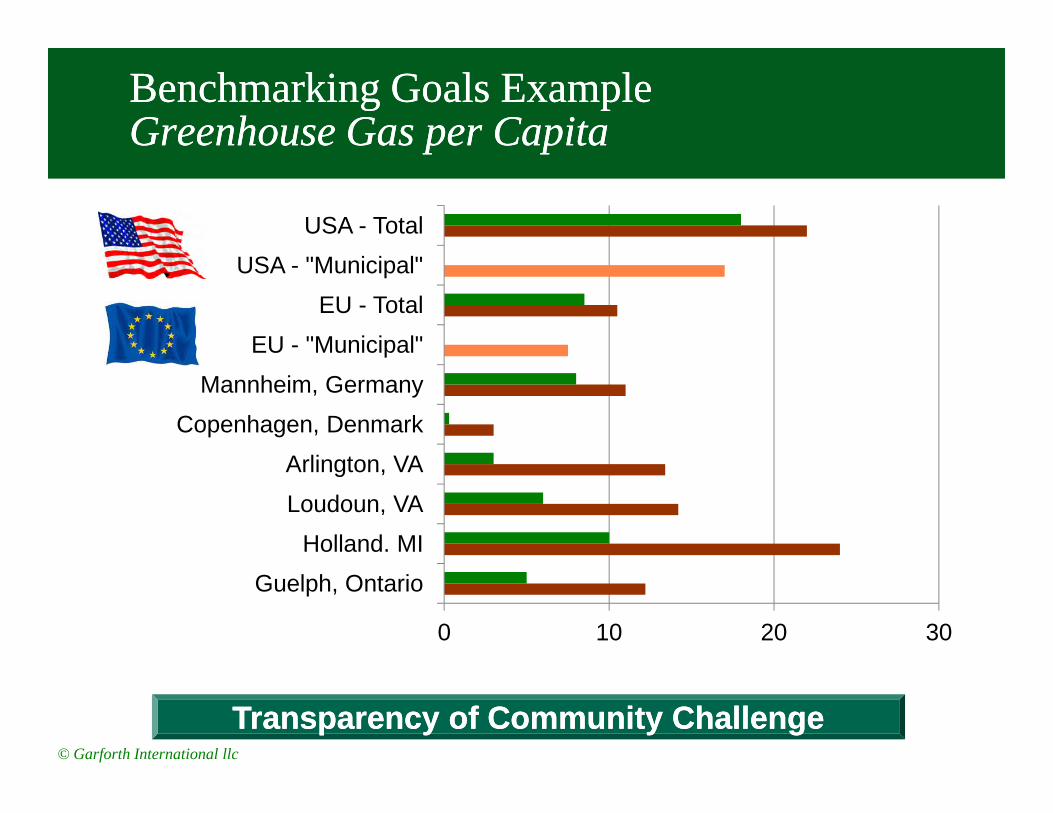
Mannheim, Germany
EU - "Municipal"
EU - Total
USA - "Municipal"
USA - Total
Benchmarking Goals ExampleBenchmarking Goals ExampleGreenhouse Gas per CapitaGreenhouse Gas per Capita
© Garforth International llc
0 10 20 30
Guelph, Ontario
Holland. MI
Loudoun, VA
Arlington, VA
Copenhagen, Denmark
Transparency of Community ChallengeTransparency of Community Challenge
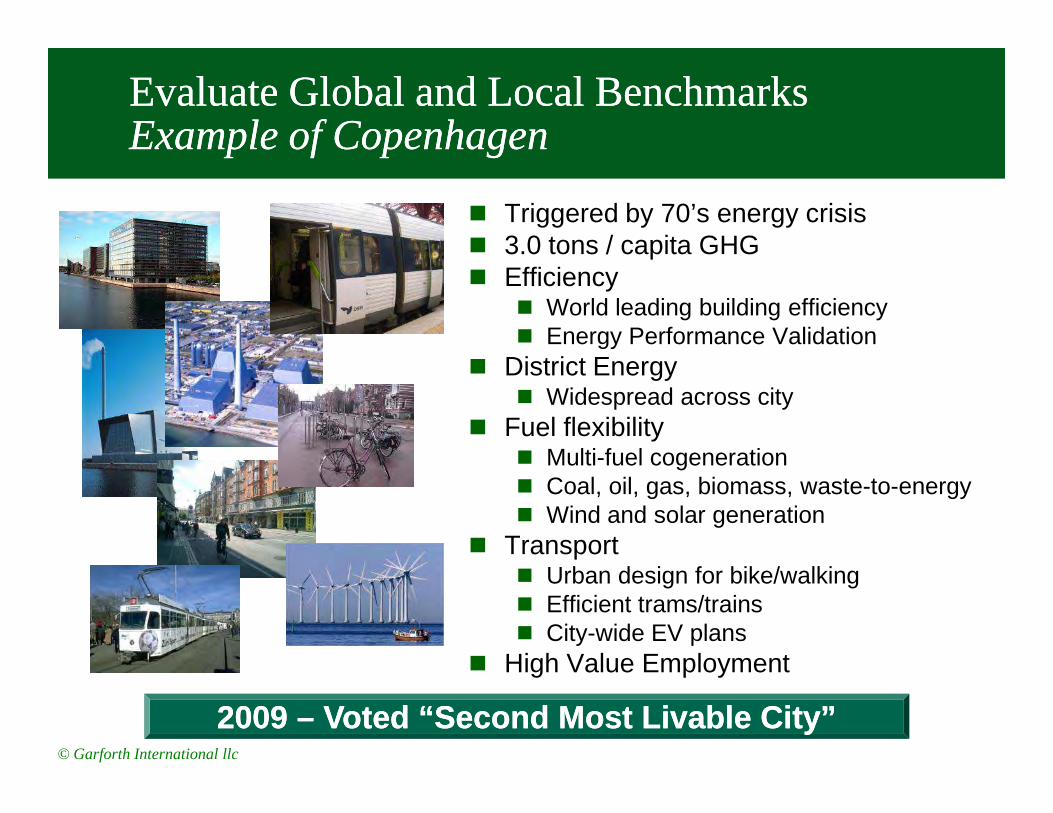
Evaluate Global and Local BenchmarksEvaluate Global and Local BenchmarksExample of CopenhagenExample of Copenhagen
� Triggered by 70’s energy crisis� 3.0 tons / capita GHG� Efficiency
� World leading building efficiency� Energy Performance Validation
� District Energy� Widespread across city
© Garforth International llc
� Widespread across city� Fuel flexibility
� Multi-fuel cogeneration� Coal, oil, gas, biomass, waste-to-energy� Wind and solar generation
� Transport� Urban design for bike/walking� Efficient trams/trains� City-wide EV plans
� High Value Employment
2009 2009 –– Voted “Second Most Livable City”Voted “Second Most Livable City”
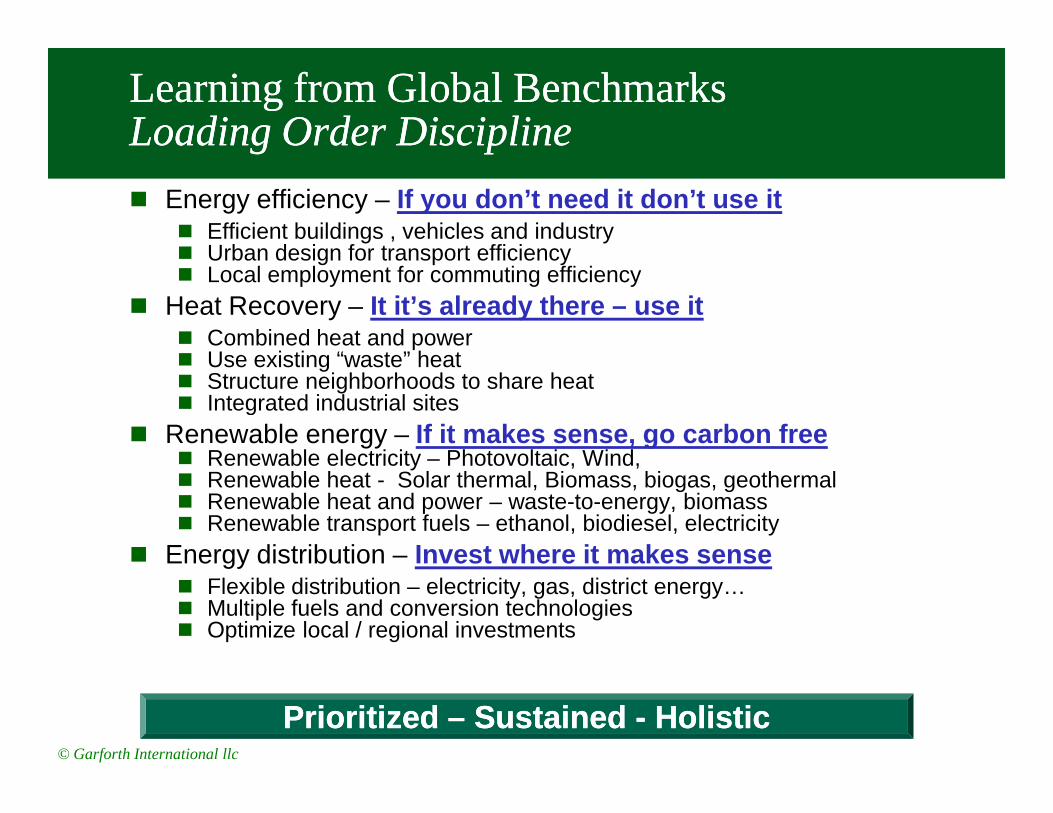
� Energy efficiency – If you don’t need it don’t use it� Efficient buildings , vehicles and industry� Urban design for transport efficiency� Local employment for commuting efficiency
� Heat Recovery – It it’s already there – use it� Combined heat and power � Use existing “waste” heat� Structure neighborhoods to share heat� Integrated industrial sites
Learning from Global BenchmarksLearning from Global BenchmarksLoading Order DisciplineLoading Order Discipline
© Garforth International llc
� Integrated industrial sites � Renewable energy – If it makes sense, go carbon free
� Renewable electricity – Photovoltaic, Wind, � Renewable heat - Solar thermal, Biomass, biogas, geothermal� Renewable heat and power – waste-to-energy, biomass� Renewable transport fuels – ethanol, biodiesel, electricity
� Energy distribution – Invest where it makes sense� Flexible distribution – electricity, gas, district energy…� Multiple fuels and conversion technologies� Optimize local / regional investments
Prioritized Prioritized –– Sustained Sustained -- HolisticHolistic
Arlington Community Arlington Community Energy and Sustainability PlanEnergy and Sustainability Plan
Competitive Community of the FutureCompetitive Community of the Future
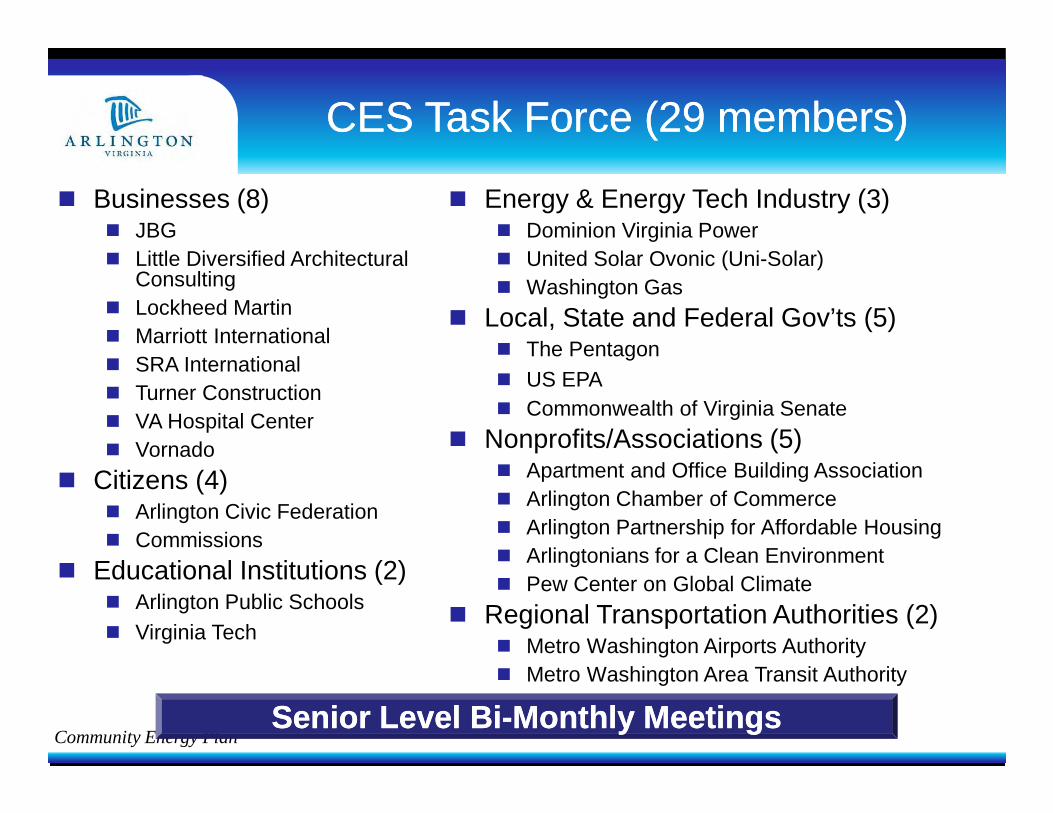
CES Task Force (29 members)CES Task Force (29 members)
� Businesses (8)� JBG� Little Diversified Architectural
Consulting� Lockheed Martin� Marriott International� SRA International� Turner Construction
� Energy & Energy Tech Industry (3)� Dominion Virginia Power� United Solar Ovonic (Uni-Solar)� Washington Gas
� Local, State and Federal Gov’ts (5)� The Pentagon� US EPA� Commonwealth of Virginia Senate
Community Energy Plan
� VA Hospital Center� Vornado
� Citizens (4)� Arlington Civic Federation� Commissions
� Educational Institutions (2)� Arlington Public Schools� Virginia Tech
� Commonwealth of Virginia Senate
� Nonprofits/Associations (5)� Apartment and Office Building Association� Arlington Chamber of Commerce� Arlington Partnership for Affordable Housing � Arlingtonians for a Clean Environment� Pew Center on Global Climate
� Regional Transportation Authorities (2)� Metro Washington Airports Authority� Metro Washington Area Transit Authority
Senior Level BiSenior Level Bi--Monthly MeetingsMonthly Meetings
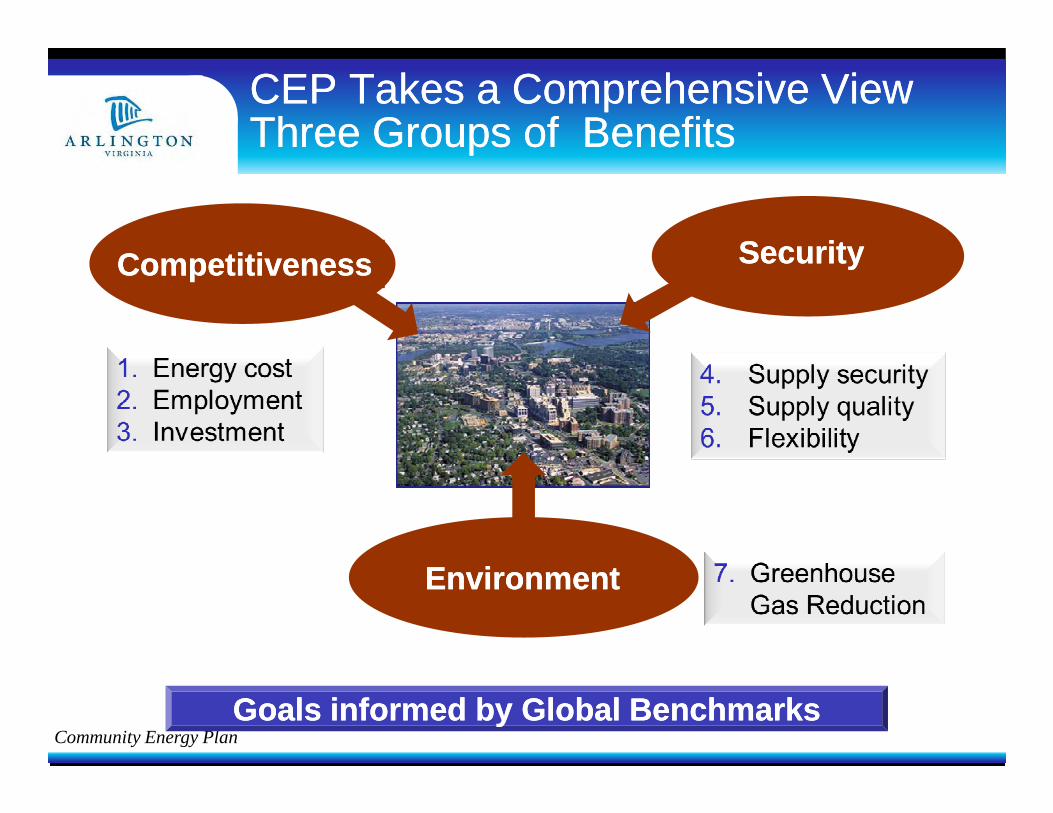
CEP Takes a Comprehensive ViewCEP Takes a Comprehensive ViewThree Groups of BenefitsThree Groups of Benefits
CompetitivenessCompetitiveness SecuritySecurity
Community Energy PlanGoals informed by Global BenchmarksGoals informed by Global Benchmarks
EnvironmentEnvironment

� Affordable, reliable energy supplies � Flexible to meet changing technologies,
legislation and market conditions� Meet investor, employer and resident needs� Meet Arlington’s “Cool County” commitment
Community Energy PlanCommunity Energy Plan2011 to 2050 Goals2011 to 2050 Goals
Community Energy Plan
� Meet Arlington’s “Cool County” commitment
Headline MeasurementReduce Arlington’s annual GHG emissions to 3.0 mt CO2e per capita by 2050. If an effective regional energy plan is
put in place, achieve 2.2 mt CO2e per capita per year.
Headline MeasurementReduce Arlington’s annual GHG emissions to 3.0 mt CO2e per capita by 2050. If an effective regional energy plan is
put in place, achieve 2.2 mt CO2e per capita per year.
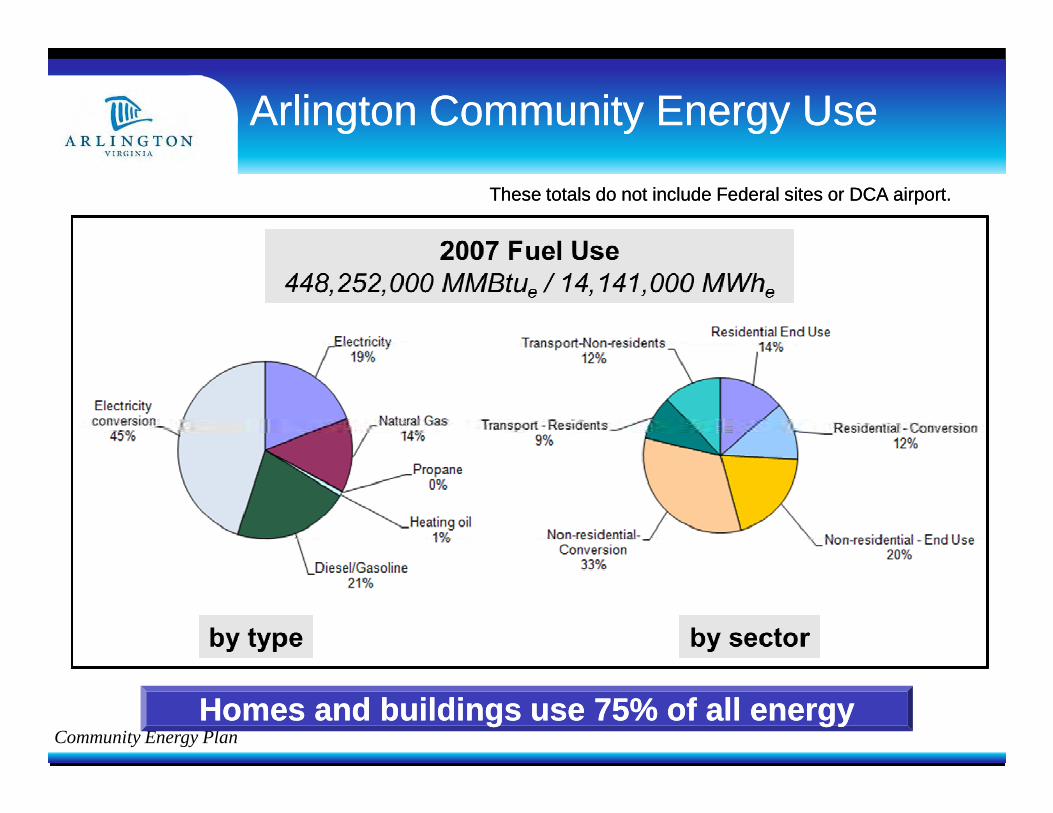
Arlington Community Energy UseArlington Community Energy Use
These totals do not include Federal sites or DCA airport.These totals do not include Federal sites or DCA airport.
Community Energy PlanHomes and buildings use 75% of all energyHomes and buildings use 75% of all energy
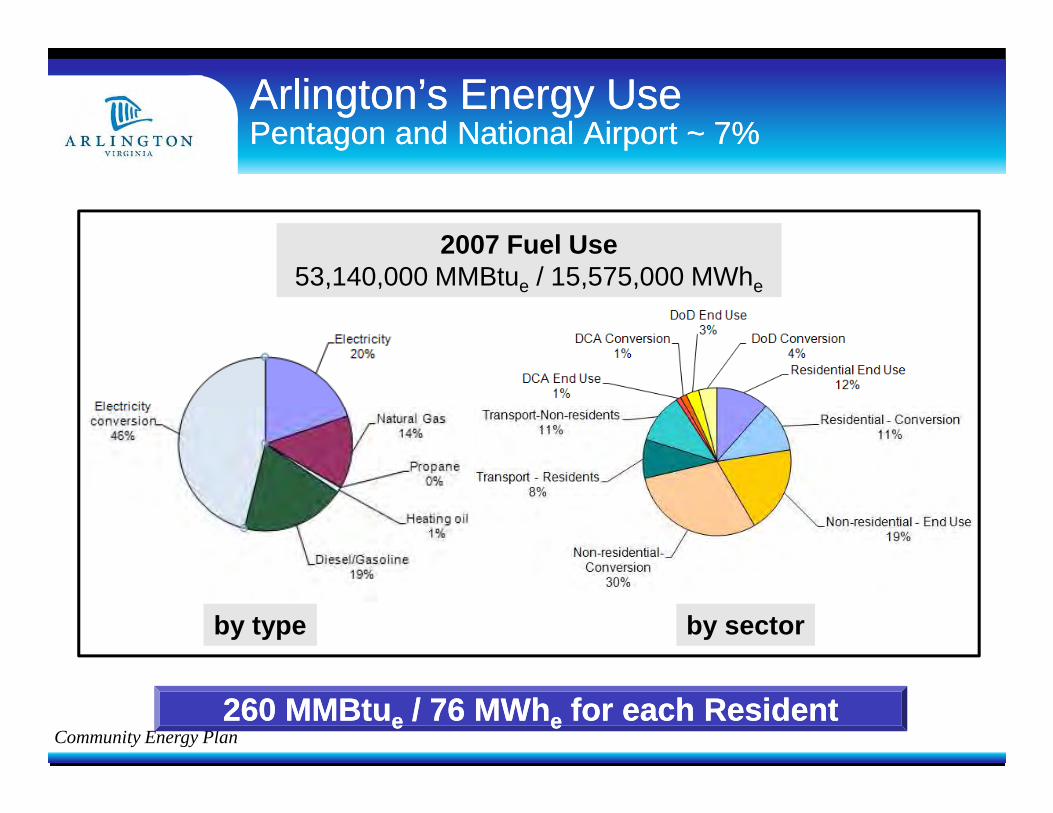
Arlington’s Energy Use Arlington’s Energy Use Pentagon and National Airport ~ 7%Pentagon and National Airport ~ 7%
2007 Fuel Use53,140,000 MMBtue / 15,575,000 MWhe
Community Energy Plan260 260 MMBtuMMBtu ee / 76 / 76 MWhMWhee for for each Residenteach Resident
by sectorby type
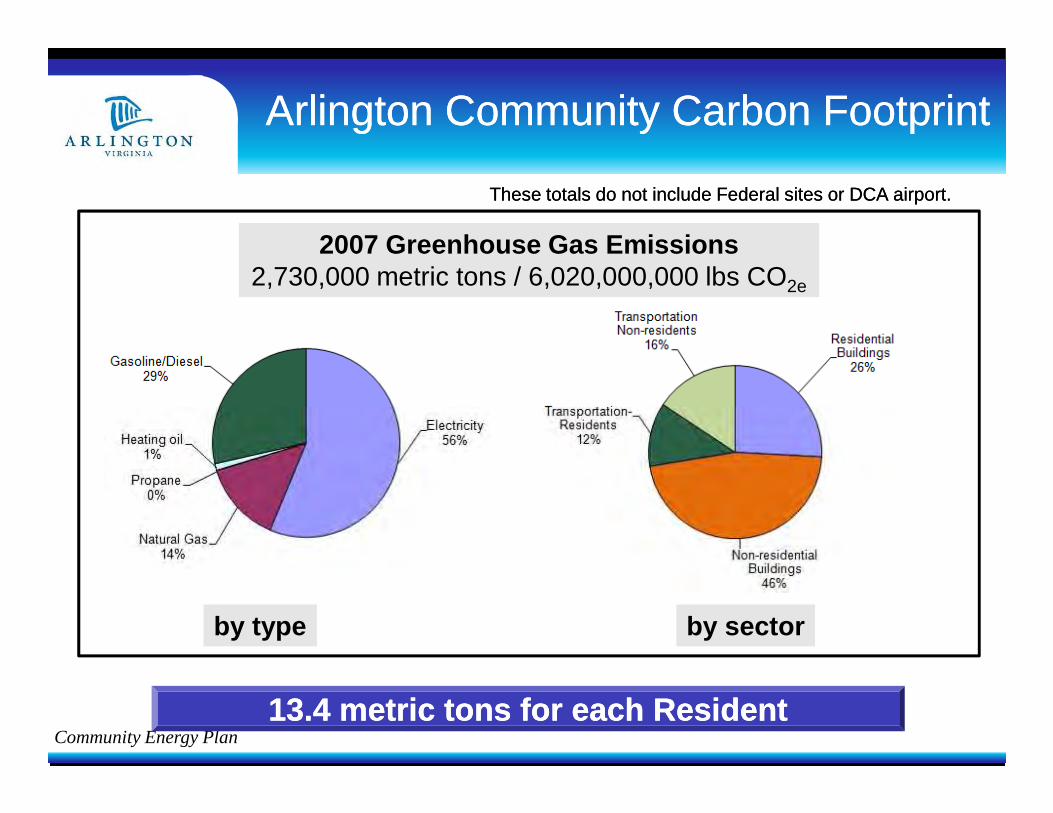
Arlington Community Carbon FootprintArlington Community Carbon Footprint
2007 Greenhouse Gas Emissions2,730,000 metric tons / 6,020,000,000 lbs CO2e
These totals do not include Federal sites or DCA airport.These totals do not include Federal sites or DCA airport.
Community Energy Plan13.4 metric tons for each Resident13.4 metric tons for each Resident
by sectorby type
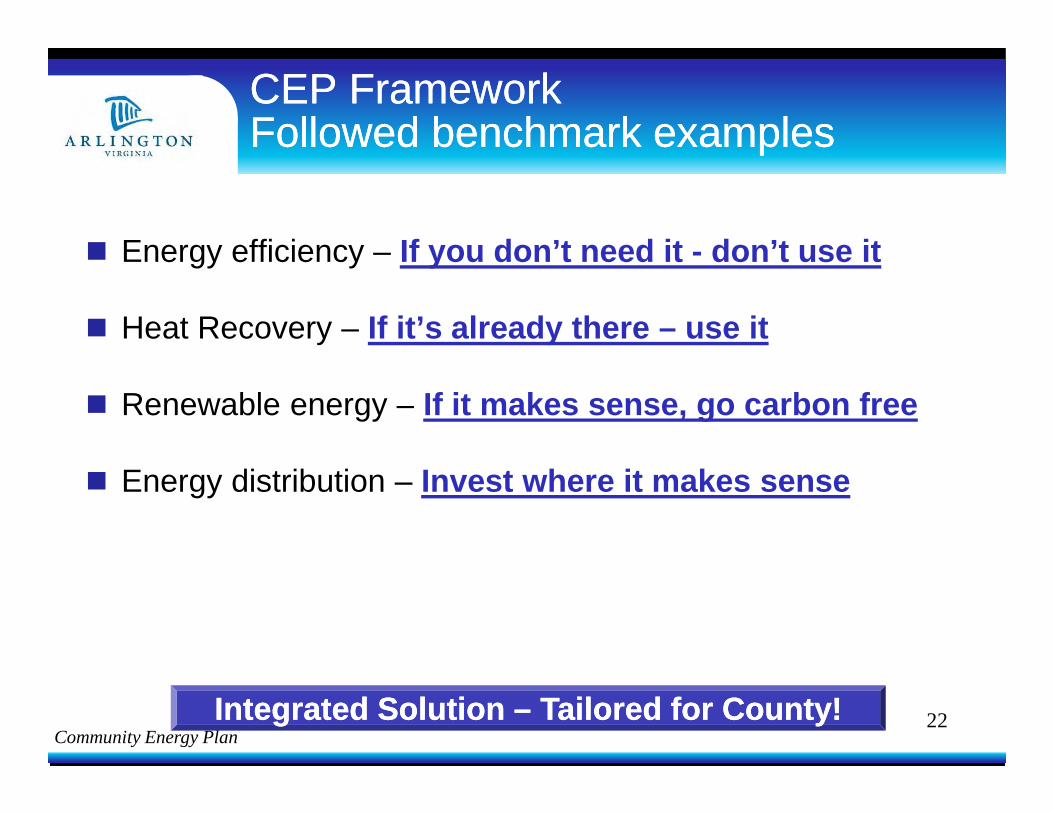
� Energy efficiency – If you don’t need it - don’t use it
� Heat Recovery – If it’s already there – use it
� Renewable energy – If it makes sense, go carbon free
CEP FrameworkCEP FrameworkFollowed benchmark examplesFollowed benchmark examples
Community Energy Plan
� Renewable energy – If it makes sense, go carbon free
� Energy distribution – Invest where it makes sense
Integrated Solution Integrated Solution –– Tailored for County!Tailored for County! 22
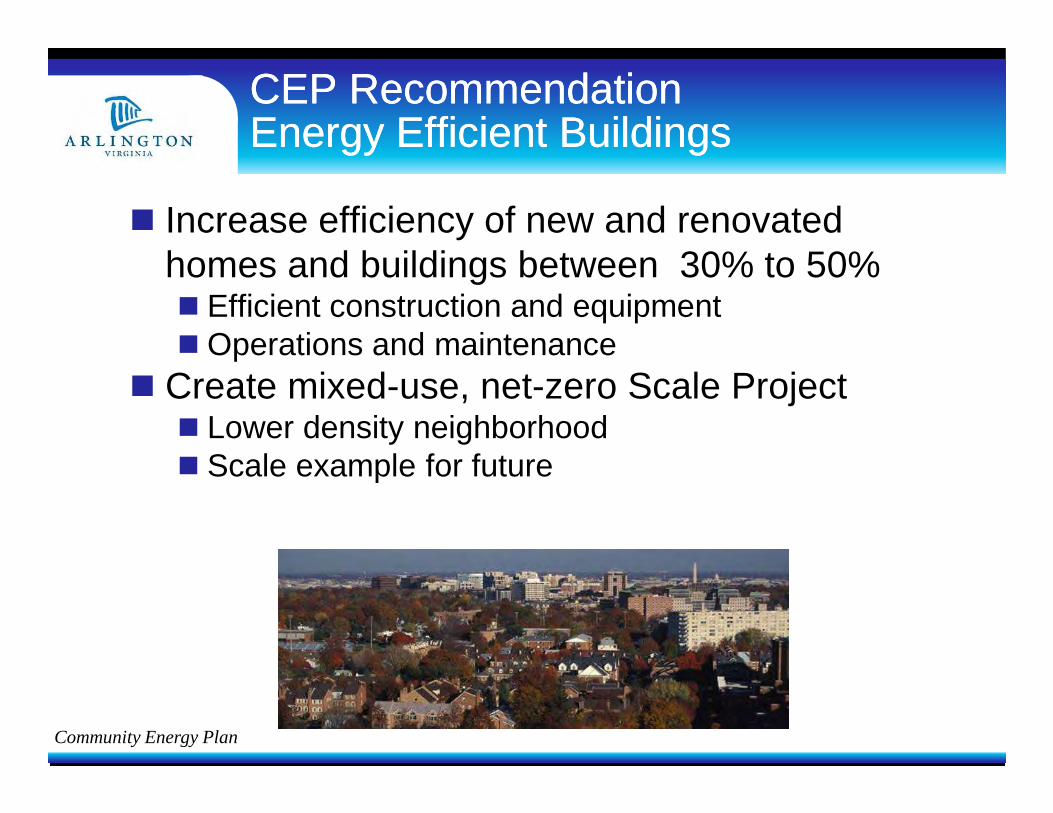
� Increase efficiency of new and renovated homes and buildings between 30% to 50% � Efficient construction and equipment� Operations and maintenance
� Create mixed-use, net-zero Scale Project
CEP RecommendationCEP RecommendationEnergy Efficient BuildingsEnergy Efficient Buildings
Community Energy Plan
� Lower density neighborhood� Scale example for future
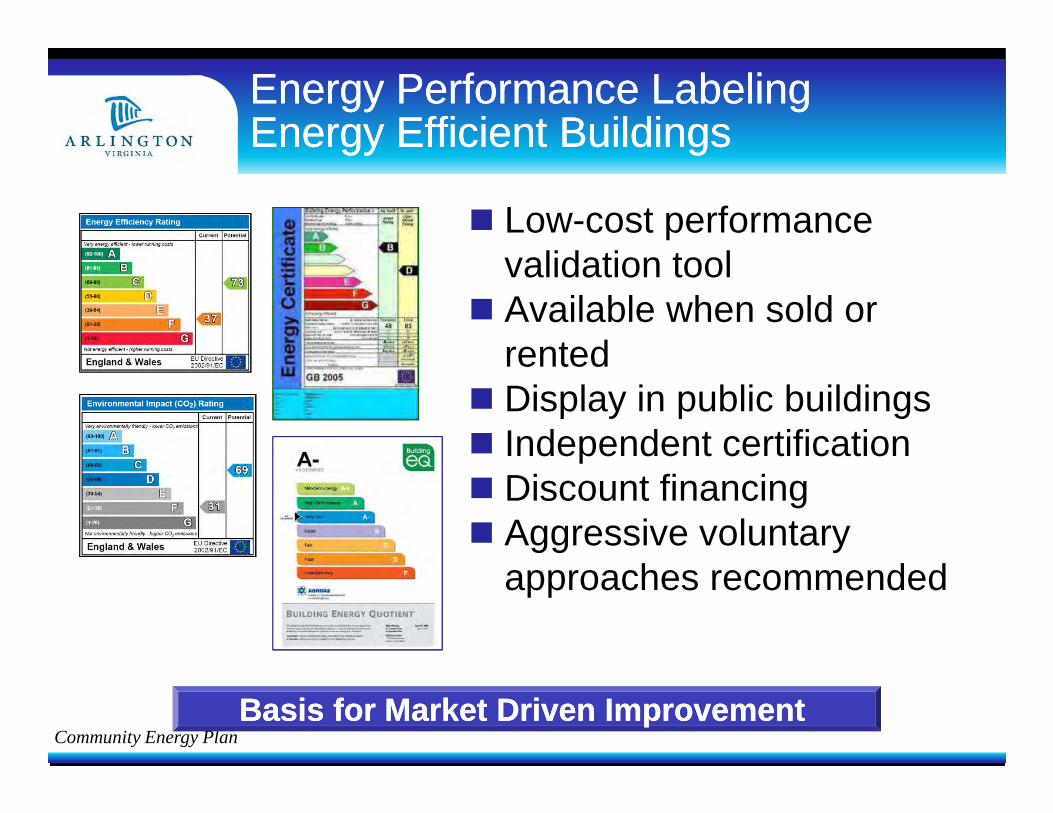
� Low-cost performance validation tool
� Available when sold or rented
� Display in public buildings
Energy Energy Performance Performance LabelingLabelingEnergy Efficient BuildingsEnergy Efficient Buildings
Community Energy Plan
� Display in public buildings� Independent certification� Discount financing� Aggressive voluntary
approaches recommended
Basis for Market Driven Improvement Basis for Market Driven Improvement
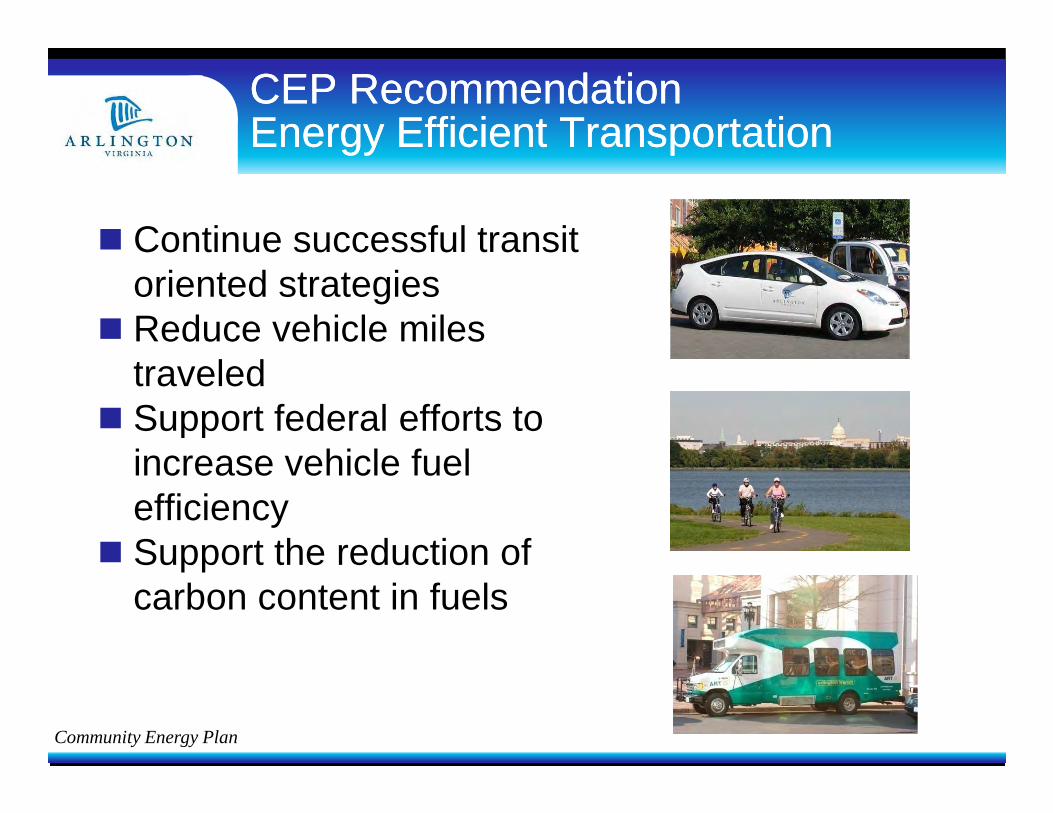
� Continue successful transit oriented strategies
� Reduce vehicle miles traveled
� Support federal efforts to
CEP RecommendationCEP RecommendationEnergy Efficient TransportationEnergy Efficient Transportation
Community Energy Plan
� Support federal efforts to increase vehicle fuel efficiency
� Support the reduction of carbon content in fuels
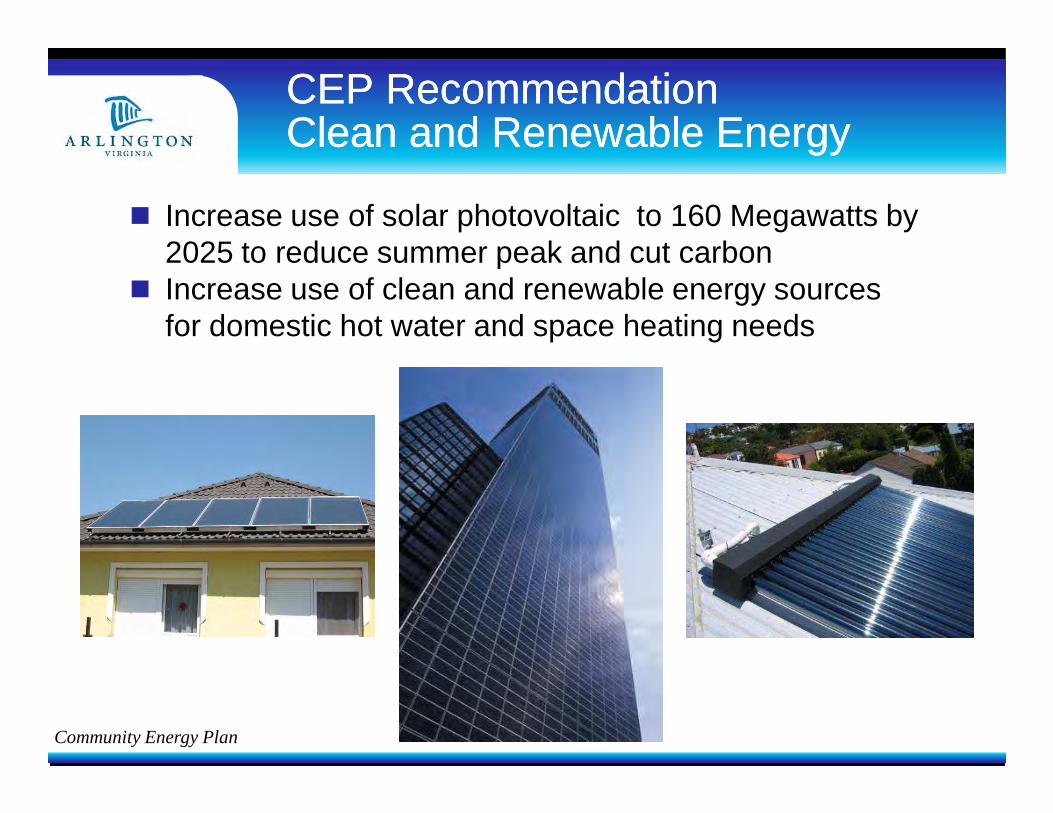
� Increase use of solar photovoltaic to 160 Megawatts by 2025 to reduce summer peak and cut carbon
� Increase use of clean and renewable energy sources for domestic hot water and space heating needs
CEP RecommendationCEP RecommendationClean and Renewable EnergyClean and Renewable Energy
Community Energy Plan
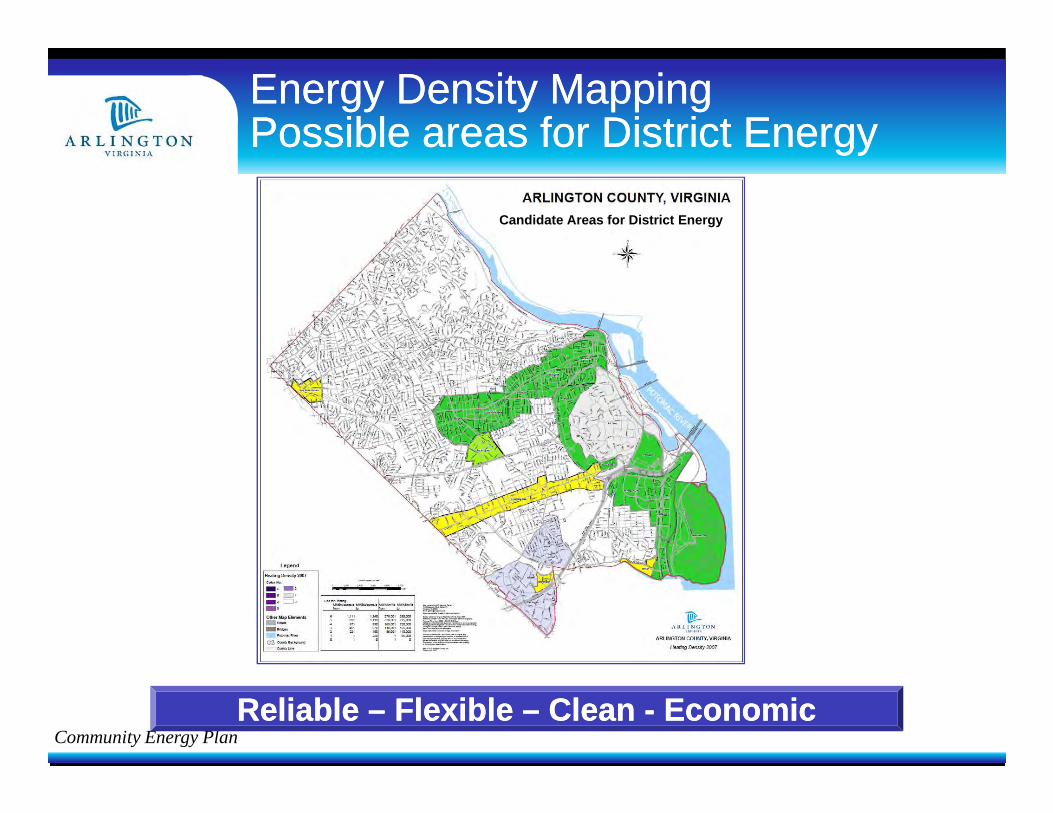
Energy Density MappingEnergy Density MappingPossible areas for District Possible areas for District Energy Energy
Candidate Areas for District Energy
Community Energy PlanReliable Reliable –– Flexible Flexible –– Clean Clean -- EconomicEconomic
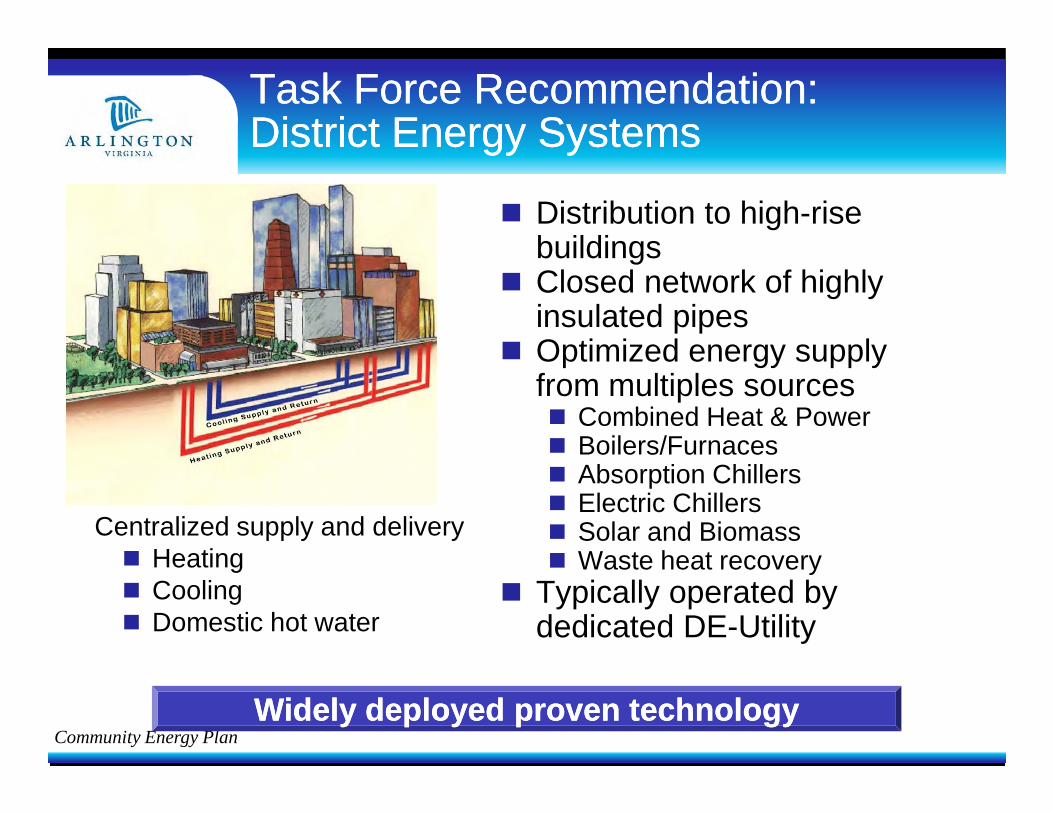
Task Force Recommendation: Task Force Recommendation: District Energy SystemsDistrict Energy Systems
� Distribution to high-rise buildings
� Closed network of highly insulated pipes
� Optimized energy supply from multiples sources� Combined Heat & Power
Community Energy Plan
� Combined Heat & Power� Boilers/Furnaces� Absorption Chillers� Electric Chillers� Solar and Biomass� Waste heat recovery
� Typically operated by dedicated DE-Utility
Widely deployed proven technologyWidely deployed proven technology
Centralized supply and delivery� Heating� Cooling� Domestic hot water
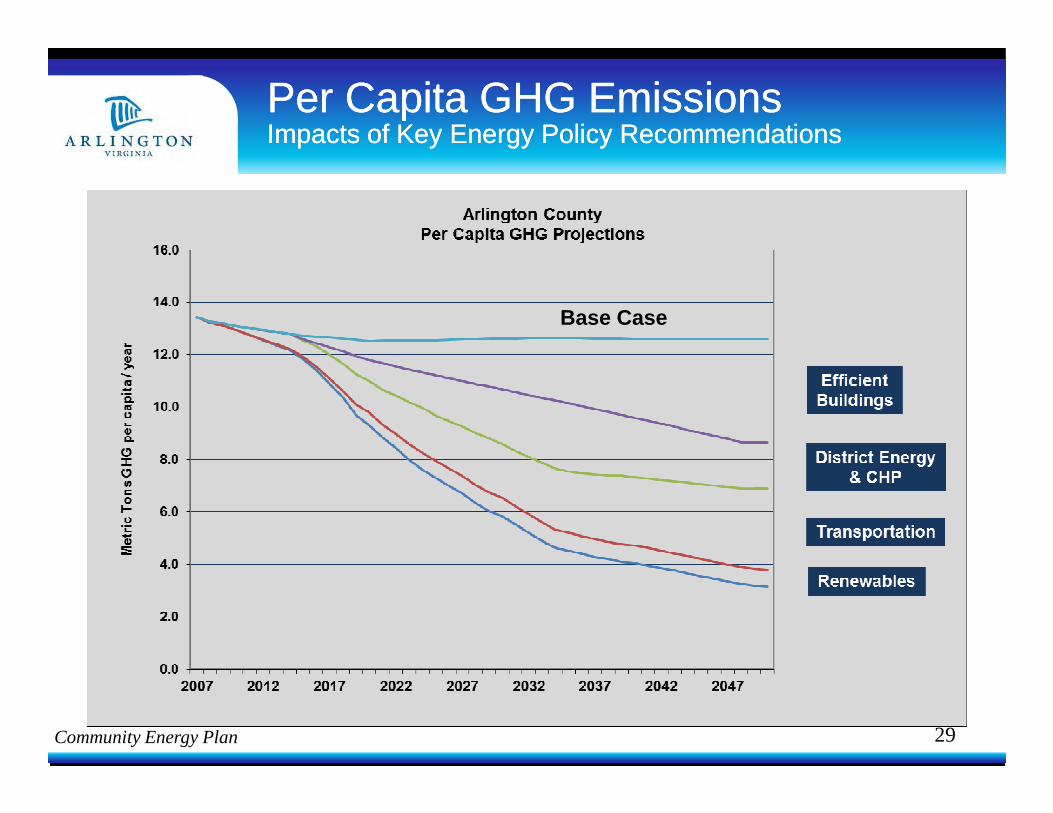
Per Capita GHG EmissionsPer Capita GHG EmissionsImpacts of Key Energy Policy RecommendationsImpacts of Key Energy Policy Recommendations
Base Case
Community Energy Plan 29
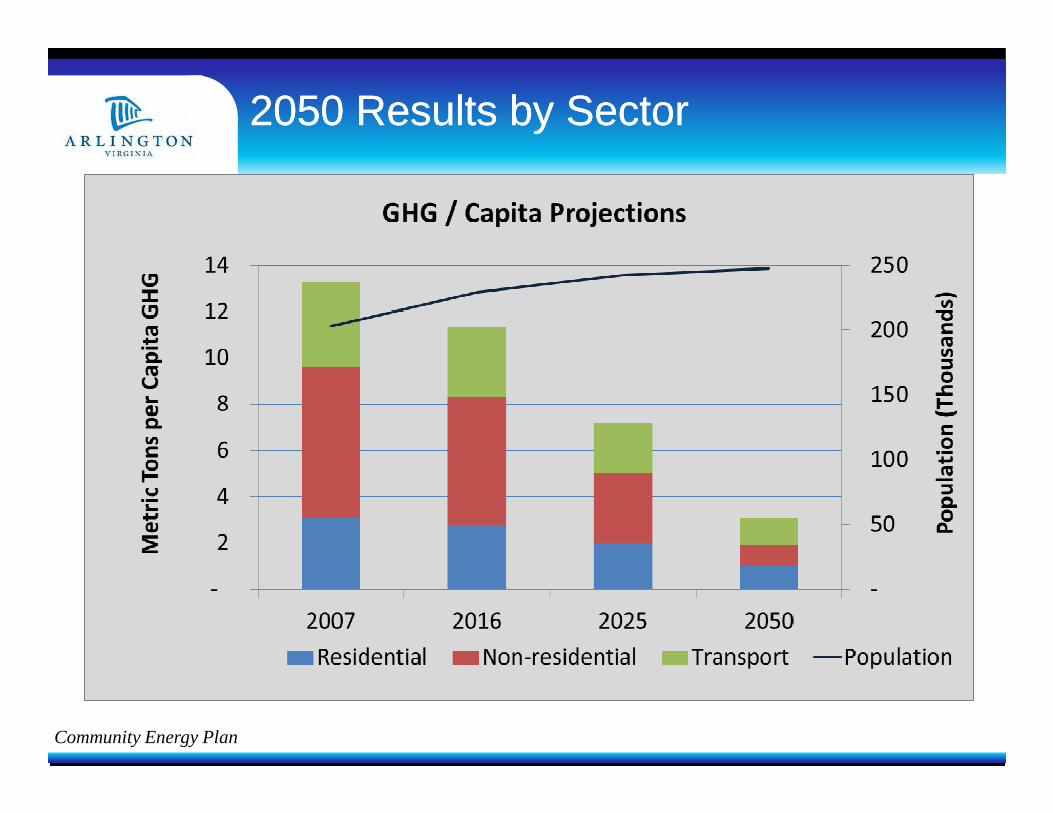
2050 Results by Sector2050 Results by Sector
Community Energy Plan

Project TimelineProject Timeline
Community Energy Plan
Bi-monthly Task Force MeetingsRegular Technical Working Group Meetings
Implementation Plan (18 mo.)
Quarterly Advisory Group Meetings with Technical Working Group
31
Community Energy Efficiency & Conservation Community Energy Efficiency & Conservation Strategy Plan (CEP)Strategy Plan (CEP)
Creating a Globally Competitive Community
© Garforth International llc
Final Recommendations
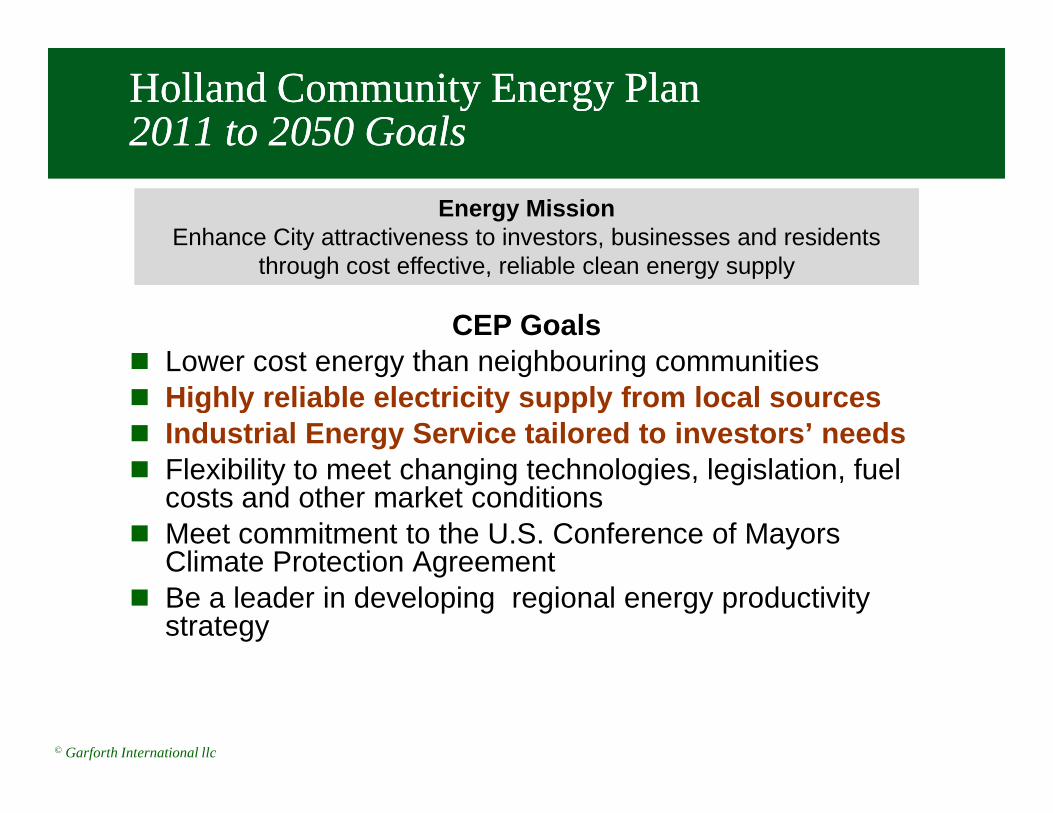
CEP Goals� Lower cost energy than neighbouring communities� Highly reliable electricity supply from local sources
Holland Community Energy PlanHolland Community Energy Plan2011 to 2050 Goals2011 to 2050 Goals
Energy MissionEnhance City attractiveness to investors, businesses and residents
through cost effective, reliable clean energy supply
Energy MissionEnhance City attractiveness to investors, businesses and residents
through cost effective, reliable clean energy supply
© Garforth International llc
� Highly reliable electricity supply from local sources� Industrial Energy Service tailored to investors’ nee ds� Flexibility to meet changing technologies, legislation, fuel
costs and other market conditions� Meet commitment to the U.S. Conference of Mayors
Climate Protection Agreement� Be a leader in developing regional energy productivity
strategy
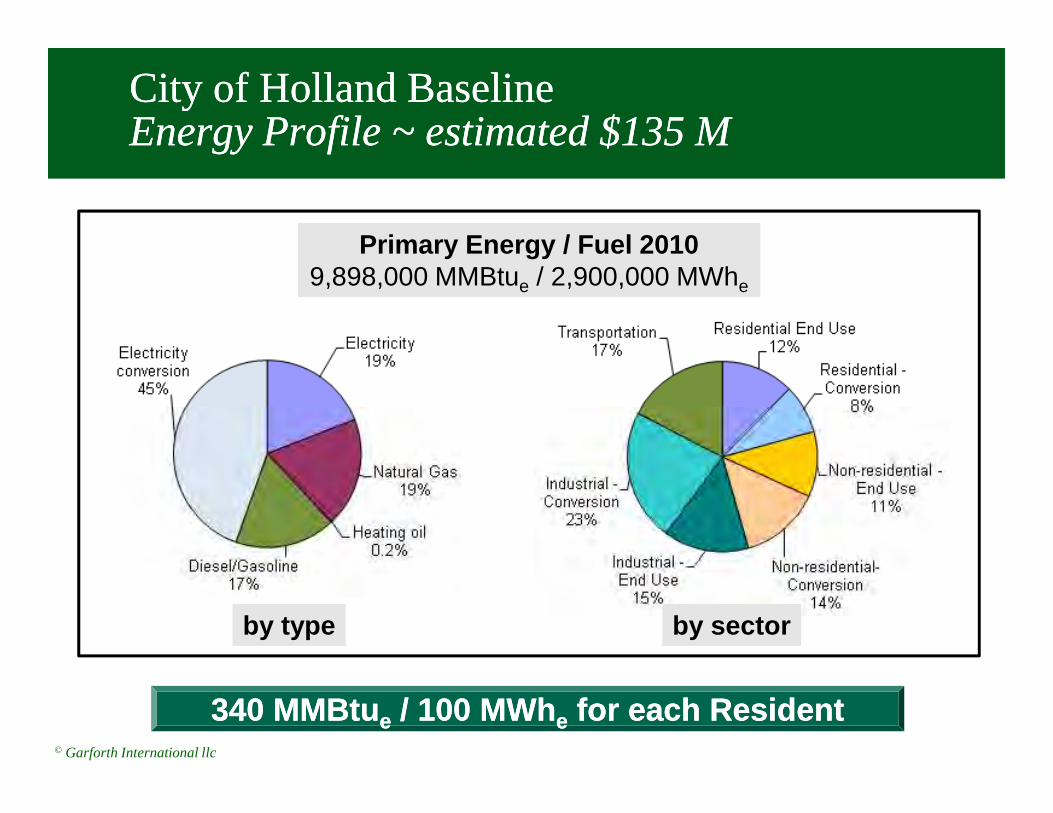
City of Holland BaselineCity of Holland BaselineEnergy Profile ~ estimated $135 MEnergy Profile ~ estimated $135 M
Primary Energy / Fuel 20109,898,000 MMBtue / 2,900,000 MWhe
© Garforth International llc
340 340 MMBtuMMBtu ee / 100 / 100 MWhMWhee for each Residentfor each Resident
by type by sector
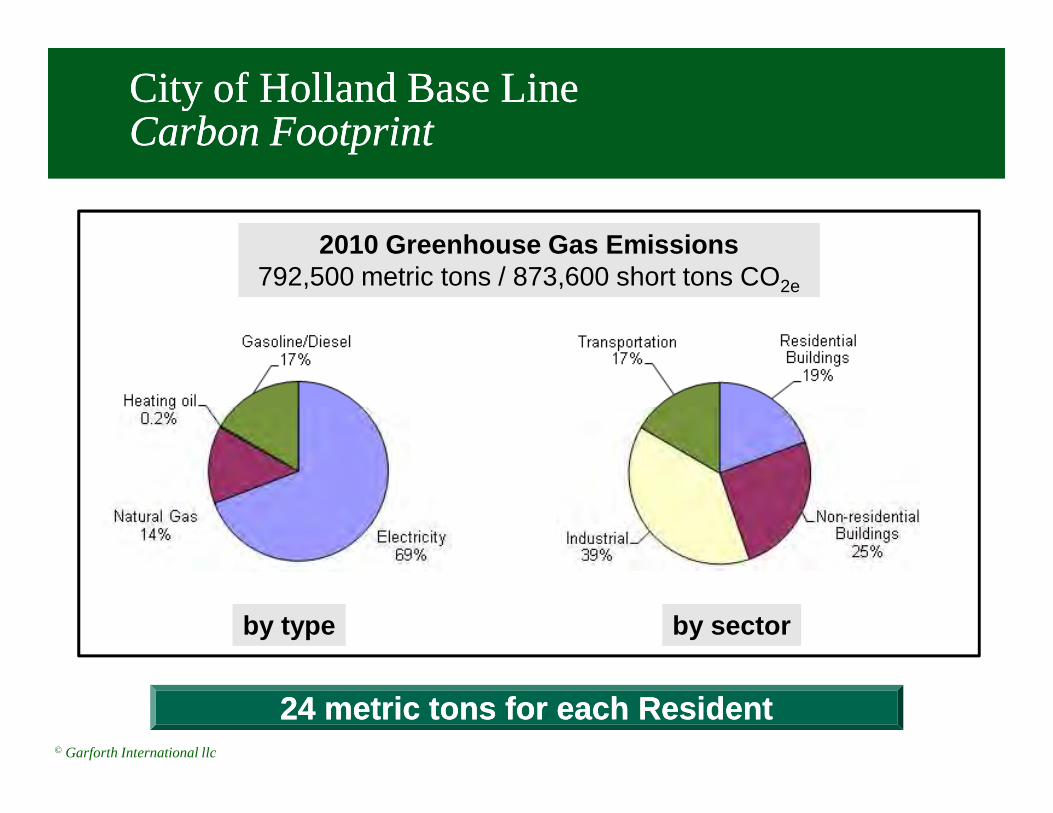
City of Holland Base Line City of Holland Base Line Carbon FootprintCarbon Footprint
2010 Greenhouse Gas Emissions792,500 metric tons / 873,600 short tons CO2e
© Garforth International llc
24 metric tons for each Resident24 metric tons for each Resident
by type by sector

Baseline Energy Demand 2010Baseline Energy Demand 2010
© Garforth International llc
Total Energy Demand – Baseline 2010Total Energy Demand – Baseline 2010
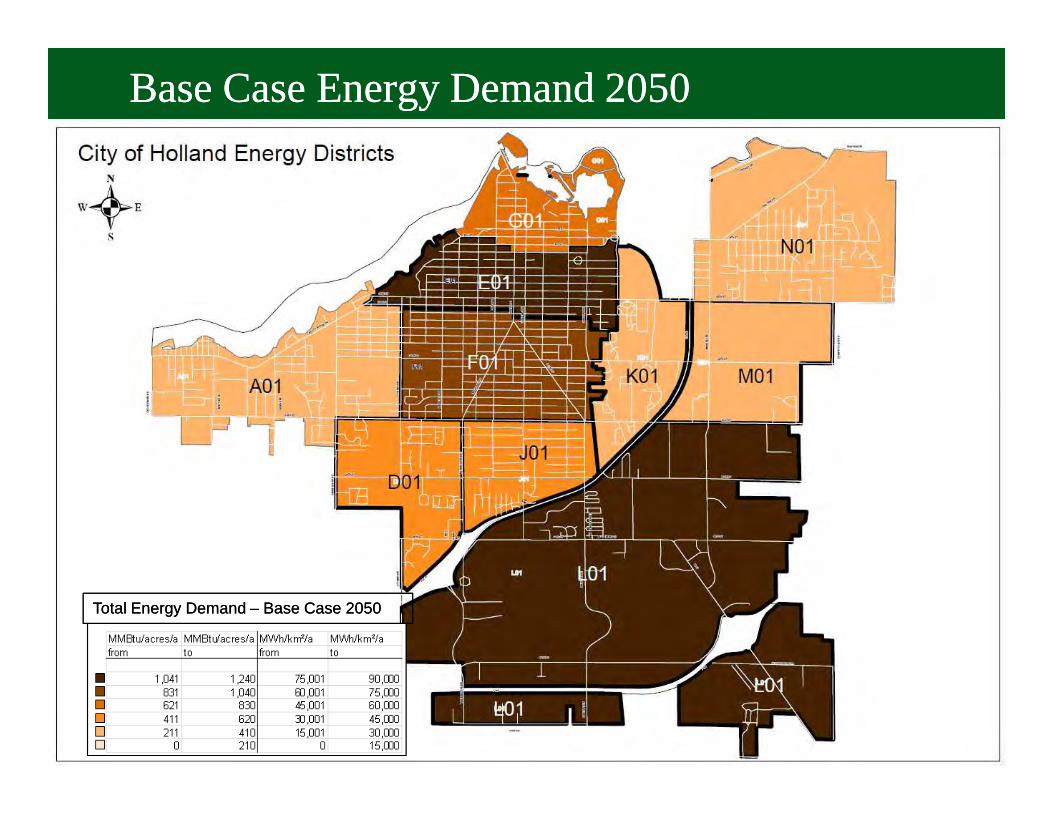
Base Case Base Case Energy Demand 2050Energy Demand 2050
© Garforth International llc
Total Energy Demand – Base Case 2050Total Energy Demand – Base Case 2050
2,000,000
2,500,000
7,000,000
8,000,000
9,000,000
10,000,000
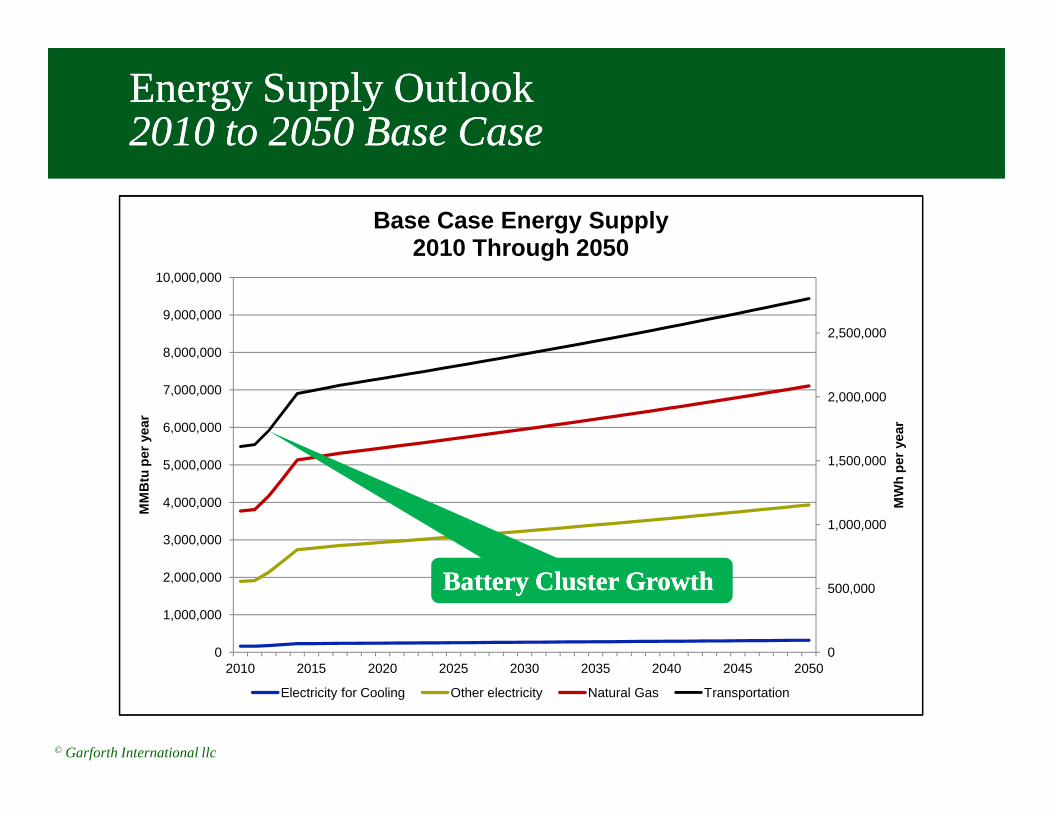
Base Case Energy Supply2010 Through 2050
Energy Supply OutlookEnergy Supply Outlook2010 to 2050 Base Case2010 to 2050 Base Case
© Garforth International llc
0
500,000
1,000,000
1,500,000
0
1,000,000
2,000,000
3,000,000
4,000,000
5,000,000
6,000,000
2010 2015 2020 2025 2030 2035 2040 2045 2050
MW
h pe
r ye
ar
MM
Btu
per
yea
r
Electricity for Cooling Other electricity Natural Gas Transportation
Battery Cluster GrowthBattery Cluster Growth
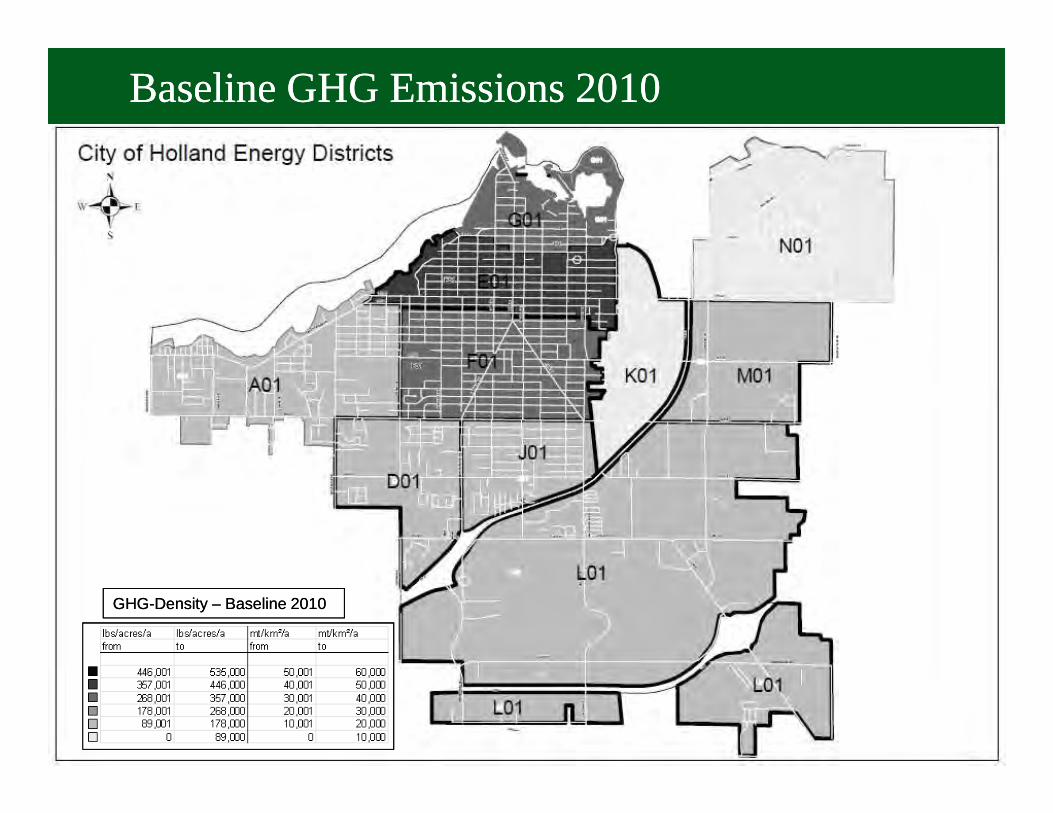
Baseline GHG Emissions 2010Baseline GHG Emissions 2010
© Garforth International llc
GHG-Density – Baseline 2010GHG-Density – Baseline 2010
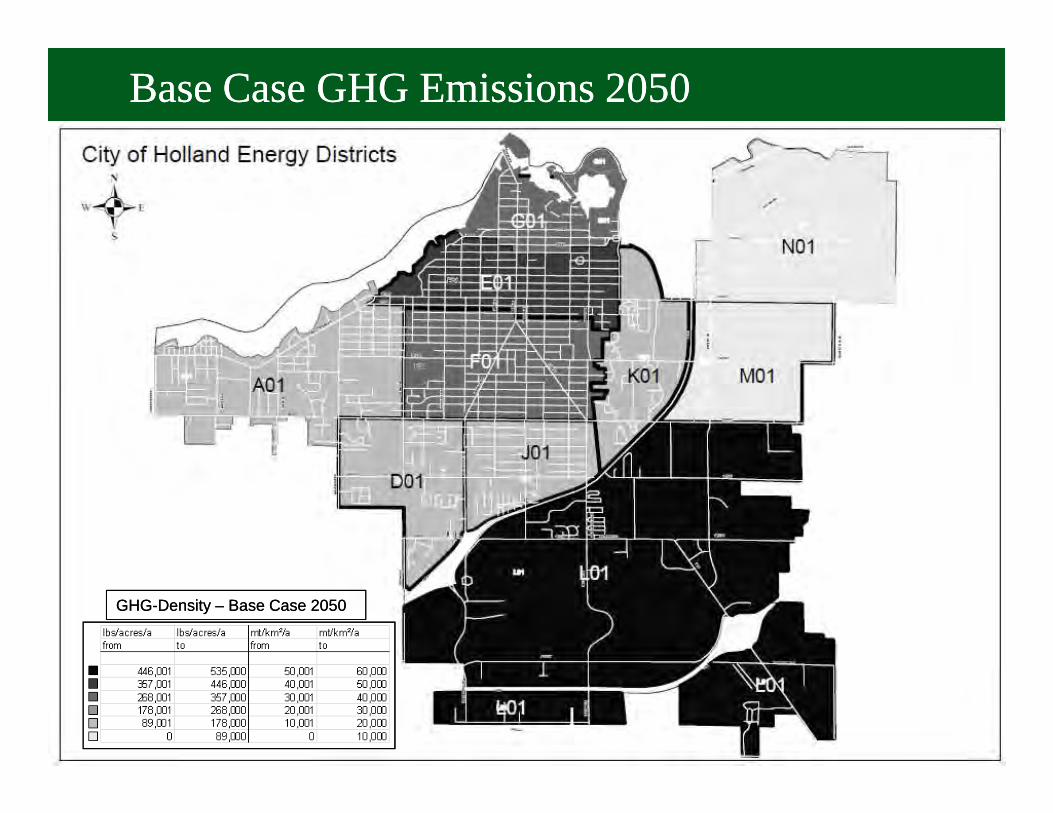
Base Case GHG Emissions 2050Base Case GHG Emissions 2050
© Garforth International llc
GHG-Density – Base Case 2050GHG-Density – Base Case 2050
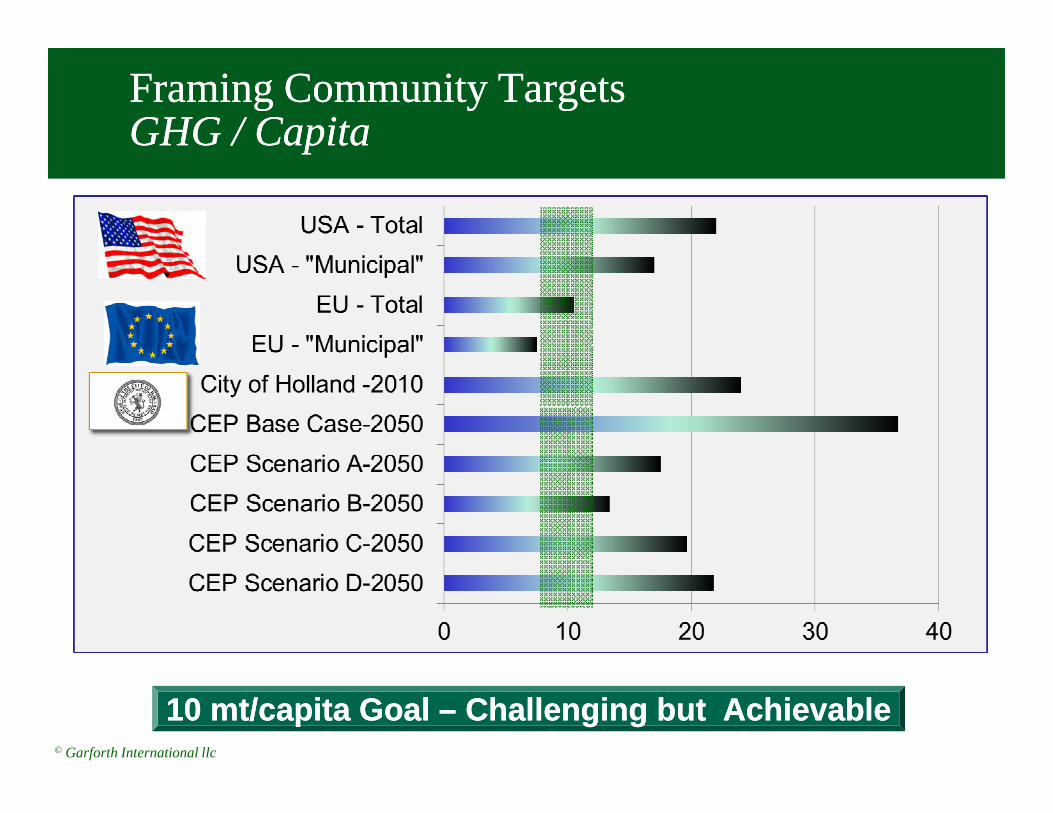
Framing Community TargetsFraming Community TargetsGHG / CapitaGHG / Capita
© Garforth International llc
10 mt/capita Goal 10 mt/capita Goal –– Challenging but AchievableChallenging but Achievable
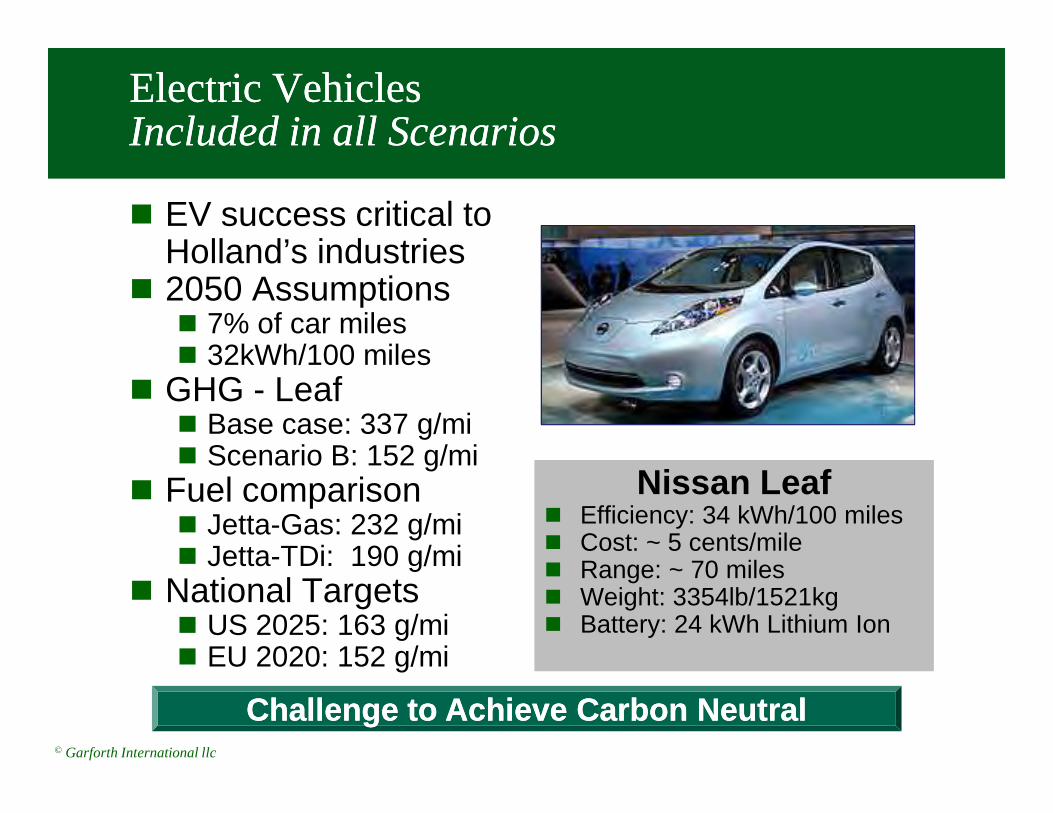
Electric VehiclesElectric VehiclesIncluded in all ScenariosIncluded in all Scenarios
� EV success critical to Holland’s industries
� 2050 Assumptions� 7% of car miles� 32kWh/100 miles
� GHG - Leaf
© Garforth International llc
� GHG - Leaf � Base case: 337 g/mi� Scenario B: 152 g/mi
� Fuel comparison� Jetta-Gas: 232 g/mi� Jetta-TDi: 190 g/mi
� National Targets� US 2025: 163 g/mi� EU 2020: 152 g/mi
Nissan Leaf� Efficiency: 34 kWh/100 miles� Cost: ~ 5 cents/mile� Range: ~ 70 miles� Weight: 3354lb/1521kg� Battery: 24 kWh Lithium Ion
Nissan Leaf� Efficiency: 34 kWh/100 miles� Cost: ~ 5 cents/mile� Range: ~ 70 miles� Weight: 3354lb/1521kg� Battery: 24 kWh Lithium Ion
Challenge to Achieve Carbon NeutralChallenge to Achieve Carbon Neutral
CEP Scenario ACEP Scenario AEfficient Homes and BuildingsEfficient Homes and Buildings
� All Buildings be renovated by 2050� Voluntary Energy Performance Labeling� Systematical efficiency upgrade of Single
Family Homes� Living examples in renovation and upgrade of
© Garforth International llc
� Living examples in renovation and upgrade of Non-residential, Large MFH and Retirement Communities
Systematically Raise EfficiencySystematically Raise Efficiency

CEP Scenario ACEP Scenario AIndustrial and City Energy ServicesIndustrial and City Energy Services
� Tailored Industrial Energy Services with 30 MW of CHP and other media and services to meet costumer needs
� District Heating north from 24th street with Hope College / Hospital / Aquatic Center / City as Anchor tenants and Snow melt services
© Garforth International llc
Anchor tenants and Snow melt services
� City Energy Supply with 70 MW CCGT De Young Site by 2016 configured to supply District Heating
� Sourcing “green” electricity from Landfill (10MW)
*Turbine combustion air
Extended Opportunities for HBPWExtended Opportunities for HBPW
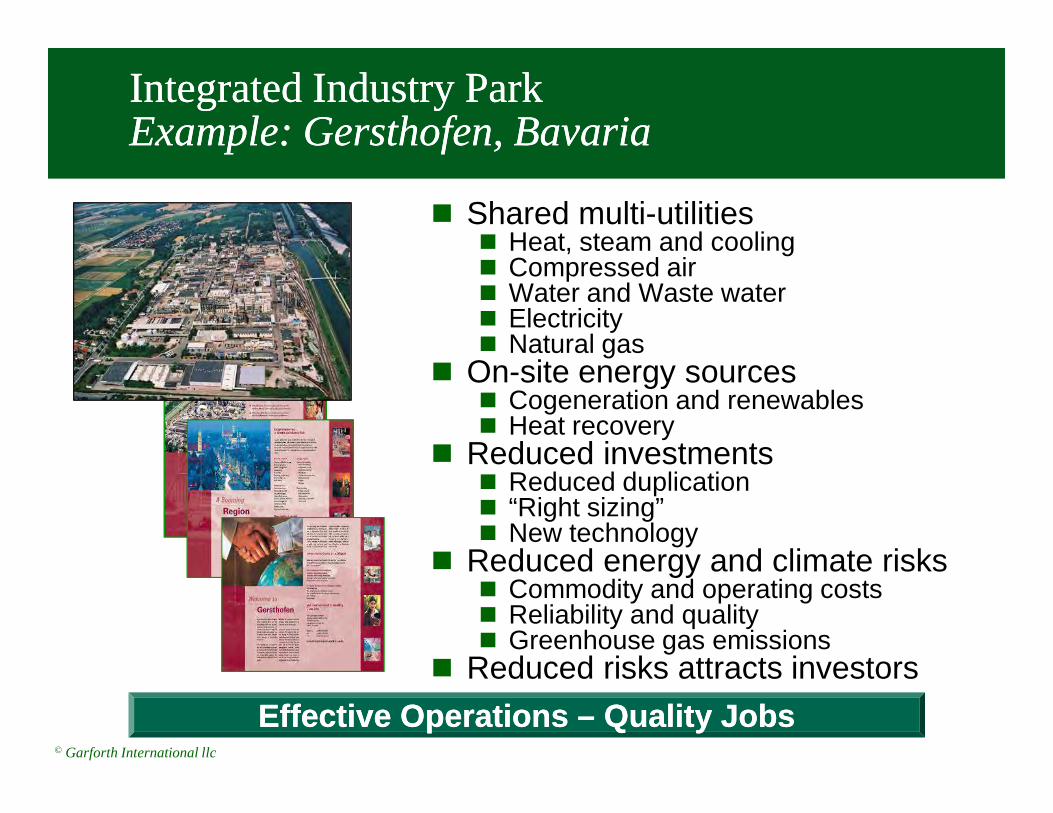
Integrated Industry ParkIntegrated Industry ParkExample: Example: GersthofenGersthofen, Bavaria, Bavaria
� Shared multi-utilities� Heat, steam and cooling� Compressed air� Water and Waste water� Electricity� Natural gas
� On-site energy sources� Cogeneration and renewables
© Garforth International llc
� Cogeneration and renewables� Heat recovery
� Reduced investments� Reduced duplication� “Right sizing”� New technology
� Reduced energy and climate risks� Commodity and operating costs� Reliability and quality� Greenhouse gas emissions
� Reduced risks attracts investors
Effective Operations Effective Operations –– Quality JobsQuality Jobs
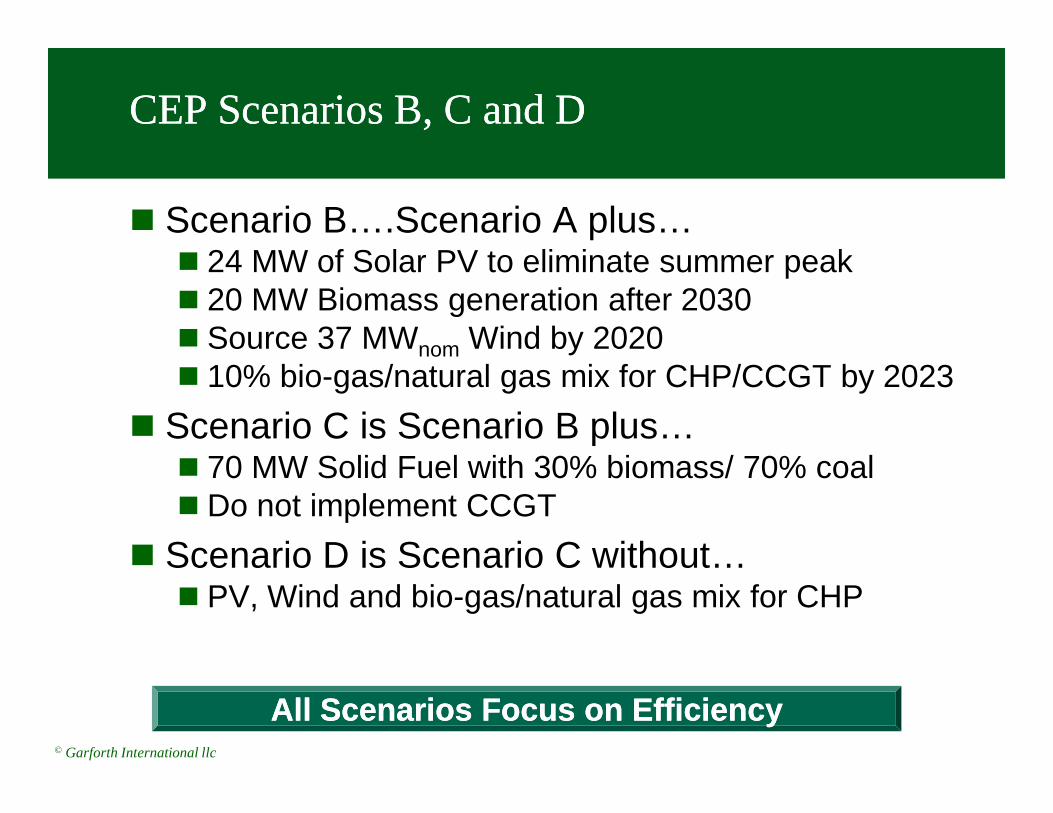
CEP Scenarios B, C and DCEP Scenarios B, C and D
� Scenario B….Scenario A plus…� 24 MW of Solar PV to eliminate summer peak � 20 MW Biomass generation after 2030 � Source 37 MWnom Wind by 2020� 10% bio-gas/natural gas mix for CHP/CCGT by 2023
� Scenario C is Scenario B plus…
© Garforth International llc
� Scenario C is Scenario B plus…� 70 MW Solid Fuel with 30% biomass/ 70% coal � Do not implement CCGT
� Scenario D is Scenario C without…� PV, Wind and bio-gas/natural gas mix for CHP
All Scenarios Focus on EfficiencyAll Scenarios Focus on Efficiency
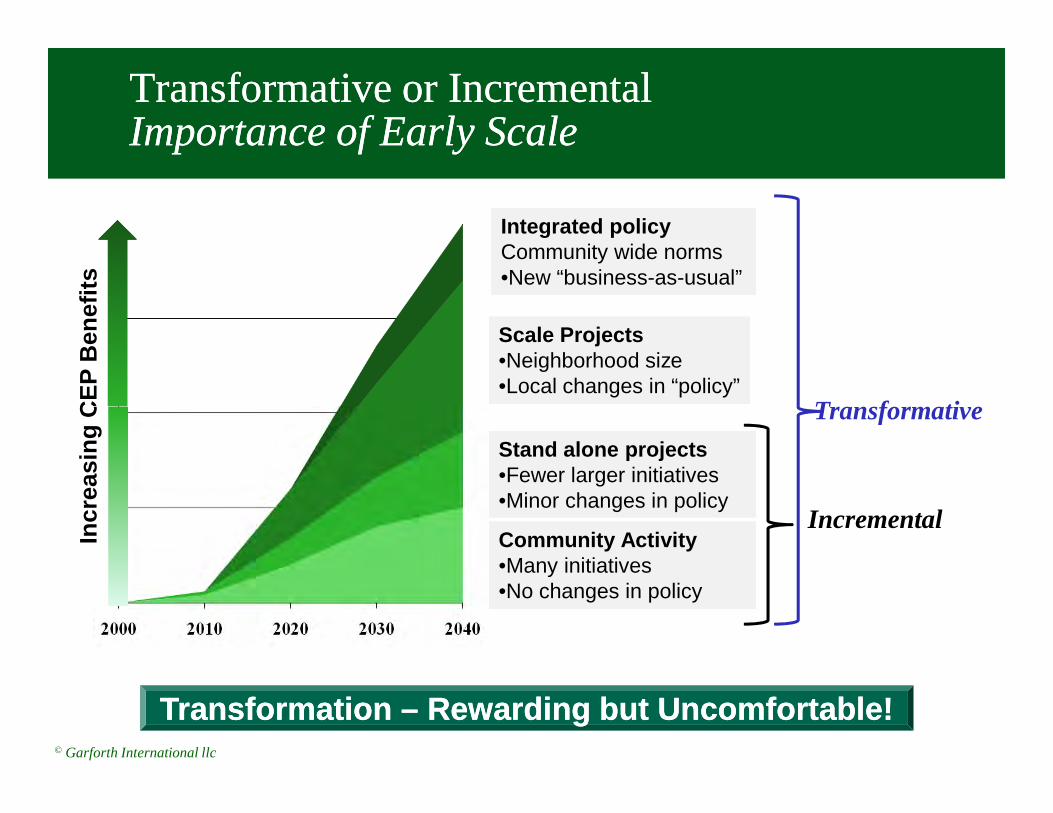
Transformative or IncrementalTransformative or IncrementalImportance of Early ScaleImportance of Early Scale
Scale Projects•Neighborhood size•Local changes in “policy”
Scale Projects•Neighborhood size•Local changes in “policy”
Integrated policy Community wide norms•New “business-as-usual”
Integrated policy Community wide norms•New “business-as-usual”
Incr
easi
ng C
EP
Ben
efits
Transformative
© Garforth International llc
Community Activity•Many initiatives•No changes in policy
Community Activity•Many initiatives•No changes in policy
Incr
easi
ng C
EP
Ben
efits
Stand alone projects•Fewer larger initiatives•Minor changes in policy
Stand alone projects•Fewer larger initiatives•Minor changes in policy
Transformative
Incremental
Transformation Transformation –– Rewarding but Uncomfortable!Rewarding but Uncomfortable!
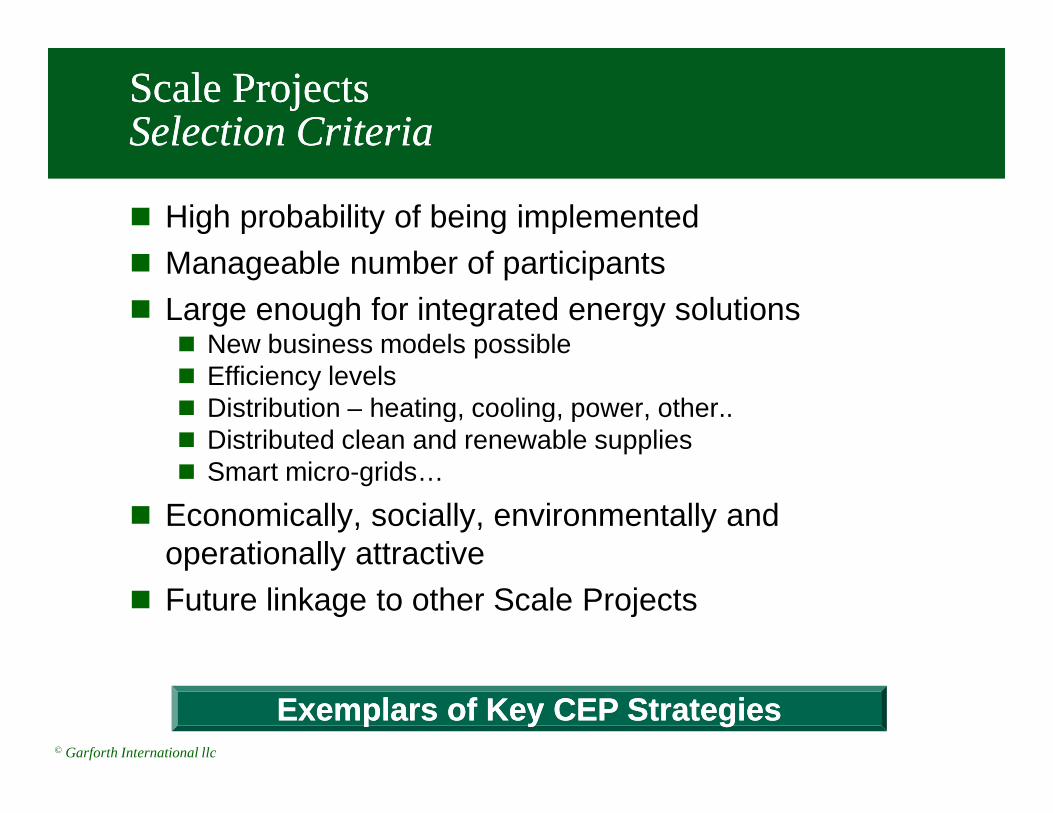
Scale ProjectsScale ProjectsSelection CriteriaSelection Criteria
� High probability of being implemented
� Manageable number of participants
� Large enough for integrated energy solutions � New business models possible� Efficiency levels� Distribution – heating, cooling, power, other..
© Garforth International llc
� Distribution – heating, cooling, power, other..� Distributed clean and renewable supplies� Smart micro-grids…
� Economically, socially, environmentally and operationally attractive
� Future linkage to other Scale Projects
Exemplars of Key CEP StrategiesExemplars of Key CEP Strategies
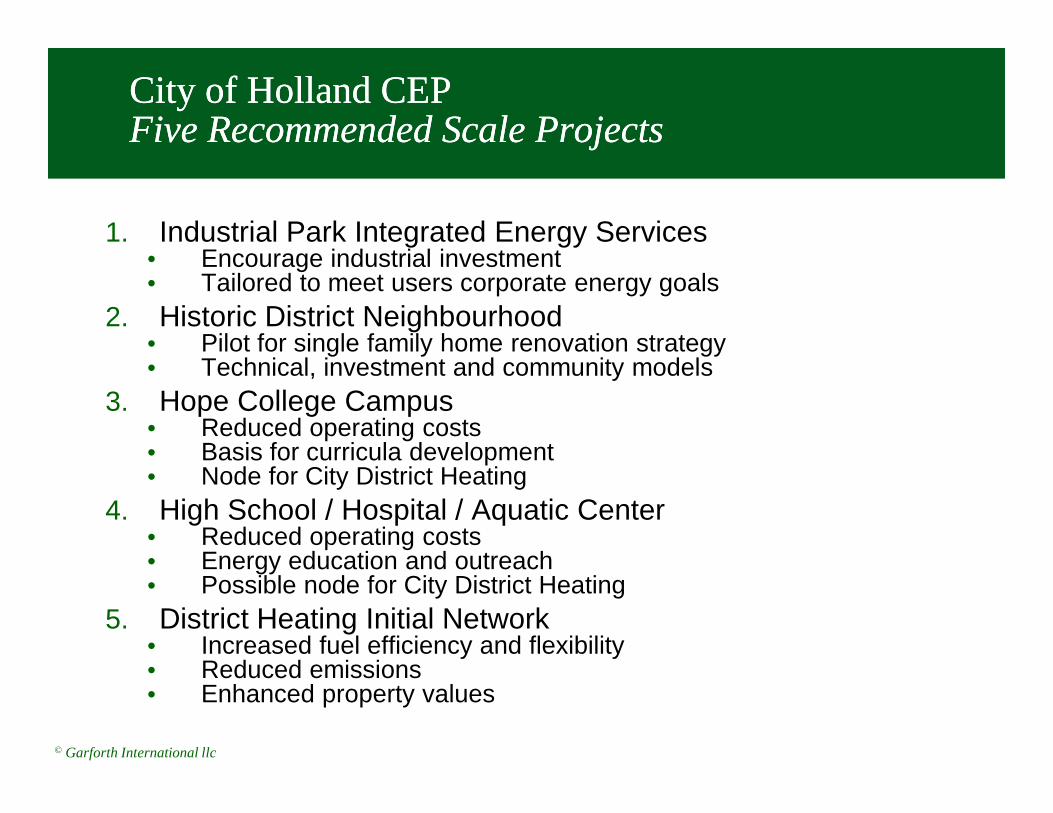
City of Holland CEPCity of Holland CEPFive Recommended Scale ProjectsFive Recommended Scale Projects
1. Industrial Park Integrated Energy Services• Encourage industrial investment• Tailored to meet users corporate energy goals
2. Historic District Neighbourhood• Pilot for single family home renovation strategy• Technical, investment and community models
3. Hope College Campus
© Garforth International llc
3. Hope College Campus• Reduced operating costs• Basis for curricula development• Node for City District Heating
4. High School / Hospital / Aquatic Center• Reduced operating costs• Energy education and outreach• Possible node for City District Heating
5. District Heating Initial Network• Increased fuel efficiency and flexibility• Reduced emissions• Enhanced property values
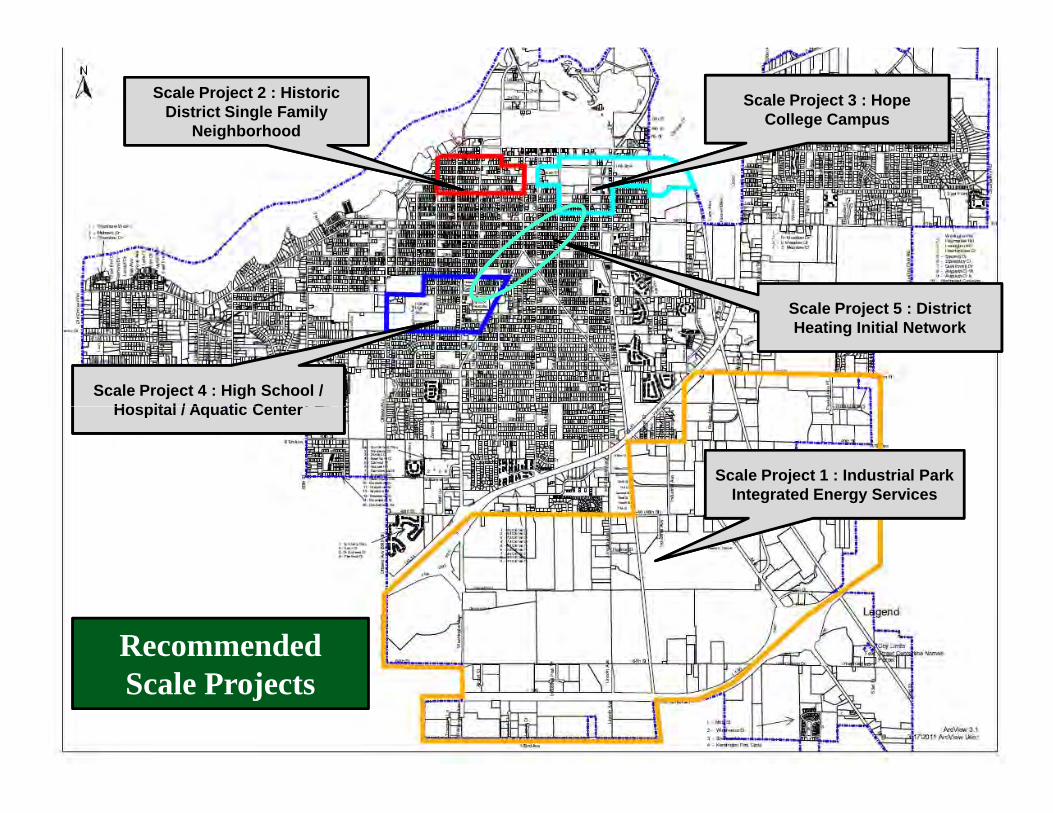
Scale Project 3 : Hope College Campus
Scale Project 2 : Historic District Single Family
Neighborhood
Scale Project 4 : High School / Hospital / Aquatic Center
Scale Project 5 : District Heating Initial Network
© Garforth International llc
Scale Project 1 : Industrial Park Integrated Energy Services
Hospital / Aquatic Center
Recommended Scale Projects
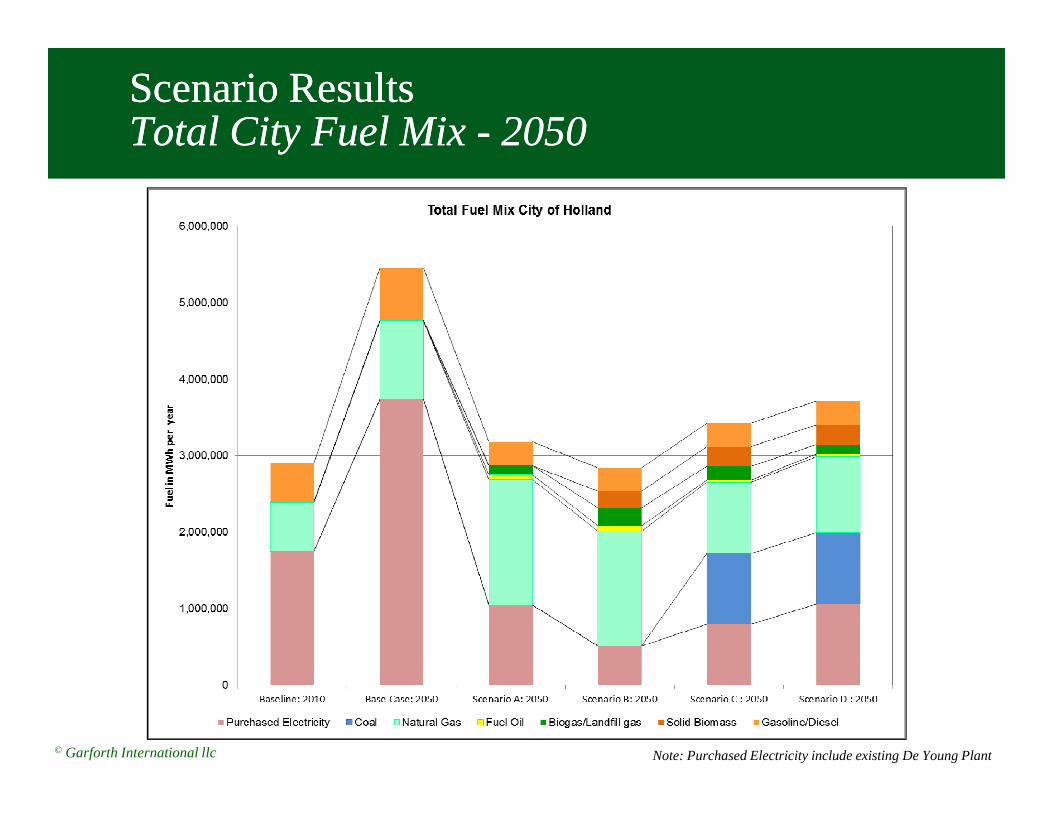
Scenario ResultsScenario ResultsTotal City Fuel Mix Total City Fuel Mix -- 20502050
© Garforth International llc Note: Purchased Electricity include existing De Young Plant
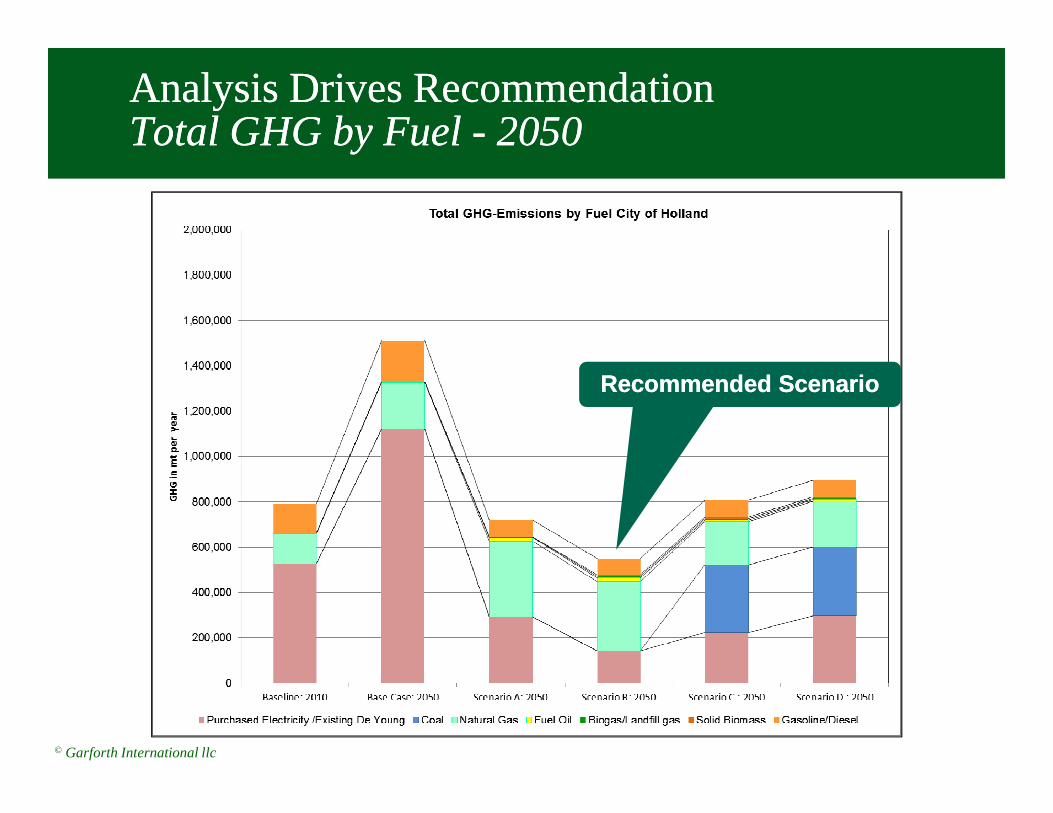
Analysis Drives RecommendationAnalysis Drives RecommendationTotal Total GHG by Fuel GHG by Fuel -- 20502050
Recommended ScenarioRecommended Scenario
© Garforth International llc

Results by SectorResults by SectorGHG GHG Per Capita Per Capita 2010 to 20502010 to 2050
© Garforth International llc
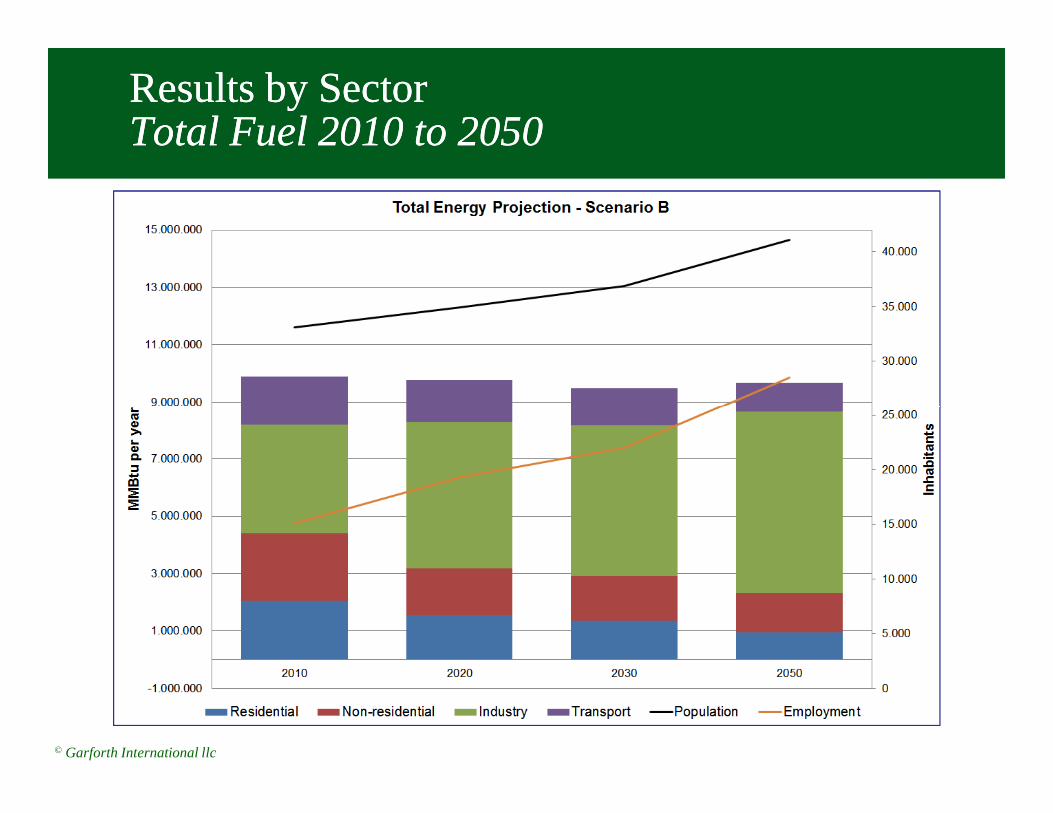
Results by SectorResults by SectorTotal Fuel 2010 to 2050Total Fuel 2010 to 2050
© Garforth International llc
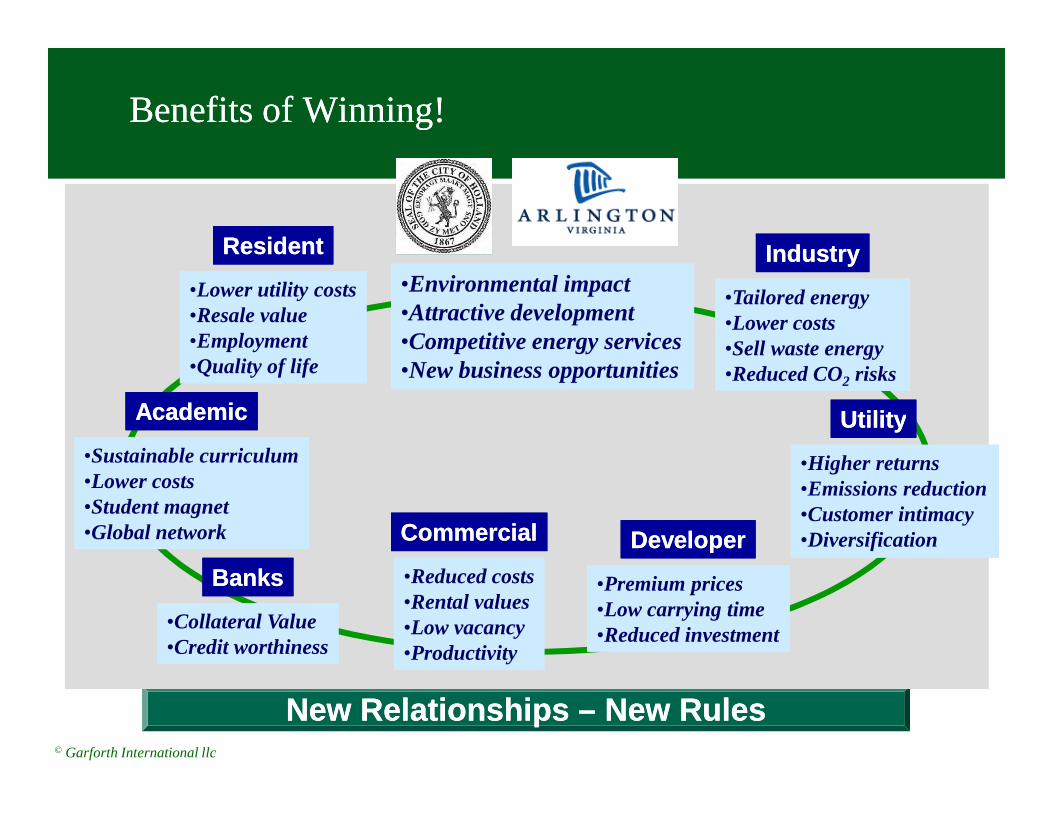
Benefits of WinningBenefits of Winning!!
ResidentResidentResidentResident
•Lower utility costs•Resale value•Employment•Quality of life
•Lower utility costs•Resale value•Employment•Quality of life
•Environmental impact•Attractive development•Competitive energy services•New business opportunities
•Environmental impact•Attractive development•Competitive energy services•New business opportunities
UtilityUtilityUtilityUtility
•Tailored energy•Lower costs•Sell waste energy•Reduced CO2 risks
•Tailored energy•Lower costs•Sell waste energy•Reduced CO2 risks
IndustryIndustryIndustryIndustry
AcademicAcademicAcademicAcademic
© Garforth International llc
New Relationships New Relationships –– New RulesNew Rules
CommercialCommercialCommercialCommercial
•Reduced costs•Rental values•Low vacancy•Productivity
•Reduced costs•Rental values•Low vacancy•Productivity
BanksBanksBanksBanks
•Collateral Value•Credit worthiness•Collateral Value•Credit worthiness
DeveloperDeveloperDeveloperDeveloper
•Premium prices•Low carrying time•Reduced investment
•Premium prices•Low carrying time•Reduced investment
UtilityUtilityUtilityUtility
•Higher returns•Emissions reduction•Customer intimacy•Diversification
•Higher returns•Emissions reduction•Customer intimacy•Diversification
AcademicAcademicAcademicAcademic
•Sustainable curriculum•Lower costs•Student magnet•Global network
•Sustainable curriculum•Lower costs•Student magnet•Global network

Guelph boasts lowest jobless rate in countryGuelph boasts lowest jobless rate in country
Four years later….Four years later….September 2011 Press ItemSeptember 2011 Press Item
� Passed CEP in 2007 by unanimous council vote� National Role Model� Over 2,000 Green jobs� City influencing regional and national policy
© Garforth International llc
Guelph boasts lowest jobless rate in countryThursday, September, 15, 2011 - 10:10:02 AM
It may not be an all-time low, but Guelph’s unemployment rate for August came close at 4.7 per cent – the lowest in the country.“…Initiatives such as Guelph’s Community Energy Initiative contribute to the long-term prosperity of the city and make it more appealing to business investment …”