Livelihoods in an artisanal fishing community and the effect of ...

i
COMMUNITY DEVELOPMENT PROJECTS AND LIVELIHOODS
IN LEPELLE-NKUMPI MUNICIPALITY OF LIMPOPO PROVINCE
OF SOUTH AFRICA
BY
E.M. NZIANE
MINI DISSERTATION
SUBMITTED IN PARTIAL FULLFILMENT OF THE
REQUIREMENT FOR THE DEGREE
OF
MASTER
OF
DEVELOPMENT
IN THE
FACULTY OF MANAGEMENT SCIENCES
AT THE
TURFLOOP GRADUATE SCHOOL OF LEADERSHIP
DATE: 6 April 2009
SUPERVISOR: Dr T. MOYO
ii
ABSTRACT
This study focuses on the impact of the community development projects on
the livelihoods of the people. The aim of the study is to assess the impact of
the community development projects and the livelihood of the community of
Lepelle-Nkumpi Municipality.
The study examines the operations and performance of the community
development projects since they started. The objectives of the study are to
assess the impact of the community development projects on the livelihood of
the beneficiaries and the community in terms of income, jobs and living
standards, as well as identify and recommend appropriate intervention
strategies where necessary.
The finding of the study revealed that the community development projects
did have an impact on both job creation and income generation, although the
income part of it is not satisfactory. The other findings were the skewed
participation where women were dominating.
The study reveals that the government and the private sector should play an
active role in training the beneficiaries, encourage youth participation in order
to ensure sustainability of the projects, and also expose the project members
to different technologies available in agriculture to ensure mass productions
which will translate into better incomes from the projects.
iii
DECLARATION
I declare that the research conducted on community development projects is
my own work and it has not been submitted before for any degree or
examination at any other university and that the sources I have used or
quoted have been indicated and acknowledged as a complete reference.
Name: Nziane E.M.
Signature: -----------------------
Date: -----------------------

iv
DEDICATION.
Dedicated to the memory of my late grandmother, Favasi Magodweni Nziane,
who instilled in me the importance of education and hard work.
v
ACKNOWLEDGEMENT
I would like to give a standing ovation and hearty round of applause to a
friend, John Byamukama who worked very hard to help make me understand
the interpretation of the research findings – for the inspiration and perspiration
that define a true friendship.
I sincerely acknowledge the moral support by Nyoni J.L, a friend and a former
student at the University of Limpopo, who was like a father to me.
I also appreciate the advice, criticism and suggestions of my supervisor, Dr T.
Moyo of the University of Limpopo who provided details and insightful
comments for this mini- Dissertation.
Finally, and most important, many thanks to my wife, Raesibe Margaret and
my daughter, Favasi Nziane, for patiently providing support, understanding,
and good humour throughout the research process. To them, I will be forever
grateful.

vi
LIST OF ACRONYMS.
AU - African Union
CAADP- Comprehensive African Agricultural Development Program
CASP - Comprehensive Agricultural Support Programs
CBO - Community Based Organisation
CDM - Capricorn District Municipality
CDPs - Community Development Projects
DBSA - Development Bank of Southern Africa
DPLG - Department of Provincial and Local Government
FAO - Food and Agriculture Organisation
GMA - Game Management Area
IDP - Integrated Development Plan
IRD - Integrated Rural Development
LED - Local Economic Development
Lrad - Land re-distribution for Agricultural Development
NEPAD- New Economic Partnership for African Development
PDA - Participatory Development Approach
PPMC - Participatory Project Management Cycle
PRA - Participatory Rural Appraisal
RDP - Reconstruction and Development Program
REAP - Rural Enterprise Advancement Program
RRA - Rapid Rural Appraisal
vii
Table of contents
Chapter 1. Background 1
1.1 Introduction 1
1.2 Problem statement 1
1.3 Motivation of the study 2
1.4 Aim and objectives 2
1.5 Research questions 2
1.6 Operational definitions 3
Chapter 2. Literature review 5
2.1. Introduction 5
2.2. Community development projects and livelihoods: conceptual
approach 8
2.3. Empirical evidence on community development projects and
impact on livelihoods in South Africa 12
2. 4 Regional and global perspective 13
2. 5 Theoretical framework 14
2. 6 Synthesis of issues 23
Chapter 3 Research methodology 26
3. 1 Research design 26
3. 2 Area of study 27
3. 3 Population sampling 27

viii
3.4 Choice of instruments 27
3.4.1 Secondary data source 27
3.4.2 Primary data source 27
3. 5 Data collection methods 28
7 Data analyses 29
Chapter 4. Presentation of results and discussion 31
4.1 Introduction 31
4.2 Presentation of findings 31
Chapter 5. Conclusion and recommendations 66
5.1 Introduction 66
5.2 Conclusion 66
5.3 Recommendations 69
List of tables
Table 4.1: Gender distribution of respondents 32
Table 4.2: Marital status of respondents 34
Table 4.3: Household size of respondents 36
Table 4.4: Head of household 37
Table 4.5: Relationship with household 38
Table 4. 6: Satisfaction with project size 42
Table 4.7: Project members 42
Table 4.8: Years of establishment 44
Table 4.9: Registration 44
ix
Table 4.10: Project activity 45
Table 4.11: Distribution on funding 46
Table 4.12: Distribution of desired income 49
Table 4.13: Source of advice 51
Table 4.14: Community perception 54
Table 4.15: Frequency of visits 54
Table 4.16: Distribution of opinion on farming in Limpopo 56
Table 4.17: Distribution of previous occupation 57
Table 4.18: Major challenges 59
Table 4.19: Possible remedies 59
List of graphs
Figure 4.1: Age distribution of the respondents 33
Figure 4.2: Educational qualification of respondents 35
Figure 4.3: Basic income sources 37
Figure 4.4: Years in farming 39
Figure 4.5: Training 40
Figure 4.6: Project size 41
Figure 4.7: Distribution of participation 43
Figure 4.8: Growth constraints 47
Figure 4.9: Amount in rands 48
Figure 4.10: Attendance of project activities 50
Figure 4.11 Attitude of participants’ children 53
Figure 4.12: Opinion on the advice of the extension officer 55
x
Figure 4.13: Distribution of living standards 58
Appendix 71
A. Questionnaire 71
References 87
1
Chapter 1
Background on community development projects and
livelihoods in the Lepelle-Nkumpi municipality
1.1 Introduction
Lepelle-Nkumpi is one of the municipalities within the Capricorn District in the
Limpopo Province and is located in the southern part of the district. The municipality
is predominantly rural, with a population of approximately 227 965 people and it
covers 3 454.78km², which represents 20.4% of the district’s total area. 95% of the
total land falls under the jurisdiction of the Traditional Authorities (Integrated
Development Plan (IDP), 2006 -2011).
The IDP (2006-2011) reflects that more than seventy five percent of the people
depend on the income of others for survival. About seventy two percent of the
population lives below the breadline, with an employment rate over forty five percent.
Black South Africans were densely settled in communal areas during the colonial
and apartheid period in the so-called homelands. They were unemployed and ill-
placed to participate in the economy, except as unskilled and semi-skilled labourers
(Ngomane, 2006: 202). This triggered the introduction of community development
projects aimed at poverty as well as unemployment reduction. These projects are
initiated by the LED and poverty reduction initiatives, mostly introduced by national
and provincial government departments. The supporting role of the state lies in a
developing climate conducive to institution-building and helping to establish fledging
organisations by building and nurturing them, and recognising them as participatory
forums and bodies (Swanepoel and De Beer, 1997:62).
1.2 Problem statement
In response to the many development challenges facing the Lepelle-Nkumpi
municipality a number of community development projects have been initiated.
However, it is not clear what impact these projects have made on the livelihoods of
beneficiaries and whether they are sustainable or not.
2
1.3 Motivation of the study
Media reports indicate that the success and the effectiveness of anti-poverty
interventions are based on the political considerations that privilege the amount of
state expenditure on poverty (Sunday Times, September 28 2003: 2) to the
detriment of other objectives of the poverty alleviation programmes, such as job and
income creation (Kwaw, 2006: 1).
The inability of the current poverty interventions that are part of the Provincial
economic growth strategies to open opportunities for socio-economic up-liftment of
the majority of the African population is a concern to all (Kwaw, 2006:2).
Therefore, little is known about the programmes, project design, and their possible
impact on beneficiaries (Kwaw, 2006: 5).
1.4 Aim and Objectives
The aim of the study is:-
• To assess the impact of the community development projects on livelihoods
of the beneficiaries and the community in terms of incomes, jobs and living
standards; and
• To identify and recommend appropriate intervention strategies where
necessary.
1.5 Research Questions
• What is the nature of the community development projects (CDPs)?
• How sustainable are they?
• How have the CDPs impacted on jobs?
• What jobs have been created though CDPs?
• What income has been generated for members?
• How has the wider community benefited from the projects?
3
1.6 Operational Definitions
Poverty
According to the World Bank (2001:2), poverty can be defined as the lack of, or the
inability to achieve, a socially accepted standard of living. Lack refers to no
command over economic resources, for example, basic food, shelter, or income to
buy the basic needs. Whereas inability is associated with incapability failure to
participate productively in a society. According to Todaro and Smith (2006: 805),
poverty is a situation where a country or section of a population is, at most, able to
meet only its subsistence essentials of food, clothing and shelter so as to maintain
minimum levels of living.
Household
This is a basic unit of analysis in many microeconomic and government models. It
consists of all the persons who occupy a housing unit. Census Bureau (n.d).
Household income
It includes the income of the householder and all persons 15 years and older in a
household, whether related to the householder or not
(wordnet.princeton.edu/perl/webwn).
Inequality
The existence of disproportionate distribution of total national income among
households whereby the share going to rich persons in the country is far greater than
that going to poorer persons (Todaro and Smith, 2006: 53).
4
Community development
Refers to the health, housing, education, and welfare (including economic welfare)
conditions of individuals, households, and communities within a locality (Hindson and
Vicente-Hindson, 2005:12).
Sustainable development
Sustainable development is the development that meets the needs of the present
without compromising the ability of the future generation to meet their own needs
(Swanepoel and De Beer, 1997: 31).
Participation
This is the act of sharing in the activities of a group, the condition of sharing in
common with the others (wordnet.princeton.edu/perl/webwn)
Vulnerability
Is the potential to suffer harm or loss, related to the capacity to anticipate a hazard,
cope with it, resist and recover from its impact (DFID, 1999-2005)
Food security
It is the physical, social and economic access to sufficient, safe and nutritious food
by all South Africans at all times to meet their dietary and food preference for an
active and healthy life (Department of Agriculture, 2002:15).

5
Chapter 2
Literature review: community development projects and
livelihoods
2.1 Introduction
The emphasis on community development in South Africa emanates from the
Reconstruction and Development Program (RDP) (South Africa, 1994: paragraph
1.3.3) which is conceptualised to bring about social development by means of a
people-driven process. The processes involve that communities must take
responsibility for their own development, and as a result, they have to be empowered
to do so (Tamsane, 1998:67).
Most of the rural small-scale farmers in African countries wish to improve their
standard of living, make profit, generate income, increase wellbeing, and improve
food security and sustainability of environmental resources, Mukhala (1999) as cited
by Masiteng and van der Westhuisen (2001:75).
In community development projects, the challenge the government institutions are
facing is where the farmers are farming as a group, non-active members were found
to create problems and conflict among other active members. Less active members
demand the same share as the actively involved participants. On a comparative
basis, the argument resembles the findings by Masiteng and van der Westhuisen
(2001:80).
According to Machethe (2004:9), small holder agricultural growth cannot be achieved
without access to farmer support services, where these farmers can significantly
increase agricultural productivity and production.
The Comprehensive Agricultural Support Program (CASP) was introduced in South
Africa to address the problem of lack of access to farmer support services. It
appears to have incorporated some of the lessons from the agricultural development
experience of the 1960s (Machethe, 2004:9).
This observation is based on the fact that the programme attempts to provide a wide
range of services simultaneously rather than emphasising one of the elements of a
progressing rural structure (Machethe, 2004:9).

6
Poverty and food insecurity in South Africa is the result of several centuries’ of
colonial and apartheid policies designed specifically to create general conditions
unfavorable to the wellbeing of black people in its all aspects, especially in the
former homelands (Department of Agriculture, 2002:18).
Impelled by its social and economical imperatives, successive white governments
throughout the greater part of the twentieth century transformed agrarian nineteenth
century society through a two-pronged strategy that set in motion a process that
would simultaneously cripple and debar African farming and entrepreneurial
development. The strategy enabled and entitled white farmers and industrialists as
leaders and chief beneficiaries of industrial development (Department of Agriculture,
2002:18-19).
According to the Department of Agriculture (2002:19), the decline of African farming
led to the gradual loss of agricultural and rural capital, wealth, farming and
entrepreneurial skills and experiences. Farming and rural enterprise activities ceased
to be a window of African entrepreneurial opportunity, management, and technical
development.
To a greater extent these historical legacies led to the current situation, in which a
majority of citizens (particularly Africans) do not have food security (Department of
Agriculture, 2002:19).
The interventions by the apartheid government included the establishment of the
smallholder irrigation schemes in the former homelands of South Africa, where the
incidence of poverty is always high (May, 2000; Aliber, 2003: 158). These
smallholder irrigation schemes present an attractive opportunity for development of
local livelihoods (Van Averbeke and Mohamed, 2006:5).
Each homeland was to cater for a particular cultural or language group. To give
credence to the concept of independence, it became imperative that the economy of
the different homelands improved, because without exception they were islands of
underdevelopment and poverty (Bernart, 2001:481). Almost half of the population
continues to live under poverty datum line (Adelzadeh, 2006 as cited by Triegaardt,
2006:3).
It is estimated that just over 22 million people in South Africa live in Poverty (DBSA,
2005a: 122). Poverty and inequality in South Africa have racial, gender, spatial and
7
age dimensions. The concentration of poverty lies predominantly with black Africans,
women, rural areas and black youth (Triegaardt, 2006:4). Poverty and inequality go
hand in hand with unemployment. The unemployment rate is 26.7% or approximately
four and a half million people (Stats SA, 2005:32).
Given the enormity of the poverty backlog in the country, an LED fund program was
launched by National Government in 1999, especially with the aim to fund local
government-led poverty alleviation projects. (Binns and Nell, 2002: 198). Since 2002
all local governments are expected to embark upon what has been termed
Integrated Development Planning, which has been defined as a participatory
approach to integrate economic sectoral, spatial, social, institutional, environmental
and fiscal strategies, in order to support the optimal allocation of scare resources
between sectors and geographical areas and across population in a manner that
provides sustainable growth, equity and the empowerment of the poor and the
marginalized (DPLG, 2000:15).
Agricultural development projects in Africa have predominantly followed the input-
output development model, which assumes that a country’s economic, and social
development can be extremely introduced (Donnely-Roark, 1998:25) as cited by
Hart, Burgess, Beukes and Hart (2005:104). The projects based on these models
have not achieved sustainable development because they were not grounded in a
participatory approach. The participatory toolbox e.g. Rapid Rural Appraisal (RRA),
Participatory Rural Appraisal (PRA), etc. were seen as models to provide that
platform (Hart et al, 2005:106).
Hart, Beurgess, Beukes and Hart (2005:106) Proposed a Participatory Project
Management Cycle (PPMC) as framework and platform for managing participatory
projects.
A case study conducted on PPMC during 2002-2003, indicated that by identifying
each phase and the associated activities, the PPMC makes project managers and
local participants aware of what is required in terms of activities, timing, methods and
tools during each phase i.e. it communicates to all involved as to what need to
happen where, when and how (Hart, Burgess, Beukes and Hart, 2005:107).
Cleary (2003:4) indicates that a sustainable livelihoods approach is noted as aiming
to promote development that is sustainable, not just ecologically, but also
8
institutionally, socially and economically in order to produce genuinely positive
livelihoods outcomes. This is to be achieved though a variety of approaches: People-
centered, responsive and participatory, multi-level, conducted in partnership,
sustainable (with the four key dimensions of sustainability, being, economic,
institutional, social, and environmental), and dynamic (Cleary, 2003:4).
Cleary (2003:4) also identifies pentagon of five capital assets that are available to
rural people i.e. human, social, physical, financial and natural capital.
The promotion of sustainable livelihoods is a key objective in the FAO strategic
framework 2000-2015 (FAO, 2005:1). In FAO, people-centered development is used
as an umbrella term to include a wide range of approaches or frameworks used by
FAO and other development agencies and their partners. These approaches include
the sustainable livelihood approach, farming systems, social, economic, and gender
analysis, Gestion de Terroise, IRD, market analysis and development for community
based tree and forest product enterprises, participatory development approach
(PDA) and farmer field schools (FAO, 2005:2).
People-centered development is not a new paradigm but an umbrella, which can
cover not only “approaches”, but also best practice principles that build on the belief
that centrally or extremely mandated development projects and programmes do not
result in successful development if they do not respect the priorities of communities’
needs and their roles in an informed decision-making process (FAO, 2005:2)
2.2 Community development projects and livelihoods: conceptual approach
Poverty is increasingly becoming the most important cause for a multitude of social
and economic disasters, the magnitude of which is affecting close to 70% of the
world population (World development Report, 2003:83). Brooks (2002:6) maintains
that while agricultural output is growing in Africa, productivity, as measured by the
average productivity of agricultural land and labor, has declined over most of the last
two decades.
Rising agricultural productivity is regarded as the first step in the process of
agricultural transformation and achieve the poverty reduction objectives in order to
reverse of the observed productivity trends (Brooks, 2002:6; World Development
Report, 2003:83).
9
South Africa is classified as an upper middle-income country, with one of the most
skewed distribution of income and inequality in the world. The country’s Gini-
coefficient is estimated at 0.68 calculated from the 1996 population census data
(Marais as cited in FAO, 2004: 2). The new South Africa, after the apartheid regime,
inherited marginalised groups living in abject poverty. According to Terreblanche
(2002:133), about 40% to 50% of South Africa’s population can be classified as living
in poverty, while 25% of the population can be categorised as ultra poor. Julian et al,
(1998:4) assert that it is conventional to draw up a poverty line reflecting the
monetary value of consumption, which separates the poor from the non-poor. For
South Africa, this cut-off point can be defined by considering the poorest 40% of
households (about 19 million people or just fewer than 50% of the population) as
poor. The National Treasury (2003: 7) indicates that 43% of the households suffer
from food poverty.
The Rural Industries Innovation Centre – R11C (1997:29, as cited by Arnold 1998:6)
also found that the main users of these products are poor members of the
community, and that they depended on veldt products due to the lack of access to
alternative sources of livelihood.
The majority of the world’s poorest people live in rural areas and are engaged in
subsistence agriculture. Rural development, the effort to improve the living standards
of these people and make the process self sustaining, is currently a major goal of
many national plans and even some foreign assistance programs (Todaro, 1977,
Lele, 1975:334 as cited by Bryant and White, 1980:2). An expanded concept of rural
development takes into account the many components of the economy and society
which have an impact on life in rural areas and which affects the incomes of rural
people, (Bryant and White, 1980:4). Bryant and White (1980:4) argue that since the
causes of rural poverty are multiple and interdependent, they must be addressed
simultaneously in many sectors. However, the strategic problem therefore, is to
identify which of those components is likely to have the greatest multiplier effect on
the other factors, as well as those where some leverage exists for bringing about
change (Bryant and White,1980: 4).
Poverty and unemployment are urgent problems in the rural areas in South Africa
(Mahlati, 2000:188). Only 18% of those who are employed in the agriculture sector
10
are women and many others rely on irregular income from seasonal work (South
Africa, Department of Labor, 2004:9).
Ngwane et al (2002, as cited by Botha, Van der Merwe, Bester and Albertyn,
2007:3), state that although income-based poverty focuses on an important
dimension of deprivation, it only gives a partial picture of the many ways in which
human lives can be blighted. General thinking on poverty eradication strategies
focuses on the conceptualisation of poverty as multifaceted rather than being due to
the lack of income alone (Chemhuru and Nhamo, 2004:62).
There is a strong correlation between the level of education and the standard of
living: the poverty rate among the people with no education is 69%, compared with
54% among people with a primary education, 24% among those with secondary
education, and 3% among those with a tertiary education (May, 1998: 5).
May (1998 5) also indicates that there is also a correlation between poverty and ill-
health, although this is more difficult to measure. Access to effective health care is a
specific to a particular social and environmental situation.
Faced with this outlook, government formulated the Growth, Employment and
Redistribution (GEAR) strategy, which reiterated government’s commitment to the
existing economic policy framework, identified many of the structural weakness
inhibiting economic growth and employment, and focused attention on market-based
in order to address them (May, 1998:7). The strategy recognizes that a sustained
reduction of inequalities requires accelerated job creation, which in turn requires
structural transformation to achieve higher and more labor-absorbing growth within
the economy (May, 1998:7)
Labor market may not be the main instrument for the eradication of poverty; an
effective, successful process of poverty eradication is only achievable though co-
ordinated government strategies and action. Other labor policy areas (welfare and
health, etc.) should be included (May, 1998: 14).
According to Machete (2004:2), the role of agriculture in the economy is generally
acknowledged. One school of thought argues that since the majority of people in
most developing countries lives in rural areas and are engaged in agricultural
production or agricultural related activities, agriculture is the most effective way to
reduce poverty (Machete, 2004: 2)
11
The second school of thought recognises the contribution of agriculture to poverty
alleviation but attaches more importance to non-agricultural activities e.g. rural non-
farm enterprises and social services. According to Machete (2004: 3) results of the
studies conducted in several counties indicated that the pro-poor role of agricultural
growth could be dramatic, and much more effective than other sectors at reducing
poverty and hunger. According to FAO (2004:12) agricultural growth has strong and
positive impact on poverty often significantly greater than that of other economic
sectors. Machete (2004: 4) indicates that farming is the greatest contributors to
household income where more than 40% of the total household income is generated
from farming. Non-farm income includes old-age pension, remittances, wages, and
family business (Machete, 2004:4).
One of the encouraging developments in recent years has been the growth in
support for home gardens, especially in peri-urban and urban areas, where small
plots of vegetables in particular, can contribute significantly to both livelihoods and
nutritional standards (Department of Agriculture and Land Affairs, 1998:7).
Participatory development is more difficult to design and implement than
development managed by administrators, but requires more social learning, taking
risk, co-ordinated skills and patience (Bryant and White, 1984:1). Many political
leaders campaign promises. Participation is difficult to implement and not knowing
how to implement it as well as not anticipating the practical difficulties that follow,
their commitment to participation becomes diluted when the inevitable difficulties
arise (Bryant and White, 1984:1).
2.3 Empirical evidence (community development projects and impact on
livelihoods in South Africa)
The commission (1955) recommended that the smallholder irrigation schemes be
used as one of the strategies to provide full-based livelihoods to black families in the
“Bantu Areas”. By contract, the commission (1955) found that nationwide the mean
annual income among the rural families with livelihoods that were completely land
based was 57 British pounds.
The commission (1955) counted 122 smallholder schemes, existing or under
construction, covering a total area of 7 538ha. The second era of the smallholder
irrigation was from 1930-1960 and can be referred to as the smallholder canal

12
schemes (Backeberg and Groenewald, 1995: 4). These were constructed after the
Second World War (Van Averbeke and Mohamed, 2006: 4).
The third period of the small holder irrigation development was established in the
independent homeland era which lasted from 1970 until 1990 and was an integral
part of the economic development of the homeland (Beinart, 2001: 55). In 2002, the
Limpopo Province broadened the scope of its irrigation scheme rehabilitation
intervention by launching a comprehensive revitalization program called RESIS
(Revitalization of Smallholder Irrigation Schemes) (Limpopo Department of
Agriculture, 2002: 18). In 2005, Commercialisation became the principal
development objective of RESIS; the shift in emphasis was possibly influenced by
the Black Economic Empowerment (BEE) Strategy that was introduced in SA
(Department of Agriculture, 2006: 6).
Additional evidence on community development projects is from a case study of
livelihoods and farming among plot holders homesteads conducted during the period
of 2003 to 2006 at Dzindi area in the Vhembe District of Limpopo Province
(Averbeke and Mohamed, 2006: 18).
One of the challenges facing South Africa is job creation and development of
people’s skills (Kotze and Staude, 1996) as cited by Botha et al (2007:3).
Bembridge (2000) as cited by Averbeke and Mohamed (2006:11) reported that the
proportion of plot holder homesteads living below the poverty line on for small holder
irrigation schemes ranged between 50% and 75%. This questions the impact of
small-scale irrigation on livelihood and poverty. In the case of Dzindi area in Vhembe
district of the Limpopo Province, the positive impact of irrigated agriculture on the
homestead income was evident when the scheme was compared with a selection of
rural dry land settlements in South Africa (Averbeke and Mohamed, 2006: 3). In
black rural communities livelihood stresses and shocks are part of the people’s daily
life experiences. Life histories of a selection of plot holder homesteads at Dzindi
showed that at one stage or another, circumstance had forced them to rely on
farming their plot for a Livelihood (Averbeke and Mohamed, 2006: 3).
In the Eastern Cape communal farming contribute one third of the total land area and
supports 63% of the six million inhabitants (Lategan and Raats, 2005:260). This area

13
is also affected by the twin socio-economic ills of poverty and unemployment, the
latter close to 50% (Lategan and Raats, 2005:260).
2. 4 Regional and global perspective
Baumann (2000:136) emphasises the need for sustainable livelihoods to incorporate
political capital as an endogenous asset within livelihoods framework. She also
emphasises that this is also important in terms of ensuring local participation and
empowerment. In addition, changes in local power structures are going to find
themselves in opposition to local elites, to such an extent that SLAs may face
considerable resistance when there are attempts to organize the local population into
groups for changing the local access to resources. Baumann (200: 136) examined
the use of sustainable livelihoods (SL) in the following districts in India, Dehradun
(Utter Pradesh), and Rayagada (Orissa).
There was also the Getion de Terroirs approach to rural development that emerged
from the Francophone West African states as an attempt to improve upon existing
approaches to local rural development (Cleary, 2003:9). In terms of its introduction
world wide, this has happened only to a limited degree, with some trials in some
areas of Latin America, she added.
South Africa’s food security policy is located within a broader regional (targets
national, household, and individual food security) and international context (SADC’s
food, agriculture and natural resource unit is based in Zimbabwe) (Department of
agriculture, 2002:12).
2.5 Theoretical framework
2.5.1 Introduction
Development concerns people. It focuses on the millions of persons who are in
abject poverty across the world. Development is described differently by various
interest groups and philosophers (Kortze, 1997:2). In the western world development
has been regarded as change since the 1950s and the focus generally was on
economic change and growth of developing countries (Regan and Ruth, 2002:24). In
the third world, development was and still is expected to identify and address the
needs of unemployed, poor and deprived people through development efforts

14
(Coetzee 1989:2). All people want a wealthy life and for that reason the wellbeing of
people is the basis of development (Coetzee and Graaff, 1996:14).
Coetzee (1989:3) mentions that the western contribution to development was
accompanied by hidden motives. External involvement in development efforts often
resulted in a position of power over and domination of a developing country and
power is generally accompanied by exploitation (Freire, 1998:91).
For the purpose of the study the following development theories will be discussed;
modernisation, dependency theory, sustainable development, and the basic needs
theory. The investigation of community development follows, as these theories are
reflected in the idea of community development as it developed over time. The
discussion on community development projects and livelihoods is useful for this
study because it will evaluate on the impact these projects have made on the
community.
2.5.2 Modernisation theory
Developed from the need for economic growth in the second half of the 1950s.
According to Coetzee (1989:4), the idea of modernisation was a form of change that
focused on the influence coming from outside to the less-developed world. The
solution for the less-developed world was simple: ignore tradition and follow the
route to development as examined by the developed western countries (modernity)
(Davids, 2005:9; Coetzee and Graaff, 1996:39; Coetzee, 1989:17).
Leys (1996:10) explains that the theories of modernisation emphasised that the
values of the modern world would be spread out through education and technology
development aid programmes to the less-developed countries (LDC). To some
theorist the problem of underdevelopment was just a shortage of capital, (Leys,
1996:16).
Rostow (1990:4) explained development in five stages.
1. The traditional society is in a stage when almost no history exists (Rostow,
1990:4-6).
2. Societies are guided to enable them to imitate the economic history of the
European countries and to have growth resulting in development (Rostow,
1990: 6-7)

15
3. The take-off happens when economic growth occures independently.
Accumulated interest becomes part of the mode of growth and structures of
the society (Rostow, 1990: 7-9).
4. The society progresses to maturity and enhances the criteria of modern
efficient production. GNP indicates the progress (Rostow, 1990: 9-10).
5. The society is present in the stage of high mass consumption (Rostow, 1990:
10-11).
Modernisation as explained by Rostow assumes that economic and social change of
societies take place along a development continuum starting from traditional
underdevelopment to modernity. Progress always will be a possibility and
improvement will automatically follow, should the correct procedures (the third world
imitating the development steps of the west) be followed (Coetzee and Graaff, 1996:
56).
According to Rist (1999: 101) and Coetzee and Graaff (1996: 58), modernisation did
not always evolve in spite of favorable circumstances. Rostow argued that should
any of the stages experience obstacles, foreign capital could be used to remove
those obstacles to development on LDCs. (Davids, 2005:11; Coetzee and Graaff
(1996:58). Bauer (1995: 56) disagreed with the idea as aid recipients severely
restrict private internal investment.
From the 1960s to 1980s the former underdeveloped homelands of South Africa
were provided with infrastructure for agriculture, education, and industry by the
South African apartheid government. These underdeveloped areas were extremely
poor and unemployment rampant (Cock, 1980:45).
The aim was to institutionalise and support the policy of separate development and
to expose the people living in these areas to modernisation. The envisaged
development did not occur nearly to the extent envisaged and the trickle down effect
was not achieved (Coetzee, 1989: 39; Leys, 1996:10). People who qualified at
universities in these areas could not find employment. This was a typical example of
unbalanced growth and the progress of modernisation as the economy could not
provide employment for the educated people (Coetzee and Graaff, 1989:5).

16
Sharp criticism exposed modernisation as an effort to justify northern countries use
of domestic growth and foreign aid as methods of fighting communism. Southern
countries expected an improved future, promised by modernisation, while the new
ruling class of the South was benefiting only themselves and not the poor people
(Regan and Ruth, 2002:32; Rist, 1999:109). The critique resulted in reaction and
counter-reaction and the Dependency theory as a critique of mordernisation.
2.5.3 Dependency Theory
The dependency theory was a reaction to the shortcomings of modernisation and it
was mostly the Latin American countries that spearheaded the reaction. These
countries had enjoyed independence for more than a century but had not benefited
from modernisation and its promises. Coetzee and Graaff (1996:74) argue that the
same processes that led to growth and prosperity of the capitalist west in the past
broadly caused underdevelopment in the Third World. The elite of the Third World
that dominated the developing countries specialist export orientated economies had
a dependent relationship with capitalists in the more advanced countries (Coetzee
and Graaff, 1996: 74). Todaro (1989:79) describes dependency as a spiraling
phenomenon to which multinational corporations aid agencies and multilateral
assistance organisations such as the World Bank and the International Monetary
Fund contributed. The actions of the elite prevented rather than enhanced genuine
development efforts and resulted in the perpetuation of underdevelopment in the
Third World.
Todaro (1989:78) refers to this situation as the neo colonial dependency and regards
it as indirect Marxist thinking. Frank (1995:28) believes that the unequal exploitive
power relationships between the center (developed countries) and the periphery
(less developed countries) prevented poor nations from becoming self reliant and
independent in their development efforts. The end result of external interference was
the poor people concerned took up a passive role that was forced onto them by
outside forces as they were robbed their own free will (Vorster, 1989: 72).
As with modernisation, there were problems with the dependency theory and
different criticisms of dependency. Regan and Ruth (2002:32) argue that the
dependency theory attributed the wealth of developed countries unfairly to colonial
exploitation. Dependency did not attend sufficiently to the cultural aspects of
development. Internal factors that contributed to underdevelopment were ignored
17
(Davids, 2005:16). The de-linking strategy could lead to self destruction rather than
self-reliance.
The improvement of human conditions in particular material conditions was the
underlying motivation of development in the western world. The need existed for
development to be based on human well-being and basic human needs as defined
by ordinary people. The basic needs approach was an effort in development thinking
to move in such a direction.
2.5.4 The Basic Needs Approach
The concept of the Basic Needs approach made its first appearance in 1972 when
Robert Mcnamara the President of the World Bank gave his annual speech to the
governors of the bank. He was concerned about the dramatic conditions of the
people of the South who were unable to change their own circumstances out of
poverty because most basic needs were not being satisfied (Regan and Ruth,
2002:32). It also was a call for greater public development assistance. Countries
were encouraged to establish growth targets in terms of essential human needs:
nutrition, housing, health, literacy, and employment (Rist, 1999:163).
The Basic Needs Approach (BNA) was seen as a new paradigm striving for an
increasing social justice. Development in BNA terms included food, shelter, clothing,
health and education but also extended to other needs, goals, and values.
Development was further regarded freedom of expression (Coetzee, 1989:154). It
was believed that people must have the right to share their ideas and to receive
ideas and stimuli. Development implies the right to have work and experience
personal fulfillment through work (Coetzee, 1989:155).
The BNA did not supply all answers for effective development. Needs were based on
cultural perception and to understand needs in a universal and cross-cultural setup
was not as straight forward. The BNA was in coherence with the mainstream
economies. This implies that unlimited growth was needed to reach a point of final
satisfaction (Rist, 1999: 168-169). The BNA made a distinction between economic
growth and needs satisfaction, but the focus remained the material aspect of
development and not human issues.
The focus of BNA on what the basic needs of poor and deprived people are did not
develop into a methodology of how the basic needs could be met in development

18
programmes (Friedman, 1992:60). The BNA lost its support in the Third World, but
appeared again in the idea of participatory development (De Beer, 1997: 27). The
idea of development that enhances the basic needs of the people and
simultaneously looks at the constraints in the environment reappeared in the theory
of sustainable development. Sustainable development forms an integral component
of a people centered approach that is reflected in community development.
2.5.5 Sustainable Development
Environmental matters were not part of the development debate in the 1960’s and
1970’s. The environmental concerns of the North namely the loss of the ozone layer,
the loss of biodiversity as well as acid rain, combined with the Bruntland report in
1987, provided stimulus for this debate (Adams, 2001:1). The vision of sustainable
development of the Bruntland report was to maintain and revitalise the world
economy (Adams, 2001:72). This meant that the fulfillment of the basic needs of the
people through sustainable development had to serve economic development firstly.
The South shared the concerns of the North, but was more concerned about the
poor, water supply, bad sanitation, soil erosion, depletion of wood supplies, and
environmental health in general. These were the aspects that had a direct impact on
the poverty situation of the people of the South. The developing countries were of
the opinion that capital resources could be spent on efforts to address the
environmental problems of the South instead of undermining the livelihoods of the
poor (Redcliffe and Sage, 1995:5)
One of the approaches of sustainable development is that economic growth will
enhance technological power and wealth. The potential is then created to revitalise
the exhausted ecological resources (Treurnicht, 1997:87). However, it is unclear of
how technology can be effective in the context.
Sustainable development demands co-operation and support on different levels.
Guidance at individual government, intergovernmental and inter agent level should
be linked with the role of NGO’S and local community (African National Congress,
1994:4&5). Sustainable development needs to be implemented where people are
able to learn and empower themselves to act at a local level. Adams (2001:365)
concurs with the idea by stressing that sustainable development is possible only as
development from below.
19
In South Africa, the environmental problems can be traced back to the separate
development of apartheid. Parts of South Africa were overpopulated due to forced
removals and migration. The livelihood for families could not be sustained on the
small and infertile land occupied (Conwell, 1996:82)
Sustainable development cannot be separated from community development.
Development programmes that are based on people’s participation and
empowerment need to include the creation of environmental awareness. Cornwell
(1996:86) states that a common environmental ethos and ideology need to be
established in South Africa.
2.5.6 Community Development
2.5.6.1 Defining “community”
The term “community” usually refers to a group of people of the same locality. These
people share an interdependency that originates from their efforts to make a living.
The United Nation’s definition refers to communities of individuals at the lowest level
of aggregation at which people organise themselves in groups to be involved
involved in community development and in some ways dependent on each other
(Swanepoel, 1997: 18-19) Local communities may or may not share the same
ethnic, racial or class characteristics (Groenwald, 1989:257). In South Africa the
policy of separate development divided the population according to race into
separate groups. This policy resulted in racially homogenous communities
specifically in urban areas (Davids, 2005:18).
2.5.6.2 The evolving of the idea of community development
The idea of community development is not a new one. In the colonial times, getting
communities to take on responsibility for their own development was regarded as
part of efficient colonial government. The emphasis was on self help (Roodt,
1996:313). In the 1950’s to 1960’s the assistance of a more developed community to
a less developed community was prominent in community development (Jeppe,
1980:8). The trickle-down effect was a determinant for effective community
development (Roodt, 1996:313). The influence of modernisation was evident in this
top-down approach. The Elite benefited and local community initiative was absent.

20
2.5.6.3 People-centered community development
People-centered community development places the emphasis in development
projects on the action and the enhancement of the ability of the people to participate
in the process (Davids, 2005:18). It also implies that self esteem and living standards
of the participants improve through their own doing (Jeppe, 1985:30)
People-centered community development implicates participation in decision making
and implementation of development programmes and projects. People participate in
monitoring and evaluation as well as the share in the benefits of the development
opportunity. They become actors in the development process.
The participation of people contributes in different ways. The development project
has greater acceptance as people take ownership of the project. Participation
motivates people to become self-reliant with regard to their own development. It is a
method of ensuring equity as it provides opportunities for marginalised groups such
as women to influence development initiatives. Participation of the people can result
into capacity building and empowerment of the organisation as well (Davids,
2005:20).
Successful community development is determined by a range of contributing factors
such as sustainability, adaptiveness, ownership, simplicity, the roles of the
bureaucracy, agents and NGO’s (Davids, 2005:18) The role of bureaucracy changes
from inhibiting and prescriptive to capacity building and support in people centered
community development. Government becomes the enabler and is adaptive in its
approach. 2.5.6.4 Other initiatives on community development
In Brazil the main problems of the integrated rural (IRD) was the over-reliance on
technology and attempts to teach such technologies to small farmers. The project
designers failed to take into account the fact that the logic of subsistence farmers is
much more complex than the profit maximising assumptions usually applied to large
scale farmers (Cleary, 2003:24). It would appear that sustainable livelihood-type (SL-
type) approaches have much to offer the farmers, given their explicit use of local
knowledge (Cleary, 2003:24)
In a case study – CONASA (Community-Based Natural Resource Management and
Sustainable Agriculture) that was conducted on 01-January 2004-05, project works
to improve the livelihoods of communities in the Game Management Area (GMA) of
21
Sichifulo, Mulobzi and Bbilili in Southern Zambia indicated the following challenges
(FAO, 2005:4):
• During the diagnosis phase the project did not benefit from the full
complement of livelihood disciplines which became evident only during
the implementation stage. Key community stakeholders were absent
at the planning stages and so some community priorities were not
addressed during the project implementation.
• The absence of a steering committee at the inception phase meant that
initially the project suffered from low momentum as it did not have a
cohesive group of stakeholders to drive the activities.
• The project found that the Community Based Organization (CBO)
structures were threatened if they did not have support of local
government as the weak linkages between the CBO (micro-level) and the
local government (meso-level) impeded the implementation of some
activities.
• Lack of financial management skills meant that, at certain points, access
to resources was lacking, which affected the momentum and project flow.
The challenge for the utilisation of livelihood approaches in emergencies is that it
is extremely challenging to quantify impact on different capital assets. This
means that the approach is best used in conjunction with other tools to in order
drive detailed programming responses (Castro, 2002:4).
Research results over many decades have suggested that agricultural production
is the result of a process of interaction between a number of dependent variables
(yield, profit and sustainability) and independent variables (personal, production,
institutional and environmental factors). This is mediated by decision-making
process that is, in turn, influenced by a number of intermediate variables (Duvel,
1991) as cited by Lategan and Raats (2005:269).
This complex system of interrelationship also constitutes the operational
environment of the agricultural extension educationists and researcher
investigating the efficiency of adoption patterns and practice applications of
farmers (Lategan and Raats, 2005:270). This also holds true for the Rural

22
Enterprise Advancement Programme (REAP). According to Lategan and Raats
(2005:275), the establishment of the REAP is an important continuation of the
involvement of the University of Fort Hare in the promotion of the growth of the
South African developing agricultural sector through increasing participation in
commercial agricultural activities in an attempt to reduce poverty and increasing
purposeful job creation.
Although CD movement faltered in the 1950 in Asia, the World Bank and the
USAID replicated the IRD projects in Africa from 1976-1988 (World Bank,
1988:194).
The IRD projects were later reported to have had little to offer to a majority (70%)
of the resource poor farmers in Malawi (Thompson, 2002:231 and World Bank
1988:194).
The major failing of the most IRD projects was their lack of a technologically
sound basis of improving rural incomes, Lack of coordination as well as lack of
sustainability of the projects (McClelland, 1996) and the dependency syndrome
(GTZ, 2003).
Mwangwela and Duvel (2006:108) point out that the principle of maximum
community participation is based on the notion of self-determination, self-
reliance, self responsibility and self-help as a normative goal. This implies that
involvement should be extended to the ultimate empowerment and ownership of
the development process.
But this does not seem to be not the case as the communities even now are
failing to sustain the community development projects. The communities still rely
on the donors and government to sustain their projects.
The holistic approach to social interventions aimed at alleviating poverty is
therefore propounded Ngwane et al (2002:122) state that although income-based
poverty focuses on an important dimension of poverty, it only gives a partial
picture of the many ways in which human lives can be blighted.
2.6. Synthesis of issues
The core aim of community development development projects is to alleviate
poverty. The poor are not all the same. There are different poor stakeholders/first

23
level of differentiation- gender, age, socio-economic class, location, etc. have
different income earning options.
Understanding these differentiations is important/centre of framework/key to
understanding their needs and aspirations.
• Assets/capital/resources- natural (e.g. land, water, forest, etc).
• Human (e.g. strength, good health, information, skills, ability, capabilities,
traditional & local knowledge).
• Physical (eg.infrastructures, roads, water, electricity supply, schools, etc).
• Financial(e.g. cash, savings, credit, cattle, jewellery).
• Social (family, relatives, NGO & community, institutional support). Network &
relationships important in livelihood of the poor. Informal and formal social
linkages provide social safety net in difficult times; provide emotional &
psychological security, reciprocal obligations, support in times of need. Social
organisation (self help/pressure groups) play role in helping poor, enable poor to
make voices heard.
• People combine resources to make a ‘livelihood’. Important to understand
‘strengths’ and ‘weaknesses’ in relation to resources, determine opportunities to
change their livelihood.
• Direct influencing factor- governance, politics, power, patronage, access to
resources, knowledge and information, policy, regulation, service delivery,
economics, markets, religion, social norms, gender, age, education, etc.
• Indirect influencing factors/Vulnerability context- natural resource seasonality,
rural infrastructure, technology, economic growth, population, health & diseases,
risks to climate change, flooding, drought, employment opportunities &, market
demands, ownership, conflict, globalization, diversification (fishing, tourism, etc)
• Livelihood strategies (LS) – reflect ways in which direct and indirect
influencing factors affect ability of the poor to use resources effectively, to create
viable, sustainable livelihood. Otherwise be forced to adopt fragile, unsustainable
livelihood that leaves them in poverty or very vulnerable.
24
• LS- of the poor are diverse and complex reflecting variations in opportunities
available- e.g. for fishing communities, depended on fishing, fish processing,
agriculture, tourism, petty trading, laboring, boat building, net mending,
aquaculturist,etc.
• Interlinkages between incomes and employment activities, many of them
linked to Vegetables, poultry and Small stock.
• Key livelihood strategy may include greater youth engagement in productive
activities as early as possible. To get integrated into mainstream economic
activities, growing awareness of the long term value of education for children as a
livelihood strategy.
• Considerable specialization in some skills (e.g. hydroponics, Poultry
production, Organic farming, etc).
• Incomes or return from economic are low/marginal, leads to poverty. Poor
also lack skills, knowledge, attitudes, organizational ability, confidences, finance,
patronage linkages, access to resources, information and rights, especially
amongst ‘hidden poor’ or those left out from many poverty-focused development
efforts.
• Migration may become strategy to seek better access to resources or seek
better opportunities.
• Poverty link to various issues: i) low incomes ii) unemployment or
underemployment, iii) indebtedness, iv) poor health, v) low education. vi) drugs &
crime, vii) size and composition of family, viii) number of income earners, ix)
ownership of assets, etc.
• Livelihood Outcomes- improvements in well-being, health, incomes,
happiness, knowledge, stable natural resources, choices, security, inclusion,
poverty alleviation.
• Livelihood outcomes may improved, but for those whose livelihood have
worsened- living under growing resource, population and economic pressures,
sustainability may be dubious.
25
Chapter 3
Research methodology
3.1 Research design
A qualitative research design was adopted for the study. The primary goal for
using this approach is defined as describing and understanding where the
researchers have always primarily been interested in describing the actions of the
research participants in great detail and attempting to understand these actions in
terms of the actors’ own beliefs, history and context (Babbie and Mouton,
2006:271). The advantage of using a qualitative research method is that it
generates rich, detailed data that leaves the participants’ perspectives intact and
provides a context for healthy behavior (Weinreich, 2666: 2).
A research design is the plan according to which we obtain participants (subjects)
and collect information from them (Welman and Kruger, 2002: 46). In it we
describe what we are going to do with the participants, with a view to reaching
conclusions about the research problem (Welman and Kruger, 2002:46).
According to Babbie and Mouton (2006:72), research design addresses the
planning of scientific inquiry and strategy for investigation. There are two major
aspects of research design: firstly, you must specify as clearly as possible what
you want to find out, and secondly, you must determine the best way to do it
(Babbie and Mouton, 2006:72). According to Babbie and Mouton (2006: 72), as
mathematicians say, a proper-framed question contains an answer.
Babbie and Mouton (2006:72) further elaborate that in a scientific inquiry you
need to make observations and interpret what you have observed, and before
you can observe and analyse, you need to plan. You need to determine what you
are going to observe and analyse, why and how (Babbie and Mouton, 2006:72).
Verschuren and Doorewaard (1999:16) distinguish between two types of
research designs namely, a conceptual research design and a technical research
design. A conceptual research design determines what, why, and how much we
are going to study, where we mainly use concepts and the relationship between
concepts (Verschuren and Doorewaard, 1999: 16).

26
3.2 Area of study
The area of the envisaged study was Lepelle-Nkumpi local Municipality, one of
the local municipalities within the Capricorn District Municipality in the Limpopo
Province found in the Southern part of the Capricorn district, about 61km from
Polokwane. This area is predominantly rural with a population of about 227965
and covers 3454.78km², which represents 20.4% of the district total land area.
The municipality is divided into 27 wards, which comprises a total of 110
settlements. Approximately 95% of the land falls under the jurisdiction of the
Traditional Authorities (IDP, 2006: 10).
3.3 Population/Sampling
No sampling methods were used because the entire population will participate in
the research. The population comprised of 85 respondents. The respondents are
farming on both vegetables, broilers, nursery and goats.
3.4 Choice of instruments
3.4.1 Secondary data sources
The researcher made use of secondary sources such as journals, municipality
documents and all other literature that will contribute to enriching the findings of
this study.
3.4.2 Primary data source
Data were collected using both observations, interviews (both structured and
unstructured interviews). Questionnaires were used during the interviewing
process. The instruments were the most appropriate sources for information in
the evaluation of those community development projects. Participants were
subjected to those instruments so as establish the performance of the projects.
3.6 Data collection Methods
Data were collected from all the participants in the community development
projects through interviews and observations so as to ensure that all the relevant
information was captured. The researcher made use of observations as well
structured and unstructured interviews.

27
3.6.1 Observation
Participant observation was used by the researcher as a data collecting
technique in this study. Strydom et al. (2002: 289) discuss participant observation
as a valuable procedure for data collection in qualitative studies as it has an
exploratory character. Babbie (2004: 285) and Strydom et al. (2002:280) support
the notion that participatory observation implicates a continuum from complete
observer to complete participant with a variety of degrees of involvement
inbetween.
The challenge was to make regular notes on observations and experiences in the
research field and to convert it into field notes as soon as possible in order to
reduce errors. Observation was followed up with informal one-on-one interviews.
3.6.2 Interviewing
According to Strydom et al. (2002: 292), interviewing is the method of data
collection most often used in qualitative research. Babbie (2004: 299) describes
this technique as qualitative field interviewing. Strydom et al. (2002: 292) depict
the interview in the qualitative research sense as a conversation that presents a
two-sidedness. Babbie (2004: 300) explains that qualitative interviewing
implicates the interaction between the interviewer and the respondent. As Babbie
(2004: 300) advises, the interviewer had a general idea about questions to be
posed and guided the interview accordingly. A closer relationship between the
interviewer and the respondent was possible. The interviewer could show his
human side when asking questions and answering. He could show feelings.
Oakley (1884: 49) describes this as the reciprocal character of interviewing. Such
interviews provided a greater range of information deep insight about the
respondents. The respondents became participants in this nature Frey (1994:
370).
Different types of interviews were conducted in this research. The original aim
was to observe the impact of community development projects in the municipality
of Lepelle-Nkumpi Municipality. Unstructured and structured interviews methods
were implemented. One-on-one interviews were used to obtain information from
the project members in the municipality. The informal interview (unstructured)

28
resulted in respondents on occasions forgetting that they were being interviewed,
as questions followed from the immediate context.
The structured interview schedule was also used as one of the methods of
collecting data. The structured interview schedule is the data collection
technique most common used in social survey (Miller and Brewer, 2003: 253). A
structured interview is when the interviewers are present, asking questions and
helping the respondent, examples are face-to-face interviews or a telephone
survey (Miller and Brewer, 2003: 253). The advantages of structured interviews
as outlined by miller and Brewer (2003: 253) are:
Cheapness- Questionnaires are very cost effective e.g. No expenses in terms of
the time and travel of the interviewer exist. Problems associated with interviewers
are avoided with a questionnaire survey. When the respondent must go and look
up information, a mailed questionnaire is better because they can do this at their
leisure, although it was not useful in the study.
The respondents may been shown to be more willing to give out personal
information or to admit to ‘unsocial’ opinions when filling out any anonymous
questionnaire rather than telling the lurid facts face-to-face to an interviewer
who is a complete stranger.
Miller and Brewer (2003: 255) also highlighted the criticisms that the respondents
may not always be honest in answering a particular question, and such gaps may
easily be identified and addressed in the in-depth approaches to data collection
methods such as the unstructured interview.
3.7 Data analysis.
Data were analysed using the statistical package for social science (SPSS), with
basic commands to use when performing statistical analysis such as univariate
analysis, bivariate analysis (tabulations and cross tabulations), and regression
analysis, (Babbie and Mouton, (2006:583). A qualitative analysis (non-numerical
examination and interpretation of observation, for the purpose of discovering
underlying meanings and patterns of relationships) and quantitative analysis
(numerical representation and the manipulation of observations for the purpose of
describing and explaining the phenomena that those observations reflect, were
used (Babbie and Mouton, 2006:446). The analysis of qualitative data was the

29
concretisation of identified categories and the incorporation of pre-existing
knowledge into one theory that is being confirmed, created or added (Nkatini,
2005:40).
There were two basic approaches to follow when addressing the data analyses of
recurring themes in qualitative research i.e. the content analyses and
ethnographic summary (Welman and Kruger, 2002: 194). The content analyses
involved a systematic observation of personal documents and mass media
material where this was executed in order to making qualitative analyses of the
essence of the content of such an interview (Welman and Kruger, 2002: 195).
3.8 Conclusion
The respondents were fully supportive and patient during the collection of data.
No problems were encountered during the process.
30
CHAPTER 4
PRESENTATION AND INTERPRETATION OF RESULTS
4.1 Introduction
In this chapter the main objective is to analyse and present data collected in the
experience of the respondents in terms of the impact of community projects on the
livelihoods of the Lepelle-Nkumpi community. Data were gathered through
observations, questionnaires, and interviews with respondents participating in
various community projects within Lepelle Nkumpi municipality. A total of 85 people
were sampled. The data collected were subjected to statistical analysis through
SPSS for Ms Windows 14.0. This chapter is divided in eight sections following the
introduction.
4.2: Personal characteristics of the respondents
4.2.1 Gender
In terms of gender, a significant proportion of eighty one percent (69) of the
respondents were female and only a nineteen percent (16) male (table 4.1). Male
participation in the community projects was undesirably small. Females were more
actively engaged in community projects. The skew in gender indicated women were
in majority because men pursued different interests such as outside employment.
The government also encourages women empowerment by funding the projects
which were run by women. The results of female domination in agriculture
contradicts those found from other studies like Fabiyi et al (1991:234) who is of the
opinion that in Southwest Nigeria men dominate. Females in the Imo state were
rarely allocators of land rights and even their right to use land generally comes from
men. The situation might have resulted from different access to and control over land
use rights between men and women, and the same apples to South Africa as well.
Table 4.1 Gender of participants
Frequency Percent
Valid Male 16 18.8
Female 69 81.2
Total 85 100.0
31
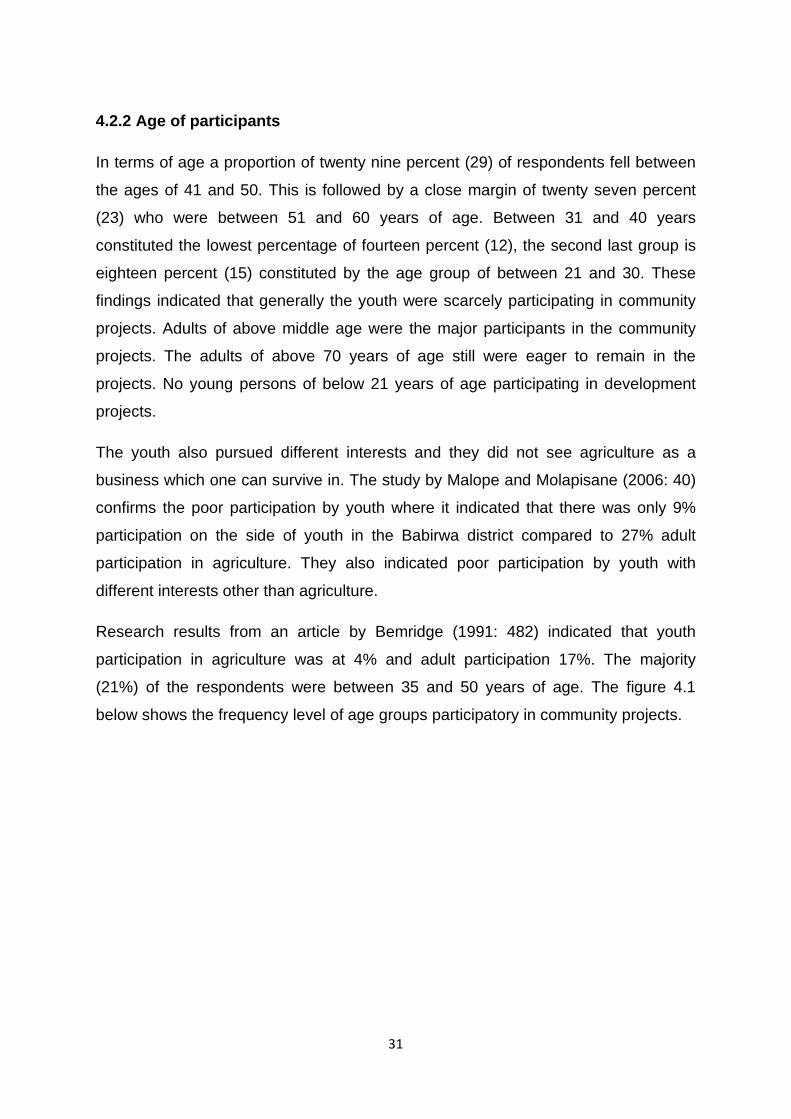
4.2.2 Age of participants
In terms of age a proportion of twenty nine percent (29) of respondents fell between
the ages of 41 and 50. This is followed by a close margin of twenty seven percent
(23) who were between 51 and 60 years of age. Between 31 and 40 years
constituted the lowest percentage of fourteen percent (12), the second last group is
eighteen percent (15) constituted by the age group of between 21 and 30. These
findings indicated that generally the youth were scarcely participating in community
projects. Adults of above middle age were the major participants in the community
projects. The adults of above 70 years of age still were eager to remain in the
projects. No young persons of below 21 years of age participating in development
projects.
The youth also pursued different interests and they did not see agriculture as a
business which one can survive in. The study by Malope and Molapisane (2006: 40)
confirms the poor participation by youth where it indicated that there was only 9%
participation on the side of youth in the Babirwa district compared to 27% adult
participation in agriculture. They also indicated poor participation by youth with
different interests other than agriculture.
Research results from an article by Bemridge (1991: 482) indicated that youth
participation in agriculture was at 4% and adult participation 17%. The majority
(21%) of the respondents were between 35 and 50 years of age. The figure 4.1
below shows the frequency level of age groups participatory in community projects.

32
Figure 4.1 Age distribution of the respondents
4.2.3 Marital status
In terms of the marital status, fifty eight percent (49) were married and thirty four
percent (29) were single. Single women had no interest in farming; this could be that
they might have pursued other careers other than farming. This factor in conjunction
with age and gender indicated that majority of participants were married females
above middle aged. Only a small proportion of 2% and 6% (2 and 5) were widows
and widowers respectively.
Table 4.2. Marital status of the respondents
Frequency Percent
single 29 34.1
Married 49 57.6
Widow 2 2.4
Widower 5 5.9
Total 85 100.0
>7161-7051-6041-5031-4021-30
25
20
15
10
5
0
Freq
uency
Age
33
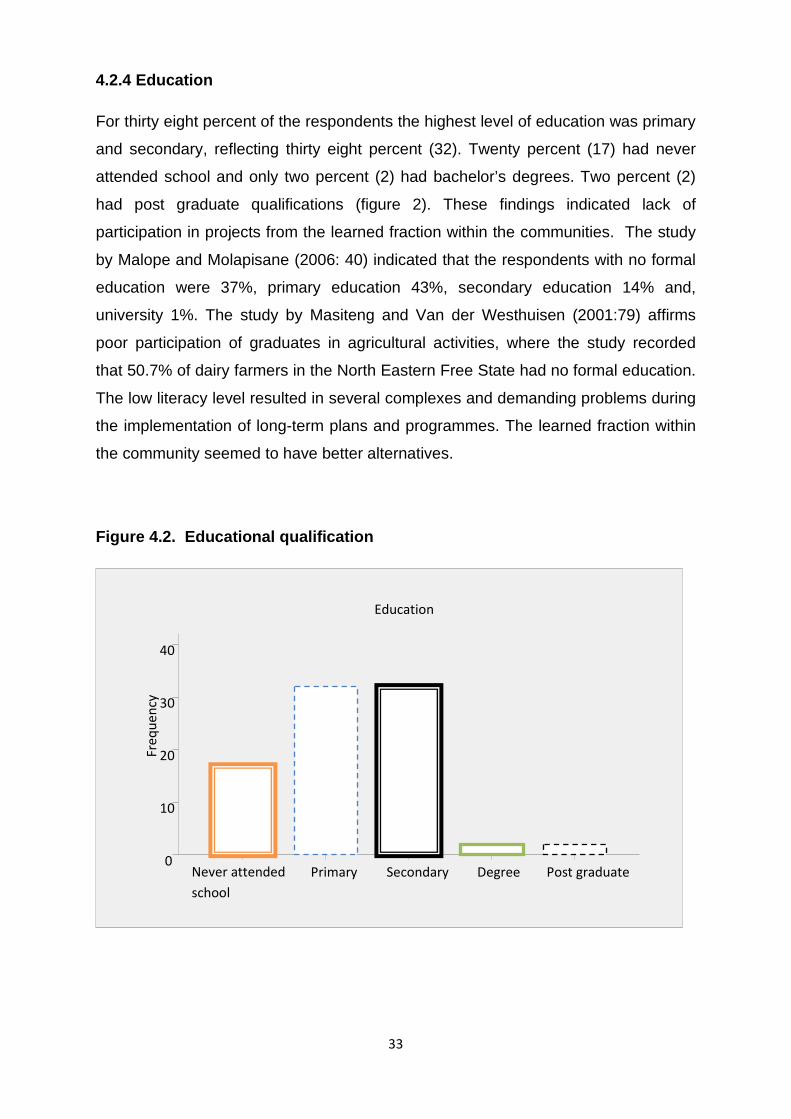
4.2.4 Education
For thirty eight percent of the respondents the highest level of education was primary
and secondary, reflecting thirty eight percent (32). Twenty percent (17) had never
attended school and only two percent (2) had bachelor’s degrees. Two percent (2)
had post graduate qualifications (figure 2). These findings indicated lack of
participation in projects from the learned fraction within the communities. The study
by Malope and Molapisane (2006: 40) indicated that the respondents with no formal
education were 37%, primary education 43%, secondary education 14% and,
university 1%. The study by Masiteng and Van der Westhuisen (2001:79) affirms
poor participation of graduates in agricultural activities, where the study recorded
that 50.7% of dairy farmers in the North Eastern Free State had no formal education.
The low literacy level resulted in several complexes and demanding problems during
the implementation of long-term plans and programmes. The learned fraction within
the community seemed to have better alternatives.
Figure 4.2. Educational qualification
Post graduateDegreeSecondaryPrimaryNever attended school
40
30
20
10
0
Freq
uenc
y
Education

34
4.2.5 Household size
In terms of the family size a proportion of 48% (41) had between 1 and 3 dependants
(table 4.3). The second highest proportion was 31% (26) with depends of between 4
and 6. The lowest percentage was 14% (12) composing of between 1 and 3
dependents and the second lowest was consisted of above 7 dependents with the
figure of 14% (12). Family size had more influence on community development
projects adoption behavior. Family sizes may not, in real terms, contribute in
increasing the resource pool of the farm family, especially if some family members
(i.e. school-age children) are not full time workers (Polson & Spencer, 1991).
Table 4.3 Household size of respondents
Household size
Frequency Percent
No Dependents 6 7.1
1-3 41 48.2
4-6 26 30.6
>7 12 14.1
Total 85 100.0
4.2.6 Source of income
A proportion of 57% (49) of the respondents derived their basic income from farming
projects (figure 4.3). A proportion of 24% (20) was employed and 8% (7) were
pensioners and 8% (7) self employed. These results indicate that farming played a
major role in generating income to sustain many households. Only 24% (20) were
employed and supplemented the income through income generated from the
community development projects.
Since the majority of the respondents depended on the projects, it would be critical
to develop strategies to improve the performance of the projects.

35
The findings by Malope and Molapisane (2006: 41) also affirm the research results
by the researcher where it indicates that 63% of the respondents reported that there
were no alternative income sources other than agriculture. Those who indicated that
there were other sources of income (21%) varied from paid employment, remittance
and old age pension. Those who reported lack of alternative sources represented
25% of the respondents. Masiteng (2000:163) states that households receiving both
pensions and wage work had relatively low incidence of poverty. There was a wide
range of income disparity among these farmers.
Figure 4.3 Basic income sources
4.2.7 Head of household
A proportion of 38% (32) of the respondents were the head of the household and
61% (52) were not head of the household while 1% (1) were single women. Table
4.4 below indicates the frequency levels of head of households and non head of
households in the community development projects. Heads household are
represented by (Yes) and non households represented by (No). In the studied
communities, major production decisions were made by the head of household, and
individual family members had very limited input in community development/ farming
decisions.
NoneFarmingPensionSelf employedEmployed
50
40
30
20
10
0
Freq
uenc
y
Source of income

36
Table 4.4 Head of Household
Frequency Percent
Valid Yes 32 37.6
No 52 61.2
6 1 1.2
Total 85 100.0
4.2.8 Relationship to head of household
A proportion of 45% (38) of non-household head respondents were related to the
household as wives, 15% (13) daughters and 5% (4) sons (table 4.4). These
proportions confirm the earlier finding that the active population fraction within the
communities in development projects are middle-age married women. Youth
participation was scarcely witnessed as shown in these findings.
Table 4.5 Relationship with head of household
Frequency Percent
Valid Wife 38 44.7
Son 4 4.7
Daughter 13 15.3
None 30 35.3
Total 85 100.0
4.2.9 Years in the projects
A proportion of respondents 39% (33), had spent approximately 6 years on the
project (figure 4.4). Twenty one percent (18) had 2 years, about 19% (16) had
5years, and 15% (13) had 8 years spent participating in the projects. One percent of
the respondents had participated for about 11years, 9years, and 4years. The
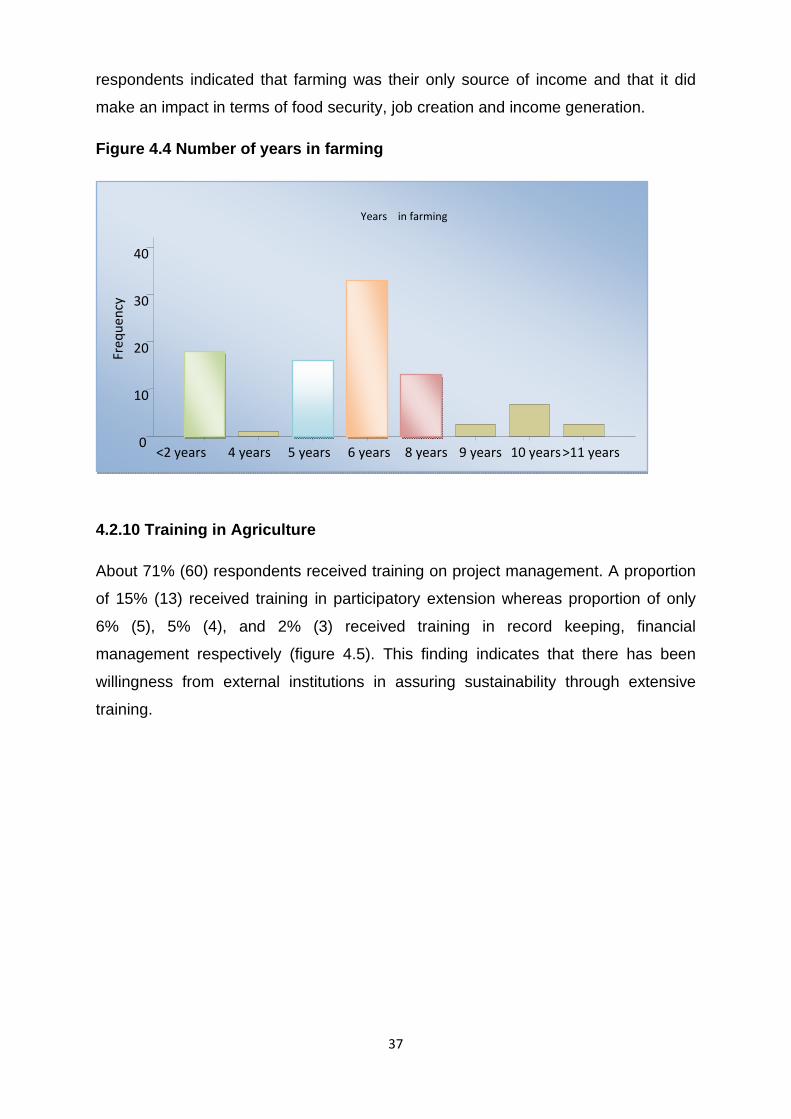
37
respondents indicated that farming was their only source of income and that it did
make an impact in terms of food security, job creation and income generation.
Figure 4.4 Number of years in farming
4.2.10 Training in Agriculture
About 71% (60) respondents received training on project management. A proportion
of 15% (13) received training in participatory extension whereas proportion of only
6% (5), 5% (4), and 2% (3) received training in record keeping, financial
management respectively (figure 4.5). This finding indicates that there has been
willingness from external institutions in assuring sustainability through extensive
training.
>11 years10 years9 years8 years6 years5 years4 years <2 years
40
30
20
10
0
Freq
uenc
y
Years in farming
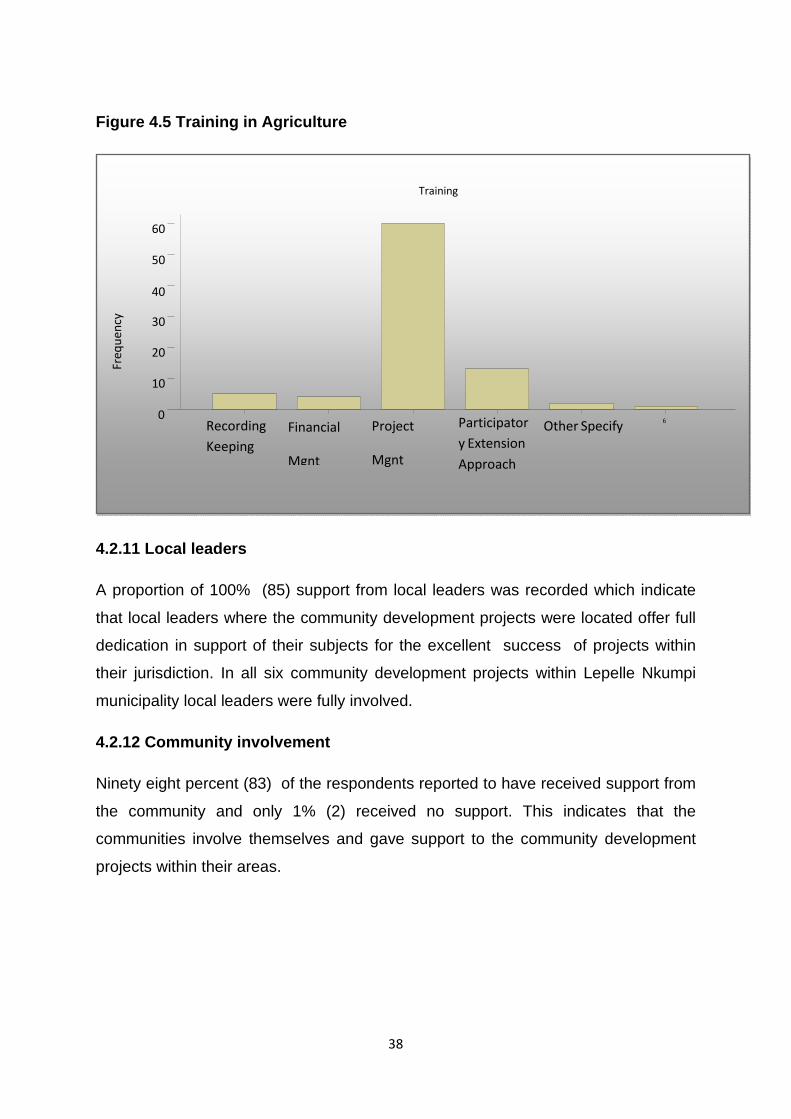
38
Figure 4.5 Training in Agriculture
4.2.11 Local leaders
A proportion of 100% (85) support from local leaders was recorded which indicate
that local leaders where the community development projects were located offer full
dedication in support of their subjects for the excellent success of projects within
their jurisdiction. In all six community development projects within Lepelle Nkumpi
municipality local leaders were fully involved.
4.2.12 Community involvement
Ninety eight percent (83) of the respondents reported to have received support from
the community and only 1% (2) received no support. This indicates that the
communities involve themselves and gave support to the community development
projects within their areas.
6Other SpecifyParticipatory ExtensionApproach
Project
Mgnt
Financial
Mgnt
Recording Keeping
60
50
40
Freq
uenc
y 30
20
10
0
Training
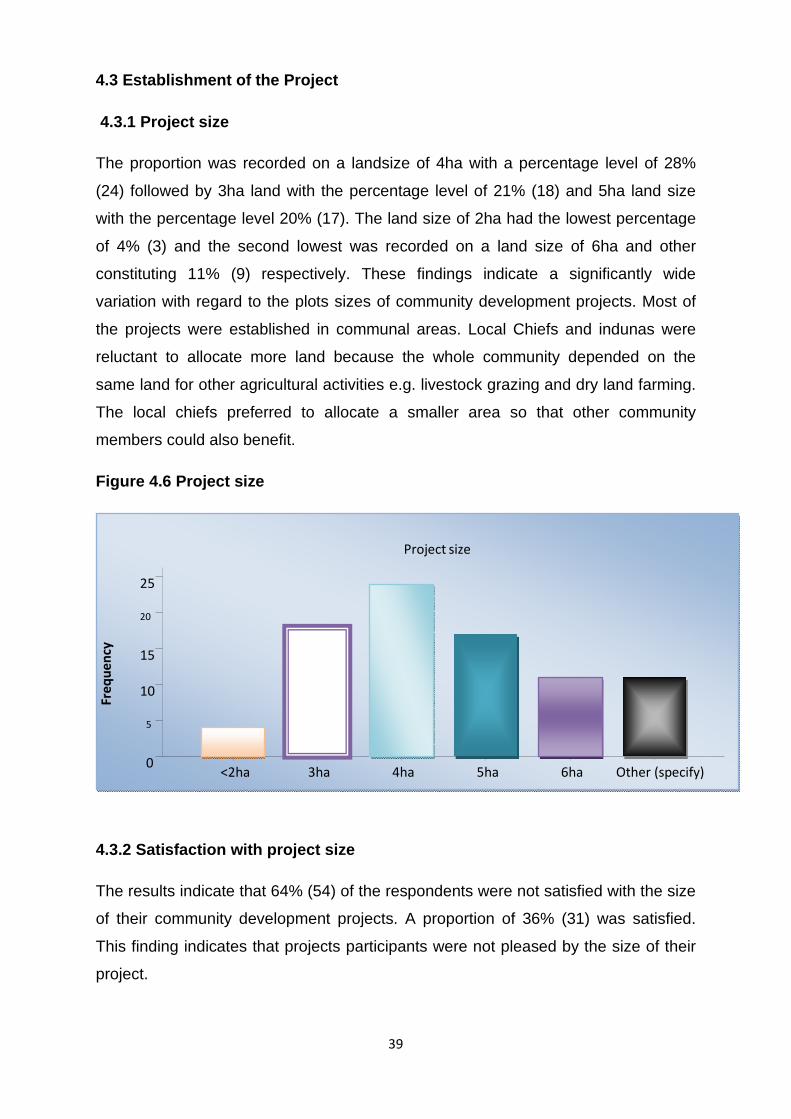
39
4.3 Establishment of the Project
4.3.1 Project size
The proportion was recorded on a landsize of 4ha with a percentage level of 28%
(24) followed by 3ha land with the percentage level of 21% (18) and 5ha land size
with the percentage level 20% (17). The land size of 2ha had the lowest percentage
of 4% (3) and the second lowest was recorded on a land size of 6ha and other
constituting 11% (9) respectively. These findings indicate a significantly wide
variation with regard to the plots sizes of community development projects. Most of
the projects were established in communal areas. Local Chiefs and indunas were
reluctant to allocate more land because the whole community depended on the
same land for other agricultural activities e.g. livestock grazing and dry land farming.
The local chiefs preferred to allocate a smaller area so that other community
members could also benefit.
Figure 4.6 Project size
4.3.2 Satisfaction with project size
The results indicate that 64% (54) of the respondents were not satisfied with the size
of their community development projects. A proportion of 36% (31) was satisfied.
This finding indicates that projects participants were not pleased by the size of their
project.
Other (specify)6ha5ha4ha3ha<2ha
25
20
15
10
5
0
Freq
uency
Project size

40
Table 4.6 Satisfaction with project size
Frequency Percent
Yes 31 36.5
No 54 63.5
Total 85 100.0
4.4.15 Project members
A proportion of 79% (67) has more than 8 members constituting the projects
membership. Proportions of 5% (4), 6% (5) and 11% (9) consist of 1, 5 and 6
members respectively. The finding indicates that most of the community
development projects spread arms to accommodate a large number of
memberships. In community development projects, the challenge the government
institutions are facing is where the farmers are farming as a group. Non-active
members were found to create problems and conflict among other active members.
Less active members demand the same share as the actively involved participants.
Table 4.7 Project Members
Frequency Percent
1 4 4.7
5 5 5.9
6 9 10.6
>8 67 78.8
Total 85 100.0
4.3.5 Reasons for Participation in the CDP
A proportion of 81% (69) of the community development projects contribute to three
major social dimensions, namely, employment opportunities creation, poverty
alleviation and food security (table 4.7). These figures of 1% (1), 4% (3) and 14%
(12) contribute in only either of the above three factors thus employment, poverty
reduction and food security respectively. These findings indicate that the community
development projects have been spread to embrace a number of key socio-
economic constraints. Since the majority of the project members were women, they
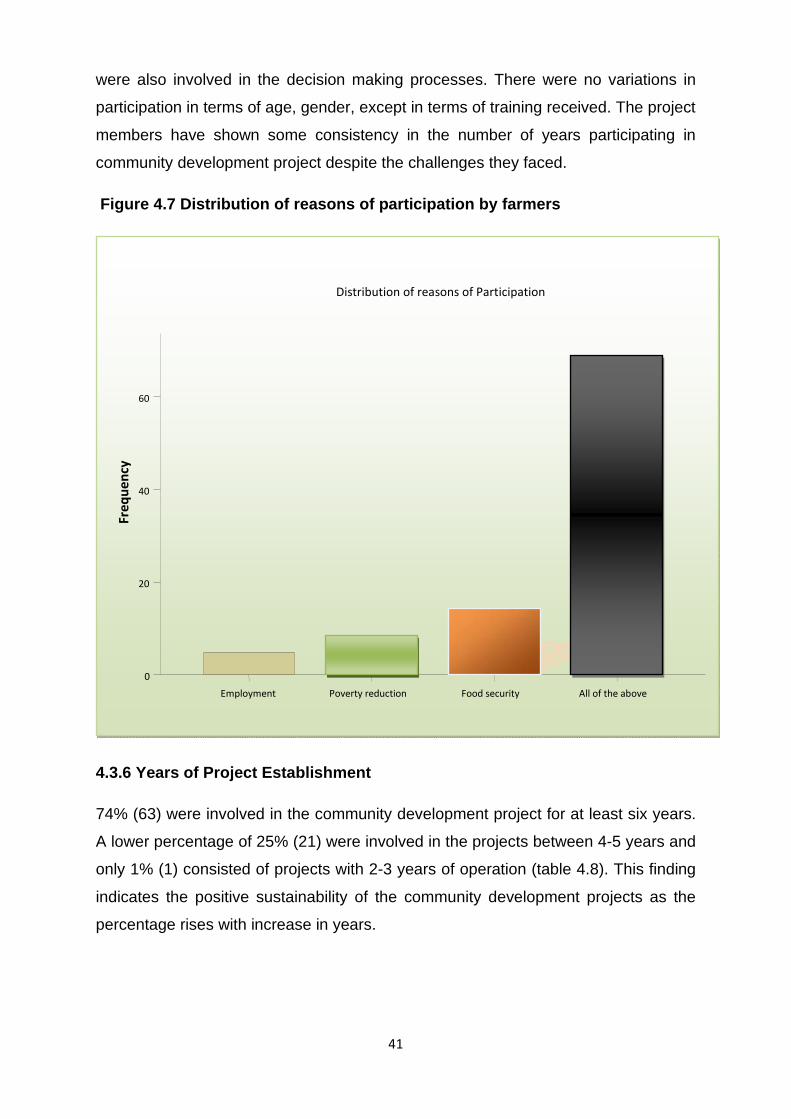
41
were also involved in the decision making processes. There were no variations in
participation in terms of age, gender, except in terms of training received. The project
members have shown some consistency in the number of years participating in
community development project despite the challenges they faced.
Figure 4.7 Distribution of reasons of participation by farmers
4.3.6 Years of Project Establishment
74% (63) were involved in the community development project for at least six years.
A lower percentage of 25% (21) were involved in the projects between 4-5 years and
only 1% (1) consisted of projects with 2-3 years of operation (table 4.8). This finding
indicates the positive sustainability of the community development projects as the
percentage rises with increase in years.
All of the above Food securityPoverty reductionEmployment
60
40
20
0
Freq
uency
Distribution of reasons of Participation

42
Table 4.8 Years of Project establishment
Frequency Percent
2-3 years 1 1.2
4-5 years 21 24.7
>6 years 63 74.1
Total 85 100.0
4.3.7 Registration
A proportion of 39% (39) of the community development projects was registered as
closed corporation and 54% (46) registered as co-operative (table 4.9). This finding
indicates that communities desire team work rather than sole operation. This is
supported by data on project membership where a majority of projects was
composed by more than five members. There is a positive relationship between
farmers’ membership of farmers associations and adoption that implies that the more
social organisations farmers belong to and participate in its activities, the more
likelihood there is of their predisposition to adopt new farm technologies. The table
below indicate levels of registration type (Cc or co-operative).
Table 4.9 Registration
Frequency Percent
Closed corporative
39 45.9
Co-operative 46 54.1
Total 85 100.0
4.3.8 Project activity
A proportion of 55% (47) was obtained from crop production (table 4.10) followed
19% (16) from other activities whereas 14% (12) and 12% (10) came from poultry
and dairy respectively. These findings indicate that a proportion of (81%) of the
community projects are agriculturally based. Agricultural sector plays a center role in
rural community development through providence of employment opportunities
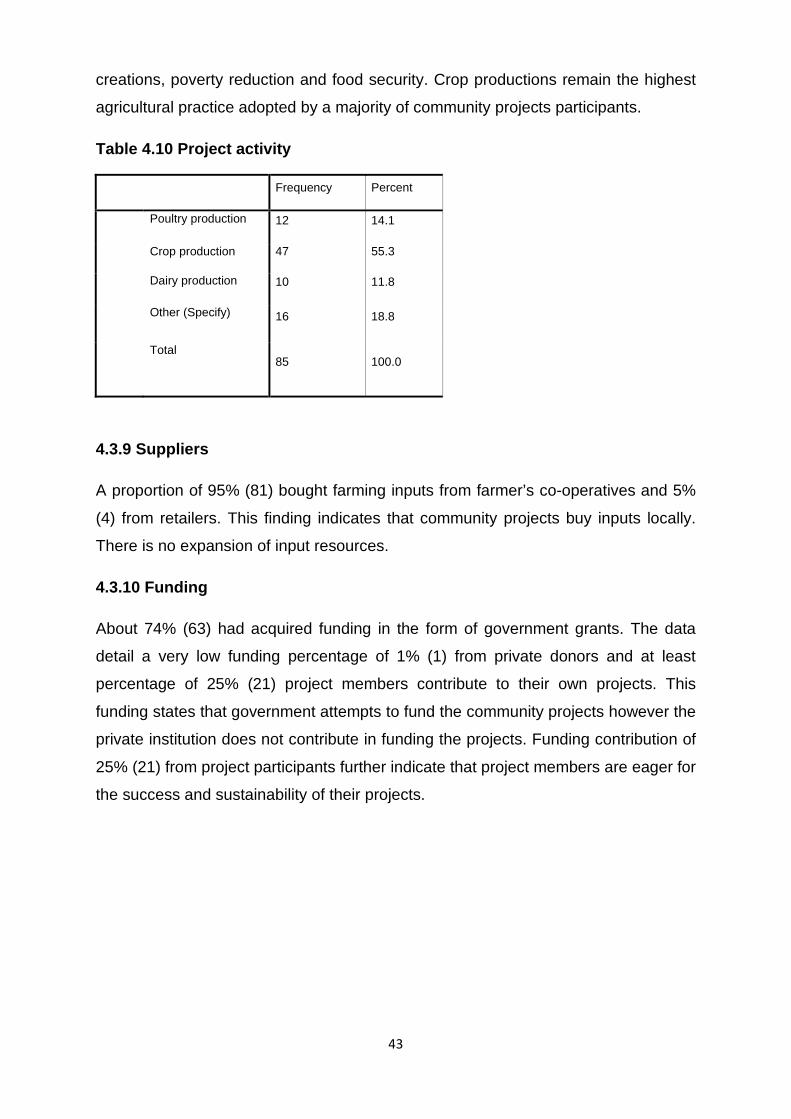
43
creations, poverty reduction and food security. Crop productions remain the highest
agricultural practice adopted by a majority of community projects participants.
Table 4.10 Project activity
Frequency Percent
Poultry production 12 14.1
Crop production 47 55.3
Dairy production 10 11.8
Other (Specify) 16 18.8
Total 85 100.0
4.3.9 Suppliers
A proportion of 95% (81) bought farming inputs from farmer’s co-operatives and 5%
(4) from retailers. This finding indicates that community projects buy inputs locally.
There is no expansion of input resources.
4.3.10 Funding
About 74% (63) had acquired funding in the form of government grants. The data
detail a very low funding percentage of 1% (1) from private donors and at least
percentage of 25% (21) project members contribute to their own projects. This
funding states that government attempts to fund the community projects however the
private institution does not contribute in funding the projects. Funding contribution of
25% (21) from project participants further indicate that project members are eager for
the success and sustainability of their projects.

44
Table 4.11 Distribution on Funding
Frequency Percent
Contributions From project members
21 24.7
Government grants 63 74.1
Private donors 1 1.2
Total 85 100.0
4.3.11 Projects growth constraints
A lack of irrigation equipments is the major project growth obstacle with a
contribution of 53% (45). This finding indicates that irrigation in rural farming projects
is the serious limiting factor as a majority of projects engage in crop production and
therefore water access is the most vital factor of plants growth. This is followed by a
lack of funds: 33% (28). Lack of funding was the detrimental cause of all limiting
factors labeled. High costs of inputs supplies and others did not portray a major
effect with a contribution of 2% (2) and 11% (9) respectively.

45
Figure 4.8 Growth Constraints
4.3.12 Income
A proportion of 95% (81) received income from the community development projects.
Only a 5% (4) did not receive income from participation in the community
development projects. These findings indicate that there are definite benefits for
members from participation in the projects and that these are playing a role in
addressing the socio-economic aspects of the community.
4.3.13 Amount in rand
The highest proportion of 32% (27) received an income of above R750 per month.
The second highest proportion is R550 and R649 with the percentage value of 25%
(21). A proportion of 12% (10) received between R650 and R729. This finding
indicates the projects are not providing sufficiently and are therefore not reliable as
None Lack of fundsHigh cost of inputSupplies
Lack of
Irrigation equipments
50
40
30
20
10
0
Freq
uency
.

46
the data indicate that still about 68% (39) of the respondents receive less than R750
per month. The graph below indicates the income frequency level received from
community development projects.
Figure 4.9 Amounts in Rand
4.3.14 Satisfaction with the income
In terms of income satisfaction, an overwhelming majority of 100% (85) of the
respondents were not satisfied with the amount of income accrued from the
community development projects. These findings reflect maximum dissatisfaction the
result of which contradicts the aspect of sustainability.
>R750R650R550R450< R350
30
25
20
15
10
5
0
Freq
uency
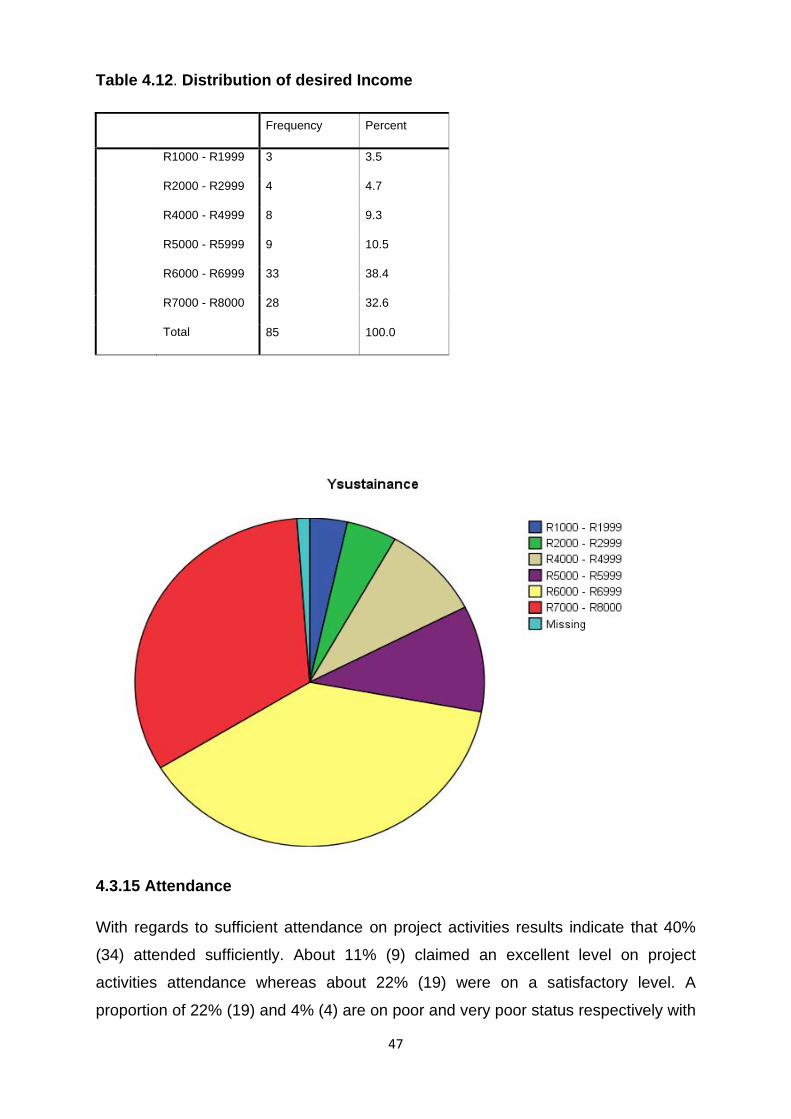
47
Table 4.12. Distribution of desired Income
Frequency Percent
R1000 - R1999 3 3.5
R2000 - R2999 4 4.7
R4000 - R4999 8 9.3
R5000 - R5999 9 10.5
R6000 - R6999 33 38.4
R7000 - R8000 28 32.6
Total 85 100.0
4.3.15 Attendance
With regards to sufficient attendance on project activities results indicate that 40%
(34) attended sufficiently. About 11% (9) claimed an excellent level on project
activities attendance whereas about 22% (19) were on a satisfactory level. A
proportion of 22% (19) and 4% (4) are on poor and very poor status respectively with

48
regard to project activities attendance level. This findings indicate that projects
participants are determined and dedicated to their projects as shown by the data
roughly around 73% of project participants actively involved in the activism
undertook and only a small fraction of about 27% (23) do not devote much of their
time on project activities execution. The graph below indicates frequency levels of
project member’s attendance on project activities ranging from very poor up to
excellent.
Figure 4.10 Attendance on Project Activities
ExcellentGoodSatisfactoryPoorVery poor
40
30
20
10
0
Freq
uency
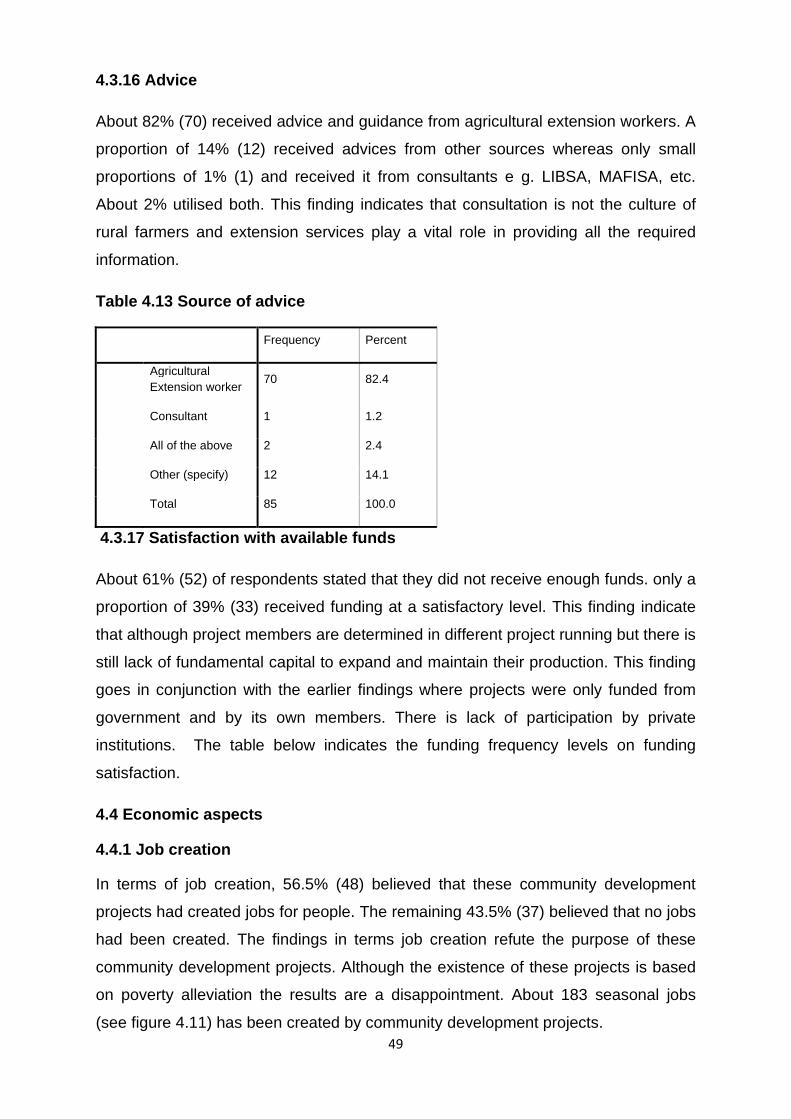
49
4.3.16 Advice
About 82% (70) received advice and guidance from agricultural extension workers. A
proportion of 14% (12) received advices from other sources whereas only small
proportions of 1% (1) and received it from consultants e g. LIBSA, MAFISA, etc.
About 2% utilised both. This finding indicates that consultation is not the culture of
rural farmers and extension services play a vital role in providing all the required
information.
Table 4.13 Source of advice
Frequency Percent
Agricultural Extension worker
70 82.4
Consultant 1 1.2
All of the above 2 2.4
Other (specify) 12 14.1
Total 85 100.0
4.3.17 Satisfaction with available funds
About 61% (52) of respondents stated that they did not receive enough funds. only a
proportion of 39% (33) received funding at a satisfactory level. This finding indicate
that although project members are determined in different project running but there is
still lack of fundamental capital to expand and maintain their production. This finding
goes in conjunction with the earlier findings where projects were only funded from
government and by its own members. There is lack of participation by private
institutions. The table below indicates the funding frequency levels on funding
satisfaction.
4.4 Economic aspects
4.4.1 Job creation
In terms of job creation, 56.5% (48) believed that these community development
projects had created jobs for people. The remaining 43.5% (37) believed that no jobs
had been created. The findings in terms job creation refute the purpose of these
community development projects. Although the existence of these projects is based
on poverty alleviation the results are a disappointment. About 183 seasonal jobs
(see figure 4.11) has been created by community development projects.
50
4.4.2 Transport
A proportion of 86% (73) did not have transportation for their products. Only a small
proportion of 34% (12) had access to transportation of projects products. This finding
indicates that lack of transportation is also a factor limiting income maximisation.
4.5 Social aspects
4.5.1 Theft
A proportion 98% (83) of the respondents was affected by the theft of their products.
Only a small fraction of 2% (2) was immune from these detrimental scenarios. This
finding provides a clear picture of insecurity of products from the community projects.
This is one of the factors that limit income generated from community projects.
4.5.2 Project members not withstanding the theft
About 80% (68) of the respondents did not get discouraged. At least 20% (17)
though were discouraged from participation in community projects. This finding
indicates that despite the highest level of theft project members are still determined
to continue participating.
4.5.3 Attitude of respondent’s children towards agriculture
With regard to respondents’ children attitude on taking agriculture as a career a
proportion of 12% (10) rated it as excellent, 40% (34) were positive,. 21% (18) as at
satisfactory. A proportion of 22% (19) and 5% (4) was poor and very poor
respectively (figure 4.11). These findings indicate that farmers’ children generally
develop interests in the farming sector which signifies the future inheritance of
projects to next of kin. This has the possibility of improved operation by the second
generations.

51
Figure 4. 11 Attitude of the participants Children
4.5.4 Perception of community towards community development projects
Generally communities share fair perception on the community projects. Above 90%
(77) of the respondents experienced perception beyond satisfactory level and only a
small proportion of 3% (3) satisfactory level. The table below indicates the frequency
levels of perception on community projects perceived by respondents from
community.
ExcellentGoodSatisfactoryPoorVery poor
40
30
20
10
0
Freq
uency
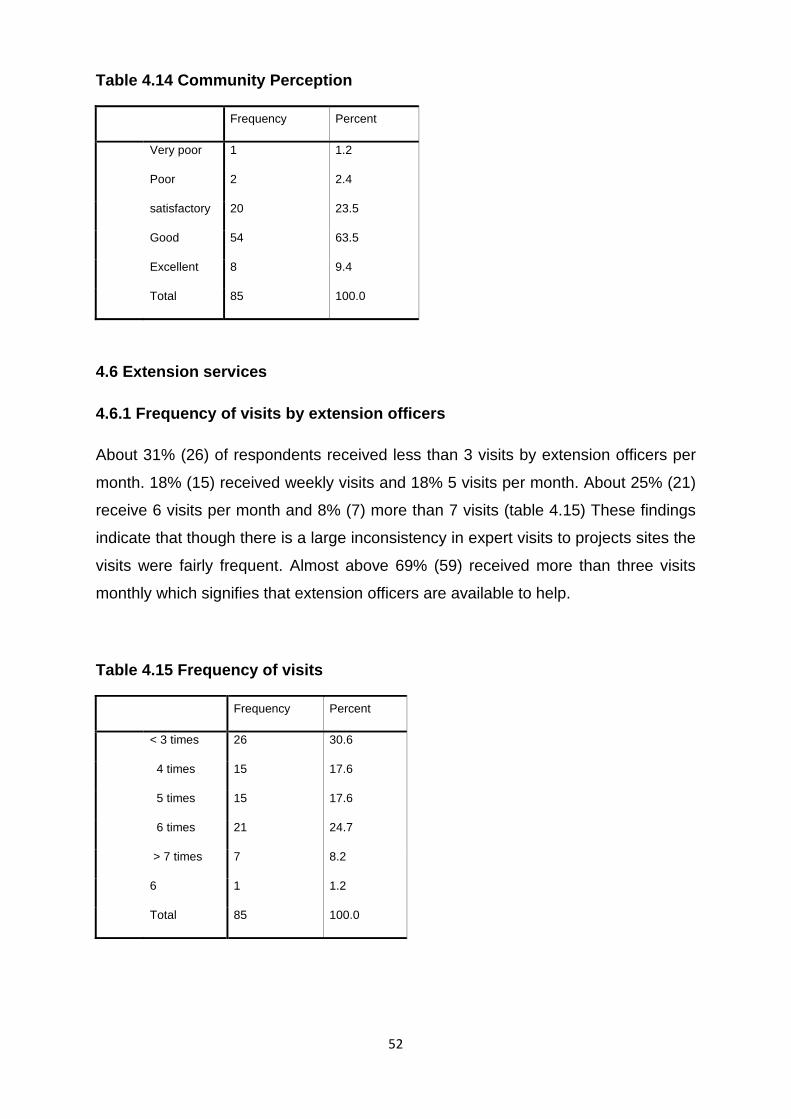
52
Table 4.14 Community Perception
Frequency Percent
Very poor 1 1.2
Poor 2 2.4
satisfactory 20 23.5
Good 54 63.5
Excellent 8 9.4
Total 85 100.0
4.6 Extension services
4.6.1 Frequency of visits by extension officers
About 31% (26) of respondents received less than 3 visits by extension officers per
month. 18% (15) received weekly visits and 18% 5 visits per month. About 25% (21)
receive 6 visits per month and 8% (7) more than 7 visits (table 4.15) These findings
indicate that though there is a large inconsistency in expert visits to projects sites the
visits were fairly frequent. Almost above 69% (59) received more than three visits
monthly which signifies that extension officers are available to help.
Table 4.15 Frequency of visits
Frequency Percent
< 3 times 26 30.6
4 times 15 17.6
5 times 15 17.6
6 times 21 24.7
> 7 times 7 8.2
6 1 1.2
Total 85 100.0

53
4.6.2 Opinion on the advice of extension officers
About of 52% (44) rated as good advice, and 34% (29) of respondents who rate it
satisfactory (figure 4.12). About 4% (3) believed it was excellent while only small
proportion of 7% (6) and 1% (1) believed it was poor, and very poor respectively.
This finding indicates that respondents generally appreciated the information and
advices they received from extension workers.
Figure 4.12 Opinion on the advice of the extension officer
4.6.3 Opinion about farming in Limpopo
About 30.2% (26) of respondents rated farming in Limpopo as being in a good state
(table 4.16). Approximately 13% (11) believed it was excellent, while 45.3% (38)
rated it as satisfactory. About 7% (6) and approximately 4% (3) rated it poor and very
poor respectively. This finding indicates that rural farmers are satisfied with the
farming conditions in Limpopo. Only 10% (9) rated it below satisfactory level.
ExcellentGoodSatisfactoryPoorVery poor
50
40
30
20
10
0
Freq
uency

54
Table 4.16 Distribution of Opinion on Farming in Limpopo
Frequency Percent
Very poor 3 3.5
Poor 6 7.0
Satisfactory 39 45.3
Good 26 30.2
Excellent 11 12.8
Total 85 100.0
4.6.4 Records
A proportion of 100% (85) kept records of project activities, times applied and
methodology. This finding indicates that all of the running projects have all the
relevant data on historical practice which pave the way for proper implementation of
improvement techniques.
4.7 Human resource development
4.7.1 Committee
All of the respondents had appointed committees to oversee and administer the
running of the projects. Only the project members were allowed to take part in the
election and appointment of the projects members. This finding provides the picture
that there is a professional running of the projects in which committees are elected
and vested with power to represent, decide, and amend internal control and broader
administration for the smooth running of the projects.
4.7.2 Previous occupation
About of 61% (52) had previously been unemployed, the second largest proportions
of 35% (30) were self-employed and a small proportion of 1% (1) was always
employed. These findings indicate that community development projects have
played a vital role in creation of employment opportunities. This shows that a
reasonable percentage of self-employed (35%) also extended business through
incorporation of community development projects participation. The table below
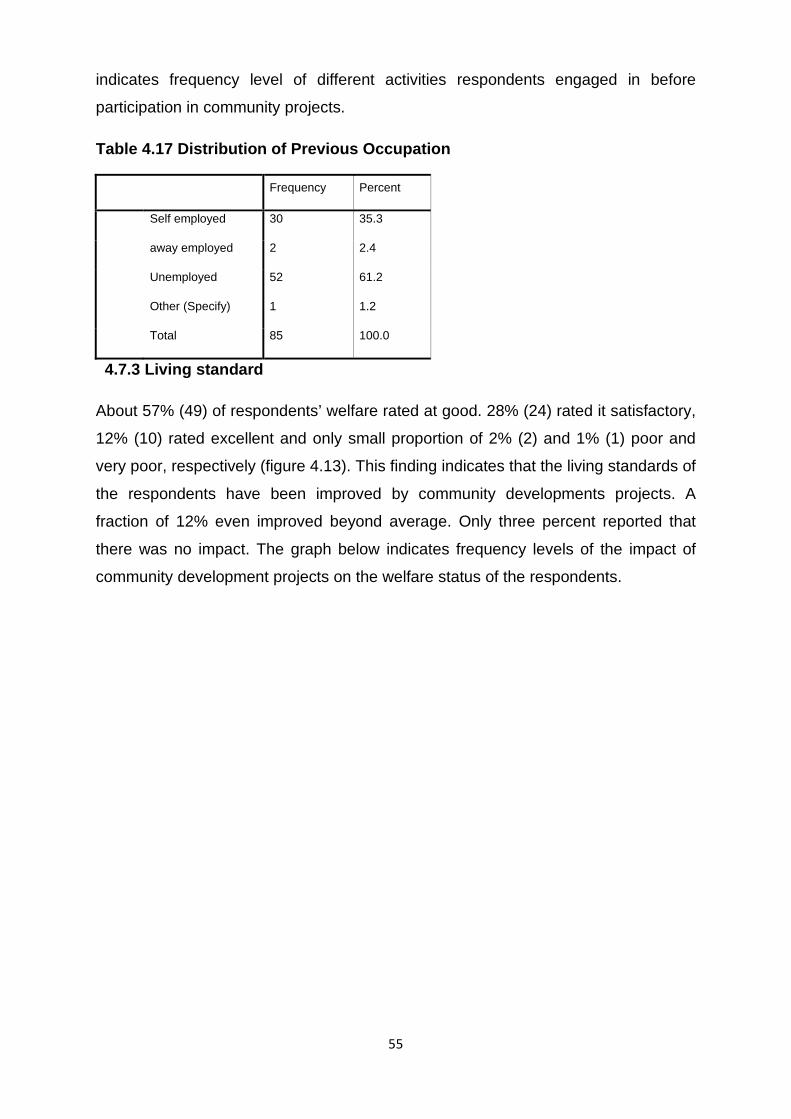
55
indicates frequency level of different activities respondents engaged in before
participation in community projects.
Table 4.17 Distribution of Previous Occupation
Frequency Percent
Self employed 30 35.3
away employed 2 2.4
Unemployed 52 61.2
Other (Specify) 1 1.2
Total 85 100.0
4.7.3 Living standard
About 57% (49) of respondents’ welfare rated at good. 28% (24) rated it satisfactory,
12% (10) rated excellent and only small proportion of 2% (2) and 1% (1) poor and
very poor, respectively (figure 4.13). This finding indicates that the living standards of
the respondents have been improved by community developments projects. A
fraction of 12% even improved beyond average. Only three percent reported that
there was no impact. The graph below indicates frequency levels of the impact of
community development projects on the welfare status of the respondents.

56
Figure 4.13 Distributions of Living Standards
4.7.4 Major Challenges
About 39% (33) had limited access to markets. A further 26% (22) were challenged
by high instances of theft and only a small proportion of 3% (3) was affected by lack
of project members’ participation (table 4.18). About 19% (16) was challenged by
high costs of input. These finding reveal that the major production challenges are
lack of measures in place to be exploited to connect community projects with the
wider market. However commitment by members remains relatively high. The
challenges were not the same across the projects. They differed according to the
training and the literacy levels of the respondents. Also, bigger groups seemed to
have more problems with regard to participation than smaller groups.
excellentgoodsatisfactorypoorVery poor
50
40
Freq
uenc
y
30
20
10
0
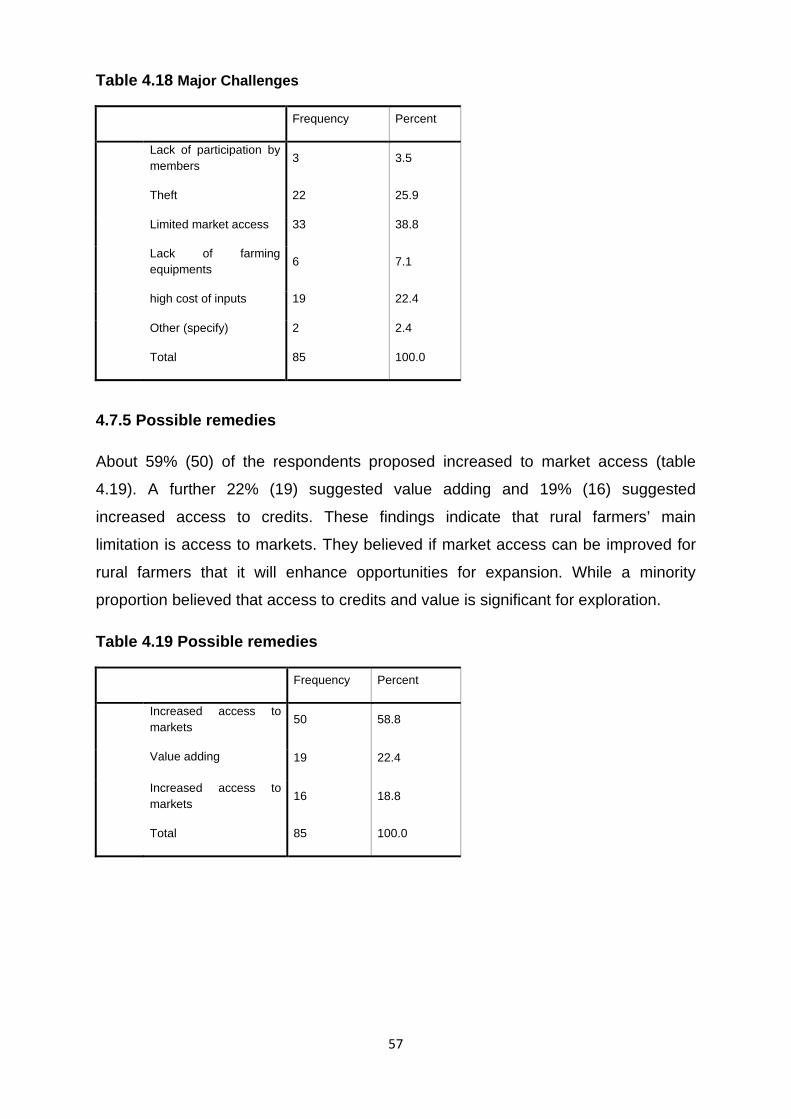
57
Table 4.18 Major Challenges
Frequency Percent
Lack of participation by members
3 3.5
Theft 22 25.9
Limited market access 33 38.8
Lack of farming equipments
6 7.1
high cost of inputs 19 22.4
Other (specify) 2 2.4
Total 85 100.0
4.7.5 Possible remedies
About 59% (50) of the respondents proposed increased to market access (table
4.19). A further 22% (19) suggested value adding and 19% (16) suggested
increased access to credits. These findings indicate that rural farmers’ main
limitation is access to markets. They believed if market access can be improved for
rural farmers that it will enhance opportunities for expansion. While a minority
proportion believed that access to credits and value is significant for exploration.
Table 4.19 Possible remedies
Frequency Percent
Increased access to markets
50 58.8
Value adding 19 22.4
Increased access to markets
16 18.8
Total 85 100.0
58
4.7.6 Community benefits
A proportion of 94% (80) of respondents believed that community development
projects benefited the community economically through provision of employment,
food security, poverty reduction, and income. Only a small proportion of 5% (4)
shared a contrary view. A proportion of 1% (1) was not sure of either of the above.
This finding indicates that the communities’ projects play a vital role in the economic
development of rural communities.
4.7.7 Conclusion
In conclusion, chapter four was about the results, interpretation and finally the
discussion of the results. While positive aspects from the community development
projects were acknowledged, based on the various variables, there were more
challenges, key points like the sustainability of these projects that prompted a few
critical reflections of the very essence of this study. Some of the points discussed
were in line with issues of market access, networks, the future of agriculture without
youth participation, issues of attitude, and the dependency syndrome to mention but
a few. Although such studies cannot act conclusively they stimulate debate as to
whether indeed the existence of these community development projects are the
solution for the plight of the poor, especially in rural areas.
4.8 Emerging issues
A number of important issues emerged from the study.
4.8.1 Constraints dimensions of the projects
The study was in agreement with government aims and especially the commitment
to various programmes like RDP, GEAR and now ASGISA to eradicate poverty. The
mere existence of these community farms was indicative of government
commitment. According to May (1987:7) sustained reduction with regard to
inequalities requires accelerated job creation which in turn requires structural
transformation in order to achieve higher and more labor-absorbing growth within the
economy. From the observations, the issue of “more labor-absorbing growth” was
indeed a reality.
The study also identified government as the highest funder for these community
development projects. According the findings, about 74% were government grants

59
that were availed to these community projects. This is a positive sign of commitment
to support its own people in eradicating poverty. It is interesting to note that 25% of
the funding came from the committee members on the farms.
The deployment of agricultural extension officers from the Department of Agriculture
to the various farms to offer all kinds of support is remarkable of government. The
findings revealed that a satisfaction level of 92%, in recognition of the support
offered by the extension officers existed. The need for agricultural extension officers
is very vital as they are trained officers who constantly advices as well as extend
their technical skills, and new technologies in the projects.
The study also registered a proportion of over 90% of the participants on the farms
who has either received training in project management, financial management or
record keeping. The imparting of such skills would go a long way into ensuring the
sustainability of these farms. The members on these community development
projects would know how to manage the project, its finances, have accountability to
sum it up effectively. The efficient management of the whole project is emphasised.
4.8.2 Economic dimensions
The respondents indicated dissatisfaction with regard to the income they received
from the projects. This need a strong motivation from the government side and other
sectors like the private to encourage them to use other technologies which can allow
them to have mass production on a small area of land, because the local Chiefs and
Indunas are reluctant to give more land to project members.
Bearing in mind that poverty and unemployment are a nightmare in rural areas, the
perception as well as involvement of the members in the community development
projects was very positive. Many of the members admitted that the farms had
created employment (183 jobs created) for them and that they were able to get some
form of income from selling farm produce.
The studies were in agreement with Machete (2004: 4) who indicates that farming is
the greatest contributors to household income – more than 40% of the total
household income is generated from farming. There is a correlation between the size
of land and the production capacity. Obviously large proportions of land allow huge
amounts of production and in return more revenue. if well utilised. However, recent
technological hydroponics and intensive farming have developed ways of achieving

60
mass production with moderate land. For instance, hydroponics technology suggests
a ratio of a quarter hectare to 6ha if the conventional method is utilised. The majority
of respondents had between 2 to 6ha of land. Many of the respondents were not
satisfied with this size of land and wanted to acquire more. About 39% of the
respondents had experience of over 6 years in farming which was a sign that of
consistency as well as good exposure and experience in this sector.
In as much as the projects seemed to be successful, there are many challenges that
need to be addressed to ensure that the essence of these community development
projects is realised. To begin with, the findings in the study showed that 39% of the
projects were suffering from access to markets. Lack of market access is an
impediment to not only to the growth, but also to have sustainability of such projects.
Produce needs to be sold otherwise it goes to waste which will result in negative
morale among members involved in community development projects.
In addition, the respondents complained about the lack of farming equipment like
machinery, tractors, and irrigation schemes. Lack of such equipment does impact on
the production. Technology reduces labor strain and high productivity occurs. The
other challenge was the high cost of resources namely fertilizers and seedlings
which are very expensive. Finally the issue of theft was reported to be a serious
challenge affecting community development projects.
4.8.3 Social dimensions
The social aspect in this study was informed by the overall community support
towards individuals involved in the development projects especially the households,
the local chiefs, private organizations, and other well wishers. It is not only known
that the highest percentage of poverty rests in rural areas but the people in their
communities acknowledge this unfortunate calamity and are determined to work
ways to overcome this problem. It is important to note that in terms of gender
composition, this study registered 81% females in the community development
projects. This was in agreement with studies done by FAO (1985:241) that women
play a significant role in agriculture, the world over. Of the 70% of the agricultural
workers, 80% were food producers, 10% of those who process basic foodstuffs are
women. They also undertake 60 to 90% of the rural marketing; thus making up more
than two thirds of the workforce in agricultural production.
61
All the community development projects had appointed committee members to offer
guidance and leadership in these projects. Many projects in the past had collapsed
due to the absence of steering committee at the projects which meant that initially
the project suffered from low momentum as it did not have a cohesive group of
stakeholders to drive the activities. Leadership is an important aspect of community
building. Its presence manifests a sense of direction. For the community
development projects to be a success, good leadership is required as well as good
followership.
The presence of local leaders in development is a sign of positive transformation.
Local leaders have an important role to ensure that there subordinates are living
healthy, empowered, in harmony with each other and committed to work. Local
leaders can be stumbling blocks in the process of development. The findings in the
study indicated 100% support from local leaders.
4.8.4 Critical reflections
The purpose of this paper was to investigate the impact of community development
projects on livelihoods, the nature, operations, performance, and level of
sustainability and the extent to what the communities beneficiaries. Critical
reflections follow.
4.8.4.1 Funding for growth of business
The study acknowledged government as the main funder of the community
development projects as part of its commitment to address past inequalities facing
black rural households who are the majority in this category. The spirit of self
reliance should be encouraged. In terms of sustainability, it is questionable whether
these community development projects are viable for generations to come. The
findings showed a lifespan of over 6 years in farming and yet the income was less
than R1000 per month. From observation in the study, a dependency syndrome was
detected especially in terms of the maintenance of equipment, buying of input
supplies, transport, and over reliance on government support for minor support is
also a factor.
Provision of credit from private institutions would not be a solution if not well
managed. Agricultural activities are long term based and yet involve a lot of high risk.
Mwangwela and Duvel (2006:108) pointed out that the principle of maximum
62
community participation is based on the notion of self-determination, self-reliance,
self-responsibility and self-help as a normative goal. This ought to be done
practically. During the inception of the community development projects a lot of
funding was injected into the business and yet to date some of these projects still
wait on government for financial support.
4.8.4.2 Project size
The size of the project only determines the total production of goods, but also the
revenue as well as the salaries or wages to participants involved on those farms.
Although advanced technology in agriculture may refute this (as was mentioned
earlier), it is still important to have enough land in direct equation with the
participants. For a project to be sustainable, size is important because then enough
revenue can be generated out of produce to even allow saving of the profits.
4.8.4.3 Income verses job creation
The amount of revenue generated from a project should complement the amount of
labor put into the project thus also creating jobs. The results in the studies showed a
life-span of over 6 years of farming and intensive hard work and yet the rewards in
terms of the salary were not satisfying. The recurrence of such inadequacies could
de motivate prospective farmers and as a result discourage seeking employment in
this area.
4.8.4.4 Age, education and skills
From the study, in terms of age the biggest participants in community development
projects were in the age category of 40 to 60 years and these constituted only 56%
of the total respondents, with the youth were 18%. Such results that question the
issue of sustainability of these community development projects. What is the future
of agriculture without the youth being involved. We also note with interest from the
variable on education, that 38% of those involved in the projects had only gone as
far as primary and secondary level. Furthermore, 20% of the participants had not
attended any formal education, lastly only 2% were bachelor degree holders as well
as post graduates. With reference to the above one would conclude that agriculture
is not for the educated. Or that those educated are not prone to poverty and as a
result do not engage in these community projects.
63
In addition, the sustainability of community development projects needs skills
transfer to young generations. Obviously the youth from these participating
households are not interested in agriculture, have better options, or possibly the
participants themselves do not see it necessary to transfer such skills to their
children.
4.8.4.5 Marketing networks
Successful farming projects are those that enjoy market supremacy. Ideal projects
should have marketing networks laid down and even contacted long before the
beginning of the projects. The experiences in many African settings in regard to
farming are that quite a number of farmers only market their produce after
harvesting. For sustainability to be achieved marketing networks have to be well
streamlined and strategies put in place to effect that.
4.8.4.6 Attitudes of project members
Negative tendencies and selfishness are an impediment to the sustainability of these
community development projects. In an interview one of the project members said “I
cannot teach my children they should struggle on their own for fear for expansion
due to high rates of theft in the area”. These and others destroy government efforts
in its commitment to alleviate poverty in rural communities.
64
CHAPTER 5
CONCLUSION AND RECOMMENDATIONS
5.1 Introduction.
A dissertation of limited scope such as this one cannot solve the problem of what
can be done to improve or change on the impact of community development projects
in the municipal area. There are also limitations to achieve the primary aim namely to
establish the guidelines on how to improve the effectiveness of the community
development projects, increase in job creation, improve the income of the project
members, and improved standards of living because of its limited scope.
If one examines the first 15 years of democracy, progressive policy frameworks have
been developed with the enabling legislation. Human and legal rights are being
entrenched, but the acid test will be the ability of policymakers and development
practitioners to make a difference in the lives of the large number of poor people.
The research is recommended to establish, for an example, the guidelines for
involving other civil servants together with the private sector in using participatory
approaches in all development efforts in the rural community. Furthermore, the
research is recommended on political factors, so that they clearly understand the
negative impact of a top-down approach on community development. A bottom-up
approach to community development has its benefits to promote self reliance and
ownership of the development projects. Comparative studies or research on the
theme of community development participation in community development projects
is recommended, so as to enrich the discipline of development studies in general
and the community development field in particular, and to gain a more
comprehensive understanding of community development as a practice.
5.2 Conclusion
A number of community development projects have been introduced, although it is
not clear on the impact these projects have made on the livelihoods and the
beneficiaries of Lepelle-Nkumpi Municipality. Their sustainability is also questioned.
The major weakness is the inability of the current status of income –generating
projects which allows for sustainable funding of unsustainable projects, some of
which are on the verge of collapse (Kwaw, 2006:2).

65
There is a great deal of unpublished research concerning community development
projects and its impact on the beneficiaries in terms of job-creation and income
generation.
In the context of the current status of poverty in the Limpopo Province, the available
literature on the government income generation project approach to income poverty
alleviation in scanty, with a great deal of unpublished research (Aliber, 2005 as cited
by Kwaw, 2006: 5)
Therefore, little is known about the programmes, project design, and their possible
impact on beneficiaries (Kwaw, 2006: 5). The findings revealed that there is a
positive the impact these projects have made in terms of income generation, job
creation and food security, eventhough the incomes received is still very low.
The aim of the envisaged study was to assess the impact of the community
development projects on the livelihoods of the community of Lepelle-Nkumpi
Municipality. The objectives of the study was to assess the impact of the community
development projects on livelihoods of the beneficiaries and the community in terms
of incomes, jobs and living standards and to identify and recommend appropriate
intervention strategies where necessary.
The research questions were to look at the nature of the CDP’s, their sustainability,
how they have impacted on the lives of the beneficiaries, jobs that have been
created by the CDP’s, the incomes generated for members and also the way in
which the wider community has benefited.
From the study the researcher captured poor participation by the youth in the
community development project which questions the sustainability of those projects
where the percentages decreases with increases in years. Other researchers also
concurred with the researcher’s findings.
On educational level, the researcher captured the biggest margins of the participants
in the community development projects who attended school up to both primary and
secondary levels. The findings indicated the lack of participation of the learned
fraction within the communities. The research also revealed that a larger proportion
of the respondents derive the basic income from farming, which is a positive sign.
66
The majority of the respondents have spent more than 6 years on the projects. There
are factors which motivated them, including the technical support from the
Departments of agriculture, health and welfare, local municipality and other private
organisations. The Department of Agriculture together with the two agricultural
colleges provided training to the members of the community development projects.
The majority of the respondents showed dissatisfaction with regard to project sizes
they were allocated. This is one of the reasons these projects are generating too little
income for the beneficiaries.
The number of the members is related to the success of the project, because from
one of the comparative studies captured earlier in the study, it was indicated that
some project members were unwilling to work and always absented themselves, but
demanded equal share of income at the end of the month. This de-motivated some
of the project members.
The research also showed poor funding arrangements from the private sector. The
majority of the projects were funded by the government and some members made
their own contributions.
The growth constraints found by the researcher were: - lack of irrigation equipments,
lack of funds, high cost of input supplies. Other constraints did not portray a major
effect.
The majority of the respondents indicated that they received income from community
development projects. This finding indicated that there is a broad benefit by
members from participating in the projects and the projects are playing a role in
addressing the socio-economic aspects.
The researcher highlighted that the highest paid member in the community
development projects received R750-00 per month. The majority of members
showed a skewed dissatisfaction with the income where they indicated that they
wouldl be satisfied if they could earn around R7000 to R8000 per month.
The research findings also captured the challenges faced by the community
development projects: lack of participation by members, theft, limited market access,
lack of farming equipments, and the high cost of input supplies.
5.3 Recommendations

67
Based on the literature and the research finding, the following recommendations are
made on community development projects and livelihoods in Lepelle-Nkumpi
municipality. The government should encourage the youth to actively participate in
all issues of community development by offering bursaries to further their studies in
the field of agriculture. The government, together with the private sector should
provide more training on community mobilisation, participatory approach to
community development, and project management.
The local chiefs, indunas and local municipalities should allocate enough land to the
projects because the study revealed dissatisfaction by project members with regard
to the size of land allocated. This has impacted directly on the income and
production.
The Department of Agriculture should assist in the training of beneficiaries on the
new technologies in agriculture e.g. hydroponics, environmental house (in case of
broiler production), value adding, organic farming as well as intensive farming
systems where beneficiaries can create tremendous income in a small-sized area.
In as much as the projects seemed to be successful, there are many challenges that
need to be addressed in order to ensure that the essence of these community
development projects is realized. To begin with, the findings of the study showed that
39% of the projects were suffering from access to markets. Lack of market access is
an impediment to not only the growth, but also the sustainability of such projects.
Produce needs to be sold otherwise it goes to waste creating a negative morale
among members involved in community development projects.
The government should create a conducive for the markets to operate effectively in
the rural communities e.g. facilitating the building/ establishment of a fresh produce
market in case of vegetables and contract growers.
Those people working in community development need to critically consider the
factors that deter community development and come up with effective strategies and
recommendations to ensure that everybody in the community participate in
community development activities.
68
APPENDIX A
RESEARCH QUESTIONAIRE
COMMUNITY DEVELOPMENT PROJECTS AND LIVELIHOODS IN LEPELLE-NKUMPI MUNICIPALITY OF LIMPOPO PROVINCE OF SOUTH AFRICA.
In response to the many development challenges facing the Lepelle-Nkumpi Municipality a number of community development projects have been initiated. However, it is not clear what impact these projects have made on the livelihoods of beneficiaries and how sustainable they are.
The aim of the envisaged study is to assess the impact of the community development projects on the community of Lepelle-Nkumpi Municipality.

69
You are hereby kindly requested to complete this questionnaire.
Enumerator: _____________________________
Respondent’s Name: ________________________
Project Name: _________________________
A. Personal Characteristics 1. Sex 1. Male 2. Female 2. Age 1. 16 – 20 Years 2. 21 – 30 Years 3. 31 – 40 Years 4. 41 – 50 years 5. 51 – 60 years 6. 61 – 70 years 7. > 71 years 3. Marital Status 1. Single 2. Married 3. Widow 4. Widower 5. Divorced 4. What is the highest standard you have passed at school? 1. Never attended school. 2. Primary 3. Secondary 4. Degree 5. Post graduate 5. How big is your family? 1. No dependents 2. 1-3 dependents 3. 4-6 dependents 4. >7 dependents 6. Where do you get finance for your basic requirements? 1. Employed. 2. Self employed 3. Pension.
70
4. Farming 5. None 6. Other (specify) ------------------------------------------------------------------------------ ------------------------------------------------------------------------------ 7. Are you the head of the household? 1. Yes 2. No 8. If no, what is your relationship with the head of the household?
1. Wife 2. Son 3. Daughter 4. Brother 5. Sister 6. None 7. Other (specify) ------------------------------------------------------------------------------- ------------------------------------------------------------------------------
9. Occupational status of the head of the household
1. Away employed 2. Commuter daily. 3. Unemployed 4. Self-employed. 5. Project member 6. None 7. Other (specify) -------------------------------------------------------------------------------
-------------------------------------------------------------------------------
10. How long have you been involved in agriculture?
1. < 2 years
2. 3 years
3. 4 years
4. 5 years
5. 6 years
6. 7 Years

71
7. 8 Years
8. 9 Years
9. 10 Years
10. >11 Years
11. How many people in the household are of school going age, but are not attending school? 1. None 2. 1 3. 2 4. 3 5. >4 12. What courses or training have you had in Agriculture? 1. Record keeping
2. Financial management
3. Project management
4. Participatory Extension Approach
5. Other (specify)
--------------------------------------------------------------------------------------------
--------------------------------------------------------------------------------------------
B. Establishment of the project. 13. Was the traditional authority involved in the establishment of the project? 1. Yes 2. No. 14. Was the whole community involved? 1. Yes. 2. No 15. How big is the project? 1. <2ha 2. 3ha 3. 4ha 4. 5ha 5. 6ha

72
6. Other (Specify) --------------------------------------------------------------------------------------------
-------------------------------------------------------------------------------------------- 16. Are you satisfied with the size of the project? 1. Yes 2. No. 17. If no, what size do you prefer? 1. 2ha 2. 3ha 3. 4ha 4. 5ha 5. 6ha 6. None 7. Other (Specify) ------------------------------------------------------------------------------------------- ------------------------------------------------------------------------------------------- 18. How many project members are participating in the project? 1. 1 2. 2 3. 3 4. 4 5. 5 6. 6 7. 7 8. >8
19. Why are you participating in the project?
1. Employment
2. Income
3. Poverty reduction
4. Food security
5. All of the above
20. Year of establishment of the project
1. 1 year
2. 2-3 years
3. 4-5 years

73
4. >6 years
21. Do you own a plot outside the project? 1. Yes 2. No
22. How big is the plot? 1. <2ha 2. 3ha 3. 4ha 4. 5ha 5. >6ha 6. None 23. Forms of legal entity 1. Closed corporation 2. Co-operative 3. Sole trader 4. Pty (ltd) 24. Type of project activity 1. Poultry Production 2. Crop Production 3. Dairy Production 4. Other (Specify) ----------------------------------------------------------------------------------------- ----------------------------------------------------------------------------------------- 25. What is the current status of the project? 1. Active 2. Not active 26. If not active, Why? 1. None 2. Members not participating inclusively 3. Financial challenges 4. Lack of equipment to operate 5. Other (specify) -------------------------------------------------------------------------------------- --------------------------------------------------------------------------------------
74
C. Financial aspects 27. Where do you get money to conduct your farming? 1. Contributions by project members. 2. Grants from government departments. 3. Donors 4. Loan from Banking Institutions. 5. Other (specify)
------------------------------------------------------------------------------------------ ---------------------------------------------------------------------------------------------------------------------------------------
28. Are you able to meet the financial requirement of your project?
1. Yes 2. No
29. If not, why? 1. Lack of irrigation systems 2. Cost of input supplies 3. None 4. Other (Specify) ------------------------------------------------------------------------------------------ ------------------------------------------------------------------------------------------ D. Economic aspects 30. Have you employed someone to help in your project?
1. Yes 2. No
31. If yes, how many? 1. 1 2. 2 3. 3 4. 4 5. 5 6. None 32. Have you employed relatives? 1. Yes 2. No
33. Do you benefit from the Project?
1. Yes 2. No

75
34. If yes, how do you benefit?
1. Employment
2. Income
3. Poverty reduction
4. Food security
5. All of the above
35. Do you earn income from the project?
1. Yes 2. No
36. If yes, in which way?
1. <R350
2. R450
3. R550
4. R650
5. >R750
37. Are you satisfied with the income you receive from the
project?
1. Yes
2. No
38. If no, how much do you need to sustain you lives?
1. R1000-R1999
2. R2000-R2999
3. R3000-R3999
4. R4000-R4999
5. R5000-R5999
6. R6000-R6999
7. R7000-R8000
39. In which way do you involve the head of the household?
(In case the respondent is not the head of the household).

76
1. Moral support
2. Project member
3. Financial support
4. Transport
5. Take part on project activities
6. None
7. Other (Specify)
------------------------------------------------------------------------------- -------------------------------------------------------------------------------
40. Where do you buy your farming inputs? 1. Farmers co-operative
2. Retailers
3. Hawkers
4. Super markets
5. Other (specify)
-------------------------------------------------------------------------------
-------------------------------------------------------------------------------
41. Are you a member of the farmers co-operative? 1. Yes 2. No 42. Do you have own transport?
1. Yes 2. No
43. What do you do with the income generated from the project?
1. Buy food for the family
2. Buy clothes for the family
3. Send children to school
4. Provide shelter for the family
5. All of the above
6. Other (specify)
--------------------------------------------------------------------------------------------
--------------------------------------------------------------------------------------------

77
44. What other sources of income do you have?
1. Self employed
2. Old age pension
3. Child grant
4. Disability grant
5. None
6. Other (Specify)
45. How much do you spend on food per month?
1. <R300
2. R400
3. R500
4. R600
5. >R700
46. Do you think the project has solved some of the problems in the community? 1. Yes 2. No
47. If yes, in which way?
1. Employment
2. Income
3. Food security
4. Poverty reduced
5. All of the above
6. Other (specify)
--------------------------------------------------------------------------------------
--------------------------------------------------------------------------------------

78
E. Social aspects 48. Is theft a problem in your area?
1. Yes 2. No
49. If yes, does it discourage you to conduct agriculture?
1. Yes 2. No
50. What is your children’s attitude towards farming as future career?
1. Very poor
2. Poor
3. Satisfactory
4. Good
5. Excellent
51. What is the perception of the community towards the project?
1. Very poor
2. Poor
3. Satisfactory
4. Good
5. Excellent
F. Extension services 52. Where do you get advice and guidance to conduct your farming? 1. Agricultural extension worker
2. Consultant
3. Farmer-to-farmer sharing
4. Farmers days
5. All of the above
6. Other (specify)
--------------------------------------------------------------------------------------------
--------------------------------------------------------------------------------------------

79
53. How many times does the extension worker visit you per
month?
1. <3 times
2. 4 times
3. 5 times
4. 6 times
5. >7 times
54. What is your opinion about the advice that he is giving you?
1. Very poor
2. Poor
3. Satisfactory
4. Good
5. Excellent
55. What have you got in your house in working order?
1. Radio 2. TV. 3. Home theatre 4. All of the above 5. None
56. What is your opinion about farming in Limpopo? 1. Very poor 2. Poor 3. Satisfactory 4. Good 5. Exellent 57. Do you listen to the agricultural radio programmes? 1. Yes 2. No
58. How often-times per month?
1. <3 times

80
2. 4 times
3. 5 times
4. 6 times
5. >7 times
6. None
59. Do you get useful information?
1. Yes
2. No
60. How do you rate the information?
1. Very poor
2. Poor
3. Satisfactory
4. Good
5. Excellent
61. Do you keep records of income and expenditure for your project?
1. Yes 2. No
62. Who trained you to keep records?
1. Extension worker
2. Consultant
3. Farmer-to-farmer
4. All of the above
81
5. Other (specify)
--------------------------------------------------------------------------------------------
--------------------------------------------------------------------------------------------
63. Do you measure you performance?
1. Yes 2. No
G. Human Resource Development 64. Is there any management Committee for the project? 1. Yes 2. No
65. If yes, how many members?
1. None
2. 3
3. 4
4. 5
5. 6
6. 7
7. 8
8. 9
9.10
10. >11
66. What is your function?
1. Chair person
2. Vice-chair Person
3. Secretary
4. Treasury
5. Manager
6. Other (Specify).

82
--------------------------------------------------------------------------------------------
--------------------------------------------------------------------------------------------
67. Is there a constitution for the project?
1. Yes 2. No 68. If the agricultural extension worker is absent for a long period will you manage all the agricultural activities?
1. Yes 2. No
H. Status of development
69. What were you doing before joining this project?
1. Self employed
2. Away employed
3. Unemployed
4. Other (specify)
70. How do you rate the living standard now than then?
1. Very poor
2. Poor
3. Satisfactory
4. Good
5. Exellent
71. What are the main constraints you have to cope with? 1. Financial constraints
2. Theft
3. Limited Market access
4. Lack of participation by members
5. High cost of input supplies
6. Other (Specify)
------------------------------------------------------------------------
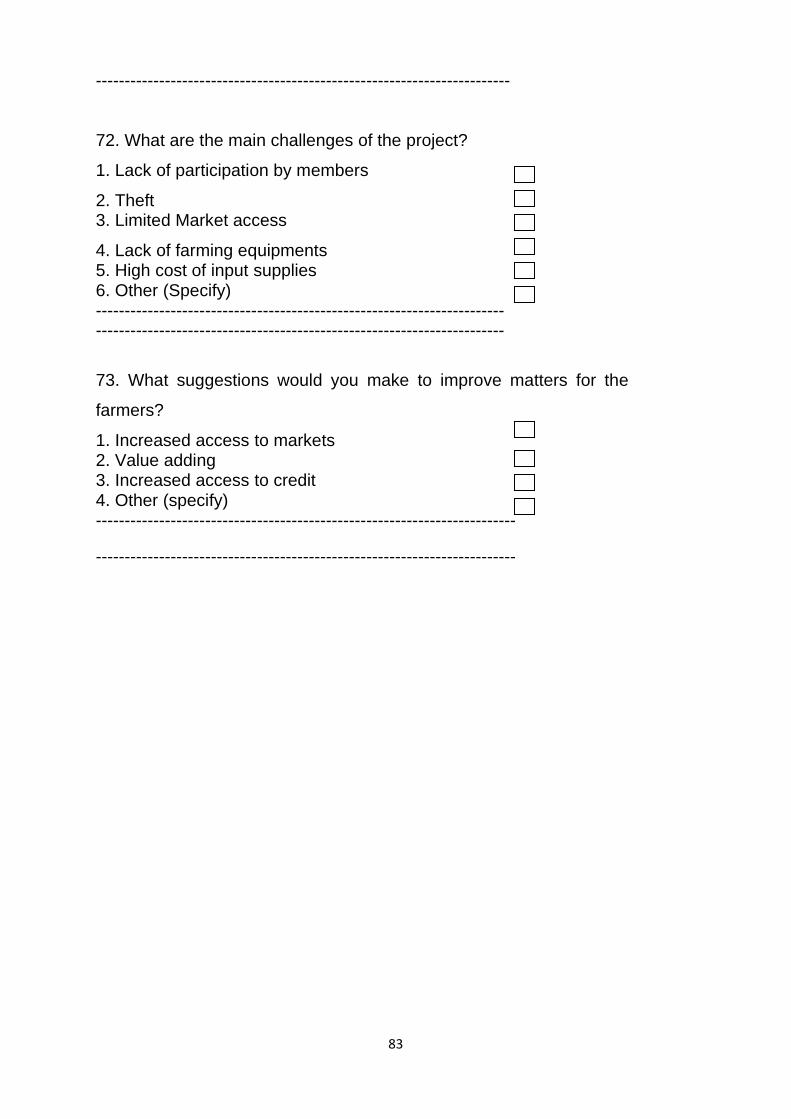
83
------------------------------------------------------------------------
72. What are the main challenges of the project?
1. Lack of participation by members
2. Theft 3. Limited Market access
4. Lack of farming equipments 5. High cost of input supplies 6. Other (Specify) ----------------------------------------------------------------------- -----------------------------------------------------------------------
73. What suggestions would you make to improve matters for the
farmers?
1. Increased access to markets 2. Value adding 3. Increased access to credit 4. Other (specify) -------------------------------------------------------------------------
-------------------------------------------------------------------------
84
References
Adams, W.M. (2001). Green Development: environment and sustainability in the
Third World. 2nd edition. United Kingdom. Biddles ltd. Guilford and King’s Lynn.
African National Congress. (1994). Reconstruction and development programme: a
policy framework. Cape Town. ABC Book printers.
AgriBEE. (2004). Broad-based black economic empowerment framework for
agriculture. Department of Agriculture. South Africa.
Aliber, M. (2003). Chronic poverty in South Africa: incidence causes and policies.
World Development. 31 (3). Pretoria. South Africa.
Ashley, C. and Maxwel, S. (2001). Re-thinking rural development. Development
policy review, 19 (4): 395-425. London. UK. Blackwell publishers.
Babbie, E. and Mouton, J. (2006). The practice of social research. Cape Town.
Oxford University press.
Bernart, W. (2001). Twentieth century South Africa. University of Cape Town. Oxford
University Press.
Bembridge, T.J. (2000). Guidelines for rehabilitation of small-scale farmer irrigation
schemes in South Africa. WRC report no. 891/1/00. Water research
commission. Pretoria. WTC Report.
Bembridge, T.J. (1991). Technology transfer in small-scale dry land crop production:
future challenges. Development Southern Africa. Volume 8. No. 4.
Blair, H. (2005). Working with elites to benefit poor people in Bangladesh. New
Haven. USA. File:\ID21-communictingdevelopment research.htm Accessed
on 16 May 2007.
Brooks, K. (ed.), (2002). From action to impact - the Africa region’s rural strategy.
Contribution from the Africa Region of the World Bank. Washington D.C.
Bryant, C. and White, L.G. (1980). Managing Rural Development with small farmer
participation. West Hartford: Kumarian.
85
Cleary, D. (2003). People centred approaches: a brief literature and comparison of
types. FAO.LSP WP 5. People-centred approaches in different
cultures.
DBSA. (2005a). Development report. Overcoming underdevelopment in South
Africa’s second economy. DBSA
Comprehensive African Agriculture Development programme. (2003). NEPAD.
Cock, J. (1980). Difference and dependence: a note on the self imagery of domestic
workers. South African labour bulletin 6(1). July 1980.
Coetzee, J.K. (1989). Development is for people. 1st edition. Johannesburg. Southern
Book.
Coetzee, J.K. and Graaff, J. (1996). Reconstruction, development and people. 1st ed.
South Africa: International Thompson Publishing.
Conwell,L. (1996). Environmental education and training at community level.
Africanus. 26 (1). Pretoria: UNISA.
Davids, I. (2005). Development theories: past and present, in participatory
development in South Africa. Pretoria. Van Schaik Publishers.
De Beer, F. (1997). Participation and capacity building, in participatory development
and management and the RDP. Kenwyn. Juta.
Delgado, C.L. (1998). Source of growth in smallholder agriculture in Sub-Saharan
Africa: the role of vertical integration of smallholders with processors
and Marketers of value-added items. Paper presented at the inter-conference
Symposium of the international association of agricultural economics.
Badplaas. South Africa. August 10-16.
Department of Agriculture. (2002). Integrated food security strategy for South Africa.
Pretoria. South Africa.
Department of Agriculture. (2001). Land redistribution for agricultural development.
South Africa.
86
Destremau, B. (2001). Poverty, Discourse and state power: A case study of
Morocco. Poverty Reduction: What role for the state in today’s globalised
economy? Zed Books Ltd. London.
DPLG. (2000). A policy paper on integrated development planning. DPLG. Pretoria.
DFID. (1999-2005). Livelihoods guidance sheets. Department of international
development (UK). Www.livelihoods.org/info/info-guidancesheets.html
FAO (2004). Socio-economic analysis and policy implications of the roles of
agriculture in developing countries. Summary report. Rome. Italy
FAO (2005). Socio-economic analysis and policy implications of the roles of
Agriculture in developing countries. Summary report. Rome.Italy
Integrated Development Plan. (2006). IDP (2006-2011). Limpopo
Province. South Africa.
Frank, A.G. 1995. The development of underdevelopment, in Development studies:
a reader, edited by S. Cormbridge. USA: Halstead.
Fraser, E.D.G., Dougill, A.J., Mabee, W.E., Reed, M., and McAlpine, P. (2004).
Bottom- up and top-down: Analysis of participatory process for sustainable
indicator identification as a pathway to community Empowerment and
sustainable environmental management. Leeds University. UK.
Freire, P. (1998). Teachers in cultural workers: letters to those who dare to teach.
Boulder Colo. USA. Westview Press.
Friedman, J. (1992). Empowerment: the politics of alternative development. 1st
edition. Cambridge MA: Blackwell.
Gtz. (2007). A people-centred development approach for small farmers in Limpopo:
The experience of the Limpopo department of agriculture. Janos Stekonic
publishers.
Groenewald, C.J. (1989). Community development, in development is for people.
Johannesburg. Southern Books Publishers.
Hart, T., Burgess, R., Beukes, O., and Hart, C. (2005). Reducing pitfalls in
agricultural development projects: a case for the participatory management cycle
87
(PPMC). South African journal of Agricultural Extension.
Volume. 34. No.1.
Hindson, D and Vicente-Hindson, V. (2005). Whither LED in South Africa: A
comprehensive report on the policy guidelines for implementation local
economic development in South Africa. March 2005.
Jeppe, W.J.O. (1980). Gemeentskapsontwikkeing. Stellenbosch: Stellenbosch
Universiteit.
Kwaw, I.W. (2006). Challenges facing organised community agricultural projects to
alleviate income poverty in South Africa: a case study of Limpopo Province.
In Africa insight. Volume.36. No.2.
Krebs, K. (2002). Local organizational development: A review of three BASED
learning cases at community Level after three years of implementation. BASED.
LPDA. South Africa. Janos Stekovic publishers.
Lategan, F.S. and Raats, J.G. (2005). Partnering, poverty reduction and rural
enterprise advancement. South African journal of agricultural extension. Vol.35
no.2.
Leys, C. (1996). The rise and fall of development theory. 1st ed. Britain. Villiers
Publishers.
Limpopo department of agriculture. (2002). Revitalization of small irrigation schemes:
A business plan for the revitalization of small holder irrigation schemes in
Limpopo. The department. Polokwane.
Machete, C.L., Mollel, N.M., Ayisi, K., Mashatola, M.B., Anim, F.D.K., and Vanasch,
F. (2004). Smallholder irrigation and agricultural development in
the Olifants River basin of Limpopo Province: Management transfer
productivity, profitability and food security issues. Report to the water
Research Commission on the project “Sustainable local management of
smallholder irrigation in the Olifants basin of Limpopo Province” water
research commission.
88
Malope, P. and Molapisane, K.R. (2006). Poverty reduction trough alternative
livelihoods in Botswana’s desert margins. South African journal of
agricultural extension. Volume 35. no.1. University of Pretoria. South Africa.
Martinussen, J. (1997). Society, states and market. A guide to competing theory
of Development. London. Zed Books Ltd.
Masiteng, T.J. and Van der Westhuisen, C. (2001). Extension needs of small-scale
dairy farmers in the North-Eastern Free State. South African journal of agricultural
extension. Volume 30. University of Pretoria. South Africa.
May, J. (2000). The structure and composition of rural poverty and livelihoods in
South Africa. In: cousins B (eds.). At crossroads: Land and agrarian reform in
South Africa in to the 21st century. PlAAs, University of the Western Cape.
Belville. 21- 34.
Mwengwela, D.L. and Duvel, G.H. (2006). Purpose, goals and the challenges
regarding farmers’ participation in agricultural extension services in Nkhotankota
district, Malawi. South African journal of agricultural extension. Volume
35. no.1. University of Pretoria. South Africa.
Nel, E. and Binns, T. (2002). Evaluating local economic development initiatives in
South Africa: Evidence from the cities.
Ngomane, T. (2006). South African journal of agricultural extension: Research
Extenuation processes and practices in relation to smallholder agriculture
In Africa: present, past to present. Volume 35 no. 2. University of Pretoria.
South Africa
Nkatini, N.L. (2005). Glimpses of research: guidelines on the writing of research
proposals, reports, essays, dissertations and thesis. 1st ed. Polokwane. South
Africa: Academic Bookshop.
Parker, A.N. (1995). Decentralization: The way forward for rural development
research working paper 1475. World Bank. Washington DC.
Redcliffe, M. and Sage, C. (1995). Introduction, in strategies for sustainable
development: local agendas for South Africa. USA. John Wiley.

89
Regan, C and Smith D. (2002). Development: describing and debating the idea, in
80:20 Development in an equal world. Ireland. Genprint.
Rist, G. (1999). The history of development from western origins to global faith. New
York. St Matin’s Press inc.
Roodt, M.J. (1996). Participatory development. A jargon concept, in reconstraction,
development and people. South Africa. International Thompson
Publishing.
Rostow, W.W. (1990). The stages of economic growth. A non-communistic
manifesto. 3rd edition. USA. Cambridge University Press.
Swanepoel, H. 1997. Community development. Putting plans in to action. 3rd edition.
Kenwyn. Juta.
The commission for socio-economic development of the Bantu areas within the
union of South Africa. (1955). Summary of the report. Report U.G. 61/1955.
Pretoria. Government printers.
The Department of Agriculture. (2006). Strategic plan for the department of
agriculture. The department. Pretoria. Government printers.
Thirwal, A.P. (2003). Growth and Development. 7th ed. Palgrave. Macmillan.
Terreblanche, S.E. (2002). A history in inequality in South Africa. Pietermaritzburg.
University of Natal press & Kmm Publishing.
Terreblanche, S.E. (2006). The need for a new generation of farmers and
agriculturalists in South Africa and the role of agricultural extension. South
African journal of agricultural extension. Volume 35.no. 2. University of
Pretoria. South Africa.
Todaro, M.P. (1989). Economic Development in the Third World. 4thed. New York:
Longman, inc.
Todaro, M.P. and Smith, S.C. (2006). Economic development. 9th ed. London.
Tottenham Court Road.
Treunicht, S.P. (1997). Sustainable development, in development administration and
management: a holitic approach. Pretoria. Van Schaik Publishers.

90
Van Averbeke, W. and Mohamed, S.S. (2006). Smallholder irrigation schemes in
South Africa: past, present and future. TUT. Pretoria.South Africa.
Van Rooyen, C.J. and Nene, S. (1996). What can we learn from previous small
farmer development strategies in South Africa? Agrekon 34(4).
Vorster, J.H. 1989. Dependency, in development is for people. Johannesburg.
Southern Books Publishers (pty) ltd.
Weinreich, N.K. (2006). Integrating quantitative and qualitative methods in Social
research. http://www.social-marketing.comm. Accessed on the 16 May 2007.
World Bank. (1998/99). African development indicators: Poverty reduction in South
Africa: A sub-regional brief. Nairobi. Kenya. The World Bank Group.
World Bank. (2001). Tanzania at the turn of the century. From reforms to sustained
growth and poverty reduction. A World Bank country study. The Government
of the United Republic of Tanzania. Washington DC. The World Bank Group
World Bank Group (2004). Community driven development: poverty reduction
strategy sourcebook - Community driven development chapter. The World
Bank. Washington DC. http:// inweb18.worldbank.org. Accessed on the 16 May
2007. The World Bank Group.
World Development Report. (2003). The World Bank. Washington, D.C. The World
Bank Group.