COMMUNITY COLLEGE OF RHODE ISLANDfaculty.ccri.edu/wsuits/CHMT I SYLLABUS SPRING 2014... · Web...
26
COMMUNITY COLLEGE OF RHODE ISLAND CHEMICAL TECHNOLOGY I SYLLABUS Spring Semester – 2014 (Evening Program) COURSE NUMBER: CHMT 1120-106; CRN 16285 COURSE TITLE/Room#: CHEMICAL TECHNOLOGY I / 6018 CREDITS: 6 TEXT: Introductory Chemistry: An Active Learning Approach 4 th Ed. by Cracolice & Peters-Purchase Used Copy On-line /home/website/convert/temp/convert_html/5acc488a7f8b9a93268c4ec5/document.doc page 1
Transcript of COMMUNITY COLLEGE OF RHODE ISLANDfaculty.ccri.edu/wsuits/CHMT I SYLLABUS SPRING 2014... · Web...
COMMUNITY COLLEGE OF RHODE ISLAND
CHEMICAL TECHNOLOGY I
SYLLABUS
Spring Semester – 2014 (Evening Program)
COURSE NUMBER: CHMT 1120-106; CRN 16285
COURSE TITLE/Room#:
CHEMICAL TECHNOLOGY I / 6018
CREDITS: 6
TEXT: Introductory Chemistry: An Active Learning Approach 4th Ed.
by Cracolice & Peters-Purchase Used Copy On-line
LAB MANUAL:
note:
Modern Chemical Technology Vol. IA
(Chapters 1 – 10)By Hajian & Pecsok
Purchased at STAPLES on Bald Hill Rd., Warwick, RI
Call the “copy center” of STAPLES (828-3737 Extension 2) one hour
in advance of purchase time
EQUIPMENT NEEDED: Scientific Calculator (EE or Exp. and Log Function Keys), Lecture Notebook, Clear Metric Ruler, Lab Safety Glasses
(available in the Bookstore)
INSTRUCTOR: Wayne Suits, Professor of Chemistry
TELEPHONE NUMBERS:
Office: 825-2010Lab: 825-2240
/tt/file_convert/5acc488a7f8b9a93268c4ec5/document.docpage 1

COURSE DESCRIPTION:
Chemical Technology I is the first of four sequential courses (ChemTec I-IV) that constitute the core of the Chemical Technology Program at CCRI. These courses can lead to an Associate in Applied Science Degree or to a Certificate in Chemical Technology, depending upon ancillary course work taken. (See page 3 for program requirements) Please note that ChemTec III will be a 30-week, as opposed to a 15-week, course. It will meet for eight hours each week and proceed from Jan. 2015 through Aug. 2015. This will ensure graduation for Dec. 2015.
Chemical Technology I will introduce the student to the basic concepts in chemistry. Emphasis will be on chemical language, dimensional analysis, significant figures elements, compounds, separation and identification techniques, spectrophotometry, atomic structure and chemical bonding. The student will be instructed in the use of a variety of instruments including the gas chromatograph, high performance liquid chromatograph, analytical balances, visible and ultra violet spectrophotometers, biotech. plate reader and the atomic absorption spectrophotometer.
A minimum of grade of “C” is required in each of the four sequential chemistry classes (ChemTec I-IV) in order to advance to the next core class.
The assessment tools for this course will include weekly pre-lab quizzes, monthly exams, a final exam and the OWL (Online Web-based Learning) system.
The OWL SystemWatch Demo
The OWL system is both an on-line tutorial and an assessment tool. Students log onto the system, choose an assignment, read any given information and then answer the questions. Slightly different versions of the same questions are repeatedly presented to the student until the student achieves the correct answer or simply quits. The system only records the student’s best performance on each assignment. Consequently, OWL makes it possible for any student to achieve a perfect score for one of the five exams included in this class. The successful student must exercise a diligent work ethic because the assignments are only open for grading a prescribed amount of time.
/tt/file_convert/5acc488a7f8b9a93268c4ec5/document.doc - 2 -

The due dates for each assignment are listed next to the assignment name. Ample time is allotted for completion of each assignment. Therefore, no extensions of the due dates are allowed. Beyond the due date for an assignment the grading is closed for that assignment, but the assignment remains open for tutorial practice. OWL is a mandatory assignment.
To purchase an OWL Access Code, go to http://www.cengage.com/owl/ and navigate down to your course type, Introductory/Preparatory Chemistry. While inside the red box, choose “Buy an Access Code” from the course’s red drop down menu. Your Access Code will be associated with the following text: Introductory Chemistry: An Active Learning Approach, 4th Edition, Cracolice, Peters.
The staff at cengage will e-mail an access code to you. After you have your access code, you will use it to register for OWL and choose a login and password.
Please go to www.cengage.com/owl/videos/gettingstarted/ for complete registration instruction. If you need assistance during the process, visit the Technical Support area at www.cengage.com/owl for help.
PROGRAM REQUIREMENTS
Refer to the current CCRI College catalog at the following link:
http://www.ccri.edu/catalog/pdfs/chemtech-ps.pdfhttp://ccri.edu/catalog/pdfs/chemtechcert-ps.pdf
COURSE SCHEDULE:
This course will meet twice each week, on Wednesday evenings (6:00PM-9:30 PM) and on Saturday mornings (8:00 AM-1:30 PM). Typically, lecture material will be covered on Wednesday evening and laboratories will be conducted on Saturday. We will attempt to complete two experiments each Saturday. Any experiment not completed will be continued on the next Saturday.
/tt/file_convert/5acc488a7f8b9a93268c4ec5/document.doc - 3 -

GRADING SCHEME:
Four 100-point Exams, including OWL (Best 2 of the 3 in class hour exams plus
OWL)
300 points
Twenty-four 20-point Lab Reports (Best 23) .
460 points
Fifteen 10-point Pre-Lab Quizzes (Best 14).
140 points
One 200 point Final Exam. 200 points
TOTAL 1080 points
EXAM Coverage (Chapters are from Modern Chemical Technology Vol. IA)
Exam I Chapters 1,2
Exam II Chapters 3,5
Exam III Chapters 6,7
Final Exam Comprehensive including Chapters 8,9,10
PRE-LAB QUIZZES:
These short, relatively simple quizzes that prove you have read the current week’s labs and viewed any pre-lab discussion movies. They will be given at the beginning of each Saturday’s pre-lab discussions.
LAB REPORTS:
Rules for writing Lab Reports appear on page 5 of this handout. Lab Reports will be due one week following the completion of each lab. Late Lab Reports will receive a penalty of 1 point for each day that the lab is late. Lab Reports that are 2 weeks late will not be accepted.
Lab reports will be graded on the following criteria:
1) Timeliness and Organization2) Completeness3) Calculations4) Conclusions5) Accuracy of Results/tt/file_convert/5acc488a7f8b9a93268c4ec5/document.doc - 4 -

FORMAT FOR LAB REPORTS
NameDate of Lab CompletionExp. #
Title of Experiment
Purpose: State the purpose of the experiment and present a brief overview of how this will be achieved.
Reactions Write all pertinent chemical equations.Procedure: In most cases, the lab procedure will come directly from
the ChemTec Volumes. Consequently, this section may be satisfied by referencing the ChemTec Vol., Ed., and pg. # from which the procedure was taken. If the procedure was modified, then a note should be made of the exact procedure modification.
Data: These are all the measurements (weights, volumes, absorbtions, etc.) taken during the lab. A unit must accompany each data entry. Erroneous data must never be erased but rather one line should be drawn through it. Always present data in a data table. The table should be constructed before coming to lab.
Calculations: These are the arithmetical manipulations performed on the data entries. If a particular calculation is to be repeated several times, then only one sample calculation need be demonstrated. Remember that whenever data is used in a calculation, its unit must also be included in the calculation.
Results: These are the results of the calculations. Whenever possible, put results in table form. Remember units.
Conclusion: The conclusion refers back to the purpose of the experiment by answering the question(s) posed in the purpose. Experimental results are restated in the conclusion and it is appropriate, though not necessary, to discuss any inherent problems with the experimental procedure and to offer suggestions for procedure improvements.
Note: Always keep an extra copy of your report.
/tt/file_convert/5acc488a7f8b9a93268c4ec5/document.doc - 5 -

RULES FOR WRITING LAB REPORTS
Your lab report should contain a sufficiently accurate description of procedure, or reference to this information, such that another technician could duplicate your lab results by merely following the procedure in your lab report.
All data (measurements) should be recorded directly in the “Data and Observation” section of your lab report. Never record data and observations on scrap paper with the notion that you will later recopy them into your lab report.
Keep your writing legible and as neat as possible. Use ink, never pencil. Never erase; draw a single line through unwanted entries so they still can be read. You may want to think about the bad results as well as the good ones. Lined out results can still be read; erased results are lost forever.
Whenever possible, prepare tables ahead of time to accept the data and observations so that the readings or comments can be entered simple and quickly.
Never fudge figures or change data because you think that is “the way it should have been.” If an experiment is ended by an accidental spill or breakage and if there is not enough time left to complete the experiment, then write this in your lab report. Remember the essence of a good lab report is accuracy.
If numerical calculations using experimental data are required and furthermore, if all calculations are the same, the you need include only one sample calculation and the answers to the remaining ones.
Finally, there are two very important talents that you should strive to develop when writing lab reports. The first of these is to interpret the experimental results in terms of the original purpose of the experiment. The experimental results are relating exciting truths in coded messages. If you can develop the ability to decipher these coded messages, then you will become an asset to any scientific endeavor.
The second talent that should be developed when writing lab reports is the one that will enrich every facet of your life. That is, the ability to express yourself in written and verbal communications. It is a proven fact that those individuals, whose vocabulary and communicative skills are well developed, climb the latter of success much more rapidly than
/tt/file_convert/5acc488a7f8b9a93268c4ec5/document.doc - 6 -

do those individuals who lack a good vocabulary and communicative skills.
Remember, “Brevity is a Virtue.” A good lab report is generally no more than two or three pages in length.
/tt/file_convert/5acc488a7f8b9a93268c4ec5/document.doc - 7 -

CHEMICAL TECHNOLOGY ICHMT 1120-106
SPRING SEMESTER – 2014 (Evening Program)
Lab Syllabus
Experiment #
Lab Title &Links to Pre-lab Videos
Assigned Reading (pages)
1 1-1: Analysis by Paper ChromatographyProcedure Modifications
http://faculty.ccri.edu/wsuits/EXPERIMENT 1-1.docPre-lab Discussion & Video
mms://stream1.ccri.edu/Chemistry/exp-1-1.wmvSample Video of paper
Chromatographyhttp://chem.wisc.edu/deptfiles/genchem/lab/labdocs/modules/
paprchrom/paprchromdesc.htmLab Report for Paper
Chromatographyhttp://faculty.ccri.edu/wsuits/PaperChromLabWriteUP.doc
3–7
2 2-1: Gas Chromatography – Qualitative Analysis
Prep-lab Discussionmms://stream1.ccri.edu/Chemistry/2-1gas.wmv
Lab Report for Gas Chromatographyhttp://faculty.ccri.edu/wsuits/GCLabWriteUp.doc
http://faculty.ccri.edu/wsuits/GC(Vernier )LabWriteUp.doc
15-19, 24-29,&35-38
3 Colors of Grape Kool-Aid by Liquid Chromatography (Handout)
Handouthttp://faculty.ccri.edu/wsuits/SepPakWriteUp-CT I.doc
Pre-lab Discussionmms://stream1.ccri.edu/Chemistry/koolaid.wmv
*Handout
4 Analysis by HPLC (Handout) Handout and Movie
http://faculty.ccri.edu/wsuits/HPLC Of The Trace Enhanced Commercial Dye Mixture in Tropical Berry Kool Aid.doc
mms://stream1.ccri.edu/Chemistry/hplc.wmv
*Handout
5 Quantitative Analysis for 2-Butanone Handout and Movie
http://faculty.ccri.edu/wsuits/Quantitative Analysis of 2-Butanone.docx
/tt/file_convert/5acc488a7f8b9a93268c4ec5/document.doc - 8 -

6 Density of a Regularly Shaped and Irregularly Shaped Solids (Handout)
Handouthttp://faculty.ccri.edu/wsuits/Exp. 6 - Density of Solids
CHEMICAL TECHNOLOGY I.doc
*Handout
7 3-3: Determining the Density of a LiquidPre-lab Discussion
mms://stream1.ccri.edu/Chemistry/density-liquids.wmv
Lab Report for Density of Liquidhttp://faculty.ccri.edu/wsuits/Density of Liquids.doc
58-62
8 3-4: Measuring the Density of Gases Pre-lab Discussion
mms://stream1.ccri.edu/Chemistry/density-gas.wmv
Lab Report for Density of a Gashttp://faculty.ccri.edu/wsuits/Density of Gases.doc
63-67
9 4-1: The Pressure-Volume Relationship of a Gas (Handout) mms://stream1.ccri.edu/ctrelay/Pre-lab_Discussion_Gas_Laws_-_Windows_Media_(Medium)_-_20110405_05.44.03PM.wmv
Lab Procedure begins on page 15 of this syllabus
*Attached
10 4-2: The Volume-Temperature Relationship of a Gas
81-85
11 Freezing Point of Phenyl Salicylate (Handout)
mms://stream1.ccri.edu/ctrelay/Freezing_and_Melting_of_Water_-_Windows_Media_(Medium)_-_20110306_04.53.12PM.wmv
The above movie is not about the Freezing Point of Phenyl Salicylate but rather that of Water. However, it will provide an overview of how your lab should proceed.
*Handout
12 5-2: Melting Point of Solidsmms://stream1.ccri.edu/Chemistry/5-2Suits.wmv
106-110
/tt/file_convert/5acc488a7f8b9a93268c4ec5/document.doc - 9 -

13 5-3: Determination of Boiling Pointsmms://stream1.ccri.edu/Chemistry/suits-5-3.wmv
* All Handouts are on Pipeline
118-120
Experiment #
Lab Title Assigned Reading (pages)
14 6-1: Decomposition of a Compound
mms://stream1.ccri.edu/ctrelay/Exp._6-2_Decomp._of_a_Comp._-_Windows_Media_(Medium)_-_20110714_10.45.36PM.wmv
136-142 (omit section on
weighting by difference
15 6-2: The Formula of a Metal Chloride 143-152
16 6-3: The Effect of Temperature on Solubility
mms://stream1.ccri.edu/ctrelay/Pre-lab_discussion_for_Effect_of_Temp_on_Solubility_of_a_Salt_-_Windows_Media_(Medium)_-_20110329_05.25.01PM.wmv
152-159 andSolubility Exp.
document
/tt/file_convert/5acc488a7f8b9a93268c4ec5/document.doc - 10 -

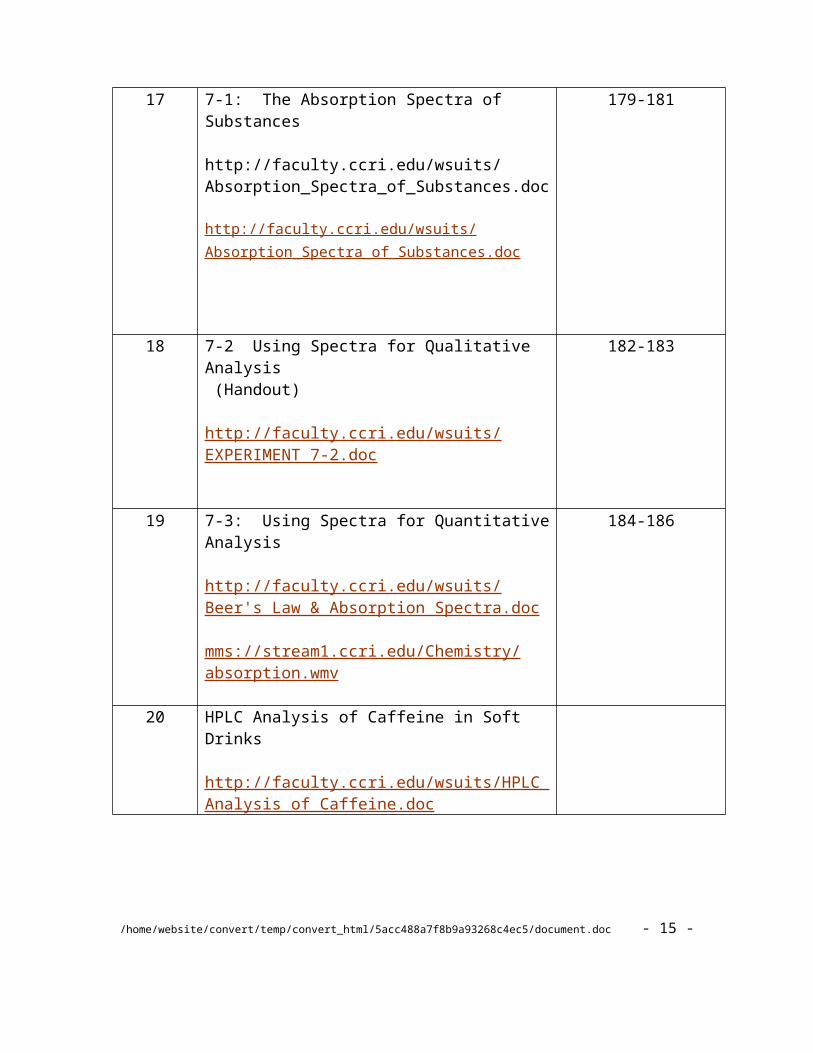
17 7-1: The Absorption Spectra of Substances
http://faculty.ccri.edu/wsuits/Absorption_Spectra_of_Substances.doc
http://faculty.ccri.edu/wsuits/Absorption_Spectra_of_Substances.doc
179-181
18 7-2 Using Spectra for Qualitative Analysis (Handout)
http://faculty.ccri.edu/wsuits/EXPERIMENT 7-2.doc
182-183
19 7-3: Using Spectra for Quantitative Analysis
http://faculty.ccri.edu/wsuits/Beer's Law & Absorption Spectra.doc
mms://stream1.ccri.edu/Chemistry/absorption.wmv
184-186
20 HPLC Analysis of Caffeine in Soft Drinks
http://faculty.ccri.edu/wsuits/HPLC Analysis of Caffeine.doc
/tt/file_convert/5acc488a7f8b9a93268c4ec5/document.doc - 11 -

21 Use of the Biotech. Plate Reader (Handout)
http://faculty.ccri.edu/wsuits/Biotech. Plate reader.docmms://stream1.ccri.edu/Chemistry/biotechplate.wmv
*Handout
22 Experiment 21-5: Quantitative Analysis for Aromatic Hydrocarbons by Ultraviolet Spectrophotometry
Note: This lab will be e-mailed to all of you via CCRI e-mail. Don't worry if you cannot open this lab. You will only be quizzed on the biotech plate reader lab and this lab is sufficiently simple that you can prepare for it on the Saturday of the lab.
552-557
23 8-3: Analysis of Iron in a Prenatal Vitamin by Atomic Absorption Spectrophotometry
212-216
24 9-1: Electrical Conductance of Substances 230-232
25 9-2: Electrolysis 234-237
/tt/file_convert/5acc488a7f8b9a93268c4ec5/document.doc - 12 -

CHEMICAL TECHNOLOGY I
CHMT 1120-106Spring SEMESTER – 2014 (Evening Program)
Lecture syllabus
I. Math Review and Calculator Usage
II. Chemistry, Matter and Chemical Analysisa. Separation Techniques – Paper , Gas Chromatography & HPLC
III. Measurements
a. Metric Systemb. Recording and Using Measurementsc. Significant Figuresd. Scientific Notation
IV. Dimensional Analysis
V. Temperature Scales and Conversions
VI Mass vs. Weight
VII Density Determinations
a. Solidsb. Liquidsc. Gases
VIII Graphing
a.IX Phase Changes
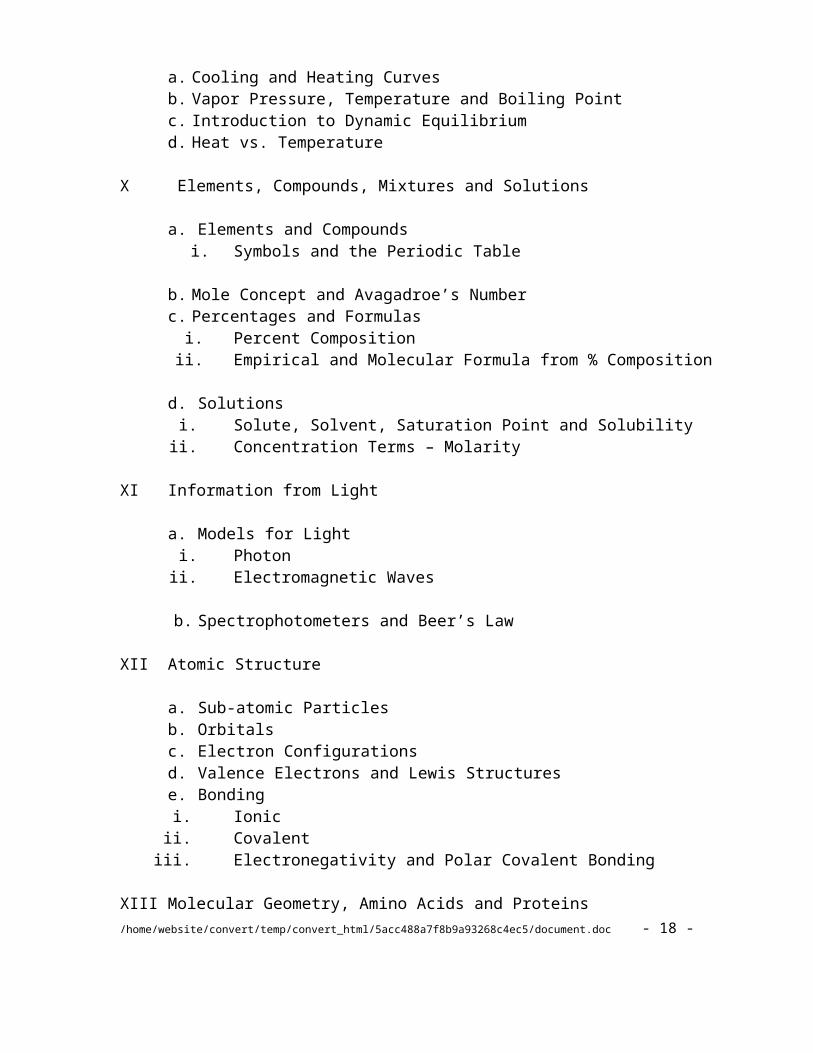
a. Cooling and Heating Curvesb. Vapor Pressure, Temperature and Boiling Pointc. Introduction to Dynamic Equilibriumd. Heat vs. Temperature
X Elements, Compounds, Mixtures and Solutions
a. Elements and Compounds/tt/file_convert/5acc488a7f8b9a93268c4ec5/document.doc - 13 -

i. Symbols and the Periodic Table
b. Mole Concept and Avagadroe’s Numberc. Percentages and Formulas
i. Percent Compositionii. Empirical and Molecular Formula from % Composition
d. Solutionsi. Solute, Solvent, Saturation Point and Solubilityii. Concentration Terms – Molarity
XI Information from Light
a. Models for Lighti. Photonii. Electromagnetic Waves
b. Spectrophotometers and Beer’s Law
XII Atomic Structure
a. Sub-atomic Particlesb. Orbitalsc. Electron Configurationsd. Valence Electrons and Lewis Structurese. Bonding
i. Ionicii. Covalentiii. Electronegativity and Polar Covalent Bonding
XIII Molecular Geometry, Amino Acids and Proteins
/tt/file_convert/5acc488a7f8b9a93268c4ec5/document.doc - 14 -
Boyle’s Law: Pressure-Volume Relationship in Gases
The primary objective of this experiment is to determine the relationship between the pressure and volume of a confined gas. The gas we use will be air, and it will be confined in a syringe connected to a Gas Pressure Sensor (see Figure 1). When the volume of the syringe is changed by moving the piston, a change occurs in the pressure exerted by the confined gas. This pressure change will be monitored using a Gas Pressure Sensor. It is assumed that temperature will be constant throughout the experiment. Pressure and volume data pairs will be collected during this experiment and then analyzed. From the data and graph, you should be able to determine what kind of mathematical relationship exists between the pressure and volume of the confined gas. Historically, this relationship was first established by Robert Boyle in 1662 and has since been known as Boyle’s law.
OBJECTIVESIn this experiment, you will
Use a Gas Pressure Sensor and a gas syringe to measure the pressure of an air sample at several different volumes.
Determine the relationship between pressure and volume of the gas. Describe the relationship between gas pressure and volume in a mathematical equation. Use the results to predict the pressure at other volumes.
Figure 1
MATERIALScomputer Vernier Gas Pressure Sensor Vernier computer interface 20 mL gas syringeLogger Pro
PROCEDURE1. Prepare the Gas Pressure Sensor and an air sample for data collection.
a. Plug the Gas Pressure Sensor into Channel 1 of the computer interface. b. With the 20 mL syringe disconnected from the Gas Pressure Sensor, move the piston
of the syringe until the front edge of the inside black ring (indicated by the arrow in Figure 2) is positioned at the 10.0 mL mark.
/tt/file_convert/5acc488a7f8b9a93268c4ec5/document.doc - 15 -

c. Attach the 20 mL syringe to the valve of the Gas Pressure Sensor. 2. Prepare the computer for data collection by opening the file “06 Boyle’s Law” from the
Chemistry with Computers folder of Logger Pro.3. To obtain the best data possible, you will need to correct the volume readings from the
syringe. Look at the syringe; its scale reports its own internal volume. However, that volume is not the total volume of trapped air in your system since there is a little bit of space inside the pressure sensor.
To account for the extra volume in the system, you will need to add 0.8 mL to your syringe readings. For example, with a 5.0 mL syringe volume, the total volume would be 5.8 mL. It is this total volume that you will need for the analysis.
4. Click to begin data collection.
5. Collect the pressure vs. volume data. It is best for one person to take care of the gas syringe and for another to operate the computer.a. Move the piston to position the front edge of the inside black ring (see Figure 2) at the
5.0 mL line on the syringe. Hold the piston firmly in this position until the pressure value stabilizes.
Figure 2b. When the pressure reading has stabilized, click . (The person holding the
syringe can relax after is clicked.) Type in the total gas volume (in this case, 5.8 mL) in the edit box. Remember, you are adding 0.8 mL to the volume of the syringe for the total volume. Press the ENTER key to keep this data pair. Note: You can choose to redo a point by pressing the ESC key (after clicking but before entering a value).
c. Move the piston to the 7.0 mL line. When the pressure reading has stabilized, click and type in the total volume, 7.8 mL.
d. Continue this procedure for syringe volumes of 9.0, 11.0, 13.0, 15.0, 17.0, and 19.0 mL.
e. Click when you have finished collecting data.
6. In your data table, record the pressure and volume data pairs displayed in the table (or, if directed by your instructor, print a copy of the table).
7. Examine the graph of pressure vs. volume. Based on this graph, decide what kind of mathematical relationship you think exists between these two variables, direct or inverse. To see if you made the right choice: a. Click the Curve Fit button, .
/tt/file_convert/5acc488a7f8b9a93268c4ec5/document.doc - 16 -

b. Choose Variable Power (y = Ax^n) from the list at the lower left. Enter the power value, n, in the Power edit box that represents the relationship shown in the graph (e.g., type “1” if direct, “–1” if inverse). Click .
c. A best-fit curve will be displayed on the graph. If you made the correct choice, the curve should match up well with the points. If the curve does not match up well, try a different exponent and click again. When the curve has a good fit with the data points, then click .
8. Once you have confirmed that the graph represents either a direct or inverse relationship, print a copy of the graph, with the graph of pressure vs. volume and its best-fit curve displayed.
9. With the best-fit curve still displayed, proceed directly to the Processing the Data section.
DATA AND CALCULATIONSVolume
(mL)Pressure
(kPa)Constant, k
(P / V or P • V)
PROCESSING THE DATAWith the best-fit curve still displayed, turn on the Interpolate tool by choosing Interpolate in the Analyze menu. Use your data and the Interpolate tool to answer the following questions.
1. If the volume is doubled from 5.0 mL to 10.0 mL, what does your data show happens to the pressure? Show the pressure values in your answer.
2. If the volume is halved from 20.0 mL to 10.0 mL, what does your data show happens to the pressure? Show the pressure values in your answer.
3. If the volume is tripled from 5.0 mL to 15.0 mL, what does your data show happened to the pressure? Show the pressure values in your answer.
4. From your answers to the first three questions and the shape of the curve in the plot of pressure vs. volume, do you think the relationship between the pressure and volume of a confined gas is direct or inverse? Explain your answer.
5. Based on your data, what would you expect the pressure to be if the volume of the syringe was increased to 40.0 mL? Explain or show work to support your answer.
/tt/file_convert/5acc488a7f8b9a93268c4ec5/document.doc - 17 -
6. Based on your data, what would you expect the pressure to be if the volume of the syringe was decreased to 2.5 mL? Explain or show work to support your answer.
7. What experimental factors are assumed to be constant in this experiment?
8. One way to determine if a relationship is inverse or direct is to find a proportionality constant, k, from the data. If this relationship is direct, k = P/V. If it is inverse, k = P•V. Based on your answer to Question 4, choose one of these formulas and calculate k for the seven ordered pairs in your data table (divide or multiply the P and V values). Show the answers in the third column of the Data and Calculations table.
9. How constant were the values for k you obtained in Question 8? Good data may show some minor variation, but the values for k should be relatively constant.
10. Using P, V, and k, write an equation representing Boyle’s law. Write a verbal statement that correctly expresses Boyle’s law.
EXTENSION1. To confirm the type of relationship that exists between pressure and volume, a graph of
pressure versus the reciprocal of volume (1/volume or volume-1) may also be plotted. To do this using Logger Pro, it is necessary to create a new column of data, reciprocal of volume, based on your original volume data.a. Remove the Curve Fit box from the graph by clicking on its upper-left corner.b. Choose New Calculated Column from the Data menu. c. Enter “1/Volume” as the Name, “1/V” as the Short Name, and “1/mL” as the Unit.
Enter the correct formula for the column (1/volume) into the Equation edit box. To do this, type in “1” and “/”. Then select “Volume” from the Variables list. In the Equation edit box, you should now see displayed: 1/“Volume”. Click .
d. Click on the horizontal-axis label, select “1/Volume” to be displayed on the horizontal axis.
2. Decide if the new relationship is direct or inverse and change the formula in the Fit menu accordingly.a. Click the Curve Fit button, . b. Choose Variable Power from the list at the lower left. Enter the value of the power in
the edit box that represents the relationship shown in the graph (e.g., type “1” if direct, “–1” if inverse). Click .
c. A best-fit curve will be displayed on the graph. If you made the correct choice, the curve should match up well with the points. If the curve does not match up well, try a different exponent and click again. When the curve has a good fit with the data points, then click .
3. If the relationship between P and V is an inverse relationship, the plot of P vs. 1/V should be direct; that is, the curve should be linear and pass through (or near) your data points. Examine your graph to see if this is true for your data.
4. Print a copy of the graph.
/tt/file_convert/5acc488a7f8b9a93268c4ec5/document.doc - 18 -

COMMUNITY COLLEGE OF RHODE ISLAND
Statement of Safety Rules: You must observe the following Lab Instructions which are given for your safety and the safety of other students in your class.
1) Safety glasses must be worn in the laboratory at all times.
2) Whenever an accident occurs, notify your instructor immediately.
3) When heating a substance in a test tube, never point the open end of the test tube at yourself or your neighbors.
4) Whenever using a Bunsen burner, make sure that long hair is tied back.
5) When attempting to detect chemical odors, exercise extreme caution.
6) Never taste a chemical.
7) Avoid touching hot objects such as the barrel of a gas burner.
8) When diluting acids with water, always pour the acid into the water carefully. Do not pour water into acids. Remember,.....Always add acid to water, like you oughta.
9) If any chemical is spilled or splashed on your skin, flush the affected area with large amounts of water. If you splash chemicals in your eyes, use the eyewash immediately. In the case of larger spills, use the emergency safety showers. Report the occurrence to the instructor.
10) Always read the label on the reagent bottle before using the substance in the bottle.
11) When dispensing liquid reagents from a reagent bottle, always hold the bottle with the label facing the palm of your hand and pour out the side opposite the label.
12) Remember to always replace the cap from a reagent bottle after using it. (Avoid contamination of reagents.)
13) Always heat a volatile, flammable substance in a water bath or steam bath, preferably under a hood. Never use a direct flame.
/tt/file_convert/5acc488a7f8b9a93268c4ec5/document.doc - 19 -

14) Shoes must be worn in the lab at all times (i.e., no sandals).
15) No food, drinks or smoking are allowed in the lab.
16) Familiarize yourself with the location of the eyewash, the safety shower, the fire extinguisher and the fire blanket.
17) If you are unsure exactly which chemical to use or how to do a procedure, ask you instructor before you proceed.
/tt/file_convert/5acc488a7f8b9a93268c4ec5/document.doc - 20 -


![[PPT]Slide 1 - Community College of Rhode Islandfaculty.ccri.edu/mrizzo/Intro_Documents/tia6e_ppt_ch05.ppt · Web viewCopyright © 2010 Pearson Education, Inc. Publishing as Prentice](https://static.fdocuments.us/doc/165x107/5b30fbf07f8b9a94168e253b/pptslide-1-community-college-of-rhode-web-viewcopyright-2010-pearson.jpg)


![[PPT]SWITCH Ch 1 - Community College of Rhode Islandfaculty.ccri.edu/jmowry/SWITCH PP 2015/en_SWITCH_v6_Ch01... · Web viewChapter 1: Analyzing The Cisco Enterprise Campus Architecture](https://static.fdocuments.us/doc/165x107/5ad061387f8b9a1d328e3a72/pptswitch-ch-1-community-college-of-rhode-pp-2015enswitchv6ch01web-viewchapter.jpg)