COMMUNITY BASED PLAN WARD 13 - newcastle.gov.za
23
NEWCASTLE LOCAL MUNICIPALITY COMMUNITY BASED PLAN WARD 13 JUNE 2021
Transcript of COMMUNITY BASED PLAN WARD 13 - newcastle.gov.za
NEWCASTLE LOCAL MUNICIPALITY
COMMUNITY BASED PLAN
WARD 13
JUNE 2021
1 | P a g e
N e w c a s t l e L o c a l M u n i c i p a l i t y
C o m m u n i t y B a s e d P l a n s
Contents
1 1. PARTICIPANTS TO THE PLANNING ACTIVITY. ............................................................... 1
2 2. INTRODUCTION. ..................................................................................................................... 2
3 3. SITUATIONAL ANALYSIS. .................................................................................................... 3
10. CHILD HEADED HOUSEHOLDS. ............................................................................................ 7
3.11. STATE OF INFRASTRUCTURE (SERVICE DELIVERY). ................................................... 7
3.12. CRIME AND SAFETY. .......................................................................................................... 10
3.13. CITIZEN SATISFACTION. .................................................................................................... 10
3.14. STATE OF THE ENVIRONMENT. ....................................................................................... 11
3.15. LOCAL ECONOMIC DEVELOPMENT. .............................................................................. 11
3.17. RELIGIOUS FACILITIES ...................................................................................................... 12
3.18. SOCIO-ECONOMIC FACILITIES. ........................................................................................ 12
3.19. LAND USE MANAGEMENT (INCLUDING SPATIAL TRENDS AND PATTERNS). ..... 12
3.21. LAND TENURE/OWNERSHIP. ............................................................................................ 12
3.22. CLIMATE CHANGE (NATURAL DISASTER WITHIN THE LAST 30 YEARS). ............ 13
3.23. DISABILITY PROFILE. ......................................................................................................... 13
3.24. IMMIGRATION PROFILE. .................................................................................................... 13
3.25. STATE OF GOVERNANCE INCLUDING (TRADITIONAL LEADERS) .......................... 13
3.26. PUBLIC PARTICIPATION IN MUNICIPAL AFFAIRS (INCLUDING MECHANISMS). 13
4 PROJECTS THAT HAVE TAKEN PLACE OVER THE YEARS AND 2020/21 PROJECTS. 13
4.1. Report on the implementation of Capital Projects from the Municipality & Government Sector
Departments (2020/21). .................................................................................................................... 13
4.1.1 Department of Human Settlements ............................................................................... 13
4.1.2 Department of Education .............................................................................................. 14
4.1.3 Budget and Treasury Office .......................................................................................... 14
4.1.4 Technical Services ........................................................................................................ 14
4.2 Capital Projects from the Municipality & Government Sector Departments (2021/22). ...... 15
4.2.1. Department of Technical Services. ..................................................................................... 15
4.2.2. Department of Education .............................................................................................. 15
4.2.3. Department of Environment, Forestry and Fisheries .................................................... 16
5. SWOT ANALYSIS. ..................................................................................................................... 17
7. OBJECTIVES OF THE WARD TOWARDS DEVELOPMENT. ............................................... 18
5 8. SUSTAINABLE DEVELOPMENT GOALS AS A STRATEGY. .......................................... 20
6 9. DECLARATION. ..................................................................................................................... 22
1 1. PARTICIPANTS TO THE PLANNING ACTIVITY.
1.1. GOVERNANCE.
WARD COUNCILLOR : RRN Mdluli
WARD COMMITTEE STRUCTURE :
2 | P a g e
N e w c a s t l e L o c a l M u n i c i p a l i t y
C o m m u n i t y B a s e d P l a n s
NAME MALE/FEMALE PORTFOLIO
Zama Zwane F
Social Services
Monde Dukashe M
Local Economic development
Mthanti Gugu F
Infrastructure and Service Delivery
Magonondo Kubeka M
Infrastructure and Service Delivery
Ndlovu Alfred M
Social Services
Makhubo Nkululeko M
Social Services
Mthanti Sandile M
Local Economic development
Mlangeni Sonnyboy M
Infrastructure and Service Delivery
Ntombela Bongani M
Social Services
Pillay Ntombikayise F Local Economic development
1.2. STAKEHOLDERS.
PARTICIPATING ORGANIZATION & SECTOR OBJECTIVES
2 2. INTRODUCTION.
2.1. EXECUTIVE SUMMARY.
This document represents a Community Based Plan for Ward 13, Newcastle Local Municipality. Entailed herein is a brief reflection of the status quo, development challenges as well as priorities and objectives towards the development of the ward. The purpose of this document is to ensure development at grass root level and thus inform the development of the municipality’s Integrated Development Plan.
3 | P a g e
N e w c a s t l e L o c a l M u n i c i p a l i t y
C o m m u n i t y B a s e d P l a n s
3 3. SITUATIONAL ANALYSIS.
3.1. GEOGRAPHIC AREAS FALLING WITHIN THE WARD.
The names of the geographical areas falling with ward 13 are as follows:-
• Vezunyawo
• Ema4room
• Temereza
3.2. POPULATION SIZE AND GROWTH PATTERNS.
POPULATION SIZE & GENDER DISTRIUTION MALES % FEMALES % TOTAL
4099 47% 4442 52% 8542 Table 1: 2011 Stats on the Population Size and Gender Distribution in ward 23 (2011 Census Data from Stats SA overlaid onto the 2016 boundaries).
An analysis of the statistical figures shows that there’s a higher majority of females (F – 52%) than males (M – 47%) within the ward. A comparison of the figures with that of other wards within the Newcastle Local Municipality shows that ward 13 has an average population within the boundaries of Newcastle.
3.3. HOUSEHOLD SIZE.
An analysis of the total number of households within Newcastle also shows that ward 13 has an average number of households in Newcastle. The total number of households within ward 13 is 1707 and the average household size is 4 people per household. However, consultation with the member of the key stakeholders within the ward shows a different view to the statistical figures. They are of the opinion that the majority of the households within ward 13 are made up of an average of 10 people per household, hence a need for the delivery of housing.
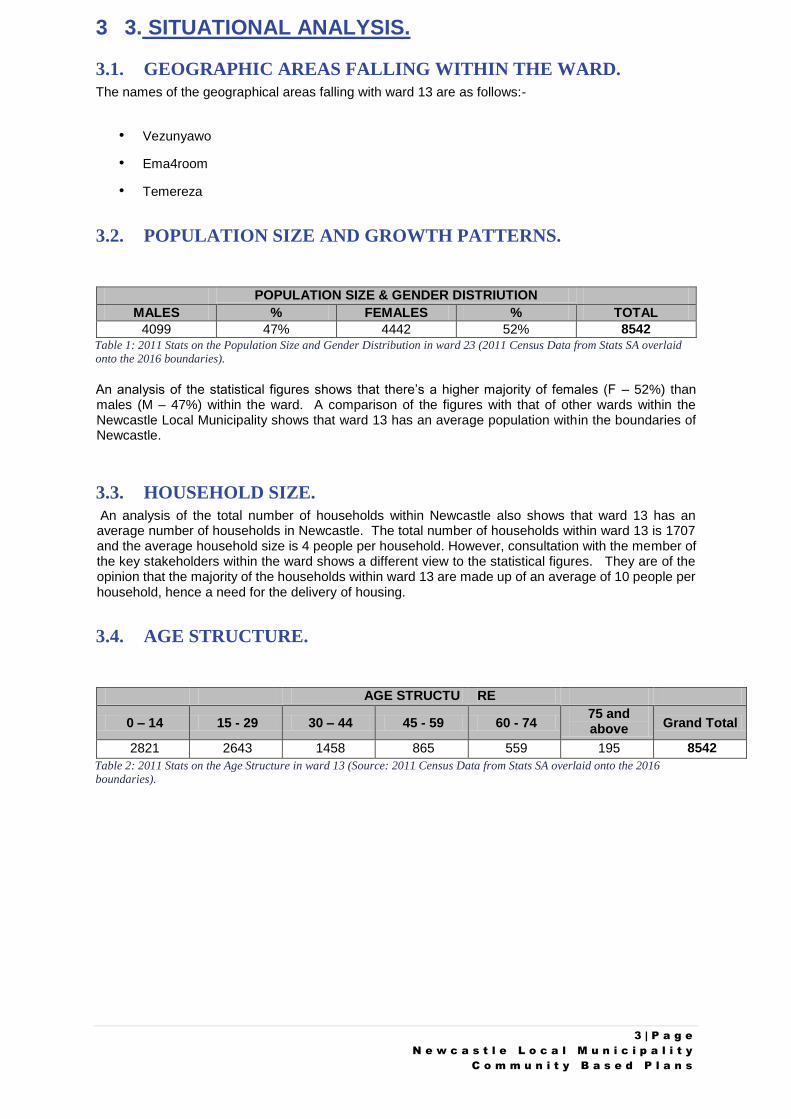
3.4. AGE STRUCTURE.
AGE STRUCTU RE
0 – 14 15 - 29 30 – 44 45 - 59 60 - 74 75 and above Grand Total
2821 2643 1458 865 559 195 8542
Table 2: 2011 Stats on the Age Structure in ward 13 (Source: 2011 Census Data from Stats SA overlaid onto the 2016 boundaries).
4 | P a g e
N e w c a s t l e L o c a l M u n i c i p a l i t y
C o m m u n i t y B a s e d P l a n s
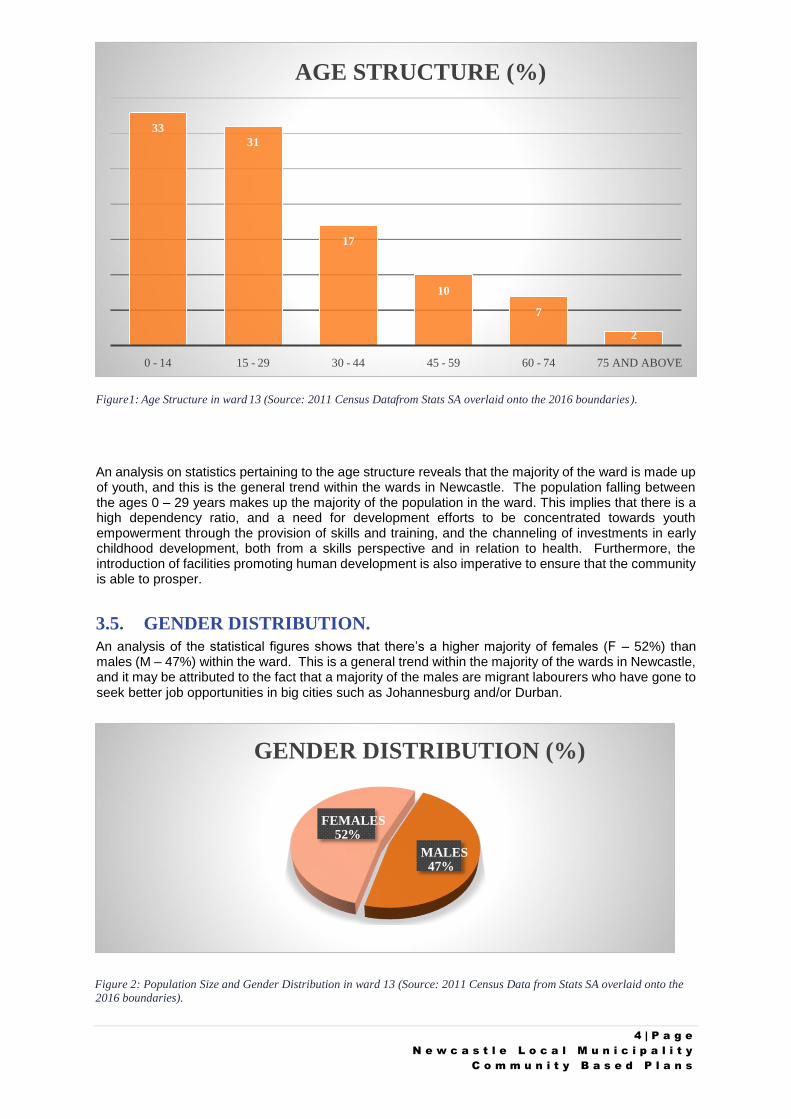
An analysis on statistics pertaining to the age structure reveals that the majority of the ward is made up of youth, and this is the general trend within the wards in Newcastle. The population falling between the ages 0 – 29 years makes up the majority of the population in the ward. This implies that there is a high dependency ratio, and a need for development efforts to be concentrated towards youth empowerment through the provision of skills and training, and the channeling of investments in early childhood development, both from a skills perspective and in relation to health. Furthermore, the introduction of facilities promoting human development is also imperative to ensure that the community is able to prosper.
3.5. GENDER DISTRIBUTION.
An analysis of the statistical figures shows that there’s a higher majority of females (F – 52%) than males (M – 47%) within the ward. This is a general trend within the majority of the wards in Newcastle, and it may be attributed to the fact that a majority of the males are migrant labourers who have gone to seek better job opportunities in big cities such as Johannesburg and/or Durban.
Figure 2: Population Size and Gender Distribution in ward 13 (Source: 2011 Census Data from Stats SA overlaid onto the 2016 boundaries).
Figure 1 13 Age Structure in ward : Source: 2011 Census Data ( from Stats SA overlaid onto the 2016 boundaries ).
33 31
17
10
7
2
0 - 14 15 - 29 30 - 44 45 - 59 60 - 74 AND ABOVE 75
AGE STRUCTURE (%)
MALES 47 %
FEMALES 52 %
GENDER DISTRIBUTION (%)
5 | P a g e
N e w c a s t l e L o c a l M u n i c i p a l i t y
C o m m u n i t y B a s e d P l a n s
3.6. STATE OF HEALTH (HIV/AIDS).
The following entails initiatives towards a health community which are currently taking place within the ward:-
• CCG
• Thembalokphila
• Phembokuhle • Phila Mntwana
• War room
Upon consultation with key stakeholders from the ward, it was indicated that the ward has a pick-up point for the distribution of medicine, and also indicated that there was an interest and an intension in the re-establishment thereof. The stakeholders proposed for a mobile clinic within ward 13.
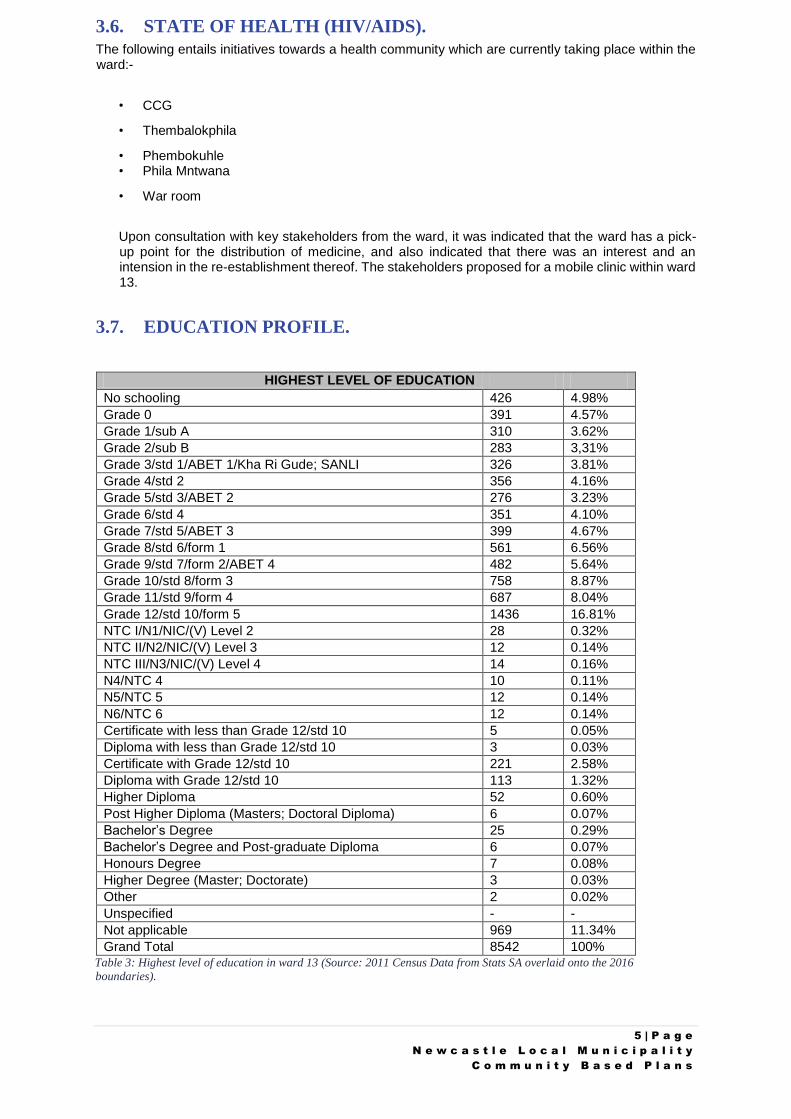
3.7. EDUCATION PROFILE.
HIGHEST LEVEL OF EDUCATION No schooling 426 4.98%
Grade 0 391 4.57% Grade 1/sub A 310 3.62% Grade 2/sub B 283 3,31% Grade 3/std 1/ABET 1/Kha Ri Gude; SANLI 326 3.81% Grade 4/std 2 356 4.16% Grade 5/std 3/ABET 2 276 3.23%
Grade 6/std 4 351 4.10% Grade 7/std 5/ABET 3 399 4.67% Grade 8/std 6/form 1 561 6.56% Grade 9/std 7/form 2/ABET 4 482 5.64% Grade 10/std 8/form 3 758 8.87% Grade 11/std 9/form 4 687 8.04%
Grade 12/std 10/form 5 1436 16.81% NTC I/N1/NIC/(V) Level 2 28 0.32% NTC II/N2/NIC/(V) Level 3 12 0.14% NTC III/N3/NIC/(V) Level 4 14 0.16% N4/NTC 4 10 0.11% N5/NTC 5 12 0.14%
N6/NTC 6 12 0.14% Certificate with less than Grade 12/std 10 5 0.05% Diploma with less than Grade 12/std 10 3 0.03% Certificate with Grade 12/std 10 221 2.58% Diploma with Grade 12/std 10 113 1.32% Higher Diploma 52 0.60%
Post Higher Diploma (Masters; Doctoral Diploma) 6 0.07% Bachelor’s Degree 25 0.29% Bachelor’s Degree and Post-graduate Diploma 6 0.07% Honours Degree 7 0.08% Higher Degree (Master; Doctorate) 3 0.03% Other 2 0.02%
Unspecified - - Not applicable 969 11.34% Grand Total 8542 100%
Table 3: Highest level of education in ward 13 (Source: 2011 Census Data from Stats SA overlaid onto the 2016
boundaries).
6 | P a g e
N e w c a s t l e L o c a l M u n i c i p a l i t y
C o m m u n i t y B a s e d P l a n s
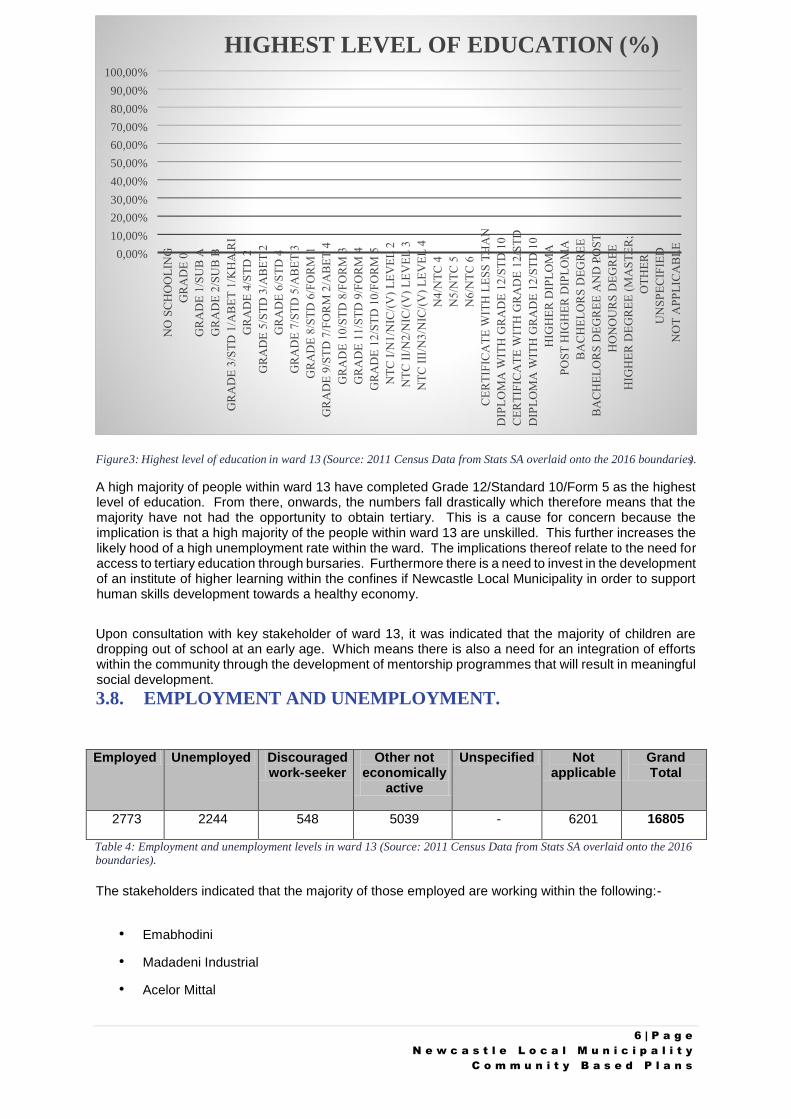
A high majority of people within ward 13 have completed Grade 12/Standard 10/Form 5 as the highest level of education. From there, onwards, the numbers fall drastically which therefore means that the majority have not had the opportunity to obtain tertiary. This is a cause for concern because the implication is that a high majority of the people within ward 13 are unskilled. This further increases the likely hood of a high unemployment rate within the ward. The implications thereof relate to the need for access to tertiary education through bursaries. Furthermore there is a need to invest in the development of an institute of higher learning within the confines if Newcastle Local Municipality in order to support human skills development towards a healthy economy.
Upon consultation with key stakeholder of ward 13, it was indicated that the majority of children are dropping out of school at an early age. Which means there is also a need for an integration of efforts within the community through the development of mentorship programmes that will result in meaningful social development.
3.8. EMPLOYMENT AND UNEMPLOYMENT.
Employed Unemployed Discouraged work-seeker
Other not economically
active
Unspecified Not applicable
Grand Total
2773 2244 548 5039 - 6201 16805
Table 4: Employment and unemployment levels in ward 13 (Source: 2011 Census Data from Stats SA overlaid onto the 2016 boundaries).
The stakeholders indicated that the majority of those employed are working within the following:-
• Emabhodini
• Madadeni Industrial
• Acelor Mittal
Figure 3 Highest level of education : in ward 13 ). Source: 2011 Census Data from Stats SA overlaid onto the 2016 boundaries (
,00% 0
,00% 10
,00% 20
,00% 30
,00% 40
50 ,00%
,00% 60
,00% 70
80 ,00%
90 ,00%
100,00 %
HIGHEST LEVEL OF EDUCATION (%)
7 | P a g e
N e w c a s t l e L o c a l M u n i c i p a l i t y
C o m m u n i t y B a s e d P l a n s
• Karbochem
• CWP
• EPWP
• Retail stores
• Domestic workers
• Nurses
• Teachers
• Police/Security
A lot of people in the ward have not had access to tertiary education. Just like all the other areas within Newcastle, the general trend in terms of the age structure of the unemployed is a high majority youth. The implications thereof entail the need for the creation of meaningful job opportunities through the attraction of investors into Newcastle. Furthermore, through proper knowledge-based learning, skills and training, there can be the development of entrepreneurs who will help strengthen the local economy and help towards the creation of jobs.
3.9. SOCIO-ECONOMIC STATUS (POVERTY LEVELS).
There is a high level of poverty within ward 13, due to the migration of males, a majority youth age structure and a high dependency ratio, there is also a high dependency on government support through social grants. However, the community has not been silent, they have initiated programmes towards fighting the scourge of poverty within the ward through feeding schemes. The following entails the organisations that have played an important role in ensuring the success of programmes towards fighting poverty:-
• DSD
• SASSA provides food parcels once off
10. CHILD HEADED HOUSEHOLDS.
The stakeholders also indicated that there are some households that are child-headed within the ward. However, the exact number had not yet been established as a detailed survey of the ward had not yet been done. Though it was indicated that there are no interventions in place to assist theses households.
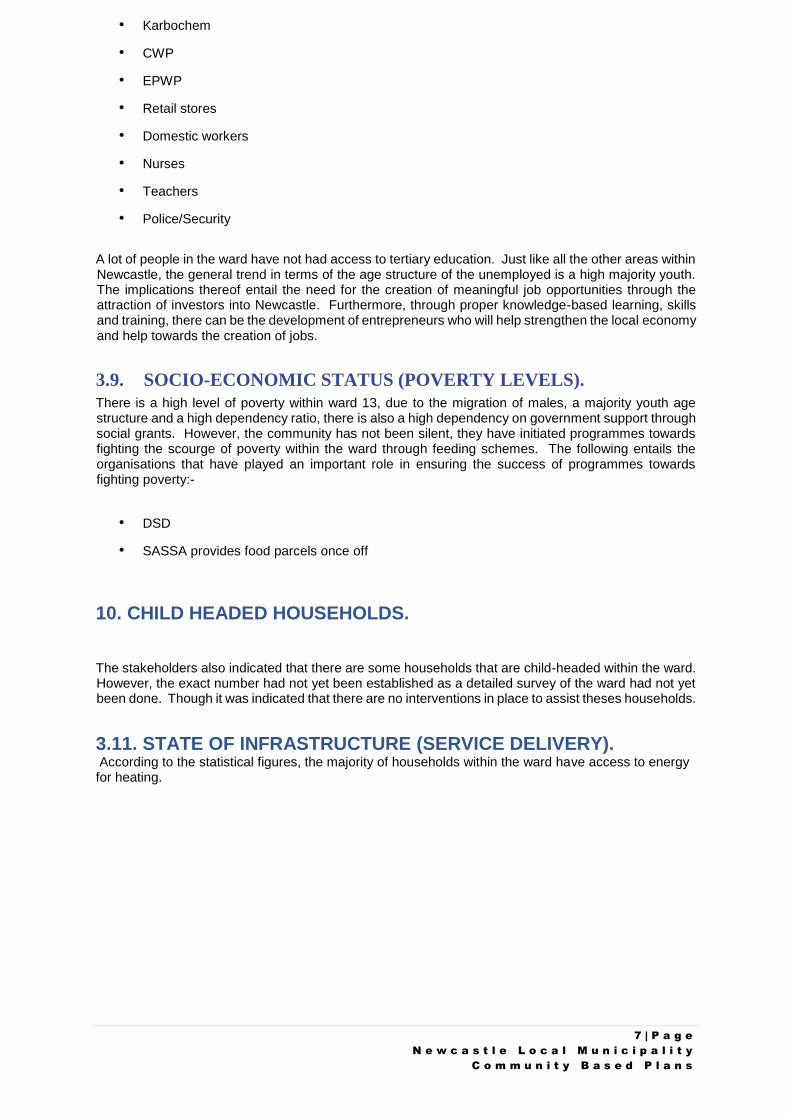
3.11. STATE OF INFRASTRUCTURE (SERVICE DELIVERY). According to the statistical figures, the majority of households within the ward have access to energy for heating.
8 | P a g e
N e w c a s t l e L o c a l M u n i c i p a l i t y
C o m m u n i t y B a s e d P l a n s
ACCESS TO ENERGY FOR HEATING
Electricity Gas
Paraffin Wood Coal Animal dung
Solar Other None Unspecified Grand Total
1259 18 27 10 159 - 1 - 217 17 1707
Table 5: Access to energy for heating in ward 13 (Source: 2011 Census Data from Stats SA overlaid onto the 2016 boundaries).
In terms of access to electricity for cooking, statistical figures show that ward 13 has an average number of households with access to electricity for cooking.
ACCESS TO ENERGY FOR COOKING
Electricity Gas Paraffin Wood Coal Animal dung
Solar Other None Unspecified Grand Total
1574 19 37 7 43 - 5 - 5 17 1707
Table 6: Access to energy for cooking in ward 13 (Source: 2011 Census Data from Stats SA overlaid onto the 2016
boundaries).
In terms of access to electricity for lighting, statistical figures show that ward 23 has an average number
of households with access to electricity for lighting in Newcastle.
ACCESS TO ENERGY FOR LIGHTING
Electricity Gas Paraffin Candles Solar Other None Unspecified Grand Total
1650 - 37 160 6 - 5 17 1707
Table 7: Access to energy for lighting in ward 13 (Source: 2011 Census Data from Stats SA overlaid onto the 2016 boundaries).
Stakeholders indicated that the water in ward 13 is often closed without notice, however, the majority of the households in ward 13 have access to adequate potable water which can be obtained anywhere within a radius of 200 metres from the main dwelling. This is inclusive of water obtained inside the dwelling, water obtained inside the yard, and water obtained inside a community stand. In terms of access to electricity for lighting, statistical figures show that ward 13 has an average number of households with access to electricity for lighting.
ACCESS TO WATER
Piped (tap) water inside the dwelling
Piped (tap) water inside
the yard
Piped (tap) water on
community stand:
distance less than
200m from dwelling
Piped (tap) water
to communit y stand: distance less than 200m and 500m from dwelling
Piped (tap) water to
community y stand: distance less than 500m and
1000m from
dwelling
Piped (tap) water on
community y stand: distance greater
than 1000m (1 km) from dwelling
No access to piped
(tap) water
Unspecified Grand Total
861 765 52 8 1 - 4 17 1707
Table 8: Access to potable water in ward 13 (Source: 2011 Census Data from Stats SA overlaid onto the 2016 boundaries).
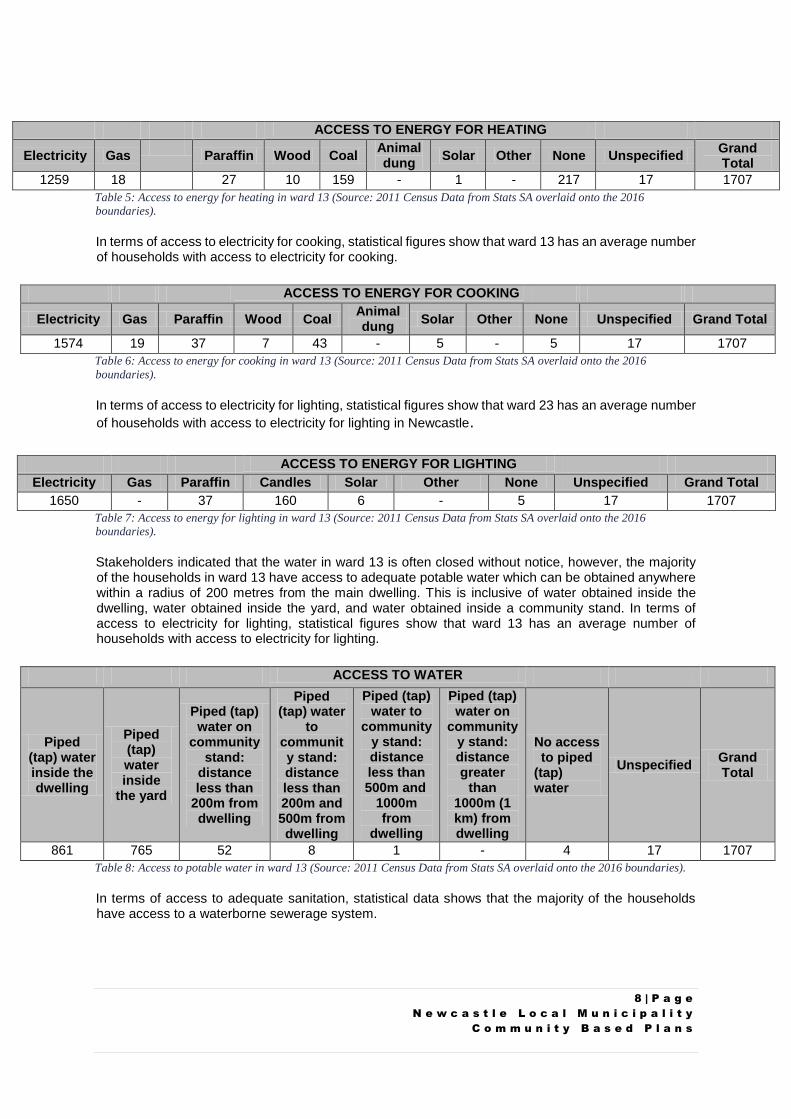
In terms of access to adequate sanitation, statistical data shows that the majority of the households have access to a waterborne sewerage system.
9 | P a g e
N e w c a s t l e L o c a l M u n i c i p a l i t y
C o m m u n i t y B a s e d P l a n s
ACCESS TO SANITATION
None
Flush toilet (connected
to sewerage system)
Flush toilet (with
septic tank)
Chemical toilet
Pit latrine with
ventilation (VIP)
Pit latrine without
ventilation
Bucket latrine
Other Unspecified Grand Total
7 1506 1 6 5 148 10 7 17 1707
Table 9: Access to adequate sanitation in ward 13 (Source: 2011 Census Data from Stats SA overlaid onto the 2016 boundaries).
In terms of access to refuse removal, according to the statistical figures, a very high majority of the households within ward 13 are receiving refuse removal services from the Newcastle Local Municipality at a rate of one collection per week. However, the stakeholders indicated that the refuse bags are not enough.
ACCESS TO REFUSE REMOVAL SERVICES
Removed by local authority at least once a week
Removed by local
authority less often
Communal refuse dump
Own refuse dump
No rubbish disposal
Other Unspecified Grand Total
1527 4 - 36 124 - 17 1707
Table 10: Access to refuse removal services in ward 13 (Source: 2011 Census Data from Stats SA overlaid onto the 2016 boundaries).
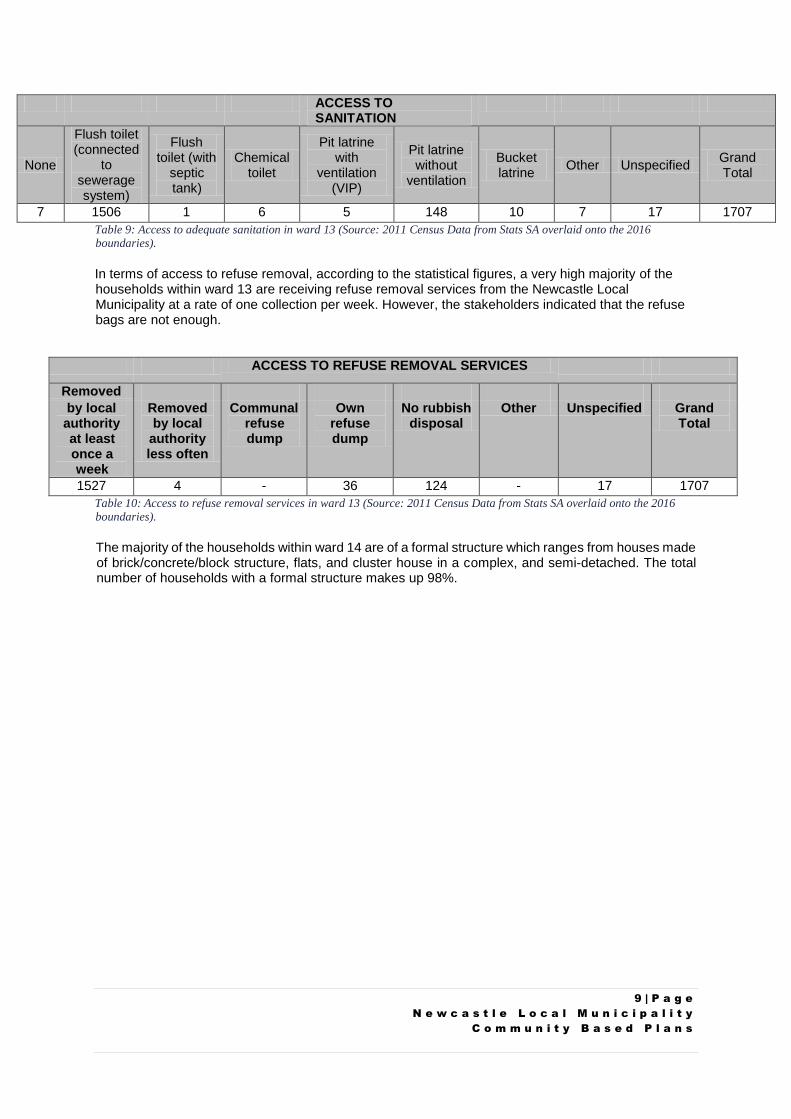
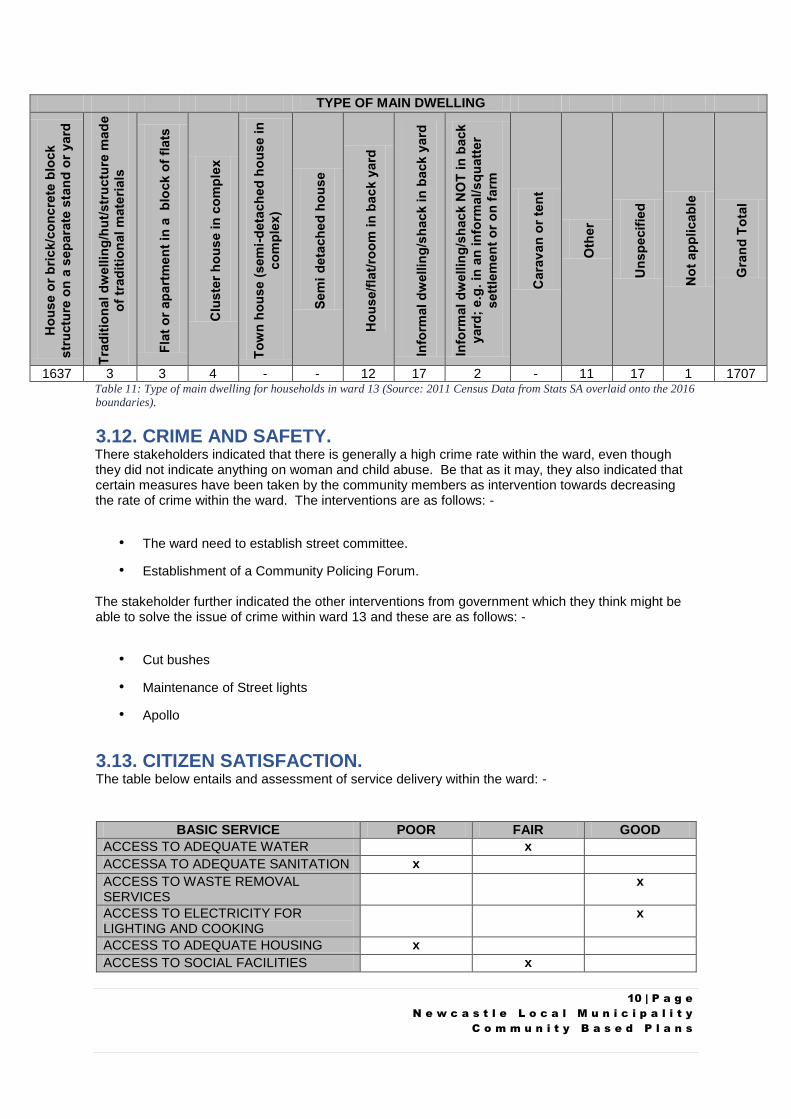
The majority of the households within ward 14 are of a formal structure which ranges from houses made of brick/concrete/block structure, flats, and cluster house in a complex, and semi-detached. The total number of households with a formal structure makes up 98%.
10 | P a g e
N e w c a s t l e L o c a l M u n i c i p a l i t y
C o m m u n i t y B a s e d P l a n s
TYPE OF MAIN DWELLING
1637 3 3 4 - - 12 17 2 - 11 17 1 1707 Table 11: Type of main dwelling for households in ward 13 (Source: 2011 Census Data from Stats SA overlaid onto the 2016 boundaries).
3.12. CRIME AND SAFETY. There stakeholders indicated that there is generally a high crime rate within the ward, even though they did not indicate anything on woman and child abuse. Be that as it may, they also indicated that certain measures have been taken by the community members as intervention towards decreasing the rate of crime within the ward. The interventions are as follows: -
• The ward need to establish street committee.
• Establishment of a Community Policing Forum.
The stakeholder further indicated the other interventions from government which they think might be able to solve the issue of crime within ward 13 and these are as follows: -
• Cut bushes
• Maintenance of Street lights
• Apollo
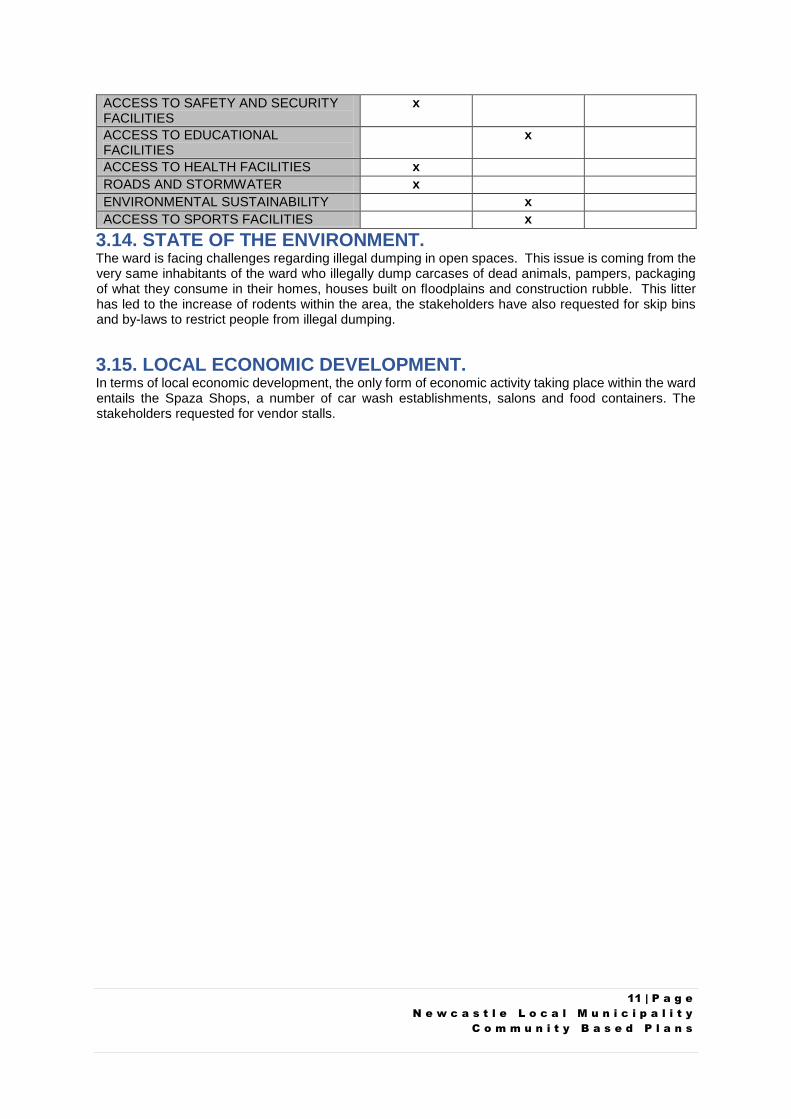
3.13. CITIZEN SATISFACTION. The table below entails and assessment of service delivery within the ward: -
BASIC SERVICE POOR FAIR GOOD
ACCESS TO ADEQUATE WATER x ACCESSA TO ADEQUATE SANITATION x ACCESS TO WASTE REMOVAL SERVICES
x
ACCESS TO ELECTRICITY FOR LIGHTING AND COOKING
x
ACCESS TO ADEQUATE HOUSING x ACCESS TO SOCIAL FACILITIES x
11 | P a g e
N e w c a s t l e L o c a l M u n i c i p a l i t y
C o m m u n i t y B a s e d P l a n s
ACCESS TO SAFETY AND SECURITY FACILITIES
x
ACCESS TO EDUCATIONAL FACILITIES
x
ACCESS TO HEALTH FACILITIES x ROADS AND STORMWATER x ENVIRONMENTAL SUSTAINABILITY x ACCESS TO SPORTS FACILITIES x
3.14. STATE OF THE ENVIRONMENT. The ward is facing challenges regarding illegal dumping in open spaces. This issue is coming from the very same inhabitants of the ward who illegally dump carcases of dead animals, pampers, packaging of what they consume in their homes, houses built on floodplains and construction rubble. This litter has led to the increase of rodents within the area, the stakeholders have also requested for skip bins and by-laws to restrict people from illegal dumping.
3.15. LOCAL ECONOMIC DEVELOPMENT. In terms of local economic development, the only form of economic activity taking place within the ward entails the Spaza Shops, a number of car wash establishments, salons and food containers. The stakeholders requested for vendor stalls.
12 | P a g e
N e w c a s t l e L o c a l M u n i c i p a l i t y
C o m m u n i t y B a s e d P l a n s
3.16. SPORTS, ARTS AND CULTURE.
The quality of the sporting facility available within ward 13 is very bad. The stakeholders requested for more sporting facilities for other sports because there is one sport facility which is the soccer field.
3.17. RELIGIOUS FACILITIES The following entails a list of the religious facilities existing within ward 14, some occupying open spaces:-
• Christian Church
• Methodist Church
• Nkosinathi
• PAC
• Blue Heaven
3.18. SOCIO-ECONOMIC FACILITIES. In terms of the facilities promoting socio-economic activities and development thereof, the stakeholders indicated that there were none in ward, the stakeholders us the community hall and the library in ward 13. The following entails the socio-economic facilities which they require:-
• Community hall.
• Library.
• Shopping Mall.
• Multipurpose sporting centre.
• Skills incubation centre for the youth.
3.19. LAND USE MANAGEMENT (INCLUDING SPATIAL TRENDS AND PATTERNS). The following entails the predominant land uses with ward 14:-
• Most land is used as residential area
• Spaza shop
• Church use
• Vacant sites for illegal dumping
•
3.20. AGRICULTURAL ACTIVITY (INCLUDING GRAZING).
To a certain extent, there is some form of agricultural activity taking place within the ward. There is one (1) communal garden in the school property and there are owners of cattle. The only issue regarding the cattle is that they roam around and end up feeding on the garden of the locals.
3.21. LAND TENURE/OWNERSHIP. The stakeholders indicated that there is no issue with security with security of tenure.
13 | P a g e
N e w c a s t l e L o c a l M u n i c i p a l i t y
C o m m u n i t y B a s e d P l a n s
3.22. CLIMATE CHANGE (NATURAL DISASTER WITHIN THE LAST 30 YEARS). The ward was affected by severe floods that affected the housing. The stakeholder raised their discomfort in relation the absence of any form of intervention to repair the storm damaged houses.
3.23. DISABILITY PROFILE. There are some people who may be regarded as being disabled. Some of them were born that way, and some of them faced accidents in their life which led to them being disabled. But the biggest concern for the stakeholders were the individuals who were using wheelchairs. They assert that it’s hard for them to move around the ward as the level of infrastructure is not conducive for the disabled. For instance there are poor quality roads and there are no sidewalks to aid their mobility. The stakeholders mentioned that the disabled people end up using the ward 30 disability facilities.
3.24. IMMIGRATION PROFILE. It was indicated that the ward has foreigners residing in the area, and they are the ones’ running business establishments within the ward, more specifically the tuck shops. It is presumed that the foreigners are coming either from Somalian, Chinese, Ethiopians and Zimbabweans.
3.25. STATE OF GOVERNANCE INCLUDING (TRADITIONAL LEADERS) There are no issues whatsoever with the state of governance in ward 13.
3.26. PUBLIC PARTICIPATION IN MUNICIPAL AFFAIRS (INCLUDING MECHANISMS). The stakeholders indicated that public participation in municipal affairs was not a challenge at all. The also indicated that the structure on the ground mandated to bring government closer to the people were fully functional and these included the following:-
• The Ward Councilor.
• The Ward Committee.
• Izinduna for traditional leadership.
• The War Room.
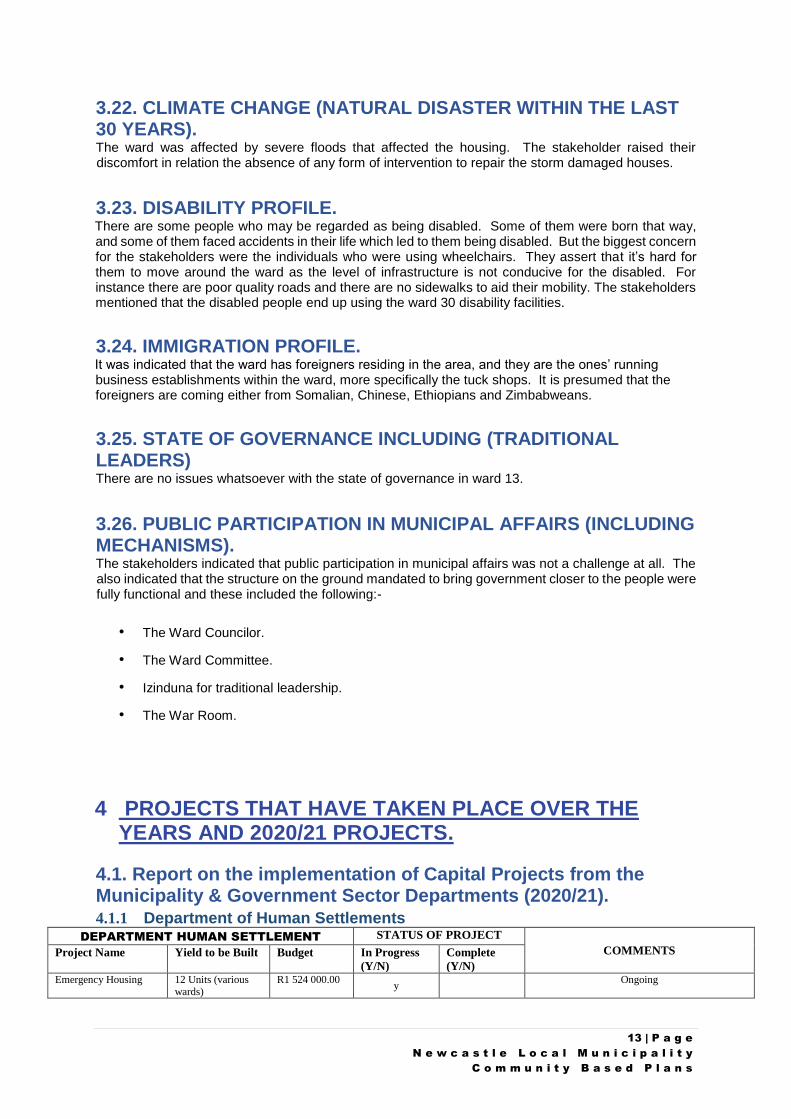
4 PROJECTS THAT HAVE TAKEN PLACE OVER THE YEARS AND 2020/21 PROJECTS.
4.1. Report on the implementation of Capital Projects from the Municipality & Government Sector Departments (2020/21). 4.1.1 Department of Human Settlements
DEPARTMENT HUMAN SETTLEMENT STATUS OF PROJECT
COMMENTS Project Name Yield to be Built Budget In Progress
(Y/N)
Complete
(Y/N) Emergency Housing 12 Units (various
wards) R1 524 000.00
y Ongoing
14 | P a g e
N e w c a s t l e L o c a l M u n i c i p a l i t y
C o m m u n i t y B a s e d P l a n s
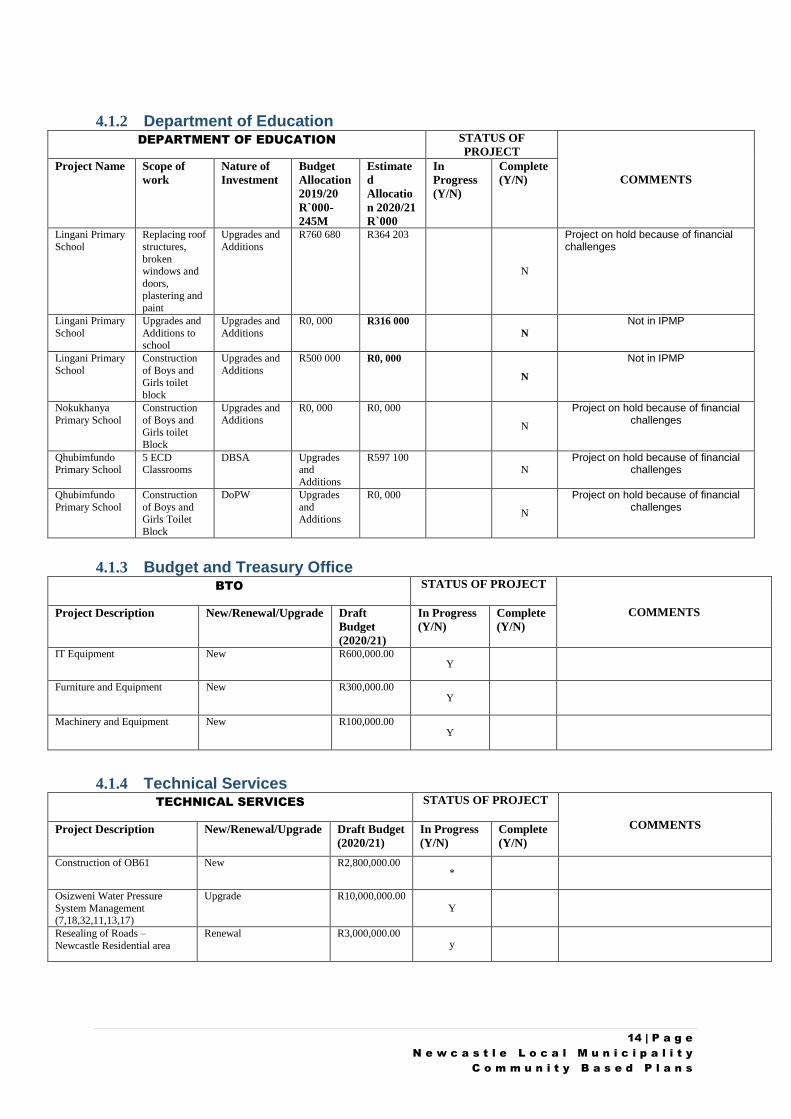
4.1.2 Department of Education DEPARTMENT OF EDUCATION STATUS OF
PROJECT
COMMENTS
Project Name Scope of
work
Nature of
Investment
Budget
Allocation
2019/20
R`000-
245M
Estimate
d
Allocatio
n 2020/21
R`000
In
Progress
(Y/N)
Complete
(Y/N)
Lingani Primary
School
Replacing roof
structures,
broken windows and
doors, plastering and
paint
Upgrades and
Additions
R760 680
R364 203
N
Project on hold because of financial challenges
Lingani Primary
School
Upgrades and
Additions to school
Upgrades and
Additions
R0, 000 R316 000
N
Not in IPMP
Lingani Primary
School
Construction
of Boys and
Girls toilet
block
Upgrades and
Additions
R500 000 R0, 000
N
Not in IPMP
Nokukhanya
Primary School
Construction
of Boys and Girls toilet
Block
Upgrades and
Additions
R0, 000 R0, 000
N
Project on hold because of financial challenges
Qhubimfundo Primary School
5 ECD Classrooms
DBSA Upgrades and
Additions
R597 100 N
Project on hold because of financial challenges
Qhubimfundo
Primary School
Construction
of Boys and Girls Toilet
Block
DoPW Upgrades
and Additions
R0, 000
N
Project on hold because of financial challenges
4.1.3 Budget and Treasury Office BTO STATUS OF PROJECT
COMMENTS Project Description New/Renewal/Upgrade Draft
Budget
(2020/21)
In Progress
(Y/N)
Complete
(Y/N)
IT Equipment New R600,000.00 Y
Furniture and Equipment New R300,000.00 Y
Machinery and Equipment New R100,000.00 Y
4.1.4 Technical Services TECHNICAL SERVICES STATUS OF PROJECT
COMMENTS Project Description New/Renewal/Upgrade Draft Budget
(2020/21)
In Progress
(Y/N)
Complete
(Y/N)
Construction of OB61 New R2,800,000.00 *
Osizweni Water Pressure
System Management (7,18,32,11,13,17)
Upgrade R10,000,000.00
Y
Resealing of Roads –
Newcastle Residential area
Renewal R3,000,000.00 y
15 | P a g e
N e w c a s t l e L o c a l M u n i c i p a l i t y
C o m m u n i t y B a s e d P l a n s
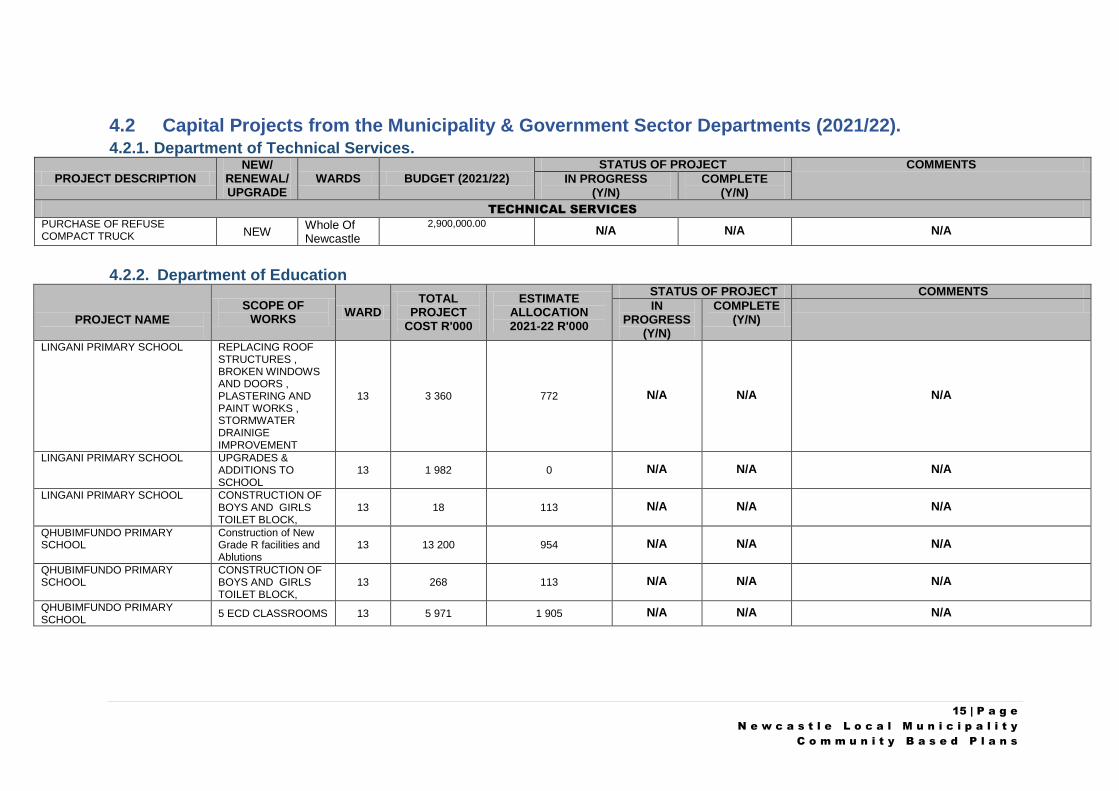
4.2 Capital Projects from the Municipality & Government Sector Departments (2021/22). 4.2.1. Department of Technical Services.
PROJECT DESCRIPTION NEW/
RENEWAL/ UPGRADE
WARDS BUDGET (2021/22)
STATUS OF PROJECT COMMENTS
IN PROGRESS (Y/N)
COMPLETE (Y/N)
TECHNICAL SERVICES
PURCHASE OF REFUSE COMPACT TRUCK NEW
Whole Of Newcastle
2,900,000.00 N/A N/A N/A
4.2.2. Department of Education
PROJECT NAME
SCOPE OF WORKS
WARD TOTAL
PROJECT COST R'000
ESTIMATE ALLOCATION 2021-22 R'000
STATUS OF PROJECT COMMENTS
IN PROGRESS
(Y/N)
COMPLETE (Y/N)
LINGANI PRIMARY SCHOOL REPLACING ROOF STRUCTURES , BROKEN WINDOWS AND DOORS , PLASTERING AND PAINT WORKS , STORMWATER DRAINIGE IMPROVEMENT
13 3 360 772 N/A N/A N/A
LINGANI PRIMARY SCHOOL UPGRADES & ADDITIONS TO SCHOOL
13 1 982 0 N/A N/A N/A
LINGANI PRIMARY SCHOOL CONSTRUCTION OF BOYS AND GIRLS TOILET BLOCK,
13 18 113 N/A N/A N/A
QHUBIMFUNDO PRIMARY SCHOOL
Construction of New Grade R facilities and Ablutions
13 13 200 954 N/A N/A N/A
QHUBIMFUNDO PRIMARY SCHOOL
CONSTRUCTION OF BOYS AND GIRLS TOILET BLOCK,
13 268 113 N/A N/A N/A
QHUBIMFUNDO PRIMARY SCHOOL
5 ECD CLASSROOMS 13 5 971 1 905 N/A N/A N/A
16 | P a g e
N e w c a s t l e L o c a l M u n i c i p a l i t y
C o m m u n i t y B a s e d P l a n s
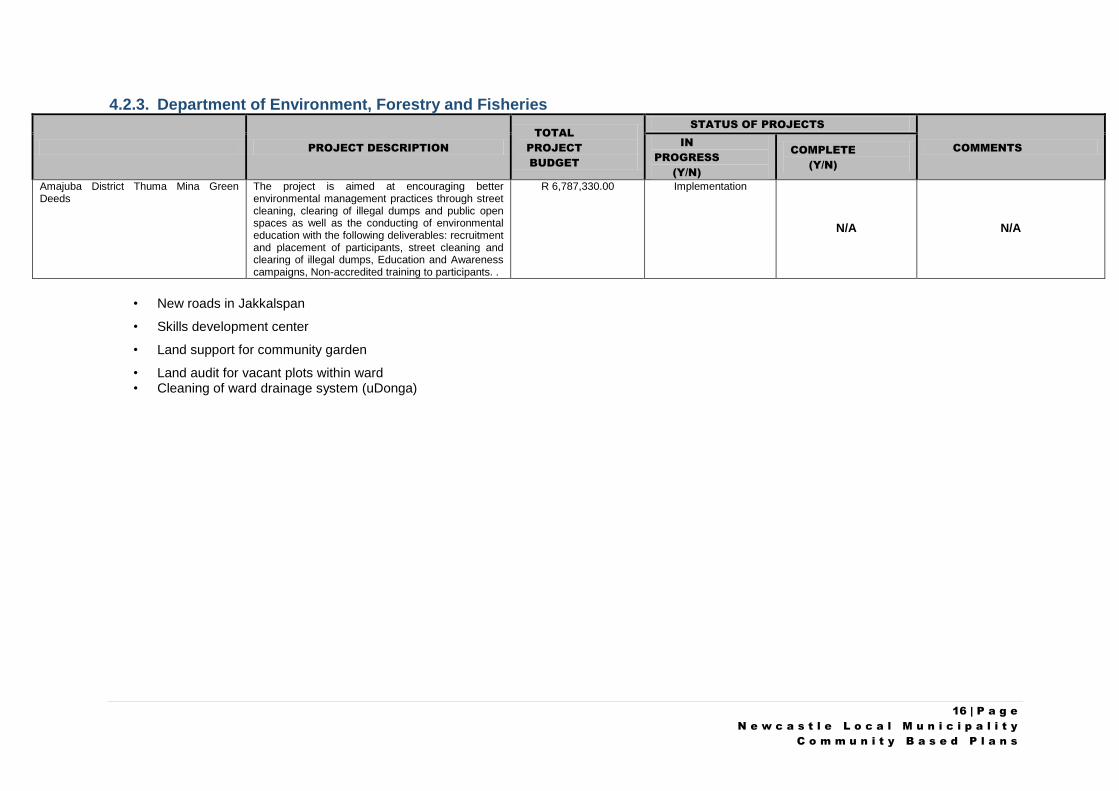
4.2.3. Department of Environment, Forestry and Fisheries
PROJECT DESCRIPTION
TOTAL
PROJECT
BUDGET
STATUS OF PROJECTS
COMMENTS IN
PROGRESS
(Y/N)
COMPLETE
(Y/N)
Amajuba District Thuma Mina Green Deeds
The project is aimed at encouraging better environmental management practices through street cleaning, clearing of illegal dumps and public open spaces as well as the conducting of environmental education with the following deliverables: recruitment and placement of participants, street cleaning and clearing of illegal dumps, Education and Awareness campaigns, Non-accredited training to participants. .
R 6,787,330.00 Implementation
N/A N/A
• New roads in Jakkalspan
• Skills development center
• Land support for community garden
• Land audit for vacant plots within ward • Cleaning of ward drainage system (uDonga)
17 | P a g e
N e w c a s t l e L o c a l M u n i c i p a l i t y
C o m m u n i t y B a s e d P l a n s
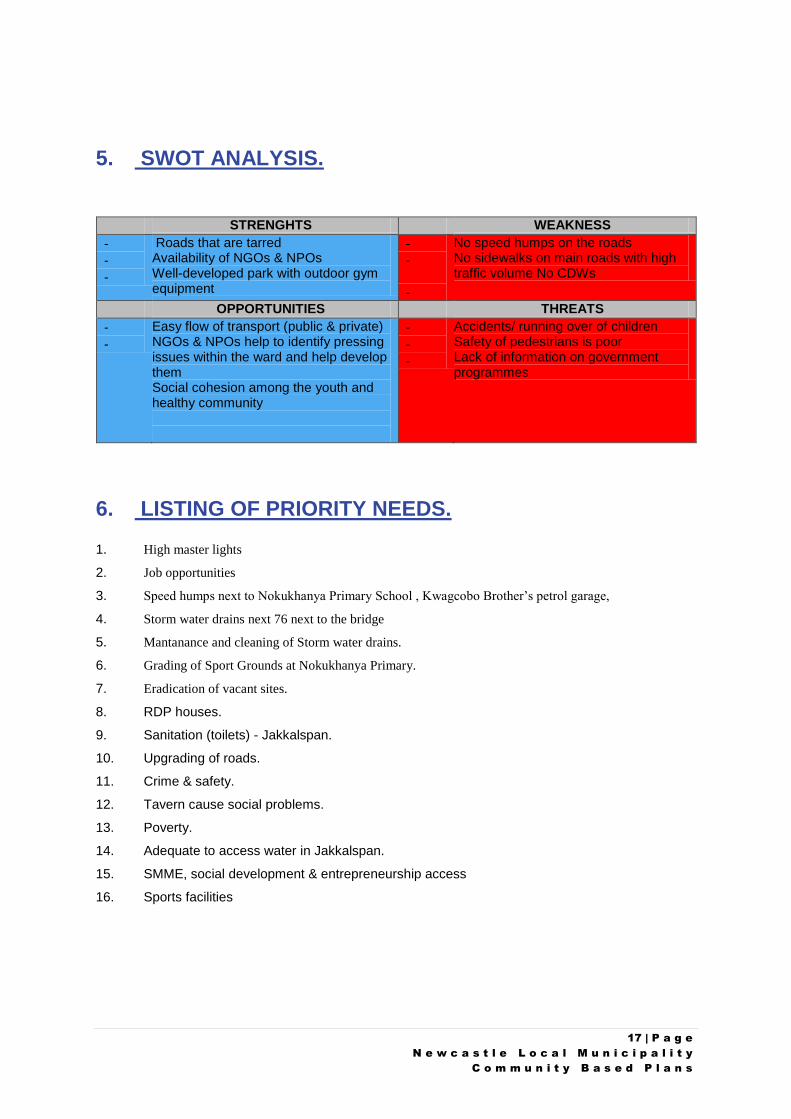
5. SWOT ANALYSIS.
STRENGHTS WEAKNESS
-
-
-
Roads that are tarred Availability of NGOs & NPOs Well-developed park with outdoor gym equipment
- -
-
No speed humps on the roads No sidewalks on main roads with high traffic volume No CDWs
OPPORTUNITIES THREATS
-
-
Easy flow of transport (public & private) NGOs & NPOs help to identify pressing issues within the ward and help develop them Social cohesion among the youth and healthy community
-
-
-
Accidents/ running over of children Safety of pedestrians is poor Lack of information on government programmes
6. LISTING OF PRIORITY NEEDS.
1. High master lights
2. Job opportunities
3. Speed humps next to Nokukhanya Primary School , Kwagcobo Brother’s petrol garage,
4. Storm water drains next 76 next to the bridge
5. Mantanance and cleaning of Storm water drains.
6. Grading of Sport Grounds at Nokukhanya Primary.
7. Eradication of vacant sites.
8. RDP houses.
9. Sanitation (toilets) - Jakkalspan.
10. Upgrading of roads.
11. Crime & safety.
12. Tavern cause social problems.
13. Poverty.
14. Adequate to access water in Jakkalspan.
15. SMME, social development & entrepreneurship access
16. Sports facilities
18 | P a g e
N e w c a s t l e L o c a l M u n i c i p a l i t y
C o m m u n i t y B a s e d P l a n s
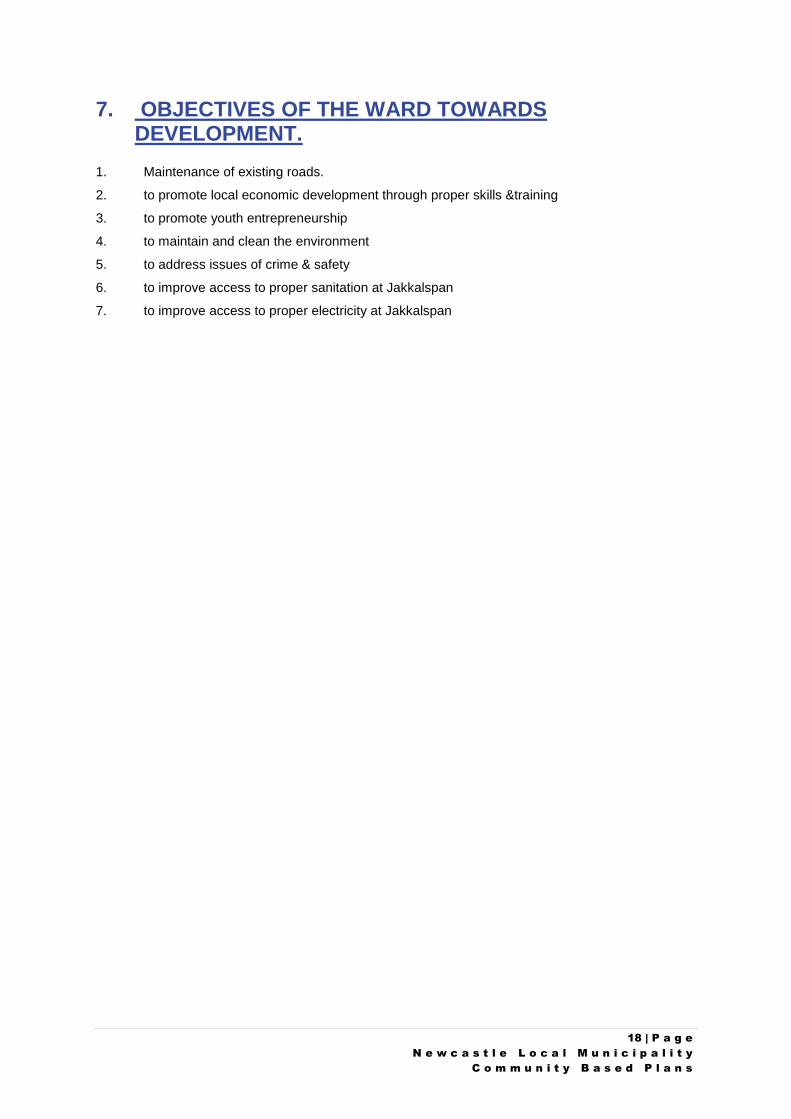
7. OBJECTIVES OF THE WARD TOWARDS DEVELOPMENT.
1. Maintenance of existing roads.
2. to promote local economic development through proper skills &training
3. to promote youth entrepreneurship
4. to maintain and clean the environment
5. to address issues of crime & safety
6. to improve access to proper sanitation at Jakkalspan
7. to improve access to proper electricity at Jakkalspan

19 | P a g e
N e w c a s t l e L o c a l M u n i c i p a l i t y
C o m m u n i t y B a s e d P l a n s
20 | P a g e
N e w c a s t l e L o c a l M u n i c i p a l i t y
C o m m u n i t y B a s e d P l a n s
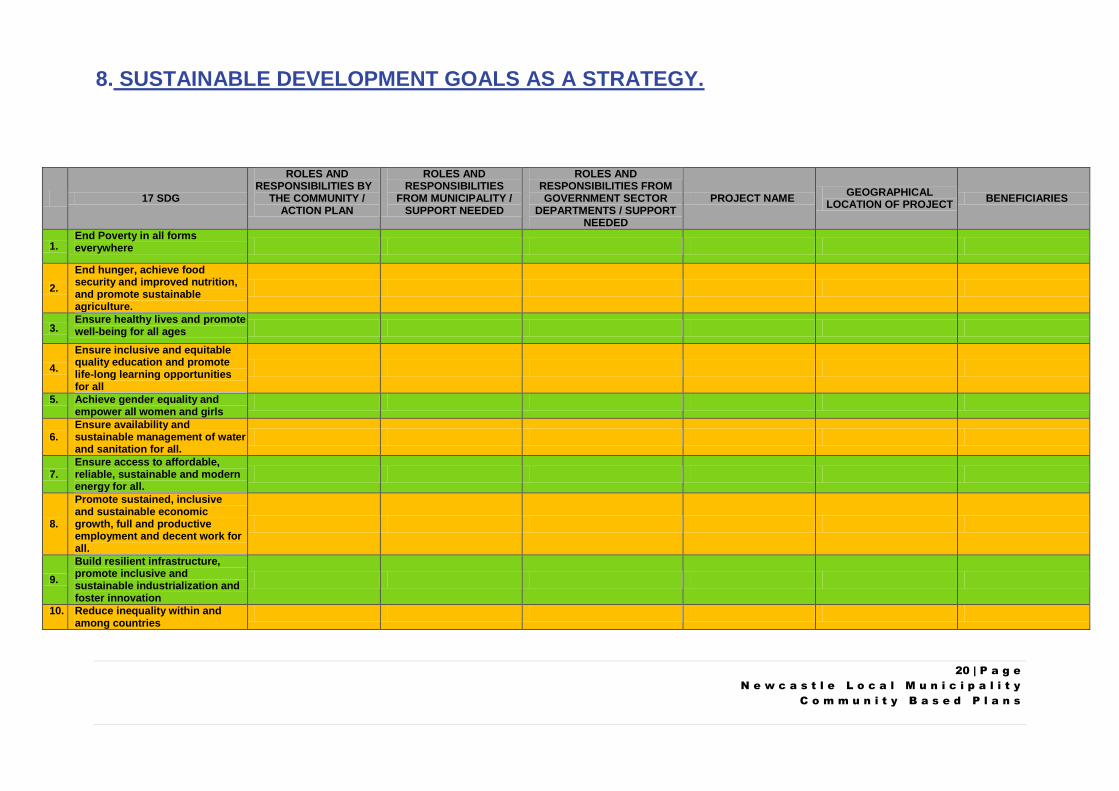
8. SUSTAINABLE DEVELOPMENT GOALS AS A STRATEGY.
17 SDG
ROLES AND RESPONSIBILITIES BY
THE COMMUNITY / ACTION PLAN
ROLES AND RESPONSIBILITIES
FROM MUNICIPALITY / SUPPORT NEEDED
ROLES AND RESPONSIBILITIES FROM GOVERNMENT SECTOR
DEPARTMENTS / SUPPORT NEEDED
PROJECT NAME GEOGRAPHICAL LOCATION OF PROJECT BENEFICIARIES
1. End Poverty in all forms everywhere
2.
End hunger, achieve food security and improved nutrition, and promote sustainable agriculture.
3. Ensure healthy lives and promote well-being for all ages
4.
Ensure inclusive and equitable quality education and promote life-long learning opportunities for all
5. Achieve gender equality and empower all women and girls
6. Ensure availability and sustainable management of water and sanitation for all.
7. Ensure access to affordable, reliable, sustainable and modern energy for all.
8.
Promote sustained, inclusive and sustainable economic growth, full and productive employment and decent work for all.
9.
Build resilient infrastructure, promote inclusive and sustainable industrialization and foster innovation
10. Reduce inequality within and among countries
21 | P a g e
N e w c a s t l e L o c a l M u n i c i p a l i t y
C o m m u n i t y B a s e d P l a n s
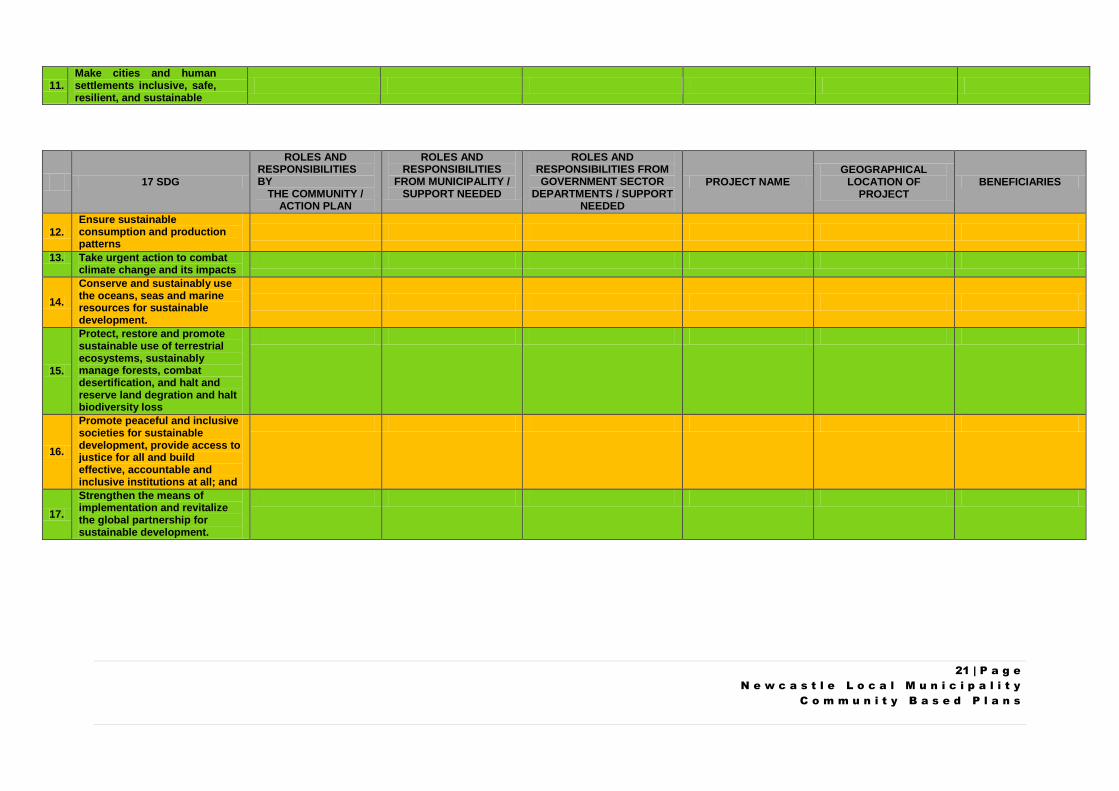
11. Make cities and human settlements inclusive, safe, resilient, and sustainable
17 SDG
ROLES AND RESPONSIBILITIES BY
THE COMMUNITY / ACTION PLAN
ROLES AND RESPONSIBILITIES
FROM MUNICIPALITY / SUPPORT NEEDED
ROLES AND RESPONSIBILITIES FROM GOVERNMENT SECTOR
DEPARTMENTS / SUPPORT NEEDED
PROJECT NAME GEOGRAPHICAL
LOCATION OF PROJECT
BENEFICIARIES
12. Ensure sustainable consumption and production patterns
13. Take urgent action to combat climate change and its impacts
14.
Conserve and sustainably use the oceans, seas and marine resources for sustainable development.
15.
Protect, restore and promote sustainable use of terrestrial ecosystems, sustainably manage forests, combat desertification, and halt and reserve land degration and halt biodiversity loss
16.
Promote peaceful and inclusive societies for sustainable development, provide access to justice for all and build effective, accountable and inclusive institutions at all; and
17.
Strengthen the means of implementation and revitalize the global partnership for sustainable development.
‘’By 2035 Newcastle will be a resilient and economically vibrant city, promoting service
excellence to its citizens’’
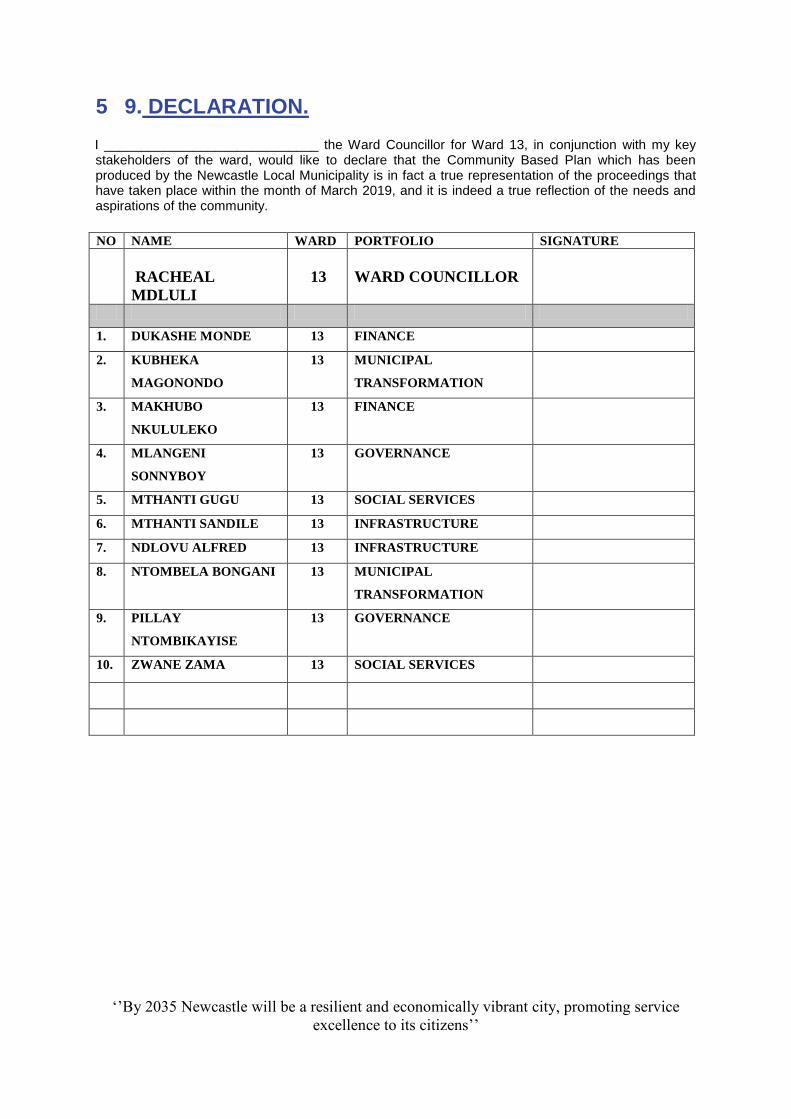
5 9. DECLARATION.
I _____________________________ the Ward Councillor for Ward 13, in conjunction with my key stakeholders of the ward, would like to declare that the Community Based Plan which has been produced by the Newcastle Local Municipality is in fact a true representation of the proceedings that have taken place within the month of March 2019, and it is indeed a true reflection of the needs and aspirations of the community.
NO NAME WARD PORTFOLIO SIGNATURE
RACHEAL
MDLULI
13
WARD COUNCILLOR
1. DUKASHE MONDE 13 FINANCE
2. KUBHEKA
MAGONONDO
13 MUNICIPAL
TRANSFORMATION
3. MAKHUBO
NKULULEKO
13 FINANCE
4. MLANGENI
SONNYBOY
13 GOVERNANCE
5. MTHANTI GUGU 13 SOCIAL SERVICES
6. MTHANTI SANDILE 13 INFRASTRUCTURE
7. NDLOVU ALFRED 13 INFRASTRUCTURE
8. NTOMBELA BONGANI 13 MUNICIPAL
TRANSFORMATION
9. PILLAY
NTOMBIKAYISE
13 GOVERNANCE
10. ZWANE ZAMA 13 SOCIAL SERVICES