CONTENTS ESSENTIAL NEWBORN CARE: IMMEDIATE ACTIONS NEWBORN …
Baseline Survey Report
Ethiopia, October 2014
Community Based
Newborn Care
2 Community Based Newborn Care baseline survey report
BASELINE SURVEY REPORT
ideas.lshtm.ac.uk
Prepared by the IDEAS project led by Dr Joanna Schellenberg
Funded by the Bill & Melinda Gates Foundation
Supervised by Dr Bilal Avan (IDEAS scientific coordinator)Written by Dr Della Berhanu (IDEAS country coordinator)IDEAS survey coordinators: Della Berhanu (national) and Girmaye Dinsa (regional)JaRco Coordination team: Seifu Tedesse, Nolawi Taddesse, Neil
Lensink, Feker Tadesse, Hana Hailu Mengistu Kefale and Shimljash
Braha
IDEAS data analysis and management team: Elizabeth Allen,
Keith Tomlin and Charles Opondo
IDEAS review team: Joanna Schellenberg, Tanya Marchant,
Deepthi Wickremasinghe and Shirine Voller
Report approved by Ethiopian Ministry of Health: October 2014
Coordination of publication by Agnes Becker
Date first printed: October 2014
Date updated: November 2014
Citation: Berhanu, D. Avan, B. I. (2014) Community Based Newborn Care: Baseline report summary, Ethiopia October 2014.
London: IDEAS, London School of Hygiene & Tropical Medicine.
ISBN number: 978-0-9576833-4-1
Copyright: London School of Hygiene & Tropical Medicine
ideas.lshtm.ac.uk
Acknowledgements: The IDEAS team wishes to acknowledge
the assistance of the Federal Ministry of Health (particularly Hailu Abebe and Dr Helina Kebeke), the CBNC and iCCM Technical Working Group , UNICEF and all those who
collaborated with the study team during fieldwork.
On behalf of the Federal Ministry of Health of Ethiopia, the Baseline Survey of the Community Based Newborn Care (CBNC) programme was conducted by the Informed Decisions for Actions in Maternal and Newborn Health (IDEAS) project, London School of Hygiene & Tropical Medicine.
Cover image caption: Newborn child
at Dessie Referral Hospital in Amhara
region, Ethiopia.
Cover image copyright:
Michael Tsegaye/Save the Children
Community Based Newborn Care baseline survey report 3
BASELINE SURVEY REPORT
ideas.lshtm.ac.uk
Table of Contents
ACRONYMS 4
1. EXECUTIVE SUMMARY 5
2. INTRODUCTION 10
2.1 Maternal and Newborn Health in Ethiopia 10
2.2 Community Based Newborn Care 10
2.3 Organisation of baseline survey report 13
3. COMMUNITY BASED NEWBORN CARE EVALUATION 14
3.1 Objective 14
3.2 CBNC baseline survey 14
3.3 Methodology 14
4. RESULTS: HEALTH SYSTEM STATUS 20
4.1 Health Centre 21
4.2 Health Post 29
4.3 Health Extension Worker 36
4.4 Health Development Army 49
5. RESULTS: HOUSEHOLD COVERAGE SURVEY 54
5.1 Sample selection 54
5.2 Characteristics of the women interviewed 55
5.3 ANC period 56
5.4 Childbirth period 62
5.5 Postpartum period (maternal assessment) 66
5.6 Neonatal care (newborn assessment) 68
5.7 Management of neonatal illness 72
6. DISCUSSION 74
Limitations 76
Conclusion and recommendations 77
Next steps in the evaluation plan 77
ANNEXES 78
Annex I - Brief summary of CBNC survey by intervention and comparison areas 78
Annex II - Health facility survey by intervention-comparison areas 80• Annex 4.1 Health Centre 80• Annex 4.2 Health Post 84• Annex 4.3 Health Extension Worker 88• Annex 4.4 Health Development Army 96
Annex III - Household Survey 98
4 Community Based Newborn Care baseline survey report
BASELINE SURVEY REPORT
ideas.lshtm.ac.uk
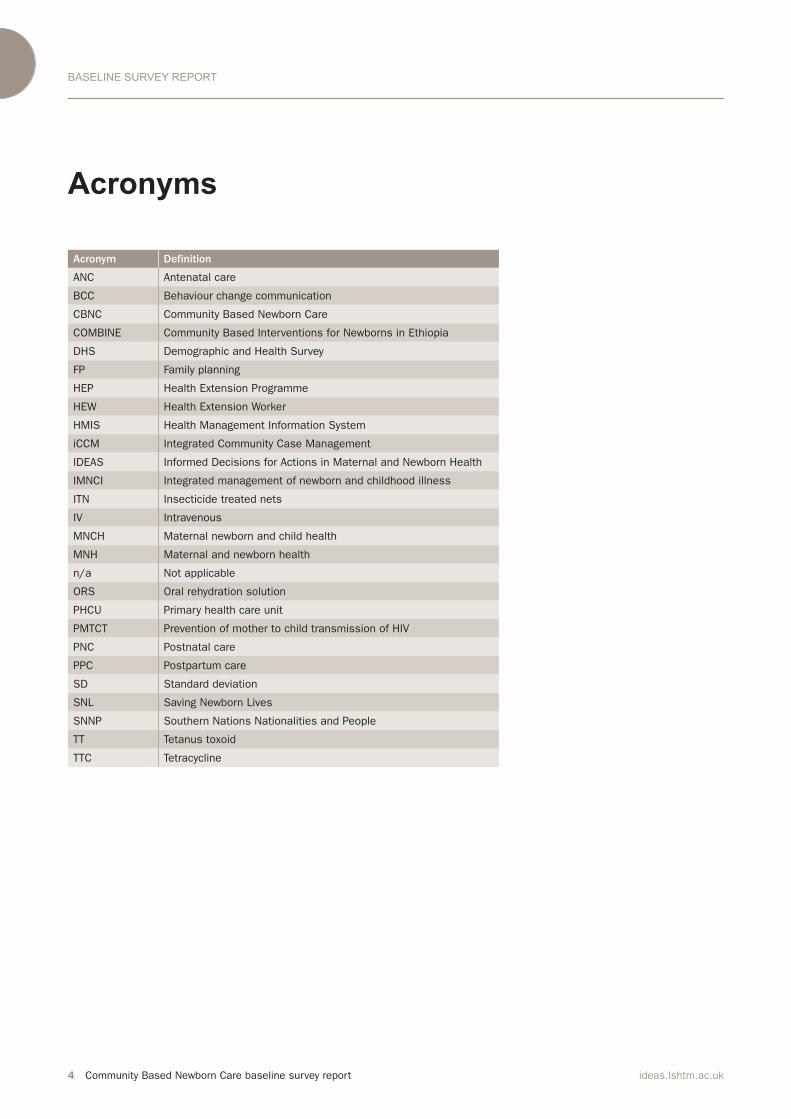
Acronyms
Acronym Definition
ANC Antenatal care
BCC Behaviour change communication
CBNC Community Based Newborn Care
COMBINE Community Based Interventions for Newborns in Ethiopia
DHS Demographic and Health Survey
FP Family planning
HEP Health Extension Programme
HEW Health Extension Worker
HMIS Health Management Information System
iCCM Integrated Community Case Management
IDEAS Informed Decisions for Actions in Maternal and Newborn Health
IMNCI Integrated management of newborn and childhood illness
ITN Insecticide treated nets
IV Intravenous
MNCH Maternal newborn and child health
MNH Maternal and newborn health
n/a Not applicable
ORS Oral rehydration solution
PHCU Primary health care unit
PMTCT Prevention of mother to child transmission of HIV
PNC Postnatal care
PPC Postpartum care
SD Standard deviation
SNL Saving Newborn Lives
SNNP Southern Nations Nationalities and People
TT Tetanus toxoid
TTC Tetracycline

Community Based Newborn Care baseline survey report 5ideas.lshtm.ac.uk
EXECUTIVE SUMMARY
1. Executive summary
Phase 1 of CBNC implementation was officially launched in Ethiopia in March 2013 and field staff training was completed in August 2014. CBNC
implementation included all Primary
Health Care Units1 (PHCUs) in seven selected zones (92 woredas) of the country.
The London School of Hygiene &
Tropical Medicine has been
commissioned by the Ethiopian
Ministry of Health to lead the Phase 1
evaluation, through the IDEAS
(Informed Decisions for Actions in Maternal and Newborn Health) project. IDEAS is funded by the Bill & Melinda
Gates Foundation and works in
Ethiopia with its country level partner
JaRco Consulting, an Ethiopia-based
research consulting agency.
The objective of the CBNC Phase 1
evaluation is to gather, analyse and
synthesise evidence to determine
whether and how community based
newborn care in four regions of
Ethiopia leads to increased coverage of
critical interventions along the
continuum of care. The evaluation
design of Phase 1 includes before-and-
after coverage surveys of the critical
maternal and newborn health
interventions in intervention and
comparison areas.2 CBNC Phase 1
evaluation also includes a midline
survey to examine supply-side factors
at PHCU level; qualitative work to
understand implementation processes;
and tracking of contextual factors.
IDEAS began the groundwork for the
CBNC Phase 1 evaluation in mid-2013.
The baseline survey was conducted in
the fourth quarter of 2013 and the
overall evaluation is expected to be
completed by 2016. The end-line
survey is planned to take place
approximately a year-and-half after the
start of CBNC implementation.
The CBNC baseline survey was
conducted in 12 zones across the four
main regions of Ethiopia - Amhara,
Oromia, SNNP and Tigray. Data were
collected over the course of six weeks
from October-November 2013. Overall,
the sampling procedure for the
baseline survey resulted in a
representative sample of PHCUs in the
selected zones. However, the zones
included in the study are not a
Community Based Newborn Care (CBNC) in Ethiopia is a national programme that aims to improve newborn survival through the Health Extension Programme (HEP). Photo: Girls near Zuqualla, Ethiopia
© Dr Neil Spicer
1. The Primary Health Care Unit consists of a
health centre together with the surrounding
satellite health posts.
2. Comparison areas were selected from
zones where CBNC roll-out is planned to be as
late as possible. Our evaluation will compare
changes from the baseline in Phase 1 areas
with changes from the baseline in late-Phase
2 areas.
6 Community Based Newborn Care baseline survey report ideas.lshtm.ac.uk
EXECUTIVE SUMMARY
representative sample of the four
regions. The baseline survey included seven CBNC implementation and five comparison zones. Selection of
comparison zones was done based on
the Ministry of Health’s
recommendation, with the
understanding that CBNC
implementation in these zones is likely
to take place after the end-line survey
has been conducted. Since the baseline
survey, CBNC implementation has
started in the seven intervention zones
and implementation in the remaining
comparison zones is scheduled to take
place as part of Phase 2.
The sample size calculations for the
household survey were based on
detecting a change in the coverage of
key interventions over the time of the
study that can be attributed to the
CBNC package. The proposed sample
size of 10,450 households will allow us
to detect differences in coverage rates
of at least 10 percentage points in key
interventions, including antenatal care (ANC), skilled birth attendance and postnatal care (PNC), with 80% power, 5% significance and assuming a design
effect of 1.4 and 90% completeness.This report presents the findings from the baseline survey. The primary
presentation of the results is by region,
which was recommended by the CBNC
and iCCM Technical Working Group
after the completion of the survey.
Regional presentation highlights the
baseline distribution of key indicators
in the four regions, which can allow
CBNC programme implementers to
identify strengths and gaps, and direct
their implementation efforts
accordingly. However, caution should
be taken when making comparisons
between regions and with national
statistics, as this study was powered
for analysing differences between
intervention and comparison areas
only. These results are shown in
Annexes II and III.
In this report we provide an executive summary (Chapter 1) and an introduction (Chapter 2), which provides a brief background on the
status of maternal and newborn health (MNH) in Ethiopia and introduces the CBNC programme. An overview of the
CBNC evaluation, with a focus on the
baseline survey and survey
methodology, is provided in Chapter 3.
In Chapters 4 and 5 we present results
from the health system and household
surveys, respectively. A discussion of
the results and limitations of the study
are detailed in Chapter 6. A brief
summary of the study by intervention
and comparison areas is provided in
Annex I. Detailed results from the
health system and household surveys
in these two arms are shown in
Annexes II and III, respectively.
The status of the health system is
presented in Chapter 4. During this
survey, 206 PHCUs were visited. In
each PHCU, the health centre and one
randomly selected health post were
Since the baseline survey, CBNC implementation has started
in the seven intervention zones and implementation in the
remaining comparison zones is scheduled to take place as
part of Phase 2.”
Community Based Newborn Care baseline survey report 7ideas.lshtm.ac.uk
EXECUTIVE SUMMARY
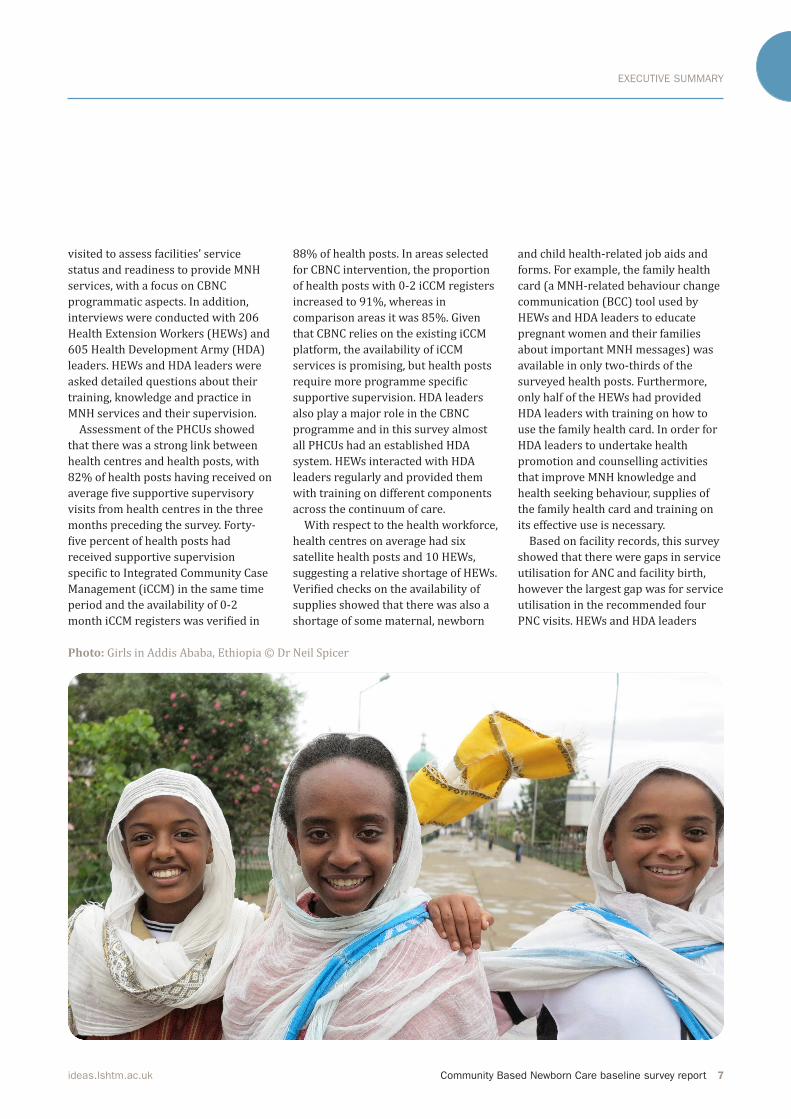
Photo: Girls in Addis Ababa, Ethiopia © Dr Neil Spicer
visited to assess facilities’ service
status and readiness to provide MNH
services, with a focus on CBNC
programmatic aspects. In addition,
interviews were conducted with 206 Health Extension Workers (HEWs) and 605 Health Development Army (HDA) leaders. HEWs and HDA leaders were
asked detailed questions about their
training, knowledge and practice in
MNH services and their supervision.
Assessment of the PHCUs showed
that there was a strong link between
health centres and health posts, with 82% of health posts having received on average five supportive supervisory visits from health centres in the three
months preceding the survey. Forty-five percent of health posts had received supportive supervision specific to Integrated Community Case Management (iCCM) in the same time period and the availability of 0-2 month iCCM registers was verified in
88% of health posts. In areas selected for CBNC intervention, the proportion
of health posts with 0-2 iCCM registers increased to 91%, whereas in comparison areas it was 85%. Given that CBNC relies on the existing iCCM
platform, the availability of iCCM
services is promising, but health posts require more programme specific supportive supervision. HDA leaders
also play a major role in the CBNC
programme and in this survey almost
all PHCUs had an established HDA
system. HEWs interacted with HDA
leaders regularly and provided them
with training on different components
across the continuum of care.
With respect to the health workforce,
health centres on average had six
satellite health posts and 10 HEWs,
suggesting a relative shortage of HEWs. Verified checks on the availability of supplies showed that there was also a
shortage of some maternal, newborn
and child health-related job aids and
forms. For example, the family health
card (a MNH-related behaviour change communication (BCC) tool used by HEWs and HDA leaders to educate
pregnant women and their families about important MNH messages) was available in only two-thirds of the
surveyed health posts. Furthermore,
only half of the HEWs had provided
HDA leaders with training on how to
use the family health card. In order for
HDA leaders to undertake health
promotion and counselling activities
that improve MNH knowledge and
health seeking behaviour, supplies of
the family health card and training on
its effective use is necessary.
Based on facility records, this survey
showed that there were gaps in service
utilisation for ANC and facility birth,
however the largest gap was for service
utilisation in the recommended four
PNC visits. HEWs and HDA leaders
8 Community Based Newborn Care baseline survey report ideas.lshtm.ac.uk
EXECUTIVE SUMMARY
need training and support to improve
uptake of home and facility-based PNC
services in the community. Overall, the
CBNC programme can focus on training
HEWs and HDA leaders based on the
gaps in their knowledge, training and practices that have been identified in this survey.
Chapter 5 describes household
intervention coverage levels along the continuum of care, reflecting the different CBNC programme
components. Sampled households were
located within the catchment
population of the surveyed health
centres and health posts. Across 206
clusters, 10,295 household heads were
present and agreed to participate in
this study. Residing in these households
were a total of 10,999 women of reproductive age (15-49 years old), of whom 925 had had a live birth in the
3-15 months preceding the survey.
These women were asked questions
about that birth. In this study, 69% of women had one ANC visit and 39% had four or more visits. Among those that had an ANC visit, 66% sought care at a health centre. Only 29% of women had received an ANC visit in the first trimester. The mean gestational age at the first ANC visit was 16 weeks. Birth preparedness was much higher among
women who had at least one ANC visit.
Among those that had an ANC visit, 23% had attended a pregnant women’s conference, which communicated the
importance of institutional delivery
and birth preparedness. However, PNC
and newborn care were not adequately
addressed. Pregnant women’s
conferences have the potential to be a
platform where important topics
across the continuum of care are
discussed, particularly newborn care
seeking behaviour.
Twenty-three percent of women
delivered in a health facility (a health centre or hospital) and an additional 3% delivered in a health post. The remaining women gave birth at home.
Referrals for complicated deliveries
were low. Furthermore, among women
who delivered at home and were
referred for a complication, few were
able to reach the next level of health
facility. Overall, very few women and
their newborns received postpartum
and postnatal care. These results
indicate that there is a need to
strengthen the HEW and HDA platform
and also address their training gaps to
ensure that they promote and facilitate
facility birth.
There were notable differences in
newborn care practices by place of
delivery. Fewer cases of newborns with a breathing problem were identified among home births, indicating that
breathing problems might not be
recognised by the birth attendant. Dry cord care was reported by 73% of all women. Compared with home
deliveries, a higher percentage of
women who delivered in a facility said
nothing was applied on the newborn’s
These results indicate that there is a need to strengthen the
HEW and HDA platform and also address their training gaps
to ensure that they promote and facilitate facility birth.”

Community Based Newborn Care baseline survey report 9ideas.lshtm.ac.uk
EXECUTIVE SUMMARY
cord (68% vs. 89%). With CBNC, the Ministry of Health is changing the
recommendation from dry cord care to
care with chlorhexidine. Careful
consideration is needed to ensure that
changing the dry cord care
recommendation to cord care with an antiseptic (chlorhexidine) does not increase harmful traditional practices
(e.g. application of butter, oil and ash to the cord). In facility births, 78% of newborns had their bathing delayed
until the second day of life. In contrast, bathing was delayed in only 36% of home births. With respect to
breastfeeding, timing of feeding
initiation and exclusive breastfeeding
during the neonatal period were both
similar by place of delivery. Only 41% of women sought care for newborns with a reported illness. Care
seeking for newborns with severe
infection symptoms and instances
where there was neonatal death were
even lower. This has major implications
for CBNC. The CBNC programme needs
to identify the appropriate training,
support, and demand generation
activities that can allow HEWs and HDA
leaders to have contact with recently
delivered mothers, to provide
education on identifying newborn
danger signs so that they may seek
care. HEWs and HDA leaders also need
access to newborns, so that they can
identify the danger signs and ensure
that sick newborns receive and
complete their treatment.
With respect to intervention and
comparison areas, while there were a few significant differences at the health facility level, the two areas were similar
along a majority of indicators relating
to HEWs and HDA leaders. At the
household level, intervention and
comparison areas were also similar
in key indicators across the continuum
of care.
Overall, this survey presents a
picture of the health system’s readiness
to provide the CBNC programme, as
well as the existing level of coverage of
life-saving behaviours and
interventions for mothers and their
newborns. Currently, there is a good
PHCU linkage which can be further
strengthened by the CBNC programme.
HDA leaders were present in almost all
the clusters visited and were well
linked with the HEWs. At the household
level, two-thirds of women had
received an ANC visit during their
pregnancy. There was an increase in
facility births from past estimates, with
about a quarter of women delivering in
a health facility. Based on the identified gaps from the
facility and household survey findings, below are the overall key
recommendations for Phase 1 areas
of CBNC: • Increase the availability of job aids specifically associated with newborn illness diagnosis and management • Increase coverage of training on the
use of the family health card by HDA
leaders to promote pregnancy care
and newborn health promotion • Focus training of HEWs and HDA leaders on their role definition in promoting facility birth • In addition to promoting facility
delivery, strengthen the referral
system for home births to meet the
needs of delivery complications and
newborn illnesses • Provide carefully crafted messages to
accompany the introduction of cord
care with chlorhexidine• Increase health promotion activities
that can improve the uptake of
postpartum care and PNC (e.g. using
the opportunity of pregnant women’s
conferences to promote PNC and care seeking for sick newborns)• Enhance supervisory support to
ensure the consistent availability of
drugs at health post level• Strengthen record keeping,
particularly as it relates to having
consistent and standardised data on
newborn care.
Overall, this survey
presents a picture of the
health system’s readiness
to provide the CBNC
programme, as well as the
existing level of coverage of
life-saving behaviours and
interventions for mothers
and their newborns.”

INTRODUCTION
10 Community Based Newborn Care baseline survey report ideas.lshtm.ac.uk
2.2 Community Based Newborn
Care
Building on lessons learned from
integrated Community Case
Management of childhood illness (iCCM), the Community Based Newborn Care (CBNC) programme aims to reduce newborn mortality
through strengthening the Primary Health Care Unit (PHCU) approach and the Health Extension Programme (HEP). This goal will be achieved by enhancing linkages between health
centres and health posts and the
performance of Health Extension Workers (HEWs) and the Health Development Army (HDA), to improve antenatal, intrapartum and newborn care through the “four Cs”: (1) prenatal and postnatal Contact with the mother and newborn; (2) Case-identification
of newborns with signs of possible severe bacterial infection; (3) Care, or
treatment that is appropriate and initiated as early as possible; and (4) Completion of a full seven-day course
of appropriate antibiotics. CBNC
implementation involves the scaling-up
of community based maternal and newborn health (MNH) services including:
2. Introduction
Photo: Rural transport, Zuqualla,
Ethiopia © Dr Neil Spicer
2.1 Maternal and Newborn Health
in Ethiopia
Over the course of 20 years, Ethiopia
has reduced under-5 mortality by two
thirds, allowing the country to reach its
Millennium Development Goal three
years ahead of the 2015 deadline.3 In
the same period however, neonatal
mortality has shown a slow decline.4 Approximately 42% of under-5 mortality is among neonates.5 The
2013 UNICEF Levels & Trends in Child
Mortality report estimated that there are 29 deaths in the first 28 days of life per 1,000 live births.6 Maternal
mortality is also high in Ethiopia. In
2010 the maternal mortality ratio was
estimated at 350 deaths/100,000 live
births.7
Preterm birth, asphyxia and sepsis/
meningitis/ tetanus are reported to be
major causes of neonatal mortality.8
Given the high level of home births in Ethiopia (90% from 2011 Ethiopia Demographic and Health Survey (DHS)5 and 80% from 2011/2012 Health Management Information System data (HMIS)9), limited care for newborns in health facilities and
inadequate newborn care seeking
practice, essential newborn care in
communities and primary health
facilities is a promising way forward.
INTRODUCTION
Community Based Newborn Care baseline survey report 11ideas.lshtm.ac.uk
1. Early identification of pregnancy 2. Provision of focused antenatal care (ANC) 3. Promotion of institutional
delivery
4. Safe and clean delivery including
provision of misoprostol in case
of home deliveries or deliveries
at health post level
5. Provision of immediate newborn
care, including application of
chlorhexidine on the cord
6. Recognition of asphyxia, initial
stimulation and resuscitation of
the newborn baby
7. Prevention and management of
hypothermia
8. Management of pre-term and/or
low birth weight neonates, and
9. Management of neonatal sepsis
and very severe disease at
community level.
The CBNC programme, which was
launched in March 2013, will be
implemented in two major phases.
Phase 1 CBNC service provision began
in March 2014 as a proof of concept in
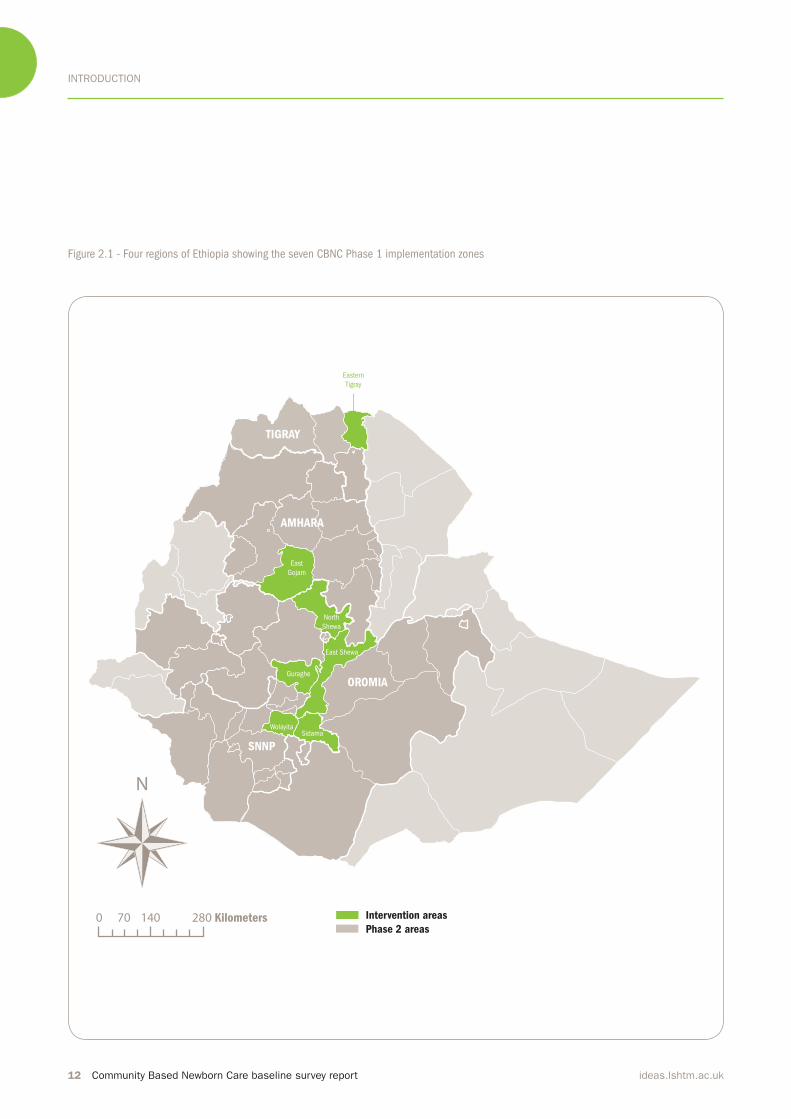
seven zones across four regions of Ethiopia: Amhara (East Gojam zone), Oromia (North and East Shewa zones), Southern Nations Nationalities and Peoples’ (SNNP) Region (Wolayita, Gurage and Sidama zones) and Tigray (Eastern zone).(Figure 2.1) In these seven zones, a total population of over 13.2 million will benefit from the interventions, with 2.8 million women
of reproductive age and over 400,000
expected deliveries per year. This
initiative will then be scaled-up to the
remaining zones in the four regions and beyond (Phase 2), and will be refined on the basis of lessons and experiences from the evaluation of the
initial seven zones.
The CBNC programme in Ethiopia
has the following overall objectives:
1. To further strengthen the PHCU
approach and the HEP by
improving linkages between
health centres and health posts
and the performance of HEWs, to
scale up community based MNH
services, including the
introduction of newborn sepsis
management;
2. To strengthen the capacity of
health centres in providing
quality maternal, newborn and child health (MNCH) services;3. To further strengthen logistics
and information systems within
the PHCU context;
4. To improve maternal and
newborn care practices and care
seeking through the HDA and
other existing effective
community mobilisation
mechanisms; and
5. To draw lessons and experiences
from the initial phase to inform the scale-up phase (Phase 2).
3. UNICEF (2013). Ethiopia meets MDG 4 by
cutting Under 5 mortality By Two-Thirds Since
1990. (2013). www.unicef.org/ethiopia/
events_13459.html
4. World Health Organisation: Estimates. In
State of the World’s Newborns. (2001).
Washington, DC: Saving Newborn Lives, Save
the Children/ USA.
5. Central Statistical Authority and ICF
International: Ethiopia Demographic and
Health Survey. (2012). Addis Ababa, Ethiopia
and Calverton, Maryland, USA: Central
Statistical Agency.
6. UNICEF (2013). Levels & Trends in Child
Mortality: Estimates Developed by the UN
Inter-agency Group for Child Mortality
Estimation. New York: UNICEF.http://www.
who.int/maternal_child_adolescent/
documents/levels_trends_child_
mortality_2013.pdf?ua=1
7. Maternal mortality (1990 to 2010). WHO,
UNICEF, UNFPA and The World Bank
estimates.
8. Countdown to 2015 (2012). The 2012
Report. Maternal Newborn and Child Survival:
Ethiopia www.countdown2015mnch.org/
documents/2012Report/2012/2012_
Ethiopia.pdf
9. Federal Ministry of Health of Ethiopia
(2012). Health Sector Development
Program- IV. Annual performance report.
In the [seven phase 1 CBNC] zones, a total population of
over 13.2 million will beneit from the interventions, with 2.8 million women of reproductive age and over 400,000
expected deliveries per year.”
INTRODUCTION
12 Community Based Newborn Care baseline survey report ideas.lshtm.ac.uk
Intervention areas
Phase 2 areas
Eastern
Tigray
East
Gojam
North
Shewa
East Shewa
Guraghe
SidamaWolayita
TIGRAY
AMHARA
OROMIA
SNNP
280 Kilometers
N
0 70 140
Figure 2.1 - Four regions of Ethiopia showing the seven CBNC Phase 1 implementation zones
INTRODUCTION
Community Based Newborn Care baseline survey report 13ideas.lshtm.ac.uk
Kebele Development
team 1
Development
team 2
1-5
network
1-5
network
1-5
network
1-5
network
1-5
network
1-5
network
1-5
network
1-5
network
1-5
network
1-5
network
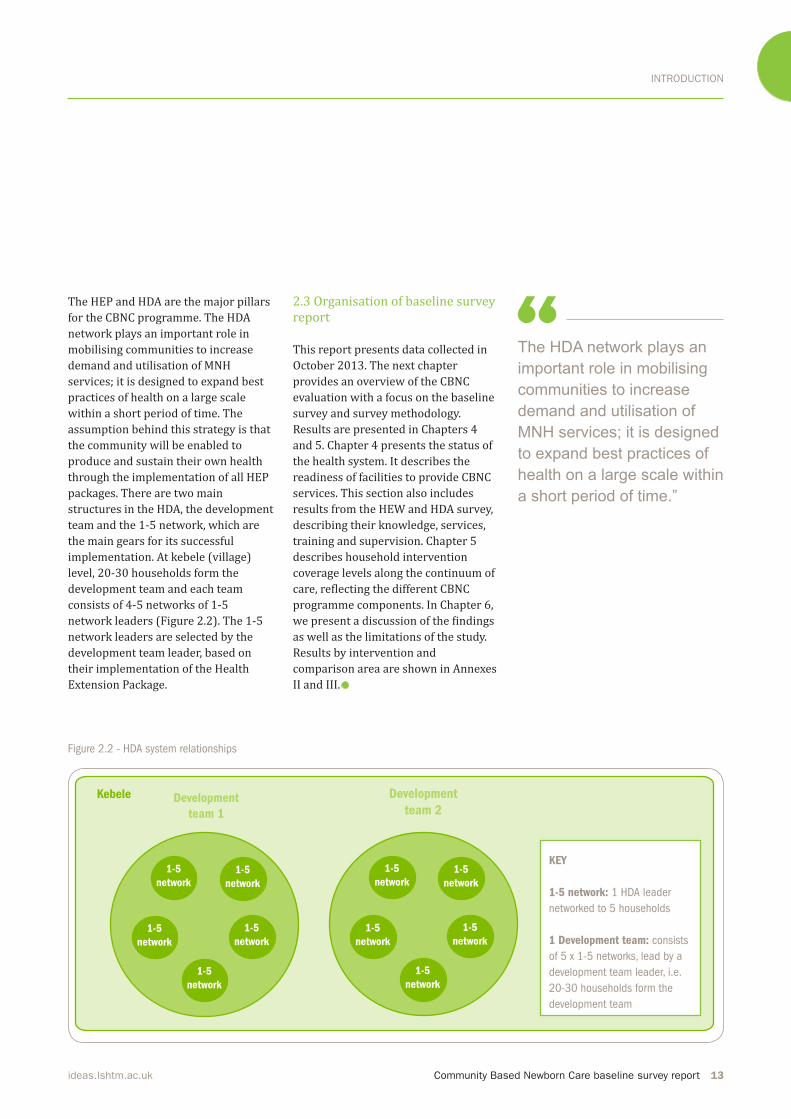
Figure 2.2 - HDA system relationships
The HEP and HDA are the major pillars
for the CBNC programme. The HDA
network plays an important role in
mobilising communities to increase
demand and utilisation of MNH
services; it is designed to expand best
practices of health on a large scale
within a short period of time. The
assumption behind this strategy is that
the community will be enabled to
produce and sustain their own health
through the implementation of all HEP
packages. There are two main
structures in the HDA, the development
team and the 1-5 network, which are
the main gears for its successful implementation. At kebele (village) level, 20-30 households form the
development team and each team
consists of 4-5 networks of 1-5 network leaders (Figure 2.2). The 1-5 network leaders are selected by the
development team leader, based on
their implementation of the Health
Extension Package.
2.3 Organisation of baseline survey
report
This report presents data collected in
October 2013. The next chapter
provides an overview of the CBNC
evaluation with a focus on the baseline
survey and survey methodology.
Results are presented in Chapters 4
and 5. Chapter 4 presents the status of
the health system. It describes the
readiness of facilities to provide CBNC
services. This section also includes
results from the HEW and HDA survey,
describing their knowledge, services,
training and supervision. Chapter 5
describes household intervention
coverage levels along the continuum of care, reflecting the different CBNC programme components. In Chapter 6, we present a discussion of the findings as well as the limitations of the study.
Results by intervention and
comparison area are shown in Annexes
II and III.
The HDA network plays an
important role in mobilising
communities to increase
demand and utilisation of
MNH services; it is designed
to expand best practices of
health on a large scale within
a short period of time.”
KEY
1-5 network: 1 HDA leader
networked to 5 households
1 Development team: consists
of 5 x 1-5 networks, lead by a
development team leader, i.e.
20-30 households form the
development team
EVALUATION
14 Community Based Newborn Care baseline survey report ideas.lshtm.ac.uk
3. Community Based Newborn Care Evaluation
3.1 Objective
The objective of the CBNC Phase 1
evaluation is to gather, analyse and
synthesise evidence to determine
whether and how community based
newborn care in four regions of
Ethiopia leads to increased coverage of
critical interventions along the continuum of care, reflecting the nine programmatic components. The
evaluation design of Phase 1 includes
before-and-after coverage surveys of
the critical MNH interventions in
intervention and comparison areas (Figure 3.1). The CBNC Phase 1 evaluation also includes a midline
survey to examine supply-side factors
at PHCU level, including health centres,
health posts, HEWs, and the HDA;
qualitative work to understand
implementation processes; and
tracking of contextual factors.
3.2 CBNC baseline survey
The baseline survey aims to assess the
coverage level of critical MNH interventions reflecting the programmatic components of CBNC in the seven intervention and five comparison zones. Additionally, it
assesses the existing capacity of health
facilities, HEWs and the HDA to deliver
the different components of the CBNC
programme. This report presents findings from the CBNC baseline evaluation survey.
3.3 Methodology
3.3.1 Study timeline
The preparation and formative
research for the CBNC baseline
evaluation started in May 2013. The
CBNC baseline survey was conducted
in 12 zones, over a six-week period
from October-November 2013.
3.3.2 Survey population
A representative sample of PHCUs was
drawn from each of the 12 zones across
the four regions. Zones however, were
not a representative sample of the
regions from which they were drawn as
zone selection was based on the CBNC Phase 1 (intervention zones) and Phase 2 (comparison zones) implementation plan.
A Facility Readiness survey was
conducted at the sampled health
centres and health posts. Data were also collected from staff affiliated to the health centres (facility in-charge) and health posts (HEW and HDA leaders), who provide services along the
continuum of care to their target
household population.
The household study population
comprised women aged 15-49 who had
given birth within 3-15 months prior to the survey (i.e. July 2012-June 2013). These women were drawn from a
representative sample of 10,450
households served by the selected
PHCUs.
3.3.3 Survey content
The baseline survey used multistage
cluster sampling at woreda, PHCU and
household levels. At each selected
PHCU we conducted:• A Health Facility Survey of a health
centre and a satellite health post to
assess facilities’ readiness to provide
CBNC services on the day of the
survey. The head of the health centre
and the HEW were asked about staff
employed in their facilities,
The baseline survey aims to assess the coverage level
of critical MNH interventions relecting the programmatic components of CBNC in the seven intervention zones and
ive comparison zones
Community Based Newborn Care baseline survey report 15ideas.lshtm.ac.uk
EVALUATION
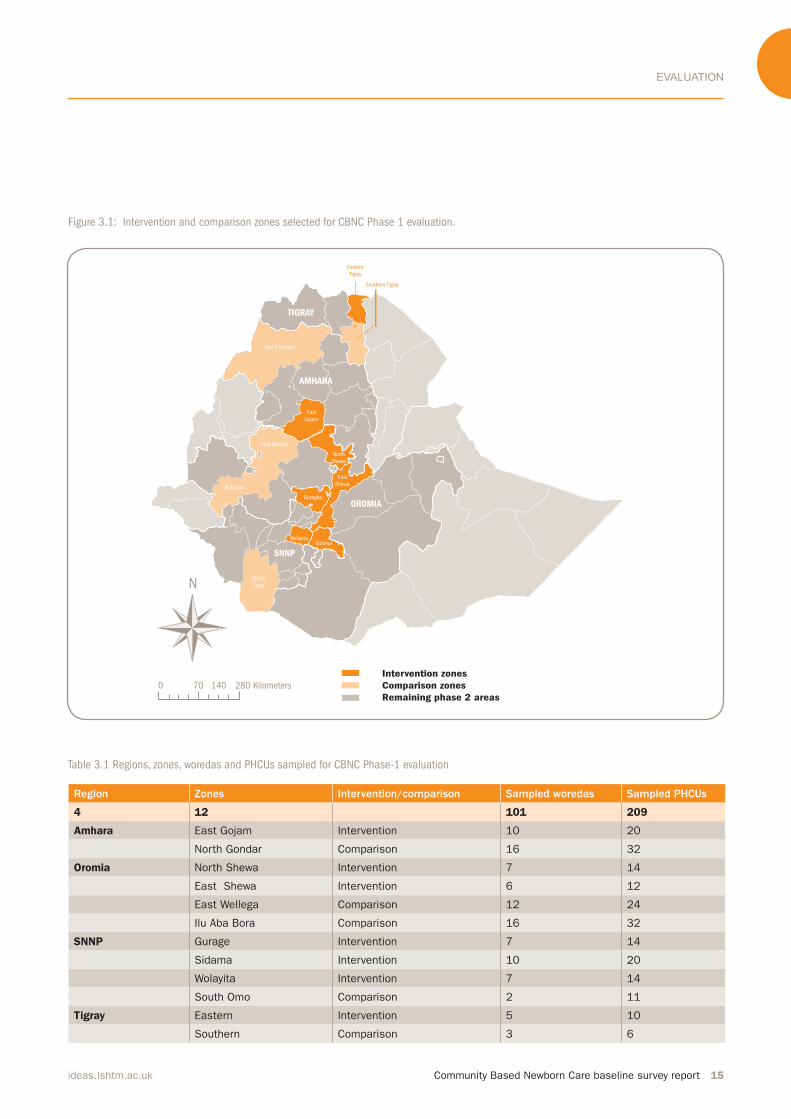
Table 3.1 Regions, zones, woredas and PHCUs sampled for CBNC Phase-1 evaluation
Region Zones Intervention/comparison Sampled woredas Sampled PHCUs
4 12 101 209
Amhara East Gojam Intervention 10 20
North Gondar Comparison 16 32
Oromia North Shewa Intervention 7 14
East Shewa Intervention 6 12
East Wellega Comparison 12 24
Ilu Aba Bora Comparison 16 32
SNNP Gurage Intervention 7 14
Sidama Intervention 10 20
Wolayita Intervention 7 14
South Omo Comparison 2 11
Tigray Eastern Intervention 5 10
Southern Comparison 3 6
Figure 3.1: Intervention and comparison zones selected for CBNC Phase 1 evaluation.
Intervention zones
Comparison zones
Remaining phase 2 areas
South
Omo
North Gondor
Illubabor
East Wellega
Southern Tigray
Eastern
Tigray
East
Gojam
North
Shewa
East
Shewa
Guraghe
SidamaWolayita
TIGRAY
AMHARA
OROMIA
SNNP
280 Kilometers
N
0 70 140
EVALUATION
16 Community Based Newborn Care baseline survey report ideas.lshtm.ac.uk
supportive supervision and services
that were consistently available in
the last three months. Interviewers
also conducted a register review to
ascertain information on the target
population served by the health
facilities and attendance for ANC, delivery, postnatal care (PNC) and sick newborns in the three months
preceding the survey. They also assessed and verified the availability of equipment, job aids and medicines
at the time of the survey. • A HEW and HDA Survey to ask
about their background, their
knowledge of the relevant CBNC
components, MNH services they
provided in the community in the
three months preceding the survey,
their supervision in the three months
preceding the survey, and training
received in the previous 12 months.
Furthermore, HEWs and HDA leaders
were asked about their linkages
(frequency of meeting, reporting and supervision) and MNH-related community mobilisation activities. • A Household Survey in a cluster of
households in the catchment area of
the selected health post. This survey
consisted of three modules. The first was a household module that asked
the household heads about
ownership (e.g. of commodities, land and livestock) and characteristics of the household (e.g. plumbing and electricity); and to list all the people that had lived in the house for the
last three months prior to the survey.
The second module asked all
resident women of reproductive age (15-49) questions about their birth history. The third module asked
women who reported a birth in the
3-15 months prior to the survey in
module two, about their health
seeking behaviours and type of care
they received across the continuum
of care for themselves and their
newborns. Questions were asked
separately about the postpartum and
the postnatal periods, as the postpartum period was defined as the first six weeks, or 40 days after birth, whereas the postnatal period was defined as the first 28 days after birth. Given that CBNC focuses on
reducing neonatal mortality, the
survey questions assessed the
practices related to the neonatal
period, including nutrition and
health seeking behaviour.
3.3.4 Sample size and selection
The baseline survey was conducted in
12 zones across the four regions (Amhara, Oromia, SNNP and Tigray). In each of the seven intervention zones,
half the woredas were chosen at
random (101 out of the 210 woredas).11 In the five comparison zones more than half of the woredas
were randomly sampled to match the
total number of sampled woredas in
intervention zones. Simple random
sampling was then used to select two
PHCUs from each of the 101 selected woredas (total PHCUs = 209). (Table 3.1) From the selected PHCUs, a list of all health posts in each PHCU was
produced and simple random sampling
was used to select one health post from each PHCU (total health posts = 209). In the health posts, HEWs provided a
list of HDA leaders in the kebele, from
which three were randomly selected
for an interview (total HDA leaders= 627). From the selected health post, simple random sampling was used to
select one gote (sub-village-kuseht in Tigray) served by that health post. Random sampling was again used to
select 50 households from the selected gote (total households = 10,450). All households in the selected gote were
numbered from one to the maximum
number of households. If the selected
gote had fewer than 50 households, the
nearest households from a
neighbouring gote were added to make
11. In South Omo, where the majority of the
woredas are semi-pastoralist, only the two
woredas that are agrarian were included. We
then randomly selected four PHCUs from one
woreda and another seven PHCUs from the
second woreda.
Community Based Newborn Care baseline survey report 17ideas.lshtm.ac.uk
EVALUATION
CBNC package. The total fertility rate in
Ethiopia is estimated to be 4.8
(Ethiopia DHS preliminary report, 2011), suggesting that a cross-sectional survey will find one woman between the ages of 15 and 49 who had had a
live birth in the previous 3-15 months in 10% of all households. The proposed sample size of 10,450 households will
allow us to detect differences in
coverage rates of at least 10 percentage
points in key interventions, including
ANC, skilled birth attendance and PNC, with 80% power, 5% significance and assuming a design effect of 1.4 and 90% completeness.3.3.5 Survey tool development
The questionnaires were developed specifically to evaluate the CBNC programme. To better understand the
operationalisation of CBNC, the study
team conducted formative research in
areas where the precursors to CBNC,
namely iCCM and Saving Newborn Lives’ (SNL) Community-Based Intervention for Newborns in Ethiopia (COMBINE),12 were implemented. In
these woredas, the study team
the total up to 50. In gotes that had
more than 50 households, the
households were selected from the list
at random. This resulted in a total of
209 clusters, where each cluster
consisted of a health centre, a satellite
health post, three HDA leaders and 50
households in the catchment area of
the selected health post.
Overall, the sampling procedure for
the baseline survey resulted in a
representative sample of PHCUs in the
selected zones. However, the zones
included in the study are not a
representative sample of the four
regions. Zone selection was based on
CBNC implementation, which will take
place in a phased manner.
This study design allows the
measurement of the change in
coverage, by comparing births from
baseline birth cohort with births from
the end-line birth cohort in CBNC
intervention and comparison zones.
The sample size calculations for the
household survey were based on
detecting a change in the coverage of
key interventions over the time of the
study that can be attributed to the
12. In Ethiopia, SNL conducted the COMBINE
trial to strengthen and evaluate the effect of a
package of community-based innovations for
newborns to support the Government’s HEP,
such as the management of neonatal sepsis
by government HEWs. The CBNC programme
is an initiative that is heavily informed by the
indings of the COMBINE study.
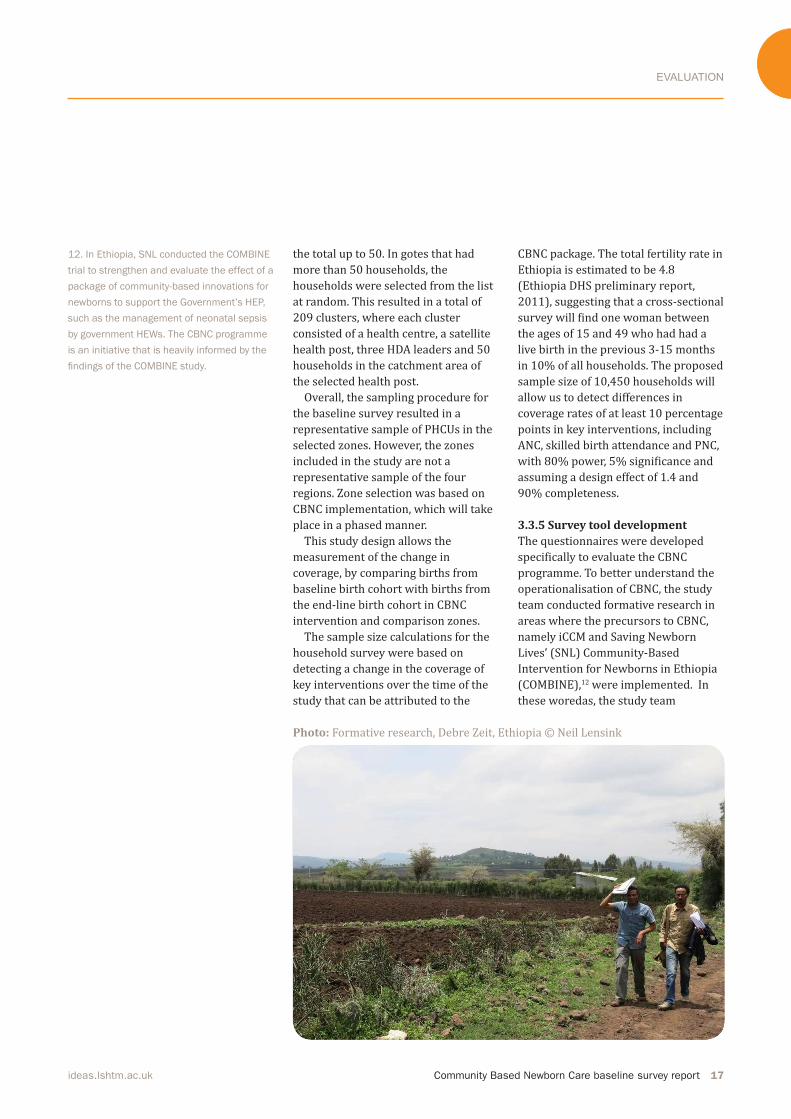
Photo: Formative research, Debre Zeit, Ethiopia © Neil Lensink
EVALUATION
18 Community Based Newborn Care baseline survey report ideas.lshtm.ac.uk
interacted with the woreda health offices, health centre staff members, HEWs and HDA leaders, as well as iCCM and COMBINE project officers. Researchers attended the CBNC master
training of trainers and reviewed the
training materials. The survey modules
also included previously validated
questions where possible. Once
questionnaires were developed in
English, they were translated and then
pre-tested in iCCM woredas, both in the
presence and absence of the COMBINE
project.
3.3.6 Research ethics
The study was approved by the
Institutional Review Boards of the
London School of Hygiene & Tropical
Medicine; the Ethiopian Science and
Technology Ministry; and Oromia,
Amhara, SNNP and Tigray Regional
Health Bureaus. All respondents
provided informed, voluntary written
consent prior to participating in this
study.
3.3.7 Survey implementationThe CBNC field survey was conducted by JaRco Consulting (http://jarrco.info/). IDEAS assigned a full-time survey coordinator to work with JaRco
on ensuring data quality. The IDEAS
country coordinator and researchers
assigned by JaRco were also closely
involved in coordinating the survey
work in different regions.
Data were collected using paper
questionnaires. The questionnaires
were prepared in English and
translated into three local languages –
Amharic, Oromifa and Tigrigna – and
checked against the English version for
content and consistency. The
questionnaires were pre-tested in all
the local languages prior to the start of
the data collectors’ training. The field survey was conducted by 40 teams, each team consisting of a
supervisor and four enumerators.
Enumerators were hired either from
the zone where the survey took place
or from regional capitals, to ensure that
they knew the local language and
culture. Experienced supervisors were
selected from JaRco’s records or hired
based on their survey supervision
experience and knowledge of the local
language.
Two levels of training were
conducted. First, 40 supervisors were
trained centrally in Addis Ababa. The
supervisors’ training was facilitated by
experienced IDEAS and JaRco staff
members who were involved in
designing the survey tools. The training
provided the supervisors with the
general background and objectives of
the survey, and each question of every
survey tool was discussed. The
supervisors’ training also included
techniques employed in ensuring data
quality, supervision methods and the
logistics of survey equipment such as
GPS units and reporting systems.
The second level of training was
conducted among enumerators in four
locations – Addis Ababa for the Oromia
team, Debre Markos for the Amhara
team, Butajira for the SNNP team and
Mekele for the Tigray team. IDEAS and
JaRco researchers involved in designing
the questionnaires were present at
each of the trainings. During the
enumerators’ training, group
discussions were led by the
supervisors, who were already familiar
with the questionnaires, while the
overall training was overseen by IDEAS
and JaRco researchers. Each question
was discussed during the enumerators’ training. In addition, field tests were conducted by all the teams. Feedback
was collated by regional coordinators
and incorporated into all languages
centrally at JaRco.
During the survey, supervisors were
responsible for contacting local
authorities, acquiring permits,
planning daily activities, monitoring
performance, and conducting
interviews at the health centres and
health posts. At the end of each day,
supervisors carried out a preliminary
check of the questionnaires completed
by each enumerator for data
completeness and accuracy.
Supervisors also observed at least two
interviews, re-interviewed at least one
per cluster and conducted spot-checks.
Furthermore, they ensured that three
call-backs were made for each eligible
household, individual, health facility,
HEW and HDA leader before
enumerators could label households or
individuals as unavailable. Supervisors
were responsible for ensuring that all
eligible clusters, households and
individuals were interviewed; all errors
were corrected; and all completed
questionnaires and consent forms were
correctly labelled and sent back to the JaRco office. They were also required to communicate regularly with the
regional survey coordinator (IDEAS and JaRco researchers) and alert
The ield survey was conducted by 40 teams, each team consisting of a supervisor and four enumerators.
Enumerators were hired either from the zone where the
survey took place or from regional capitals, to ensure that
they knew the local language and culture.”
Community Based Newborn Care baseline survey report 19ideas.lshtm.ac.uk
EVALUATION
coordinators of any difficulties. To ensure that implementation of the
survey went as planned, IDEAS and
JaRco researchers involved in designing
the questionnaire worked as regional
coordinators during the survey period
– each region had one regional survey
coordinator. The regional coordinators
visited the regions to provide
supportive supervision and to
troubleshoot any problems arising.
3.3.8 Data management and analysis
Questionnaires were transported from the field to Addis Ababa regularly and then entered into CSPro survey software at the JaRco office. Each questionnaire was entered into the
software twice, by two different
members of the data-entry team. The
two electronic versions of each
questionnaire were compared and
reconciled by a JaRco data supervisor.
Questionnaires that were double-
entered, reconciled and checked had
their data transmitted as CSPro text files to the IDEAS Data Manager at the London School of Hygiene &Tropical
Medicine. Paper questionnaires which
had their data entered into CSPro
software as described above will be stored securely at the JaRco office for a period of three years.
Analysis was carried out using Stata
13. For the baseline report, the
indicators have been tabulated by
region (See Annexes II and III for
indicators tabulated by intervention/
comparison for which the analysis accounts for clustering). Descriptive statistics for continuous variables
include the means, standard deviation
and the number of observations.
Categorical variables have been
presented as numbers and percentages (with confidence intervals for intervention/comparison analysis). Due to the high response rate for health
facilities, HEWs and HDA leaders,
missing data were included in the
denominator of categorical variables.
However, for continuous variables and
household data, due to the variable
response rate, missing data were
excluded from the analysis. This survey
was powered for a comparison
between CBNC intervention and
comparison areas. Hence, as the survey was not sufficiently powered, no statistical analysis was undertaken for
regional comparisons. Numbers and
percentages presented are therefore
simply the unweighted tabulations of data from the survey. Confidence intervals given in the intervention
comparison area tables have been
adjusted for clustering at the health
centre level. Again, no weighted
summaries have been given as the
intention of the survey was not to
produce population estimates.
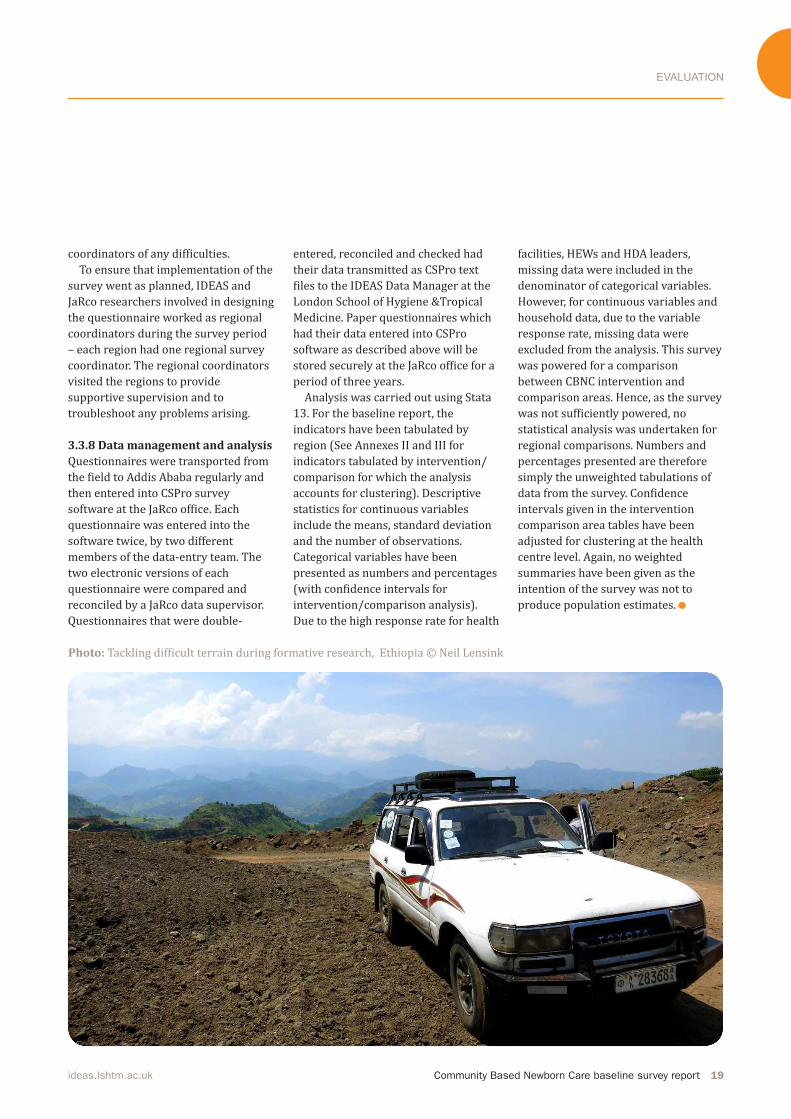
Photo: Tackling difficult terrain during formative research, Ethiopia © Neil Lensink

RESULTS - HEALTH SYSTEM STATUS
20 Community Based Newborn Care baseline survey report ideas.lshtm.ac.uk
4. Results: Health System Status
13. A facility was considered to be
inaccessible if the woreda health ofice representative informed the survey supervisor
that the facility could not be reached by
vehicle (dificult topography) and the walking distance was greater than ive hours.
In this section, we explore the current health system status and CBNC readiness for the
206 PHCU clusters that were visited during the survey.
Three inaccessible13 clusters (two from Amhara and one from SNNP region) were dropped from the study. Below
we present the results from 206 health
centres, 206 health posts, 206 HEWs,
and 605 HDA leaders. For health
centres and health posts, the survey
assessed facilities’ service status and
readiness to provide MNH services
with a focus on CBNC programmatic
aspects. For HEWs and HDA leaders, we
present data on training, knowledge
and practice in MNH services.
Photo above: Newborn child at Dessie
Referral Hospital in Amhara region, Ethiopia.
© Michael Tsegaye/Save the Children
Photo opposite: Carrying eucalyptus
branches to market, Entoto Hills, Ethiopia
© Dr Neil Spicer

RESULTS - HEALTH SYSTEM STATUS
Community Based Newborn Care baseline survey report 21ideas.lshtm.ac.uk
4.1 Health Centre In the first part of this section, we present information on the target
population under the surveyed health centres and the staffing profile of the PHCUs (health centre and satellite health posts). This is followed by a description of the facilities’
infrastructure and availability of job
aids, administrative forms, functional
equipment, supplies, and drugs that
are necessary to provide MNH services.
In the last part of this section, we
present information on MNH services
routinely offered at the health centre
and an analysis of the level of service
utilisation in the three months
preceding the survey.
4.1.1 Recorded target population
served by the health centre and
description of the facility
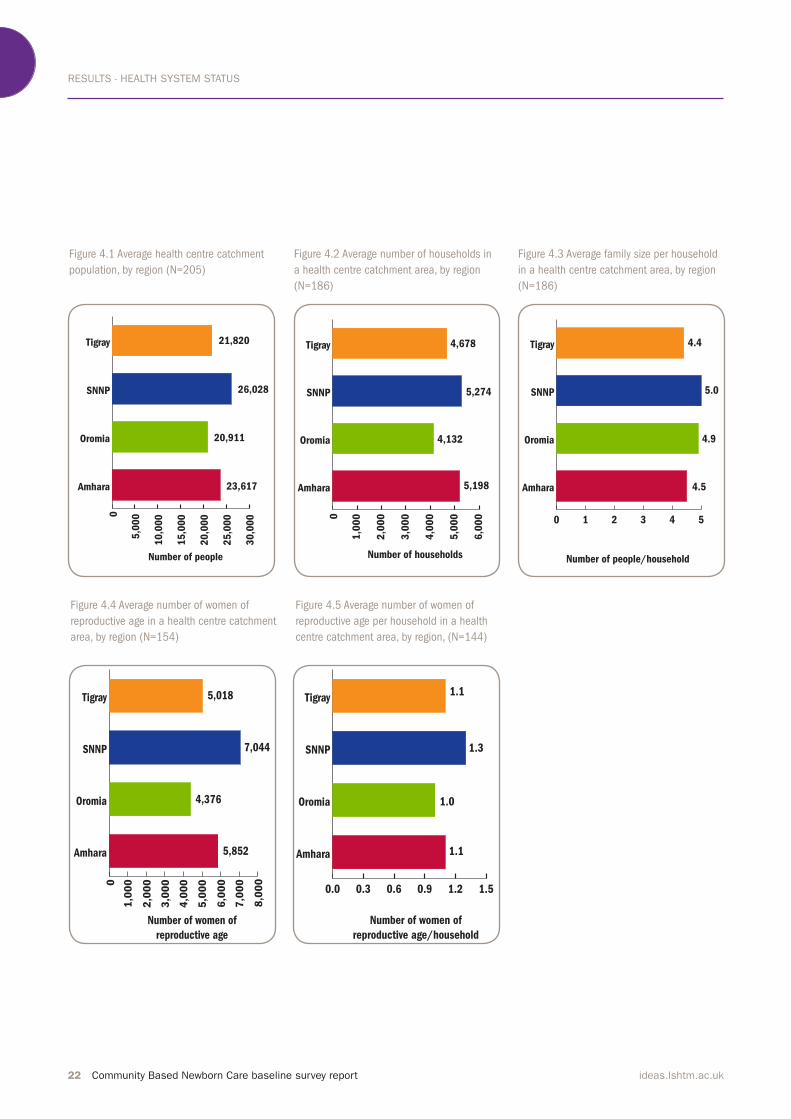
By design, one health centre serves up
to 25,000 people and in this study
health centres on average covered a
total population of 23,090 people,
4,750 households and 5,520 women of
reproductive age. Regional distribution
of the target population is shown in figures 4.1-4.5. Of the four regions, SNNP, which has a high population
density, showed a larger mean number
of population, households and women
of reproductive age.
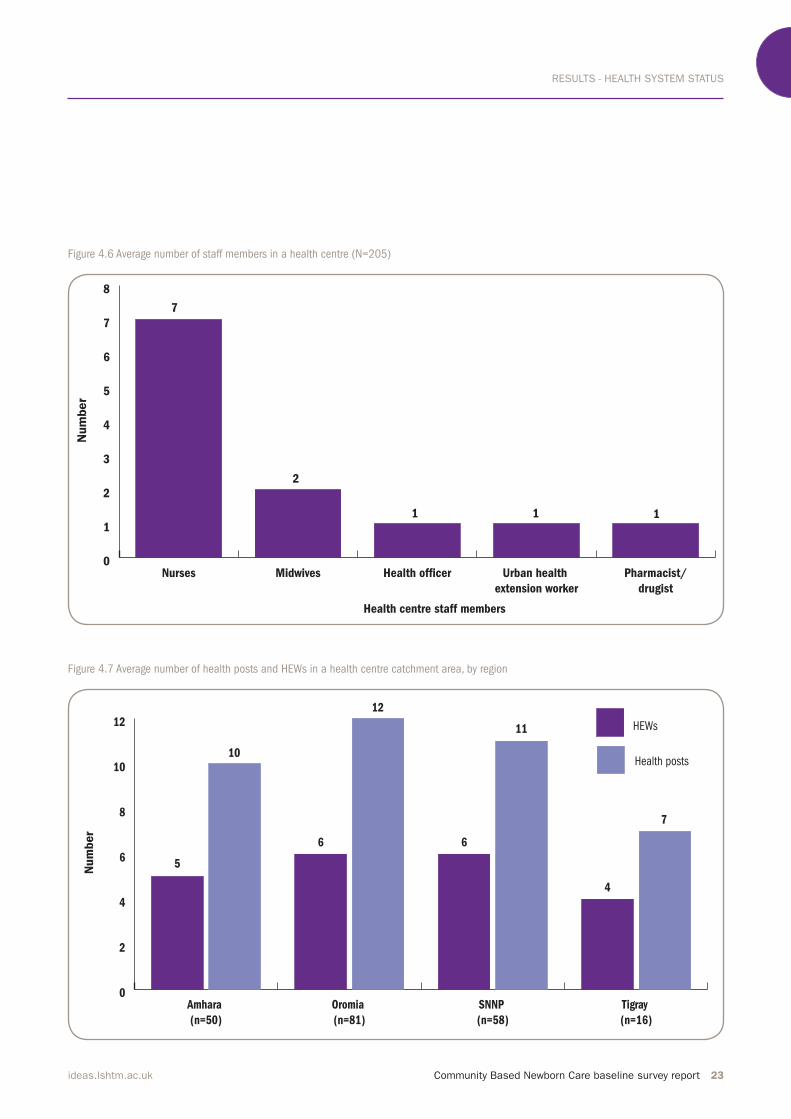
In this study, health centres had, on
average, seven nurses, two midwives, one health officer and one pharmacist (Figure 4.6). This distribution was similar across regions, except in
Oromia where the data suggest that
health centres on average had fewer
nurses. As part of the primary health
care unit, health centres on average
had six satellite health posts and
10 HEWs.
Figure 4.7 shows the distribution of
health posts and HEWs by region. By
design, each health post should be
staffed by two female HEWs and in this
study Amhara and Oromia had twice as
many HEWs as health posts. However,
the data suggest that there was a
relative shortage of HEWs in Tigray
and SNNP.
Assessment of the facilities’
infrastructure showed that a little over
half of the health centres had electricity and 59% had piped water. Almost all had patient toilets and a functional refrigerator (92% and 94%, respectively). However, health centres had more electrical equipment and
toilets than they had supplies of
electricity and water. Motorised transport was available in 42% of the facilities surveyed, the highest being in Oromia region (Table 4.1). Across all four regions 38% of health facilities had a motorcycle, 23% had a car/ambulance and 8% had a three-wheeler.
RESULTS - HEALTH SYSTEM STATUS
22 Community Based Newborn Care baseline survey report ideas.lshtm.ac.uk
Figure 4.3 Average family size per household
in a health centre catchment area, by region
(N=186)
Figure 4.4 Average number of women of
reproductive age in a health centre catchment
area, by region (N=154)
Figure 4.5 Average number of women of
reproductive age per household in a health
centre catchment area, by region, (N=144)
0 1 2 3 4 5
Amhara
Oromia
SNNP
Tigray
Number of people/household
4.5
4.9
5.0
4.4
0
1,0
00
2,0
00
3,0
00
4,0
00
5,0
00
6,0
00
7,0
00
8,0
00
Amhara
Oromia
SNNP
Tigray
Number of women of
reproductive age
5,852
4,376
7,044
5,018
0.0 0.3 0.6 0.9 1.2 1.5
Amhara
Oromia
SNNP
Tigray
Number of women of
reproductive age/household
1.1
1.0
1.3
1.1
Figure 4.1 Average health centre catchment
population, by region (N=205)
Figure 4.2 Average number of households in
a health centre catchment area, by region
(N=186)
0
5,0
00
10
,00
0
15
,00
0
20
,00
0
25
,00
0
30
,00
0
Amhara
Oromia
SNNP
Tigray
Number of people
23,617
20,911
26,028
21,8200
1,0
00
2,0
00
3,0
00
4,0
00
5,0
00
6,0
00
Amhara
Oromia
SNNP
Tigray
Number of households
5,198
4,132
5,274
4,678
RESULTS - HEALTH SYSTEM STATUS
Community Based Newborn Care baseline survey report 23ideas.lshtm.ac.uk
Figure 4.6 Average number of staff members in a health centre (N=205)
Figure 4.7 Average number of health posts and HEWs in a health centre catchment area, by region
0
1
2
3
4
5
6
7
8
Pharmacist/
drugist
Urban health
extension worker
Health of�cerMidwivesNurses
Health centre staff members
1
2
1
7
Num
ber
1
0
2
4
6
8
10
12 HEWs
Health posts
Tigray
(n=16)
SNNP
(n=58)
Oromia
(n=81)
Amhara
(n=50)
12
6 6
5
Num
ber
4
7
11
10
RESULTS - HEALTH SYSTEM STATUS
24 Community Based Newborn Care baseline survey report ideas.lshtm.ac.uk
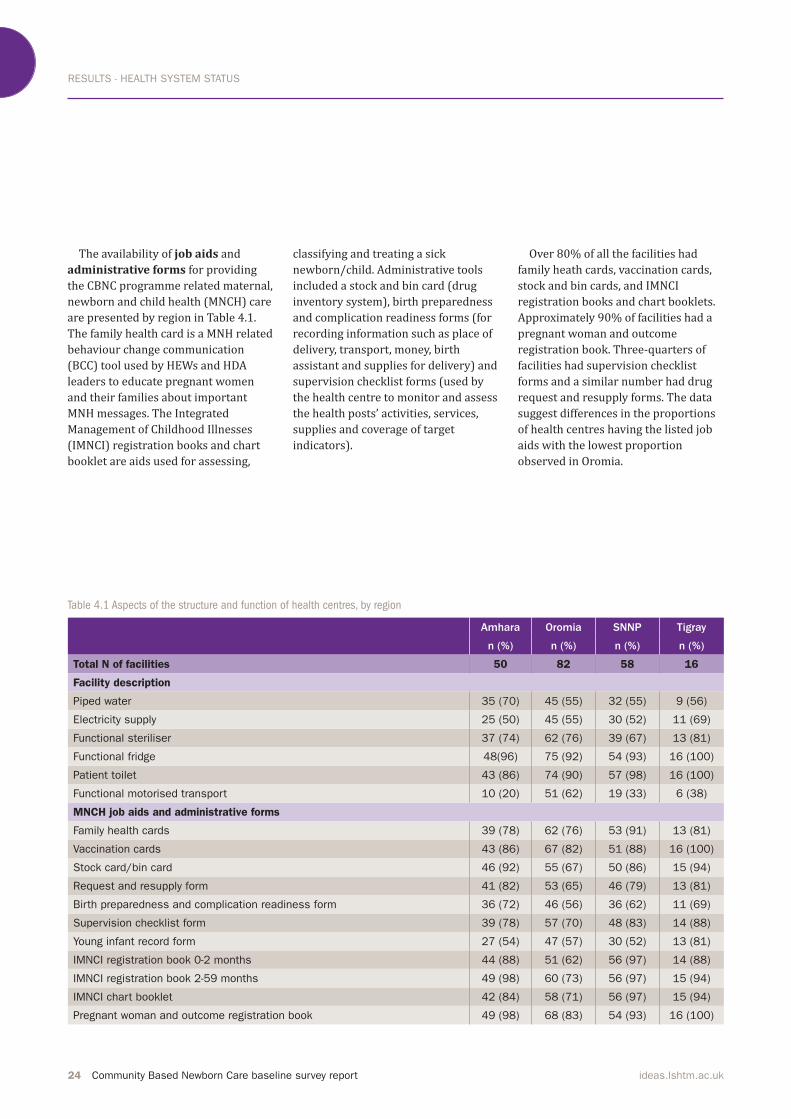
Table 4.1 Aspects of the structure and function of health centres, by region
Amhara Oromia SNNP Tigray
n (%) n (%) n (%) n (%)
Total N of facilities 50 82 58 16
Facility description
Piped water 35 (70) 45 (55) 32 (55) 9 (56)
Electricity supply 25 (50) 45 (55) 30 (52) 11 (69)
Functional steriliser 37 (74) 62 (76) 39 (67) 13 (81)
Functional fridge 48(96) 75 (92) 54 (93) 16 (100)
Patient toilet 43 (86) 74 (90) 57 (98) 16 (100)
Functional motorised transport 10 (20) 51 (62) 19 (33) 6 (38)
MNCH job aids and administrative forms
Family health cards 39 (78) 62 (76) 53 (91) 13 (81)
Vaccination cards 43 (86) 67 (82) 51 (88) 16 (100)
Stock card/bin card 46 (92) 55 (67) 50 (86) 15 (94)
Request and resupply form 41 (82) 53 (65) 46 (79) 13 (81)
Birth preparedness and complication readiness form 36 (72) 46 (56) 36 (62) 11 (69)
Supervision checklist form 39 (78) 57 (70) 48 (83) 14 (88)
Young infant record form 27 (54) 47 (57) 30 (52) 13 (81)
IMNCI registration book 0-2 months 44 (88) 51 (62) 56 (97) 14 (88)
IMNCI registration book 2-59 months 49 (98) 60 (73) 56 (97) 15 (94)
IMNCI chart booklet 42 (84) 58 (71) 56 (97) 15 (94)
Pregnant woman and outcome registration book 49 (98) 68 (83) 54 (93) 16 (100)
The availability of job aids and
administrative forms for providing
the CBNC programme related maternal, newborn and child health (MNCH) care are presented by region in Table 4.1.
The family health card is a MNH related
behaviour change communication (BCC) tool used by HEWs and HDA leaders to educate pregnant women
and their families about important
MNH messages. The Integrated
Management of Childhood Illnesses (IMNCI) registration books and chart booklet are aids used for assessing,
classifying and treating a sick
newborn/child. Administrative tools
included a stock and bin card (drug inventory system), birth preparedness and complication readiness forms (for
recording information such as place of
delivery, transport, money, birth assistant and supplies for delivery) and supervision checklist forms (used by
the health centre to monitor and assess
the health posts’ activities, services,
supplies and coverage of target indicators).
Over 80% of all the facilities had family heath cards, vaccination cards,
stock and bin cards, and IMNCI
registration books and chart booklets. Approximately 90% of facilities had a pregnant woman and outcome
registration book. Three-quarters of
facilities had supervision checklist
forms and a similar number had drug
request and resupply forms. The data
suggest differences in the proportions
of health centres having the listed job
aids with the lowest proportion
observed in Oromia.
RESULTS - HEALTH SYSTEM STATUS
Community Based Newborn Care baseline survey report 25ideas.lshtm.ac.uk
4.1.2 Equipment, supplies and
medicine available on the day of the
survey
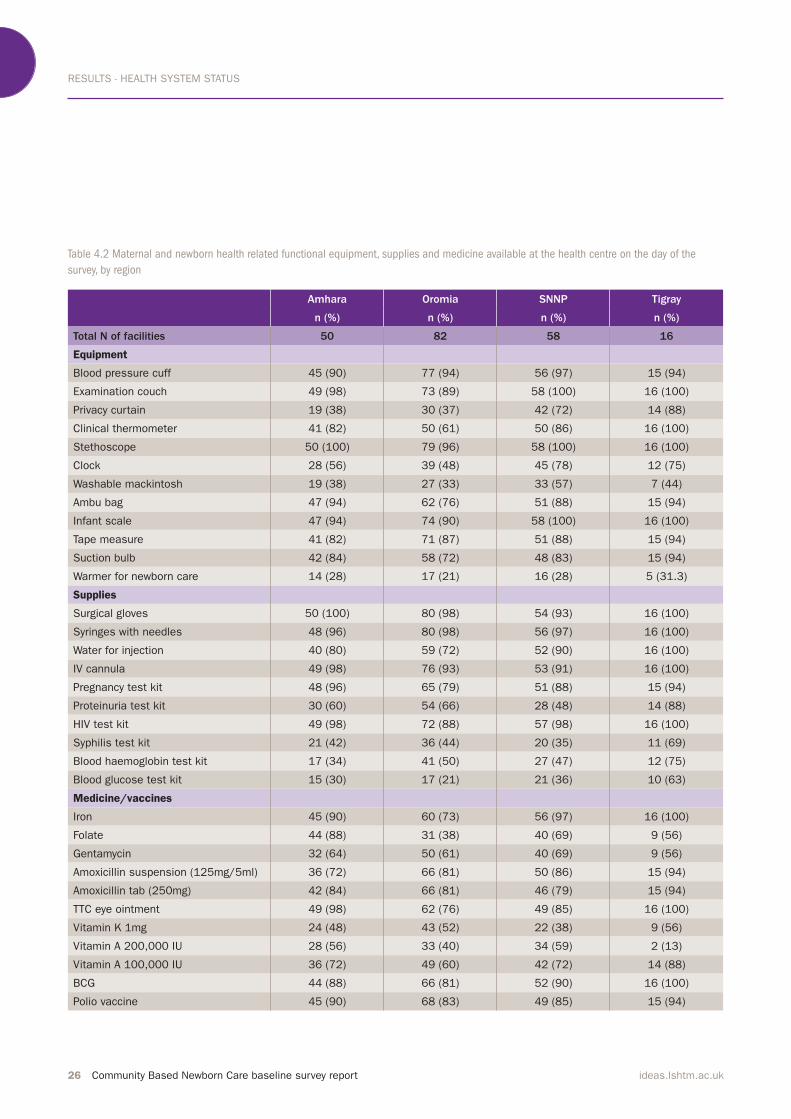
As shown in Table 4.2, this survey assessed and verified the availability of equipment, supplies and medicines
necessary to provide basic MNH care services. Overall, over 90% of the facilities had an examination couch, a
blood pressure cuff, a stethoscope and
an infant scale. An Ambu bag, tape
measure and a suction bulb were available in over 80% of the facilities. Half of the facilities were equipped
with privacy curtains. A warmer for newborn care was available in 23% of the facilities. Over 90% of facilities had surgical gloves, syringes with needles, and intravenous (IV) cannula. With respect to supply of diagnostic kits to provide
MNH care, the majority of health centres had HIV (94%), pregnancy (87%) and urine dipstick (80%) test kits. Less than half the facilities had
syphilis, blood glucose and blood
haemoglobin test kits. The assessed
supplies were available at a higher
percentage of facilities in Tigray than in the other three regions.(Table 4.2) As part of the CBNC programme, a
neonate with severe bacterial infection
should be treated with seven days of
gentamycin injections and dispersible
amoxicillin tablets. A neonate with a
local bacterial infection should be treated with amoxicillin for five days. The CBNC programme also includes Tetracycline (TTC) eye ointment and chlorhexidine for cord care as part of
immediate newborn care.
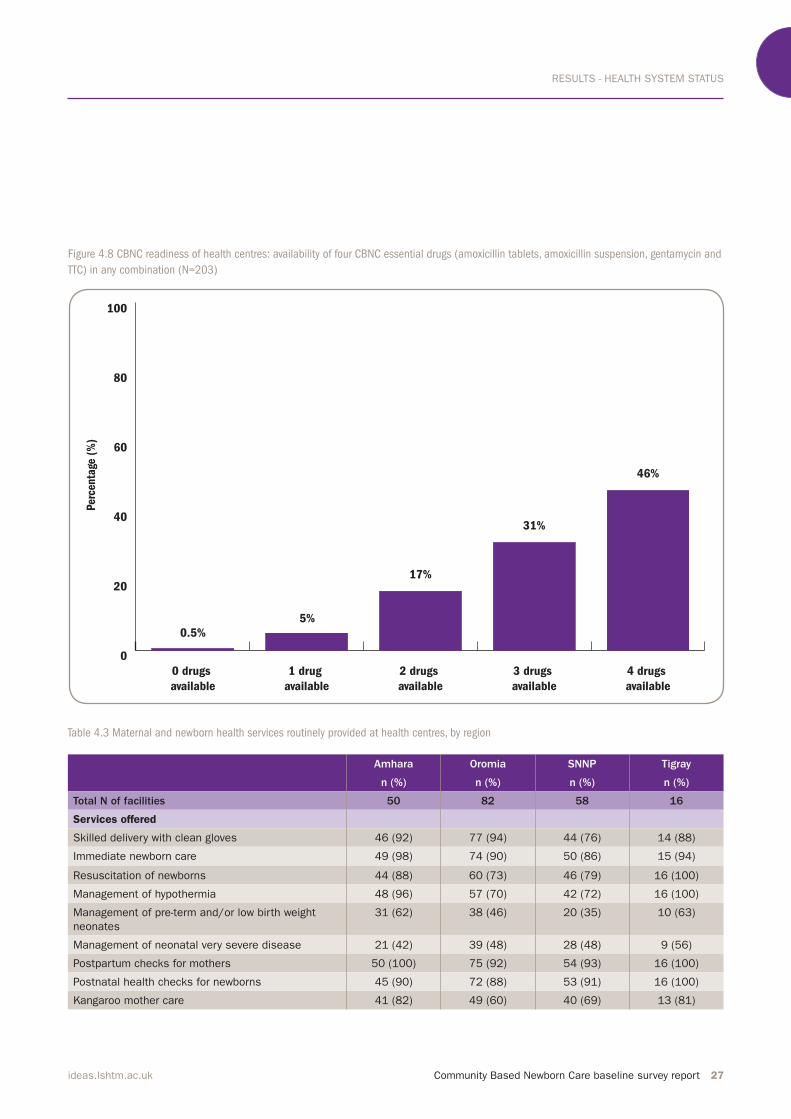
In this study, gentamycin was available in 64% of the facilities and over 80% had amoxicillin suspension and tablets and TTC eye ointment.
Figure 4.8 shows the availability of
four of the drugs associated with the
CBNC programme (gentamycin,
amoxicillin tablets, amoxicillin suspension, and TTC). Forty-six
percent of facilities had all four drugs and 31% had three out of the four drugs available on the day of the
survey.
4.1.3 Facility services routinely
offered and services utilised in the
last three months
Staff members were asked about
services provided routinely at the
health centre in the last three months. Approximately 90% of facilities provided skilled delivery, immediate
newborn care, postpartum checks for mothers (provided in the first six weeks after birth), and postnatal checks for newborns (provided in the first 28 days after birth). Around 80% provided resuscitation and
management of hypothermia. Seventy
percent provided kangaroo mother care (KMC) services. It is likely that this estimate includes skin-to-skin care. A little less than 50% of facilities provided management of pre-term or
low birth weight neonates and
treatment of neonates with very severe
disease. Table 4.3 shows the
distribution of routine services by
region.
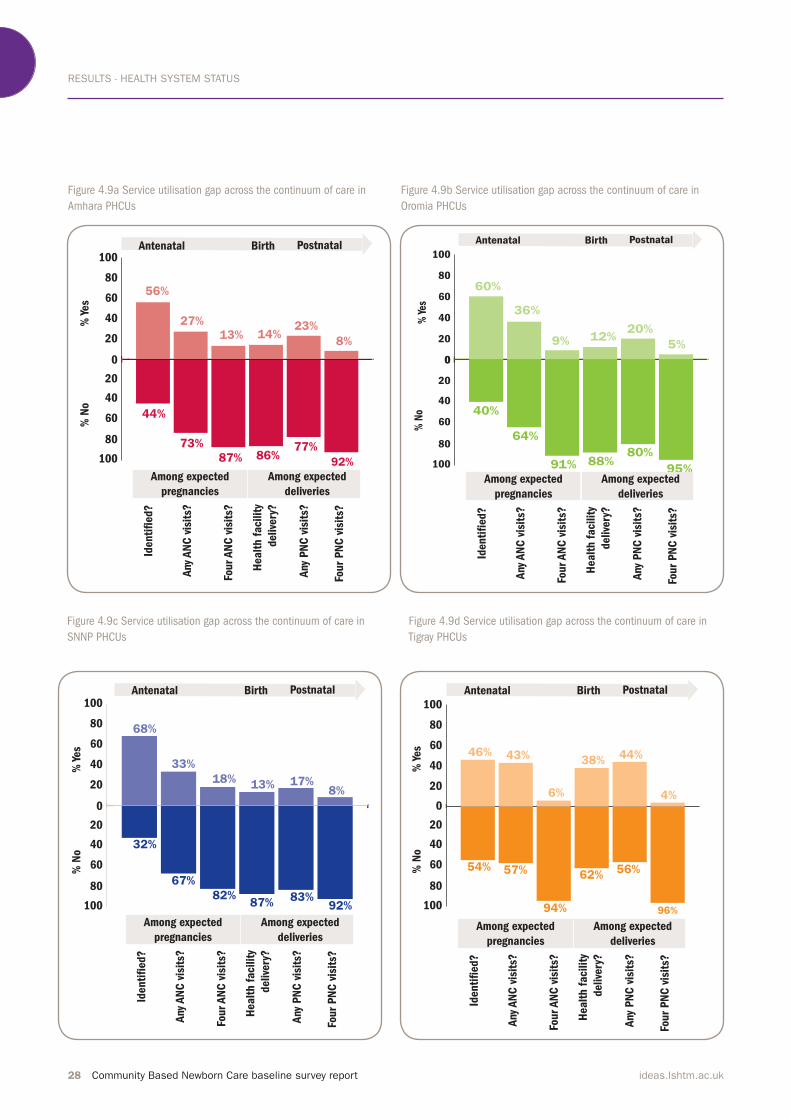
Figure 4.9a-d shows the gaps
between expected and recorded service
utilisation for each of the four regions.
These are based on respective PHCU
performance targets and service
records maintained at the health
centre, which includes information on
the whole PHCU (health centre and satellite health posts). Across all four regions, of the expected pregnancies, 42% were unidentified by the PHCU and two-thirds did not receive any
ANC. Of the expected deliveries, over 75% did not take place at a health facility. The service utilisation gap was
largest for optimal PNC visits among
expected births across all four regions.
Approximately 90% of
facilities provided skilled
delivery, immediate newborn
care, postpartum checks for
mothers (provided in the irst six weeks after birth), and
postnatal checks for newborns
(provided in the irst 28 days after birth).”
RESULTS - HEALTH SYSTEM STATUS
26 Community Based Newborn Care baseline survey report ideas.lshtm.ac.uk
Table 4.2 Maternal and newborn health related functional equipment, supplies and medicine available at the health centre on the day of the
survey, by region
Amhara Oromia SNNP Tigray
n (%) n (%) n (%) n (%)
Total N of facilities 50 82 58 16
Equipment
Blood pressure cuff 45 (90) 77 (94) 56 (97) 15 (94)
Examination couch 49 (98) 73 (89) 58 (100) 16 (100)
Privacy curtain 19 (38) 30 (37) 42 (72) 14 (88)
Clinical thermometer 41 (82) 50 (61) 50 (86) 16 (100)
Stethoscope 50 (100) 79 (96) 58 (100) 16 (100)
Clock 28 (56) 39 (48) 45 (78) 12 (75)
Washable mackintosh 19 (38) 27 (33) 33 (57) 7 (44)
Ambu bag 47 (94) 62 (76) 51 (88) 15 (94)
Infant scale 47 (94) 74 (90) 58 (100) 16 (100)
Tape measure 41 (82) 71 (87) 51 (88) 15 (94)
Suction bulb 42 (84) 58 (72) 48 (83) 15 (94)
Warmer for newborn care 14 (28) 17 (21) 16 (28) 5 (31.3)
Supplies
Surgical gloves 50 (100) 80 (98) 54 (93) 16 (100)
Syringes with needles 48 (96) 80 (98) 56 (97) 16 (100)
Water for injection 40 (80) 59 (72) 52 (90) 16 (100)
IV cannula 49 (98) 76 (93) 53 (91) 16 (100)
Pregnancy test kit 48 (96) 65 (79) 51 (88) 15 (94)
Proteinuria test kit 30 (60) 54 (66) 28 (48) 14 (88)
HIV test kit 49 (98) 72 (88) 57 (98) 16 (100)
Syphilis test kit 21 (42) 36 (44) 20 (35) 11 (69)
Blood haemoglobin test kit 17 (34) 41 (50) 27 (47) 12 (75)
Blood glucose test kit 15 (30) 17 (21) 21 (36) 10 (63)
Medicine/vaccines
Iron 45 (90) 60 (73) 56 (97) 16 (100)
Folate 44 (88) 31 (38) 40 (69) 9 (56)
Gentamycin 32 (64) 50 (61) 40 (69) 9 (56)
Amoxicillin suspension (125mg/5ml) 36 (72) 66 (81) 50 (86) 15 (94)
Amoxicillin tab (250mg) 42 (84) 66 (81) 46 (79) 15 (94)
TTC eye ointment 49 (98) 62 (76) 49 (85) 16 (100)
Vitamin K 1mg 24 (48) 43 (52) 22 (38) 9 (56)
Vitamin A 200,000 IU 28 (56) 33 (40) 34 (59) 2 (13)
Vitamin A 100,000 IU 36 (72) 49 (60) 42 (72) 14 (88)
BCG 44 (88) 66 (81) 52 (90) 16 (100)
Polio vaccine 45 (90) 68 (83) 49 (85) 15 (94)
RESULTS - HEALTH SYSTEM STATUS
Community Based Newborn Care baseline survey report 27ideas.lshtm.ac.uk
Figure 4.8 CBNC readiness of health centres: availability of four CBNC essential drugs (amoxicillin tablets, amoxicillin suspension, gentamycin and
TTC) in any combination (N=203)
Table 4.3 Maternal and newborn health services routinely provided at health centres, by region
Amhara Oromia SNNP Tigray
n (%) n (%) n (%) n (%)
Total N of facilities 50 82 58 16
Services offered
Skilled delivery with clean gloves 46 (92) 77 (94) 44 (76) 14 (88)
Immediate newborn care 49 (98) 74 (90) 50 (86) 15 (94)
Resuscitation of newborns 44 (88) 60 (73) 46 (79) 16 (100)
Management of hypothermia 48 (96) 57 (70) 42 (72) 16 (100)
Management of pre-term and/or low birth weight
neonates
31 (62) 38 (46) 20 (35) 10 (63)
Management of neonatal very severe disease 21 (42) 39 (48) 28 (48) 9 (56)
Postpartum checks for mothers 50 (100) 75 (92) 54 (93) 16 (100)
Postnatal health checks for newborns 45 (90) 72 (88) 53 (91) 16 (100)
Kangaroo mother care 41 (82) 49 (60) 40 (69) 13 (81)
0
20
40
60
80
100
4 drugs
available
3 drugs
available
2 drugs
available
1 drug
available
0 drugs
available
17%
5%
31%
0.5%
Perc
enta
ge (
%)
46%
RESULTS - HEALTH SYSTEM STATUS
28 Community Based Newborn Care baseline survey report ideas.lshtm.ac.uk
Figure 4.9a Service utilisation gap across the continuum of care in
Amhara PHCUs
Figure 4.9b Service utilisation gap across the continuum of care in
Oromia PHCUs
Figure 4.9c Service utilisation gap across the continuum of care in
SNNP PHCUs
Figure 4.9d Service utilisation gap across the continuum of care in
Tigray PHCUs
0
20
40
60
80
100
20
40
60
80
100
44%
73%
87% 86%77%
92%
Identi
�ed?
Any
AN
C v
isit
s?
Four
AN
C v
isit
s?
Any
PN
C v
isit
s?
Four
PN
C v
isit
s?
% Y
es
% N
o
Antenatal Birth PostnatalH
ealt
h f
acilit
y
delive
ry?
56%
27%
13% 14%23%
8%
Among expected
pregnancies
Among expected
deliveries
0
20
40
60
80
100
0
20
40
60
80
100
54%
40%
64%
91% 88%80%
95%
% Y
es%
No
60%
36%
9% 12%20%
5%
Antenatal Birth Postnatal
Identi
�ed?
Any
AN
C v
isit
s?
Four
AN
C v
isit
s?
Any
PN
C v
isit
s?
Four
PN
C v
isit
s?
Healt
h f
acilit
y
delive
ry?
Among expected
pregnancies
Among expected
deliveries
0
20
40
60
80
100
20
40
60
80
100
32%
67%
82%87%
83%92%
68%
33%
18%13% 17%
8%
% Y
es
% N
o
Identi
�ed?
Any
AN
C v
isit
s?
Four
AN
C v
isit
s?
Any
PN
C v
isit
s?
Four
PN
C v
isit
s?
Antenatal Birth Postnatal
Healt
h f
acilit
y
delive
ry?
Among expected
pregnancies
Among expected
deliveries
0
20
40
60
80
100
20
40
60
80
100
54% 57%
94%
62%56%
96%
46% 43%
6%
38%44%
4%
% Y
es
% N
o
Identi
�ed?
Any
AN
C v
isit
s?
Four
AN
C v
isit
s?
Any
PN
C v
isit
s?
Four
PN
C v
isit
s?
Antenatal Birth Postnatal
Healt
h f
acilit
y
delive
ry?
Among expected
pregnancies
Among expected
deliveries
RESULTS - HEALTH SYSTEM STATUS
Community Based Newborn Care baseline survey report 29ideas.lshtm.ac.uk
4.2 Health Post
A total of 206 health posts in the
catchment areas surveyed were
included in this study. At each health
post, the more senior HEW who had
worked longer at the health post was
interviewed. Information on the target
population, characteristics of the
health facility, equipment, supplies and
medicines available was collected. A
record review was conducted to assess
services that were routinely offered at
the health post in the three months
preceding the survey and their level of
utilisation.
4.2.1 Recorded target population
served by the health post and
description of the health post
A health post is intended to serve
approximately 5,000 people. In this
study, on average, health post
catchment areas had a population of
4,450 people, 1,070 households and
975 women of reproductive age.
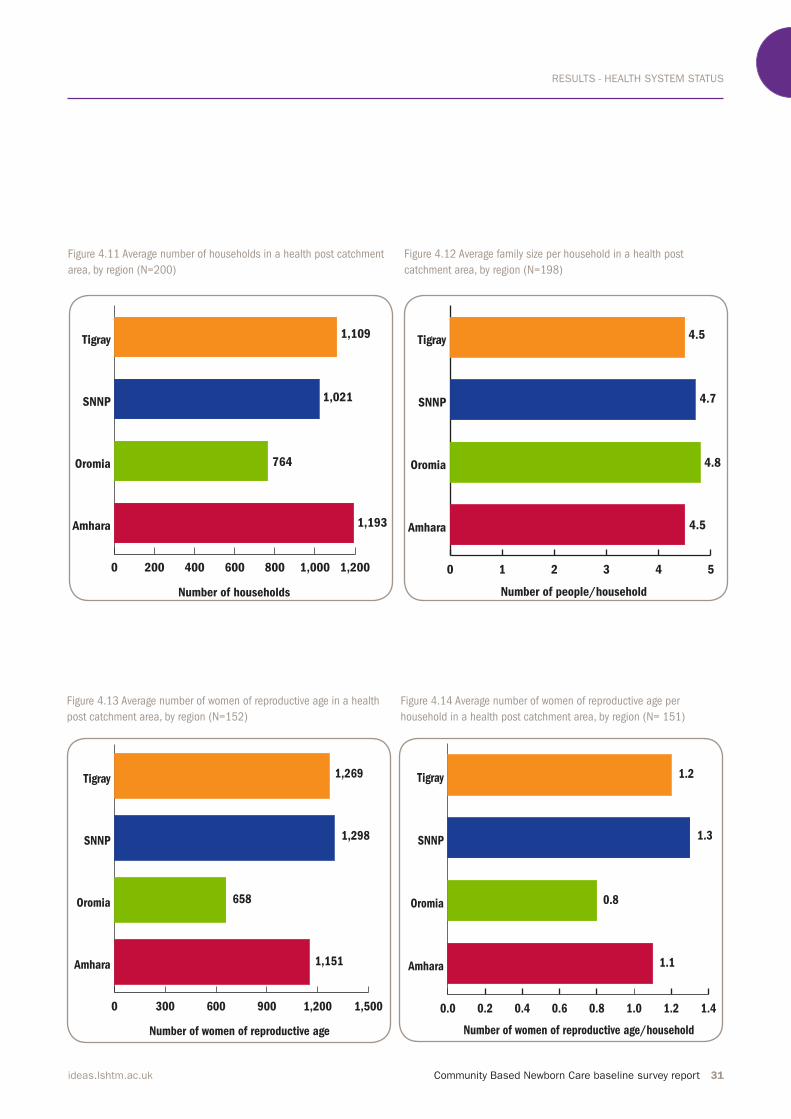
Regional distribution of the target population is shown in figures 4.10-4.14.
With respect to facility description, 80% of health posts had toilets for clients while only 13% had piped water. Twenty percent were connected
to electricity and a similar number had
a functional steriliser and fridge.
However, in Tigray over half the
facilities had electricity, a steriliser and a fridge (Table 4.4).Assessment of the availability of
MNCH job aids and administrative
forms showed that approximately 80% of health posts had family folders (a
family-centred information collection
tool for integrated health service delivery by HEWs) and a book for pregnant women and outcomes
registration (which was not federally issued). Sixty-eight percent had any family health cards and young infant record forms. Around 90% had iCCM registration books and 65% had iCCM chart booklets. Health posts might not
have had a chart booklet if the
interviewed HEW had not been trained
in iCCM, if a previously trained HEW had left the health post (attrition) or if the actual booklet was not available at
the health post on the day of the survey.
Forty-two percent of health posts had stock/bin cards and 33% had drug request and resupply forms. Less than
one-third had supervision checklist
forms and birth preparedness and
complication forms. In general, fewer
facilities in Amhara and Oromia had
the necessary MNCH job aids and administrative forms. (Table 4.4)
Assessment of the availability of MNCH job aids and
administrative forms showed that approximately 80% of
health posts had family folders and a book for pregnant
women and outcomes registration.”

RESULTS - HEALTH SYSTEM STATUS
30 Community Based Newborn Care baseline survey report ideas.lshtm.ac.uk
Table 4.4 Aspects of the structure and function of health posts, by region
Amhara Oromia SNNP Tigray
n (%) n (%) n (%) n (%)
Total N of facilities 50 82 58 16
Facility description
Piped water 3 (6) 9 (11) 8 (14) 7( 44)
Electricity supply 7 (14) 12 (15) 14 (24) 8 (50)
Functional steriliser 9 (18) 14 (17) 11(19) 8 (50)
Functional fridge 7 (14) 16 (20) 10 (18) 9 (56)
Patient toilet 37 (74) 64 (78) 51 (88) 14 (88)
MNCH job aids and administrative forms
Family folder 31 (62) 64 (78) 50 (86) 16 (100)
Family health cards 31 (62) 49 (60) 47 (81) 14 (88)
Vaccination cards 39 (78) 61 (74) 48 (83) 15 (94)
Stock card/bin card 27 (54) 24 (29) 27 (47) 10 (63)
Request and re-supply form 21 (42) 24 (29) 15 (26) 8 (50)
Birth preparedness and complication form 7 (14) 21 (26) 19 (33) 12 (75)
Supervision checklist form 14 (28) 16 (20) 17 (29) 12 (75)
Young Infant Record Form 29 (58) 58 (71) 40 (69) 13 (81)
iCCM registration book 0-2 months 42 (84) 71 (87) 55 (95) 14 (88)
iCCM registration book 2 -59 months 43 (86) 74 (90) 55 (95) 15 (94)
Chart booklet 29 (58) 45 (55) 47 (81) 14 (88)
Pregnant woman and outcome registration book 39 (78) 62 (76) 52 (90) 14 (88)
Figure 4.10 Average health post catchment population, by region (N=202)
0 1,000 2,000 3,000 4,000 5,000 6,000
Amhara
Oromia
SNNP
Tigray
Number of people
5,315
3,444
4,798
5,030
RESULTS - HEALTH SYSTEM STATUS
Community Based Newborn Care baseline survey report 31ideas.lshtm.ac.uk
Figure 4.11 Average number of households in a health post catchment
area, by region (N=200)
Figure 4.12 Average family size per household in a health post
catchment area, by region (N=198)
Figure 4.13 Average number of women of reproductive age in a health
post catchment area, by region (N=152)
Figure 4.14 Average number of women of reproductive age per
household in a health post catchment area, by region (N= 151)
0 200 400 600 800 1,000 1,200
Amhara
Oromia
SNNP
Tigray
Number of households
1,193
764
1,021
1,109
0 1 2 3 4 5
Amhara
Oromia
SNNP
Tigray
Number of people/household
4.5
4.8
4.7
4.5
0 300 600 900 1,200 1,500
Amhara
Oromia
SNNP
Tigray
Number of women of reproductive age
1,151
658
1,298
1,269
0.0 0.2 0.4 0.6 0.8 1.0 1.2 1.4
Amhara
Oromia
SNNP
Tigray
Number of women of reproductive age/household
1.1
0.8
1.3
1.2
RESULTS - HEALTH SYSTEM STATUS
32 Community Based Newborn Care baseline survey report ideas.lshtm.ac.uk
4.2.2 Equipment, supplies and
medicine
As shown in Table 4.5, this survey
assessed the availability of equipment,
supplies and medicine necessary to
provide basic MNH care services at the health post. Around 60% of health posts had blood pressure cuffs and examination couches, while only 35% had curtains for privacy. Sixty-eight
percent had a digital thermometer and 64% had a stethoscope and infant scale. A weighing sling was available in 81% of health posts and 35% had a clock. With respect to supplies, clean gloves were available in 64% of the health posts and 80% had syringes with needles.
As part of the CBNC programme, a sick neonate identified by a HEW is to be given a pre-referral amoxicillin
tablet and gentamycin injection and is
then referred urgently to a hospital or
the health centre. When a referral is
not possible, a HEW treats a sick
neonate with amoxicillin and
gentamycin for seven days.
Thirteen percent of health posts had
amoxicillin tablets which are used by
HEWs for the management of
malnutrition. A little over one-third of
health posts had TTC eye ointment.
4.2.3 Facility services routinely
offered and services utilised in the
last three months
HEWs were asked about services
provided routinely at the health post in
the last three months. In this period, 43% of health posts reported having consistently offered safe and clean
delivery with gloves, and a similar
number provided management of
hypothermia. Sixty percent provided
immediate newborn care. Postpartum
health checks for mothers and
postnatal health checks for newborns were available in 75% of the health posts. A little over 15% of health posts had provided resuscitation services
and management of pre-term or low
birth weight for neonates. Eleven
percent of health posts had provided
management for very severe neonatal
diseases (which, at the time of the
survey, entailed referral of sick
newborns to the health centre for treatment). Distribution of services provided by region is shown in Table
4.6.
Figure 4.15a-d shows the gaps
between expected and recorded service
utilisation at health post level. The
overall average for the four regions
showed that among the expected
pregnancies, over half were not
identified by the health system, and three-quarters did not receive any ANC.
Similar to health centres, the service
utilisation gap was high for optimal PNC (among expected deliveries).Figure 4.15e shows the gap in service utilisation for four ANC visits (optimal)
among women receiving any ANC,
while Figure 4.15f shows the gap in
service utilisation for four PNC visits (optimal) among women receiving any PNC. Information for both the PHCUs
as a whole and health posts are shown.
With respect to completion of optimal
ANC visits among ANC recipients,
health posts did not perform as well as
the PHCU as a whole. Conversely, with
respect to completion of optimal PNC
visits among PNC recipients, health
posts had less of a service utilisation
gap compared with the PHCU as a
whole. Overall, at the health post level,
completion of optimal PNC visits was
higher than completion of optimal
ANC visits.
43% of health posts reported having consistently
offered safe and clean delivery with gloves, and a similar
number provided management of hypothermia.”
60% of health posts
provided immediate newborn
care.”
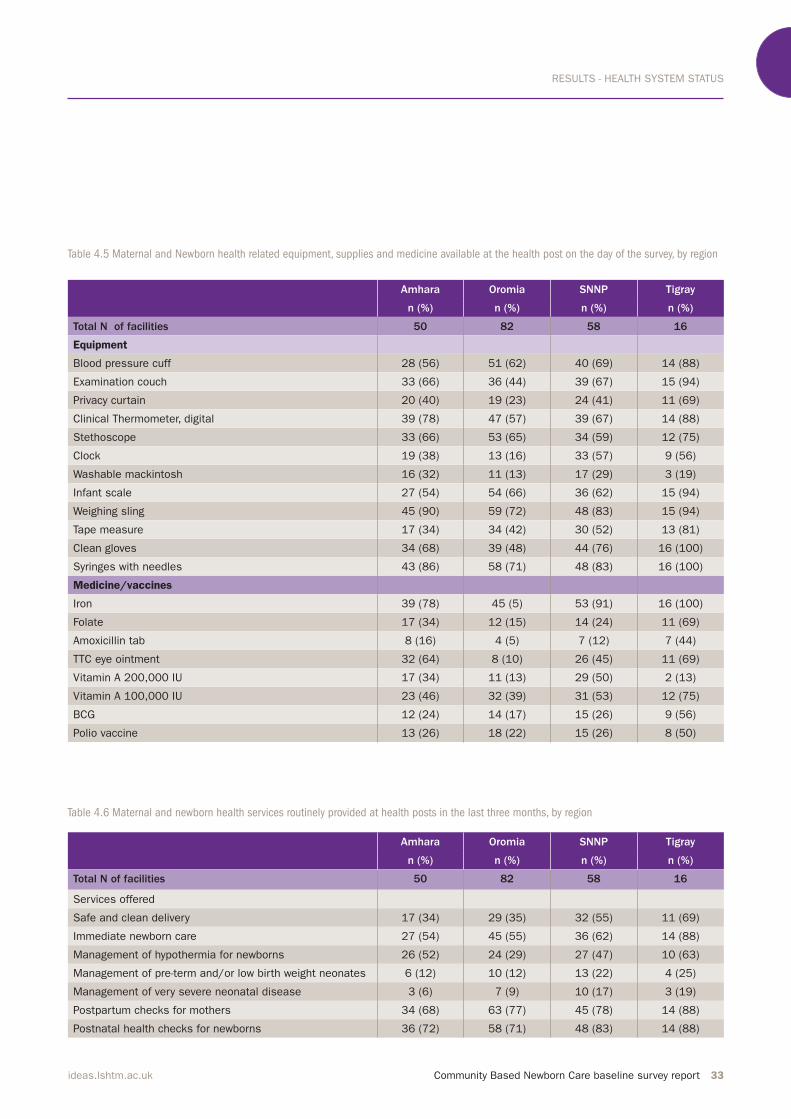
RESULTS - HEALTH SYSTEM STATUS
Community Based Newborn Care baseline survey report 33ideas.lshtm.ac.uk
Table 4.5 Maternal and Newborn health related equipment, supplies and medicine available at the health post on the day of the survey, by region
Table 4.6 Maternal and newborn health services routinely provided at health posts in the last three months, by region
Amhara Oromia SNNP Tigray
n (%) n (%) n (%) n (%)
Total N of facilities 50 82 58 16
Equipment
Blood pressure cuff 28 (56) 51 (62) 40 (69) 14 (88)
Examination couch 33 (66) 36 (44) 39 (67) 15 (94)
Privacy curtain 20 (40) 19 (23) 24 (41) 11 (69)
Clinical Thermometer, digital 39 (78) 47 (57) 39 (67) 14 (88)
Stethoscope 33 (66) 53 (65) 34 (59) 12 (75)
Clock 19 (38) 13 (16) 33 (57) 9 (56)
Washable mackintosh 16 (32) 11 (13) 17 (29) 3 (19)
Infant scale 27 (54) 54 (66) 36 (62) 15 (94)
Weighing sling 45 (90) 59 (72) 48 (83) 15 (94)
Tape measure 17 (34) 34 (42) 30 (52) 13 (81)
Clean gloves 34 (68) 39 (48) 44 (76) 16 (100)
Syringes with needles 43 (86) 58 (71) 48 (83) 16 (100)
Medicine/vaccines
Iron 39 (78) 45 (5) 53 (91) 16 (100)
Folate 17 (34) 12 (15) 14 (24) 11 (69)
Amoxicillin tab 8 (16) 4 (5) 7 (12) 7 (44)
TTC eye ointment 32 (64) 8 (10) 26 (45) 11 (69)
Vitamin A 200,000 IU 17 (34) 11 (13) 29 (50) 2 (13)
Vitamin A 100,000 IU 23 (46) 32 (39) 31 (53) 12 (75)
BCG 12 (24) 14 (17) 15 (26) 9 (56)
Polio vaccine 13 (26) 18 (22) 15 (26) 8 (50)
Amhara Oromia SNNP Tigray
n (%) n (%) n (%) n (%)
Total N of facilities 50 82 58 16
Services offered
Safe and clean delivery 17 (34) 29 (35) 32 (55) 11 (69)
Immediate newborn care 27 (54) 45 (55) 36 (62) 14 (88)
Management of hypothermia for newborns 26 (52) 24 (29) 27 (47) 10 (63)
Management of pre-term and/or low birth weight neonates 6 (12) 10 (12) 13 (22) 4 (25)
Management of very severe neonatal disease 3 (6) 7 (9) 10 (17) 3 (19)
Postpartum checks for mothers 34 (68) 63 (77) 45 (78) 14 (88)
Postnatal health checks for newborns 36 (72) 58 (71) 48 (83) 14 (88)

RESULTS - HEALTH SYSTEM STATUS
34 Community Based Newborn Care baseline survey report ideas.lshtm.ac.uk
Figure 4.15a Service utilisation gap across the continuum of care in
Amhara health posts
Figure 4.15b Service utilisation gap across the continuum of care in
Oromia health posts
Figure 4.15c Service utilisation gap across the continuum of care in
SNNP health posts
Figure 4.15d Service utilisation gap across the continuum of care in
Tigray health posts
20
40
60
80
100
0
20
40
60
80
100
61%
76%
93% 88%96%
Antenatal Postnatal
Identi
�ed?
Any
AN
C v
isit
s?
Four
AN
C v
isit
s?
Any
PN
C v
isit
s?
Four
PN
C v
isit
s?
% Y
es
% N
o
Among expected
pregnanciesAmong expected
deliveries
39%
4%
7% 12%4%
Birth
0
20
40
60
80
100
20
40
60
80
100
22%
54%
84%90%
98%
80%93%
16%10%
2%
20%7%
Antenatal Postnatal
Identi
�ed?
Any
AN
C v
isit
s?
Four
AN
C v
isit
s?
Any
PN
C v
isit
s?
Four
PN
C v
isit
s?
% Y
es
% N
o
Among expected
pregnanciesAmong expected
deliveries
Birth
0
20
40
60
80
100
20
40
60
80
100
47%
73%
93%84%
93%
53%
27%
7%16%
7%
Antenatal Postnatal
Identi
�ed?
Any
AN
C v
isit
s?
Four
AN
C v
isit
s?
Any
PN
C v
isit
s?
Four
PN
C v
isit
s?
% Y
es
% N
o
Among expected
pregnanciesAmong expected
deliveries
Birth
0
20
40
60
80
100
20
40
60
80
100
31%
63%
90%
61%
81%
69%
37%
10%
39%
19%
Antenatal Postnatal
Identi
�ed?
Any
AN
C v
isit
s?
Four
AN
C v
isit
s?
Any
PN
C v
isit
s?
Four
PN
C v
isit
s?
% Y
es
% N
o
Among expected
pregnanciesAmong expected
deliveries
Birth

RESULTS - HEALTH SYSTEM STATUS
Community Based Newborn Care baseline survey report 35ideas.lshtm.ac.uk
Figure 4.15e Service utilisation gap in the recommend ANC visits among those receiving any ANC in health posts and PHCUs, by region
Figure 4.15f Service utilisation gap in the recommend PNC visits among those receiving any PNC in health posts and PHCUs, by region
20
40
60
80
100
0
20
40
60
80
100
4 o
r m
ore
AN
C v
isit
s
Amhara
health
centres
Amhara
health
posts
Oromia
health
centres
Oromia
health
posts
SNNP
health
centres
SNNP
health
posts
Tigray
health
centres
Tigray
health
posts
Les
than 4
AN
C v
isit
s
53%
71%76% 78%
46%
74%
85%
72%
%
47%
24% 22%29%
54%
26%
15%
28%
0
20
40
60
80
100
20
40
60
80
100
4 o
r m
ore
PN
C v
isit
s
Amhara
health
centres
Amhara
health
posts
Oromia
health
centres
Oromia
health
posts
SNNP
health
centres
SNNP
health
posts
Tigray
health
centres
Tigray
health
posts
Less
than 4
PN
C v
isit
s
65% 67%73%
67%
55% 56%
90%
52%
%
35%
33%27%
34%
45% 44%
10%
48%
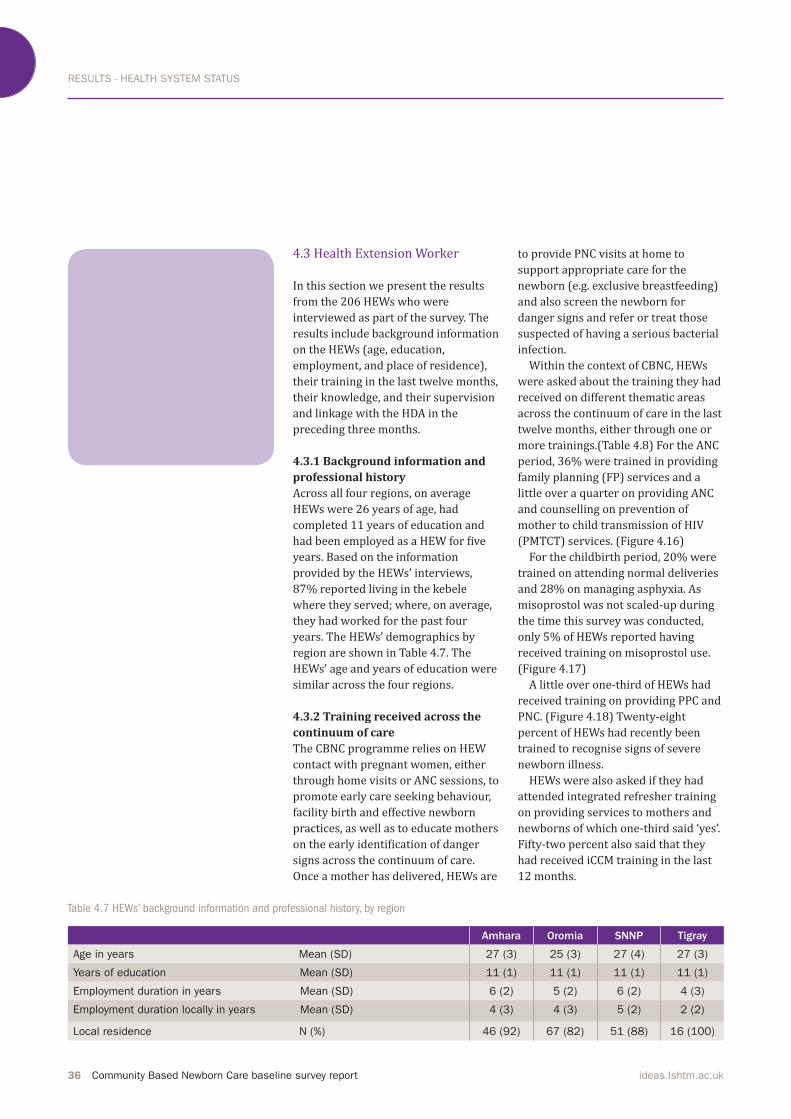
RESULTS - HEALTH SYSTEM STATUS
36 Community Based Newborn Care baseline survey report ideas.lshtm.ac.uk
4.3 Health Extension Worker
In this section we present the results
from the 206 HEWs who were
interviewed as part of the survey. The
results include background information
on the HEWs (age, education, employment, and place of residence), their training in the last twelve months,
their knowledge, and their supervision
and linkage with the HDA in the
preceding three months.
4.3.1 Background information and
professional history
Across all four regions, on average
HEWs were 26 years of age, had
completed 11 years of education and had been employed as a HEW for five years. Based on the information
provided by the HEWs’ interviews, 87% reported living in the kebele where they served; where, on average,
they had worked for the past four
years. The HEWs’ demographics by
region are shown in Table 4.7. The
HEWs’ age and years of education were
similar across the four regions.
4.3.2 Training received across the
continuum of care
The CBNC programme relies on HEW
contact with pregnant women, either
through home visits or ANC sessions, to
promote early care seeking behaviour,
facility birth and effective newborn
practices, as well as to educate mothers on the early identification of danger signs across the continuum of care.
Once a mother has delivered, HEWs are
Table 4.7 HEWs’ background information and professional history, by region
to provide PNC visits at home to
support appropriate care for the newborn (e.g. exclusive breastfeeding) and also screen the newborn for
danger signs and refer or treat those
suspected of having a serious bacterial
infection.
Within the context of CBNC, HEWs
were asked about the training they had
received on different thematic areas
across the continuum of care in the last
twelve months, either through one or more trainings.(Table 4.8) For the ANC period, 36% were trained in providing family planning (FP) services and a little over a quarter on providing ANC
and counselling on prevention of
mother to child transmission of HIV (PMTCT) services. (Figure 4.16)For the childbirth period, 20% were trained on attending normal deliveries and 28% on managing asphyxia. As misoprostol was not scaled-up during
the time this survey was conducted, only 5% of HEWs reported having received training on misoprostol use.(Figure 4.17)
A little over one-third of HEWs had
received training on providing PPC and PNC. (Figure 4.18) Twenty-eight percent of HEWs had recently been
trained to recognise signs of severe
newborn illness.
HEWs were also asked if they had
attended integrated refresher training
on providing services to mothers and
newborns of which one-third said ‘yes’.
Fifty-two percent also said that they
had received iCCM training in the last
12 months.
Amhara Oromia SNNP Tigray
Age in years Mean (SD) 27 (3) 25 (3) 27 (4) 27 (3)
Years of education Mean (SD) 11 (1) 11 (1) 11 (1) 11 (1)
Employment duration in years Mean (SD) 6 (2) 5 (2) 6 (2) 4 (3)
Employment duration locally in years Mean (SD) 4 (3) 4 (3) 5 (2) 2 (2)
Local residence N (%) 46 (92) 67 (82) 51 (88) 16 (100)
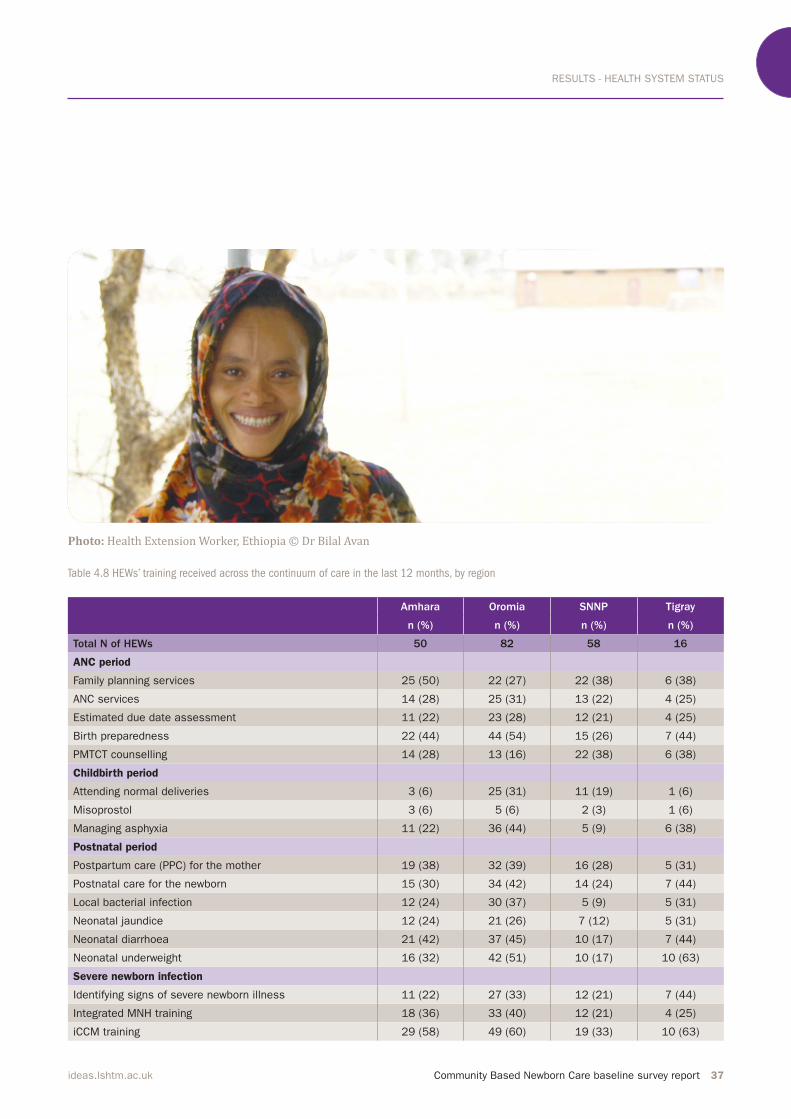
RESULTS - HEALTH SYSTEM STATUS
Community Based Newborn Care baseline survey report 37ideas.lshtm.ac.uk
Table 4.8 HEWs’ training received across the continuum of care in the last 12 months, by region
Amhara Oromia SNNP Tigray
n (%) n (%) n (%) n (%)
Total N of HEWs 50 82 58 16
ANC period
Family planning services 25 (50) 22 (27) 22 (38) 6 (38)
ANC services 14 (28) 25 (31) 13 (22) 4 (25)
Estimated due date assessment 11 (22) 23 (28) 12 (21) 4 (25)
Birth preparedness 22 (44) 44 (54) 15 (26) 7 (44)
PMTCT counselling 14 (28) 13 (16) 22 (38) 6 (38)
Childbirth period
Attending normal deliveries 3 (6) 25 (31) 11 (19) 1 (6)
Misoprostol 3 (6) 5 (6) 2 (3) 1 (6)
Managing asphyxia 11 (22) 36 (44) 5 (9) 6 (38)
Postnatal period
Postpartum care (PPC) for the mother 19 (38) 32 (39) 16 (28) 5 (31)
Postnatal care for the newborn 15 (30) 34 (42) 14 (24) 7 (44)
Local bacterial infection 12 (24) 30 (37) 5 (9) 5 (31)
Neonatal jaundice 12 (24) 21 (26) 7 (12) 5 (31)
Neonatal diarrhoea 21 (42) 37 (45) 10 (17) 7 (44)
Neonatal underweight 16 (32) 42 (51) 10 (17) 10 (63)
Severe newborn infection
Identifying signs of severe newborn illness 11 (22) 27 (33) 12 (21) 7 (44)
Integrated MNH training 18 (36) 33 (40) 12 (21) 4 (25)
iCCM training 29 (58) 49 (60) 19 (33) 10 (63)
Photo: Health Extension Worker, Ethiopia © Dr Bilal Avan
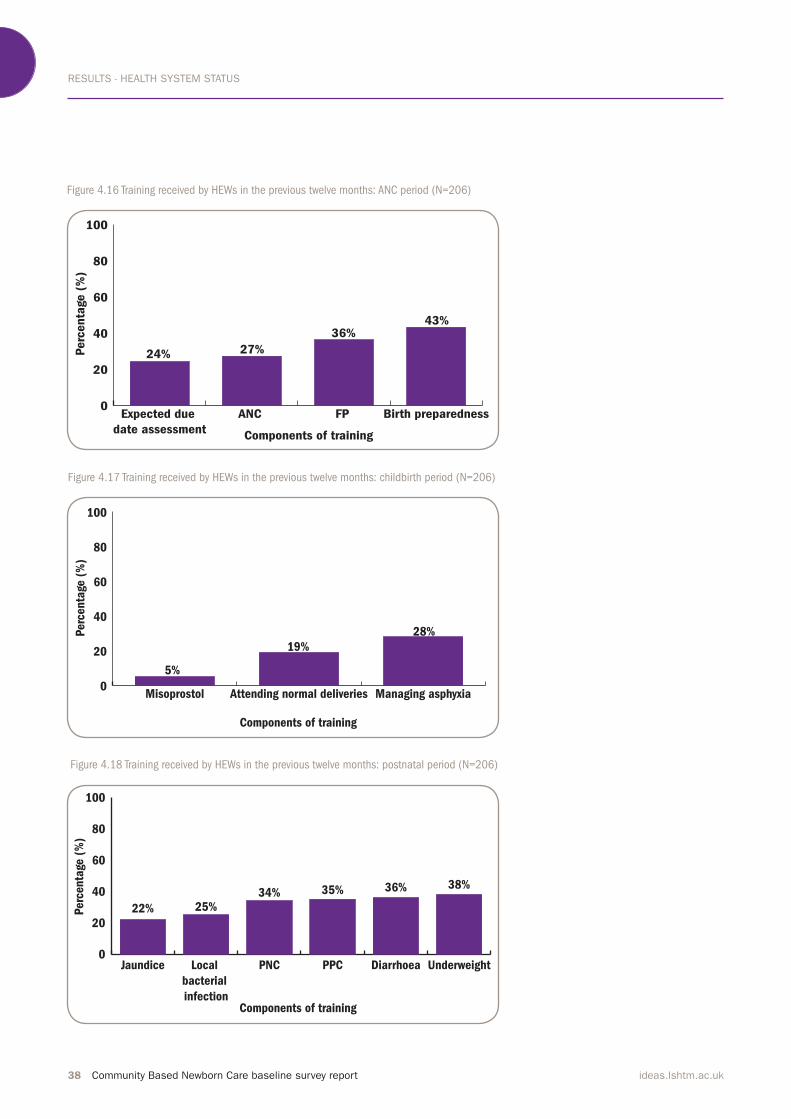
RESULTS - HEALTH SYSTEM STATUS
38 Community Based Newborn Care baseline survey report ideas.lshtm.ac.uk
Figure 4.16 Training received by HEWs in the previous twelve months: ANC period (N=206)
Figure 4.17 Training received by HEWs in the previous twelve months: childbirth period (N=206)
Figure 4.18 Training received by HEWs in the previous twelve months: postnatal period (N=206)
0
20
40
60
80
100
Birth preparednessFP ANC Expected due
date assessmentComponents of training
27%
36%
24%Perc
enta
ge (
%)
43%
0
20
40
60
80
100
Managing asphyxiaAttending normal deliveriesMisoprostol
Components of training
19%
28%
5%
Perc
enta
ge (
%)
0
20
40
60
80
100
UnderweightDiarrhoeaPPCPNCLocal
bacterial
infection
Jaundice
Components of training
22%
36%
Perc
enta
ge (
%)
25%34% 35% 38%
RESULTS - HEALTH SYSTEM STATUS
Community Based Newborn Care baseline survey report 39ideas.lshtm.ac.uk
4.3.3 HEW knowledge
HEWs were asked about their
unprompted knowledge on elements of
ANC, childbirth care and care in the
postnatal period as well as providing
general care to newborns and
management of newborns with
illnesses.
For the ANC period, Figure 4.19 shows that over 60% had unprompted knowledge of the five key components of focused ANC (minimum of four consultations, first consultation at health centre, birth plan, institutional delivery and nutrition education). Less
than 50% had unprompted knowledge about promoting awareness of danger
signs, breastfeeding and family
planning.
Table 4.9a shows HEWs’ knowledge of the key components of the first ANC visit for each region. Across all four
regions, the majority of HEWs cited
measuring blood pressure and weight (78% and 72%, respectively). Around 60% had unprompted knowledge of assessing pregnancy related danger
signs and nutrition, and providing iron, folate and Tetanus toxoid (TT) vaccines. Approximately 45% of HEWs cited encouraging mothers to visit a health centre during the first trimester. Promotion of birth preparedness and
complication readiness, and linking
pregnant mothers with their respective
HDA network leaders was cited by
one-third of HEWs. As part of
subsequent ANC visits, over 80% of HEWs cited monitoring weight gain, and over 60% said promotion of iron and folate use, as well as monitoring
for pregnancy-related danger signs.
With respect to knowledge of
pregnancy-related danger signs, the
majority of HEWs named vaginal
bleeding and headache, dizziness or blurred vision (72% and 75%, respectively). Around 60% had knowledge of fever and convulsion/
unconsciousness as danger signs.
Severe abdominal pain, offensive
discharge from the birth canal and
swollen hands and face were cited by 55% of HEWs. For the childbirth period, HEWs’
knowledge around monitoring
progress in labour was assessed.
Around half the HEWs had unprompted
knowledge of monitoring maternal
blood pressure and foetal heartbeat (54% and 50%, respectively). Less than half named monitoring maternal
temperature, pulse, degree of moulding
and dilation of the cervix. Around
one-third cited uterine contraction and the colour of the amniotic fluid. With respect to knowledge of danger
signs in the postnatal period, almost all the HEWs cited vaginal bleeding (96%) and 68% also named severe headache. Around 60% cited severe abdominal pain and fever. Only one-quarter had
unprompted knowledge of severe calf
pain.
On components of a postpartum visit, 71% of HEWs mentioned nutrition education and 65% mentioned checking for danger signs.
Measurement of body temperature and
education on family planning were cited by around half the HEWs (52% and 53%, respectively), and 45% knew they should provide contraceptives.
Provision of TT vaccination and vitamin A were mentioned by 40% of HEWs, and 38% said they should encourage the use of iron tablets. As part of subsequent PNC visits, 74% of HEWs mentioned educating mothers on nutrition. Around 70% cited the need for assessing breastfeeding and
educating on family planning.
Unprompted HEW knowledge around
maternal care during pregnancy,
delivery and the postpartum period by
region is shown in Table 4.9a.
With respect to immediate newborn
care, the most frequently cited aspects
were keeping the baby dry and wrapped (84%) and initiating breastfeeding (81%). Although 73% named tying and cutting the cord, only 46% cited delay of cord clamping for three minutes. Around 65% mentioned delivering the baby onto the mother’s
abdomen and assessing breathing. Skin
to skin contact, weighing the baby and
applying TTC eye ointment were cited by around 55% of HEWs.As part of CBNC it is expected that
mothers and their newborns are
provided with comprehensive PPC (day 1, 3 and 7, and week 6) and PNC (day 1, 3 and 7). In this study, one-third of HEWs cited a PNC visit on the first day and one-quarter mentioned visits on
the second and third days. As part of the first PNC visit, the majority of HEWs cited promoting
exclusive breastfeeding as a key component (79%) and around 60% referenced measuring weight and
temperature. A little less than half cited
With respect to immediate newborn care, the most frequently
cited aspects were keeping the baby dry and wrapped (84%)
and initiating breastfeeding (81%).
RESULTS - HEALTH SYSTEM STATUS
40 Community Based Newborn Care baseline survey report ideas.lshtm.ac.uk
the application of TTC eye ointment,
encouraging skin to skin contact,
washing hands and delaying bathing.
Fewer than a quarter mentioned
providing, and educating on, cord care.
As part of the subsequent PNC visits, 82% cited assessing breastfeeding and 59% said educating on appropriate cord care. Checking for newborn
danger signs and ensuring that
newborns are kept warm was named by 55% and 52% of HEWs respectively. Fewer than half cited the need to check
the weight of newborns. The results of
HEWs’ unprompted knowledge on
newborn general care by region are
shown in Table 4.9b.
With respect to newborns needing
special care, HEWs’ unprompted
knowledge by region is shown in Table
4.9c. Forty percent of HEWs cited
breathing poorly as a sign of asphyxia,
and facilitating breathing through an
Ambu bag was the most frequently
cited means of managing asphyxia. A
little over half cited positioning the
newborn baby on its back and clearing
airways with gauze. Forty-three
percent said to refer to a higher facility, while fewer than 15% mentioned the need for providing follow up visits.
For care related to newborns
weighing less than 1.5 kg, over
three-quarters of HEWs said these
babies should be referred urgently to a
hospital. Half of the HEWs cited
breastfeeding with expressed milk and
monitoring the baby’s ability to
breastfeed, while less than half listed
the need to keep the newborn warm
and close to its mother. For newborns
between 1.5-2.5 kg, or 32-37 weeks, 73% of HEWs said educating on optimal breastfeeding and 63% said monitoring the baby’s ability to
breastfeed. A little over half cited the
need to ensure that baby is warm, while 30% mentioned monitoring the baby for 24 hours. Thirty-five percent cited
breastfeeding more frequently as a
component of local bacterial infection management. Only 15% said to treat with amoxicillin for five days. For severe jaundice, 60% of HEWs said they should refer urgently to a higher facility and 38% said to breastfeed with increased frequency. Fewer than 20% mentioned covering the baby and keeping it close to the mother’s body.
Seventy percent of HEWs had
unprompted knowledge of providing
milk and breastfeeding more
frequently for management of
moderate dehydration. Thirty-six
percent said to provide zinc for 10 days
and a little over a quarter mentioned
providing a follow up visit in two days. For severe dehydration, 81% said they would refer urgently to a higher facility and 74% said to provide oral rehydration solution (ORS) on the way to the facility. Sixty-three percent
mentioned breastfeeding more frequently and 36% said to advise the mother to keep the newborn warm.
The CBNC programme aims to have
HEWs give a pre-referral amoxicillin
and gentamycin dose to neonates classified as having very severe disease (sepsis) and then refer them urgently to hospital or health centre. When
referral is not possible, HEWs are to
treat the neonate with amoxicillin
dispersible tablets and gentamycin
injection for seven days. In this survey,
when asked about management of
severe newborn illness, the majority of HEWs (85%) said to refer to a higher facility, which is the management specification prior to the implementation of CBNC. A little over
half of HEWs said to continue
breastfeeding; less than a quarter
mentioned keeping the newborn’s
airways open.
For care related to newborns
weighing less than 1.5kg,
over three-quarters of
HEWs said these babies
should be referred urgently
to a hospital. Half of the
HEWs cited breastfeeding
with expressed milk and
monitoring the baby’s ability
to breastfeed, while less
than half listed the need to
keep the newborn warm and
close to its mother.”
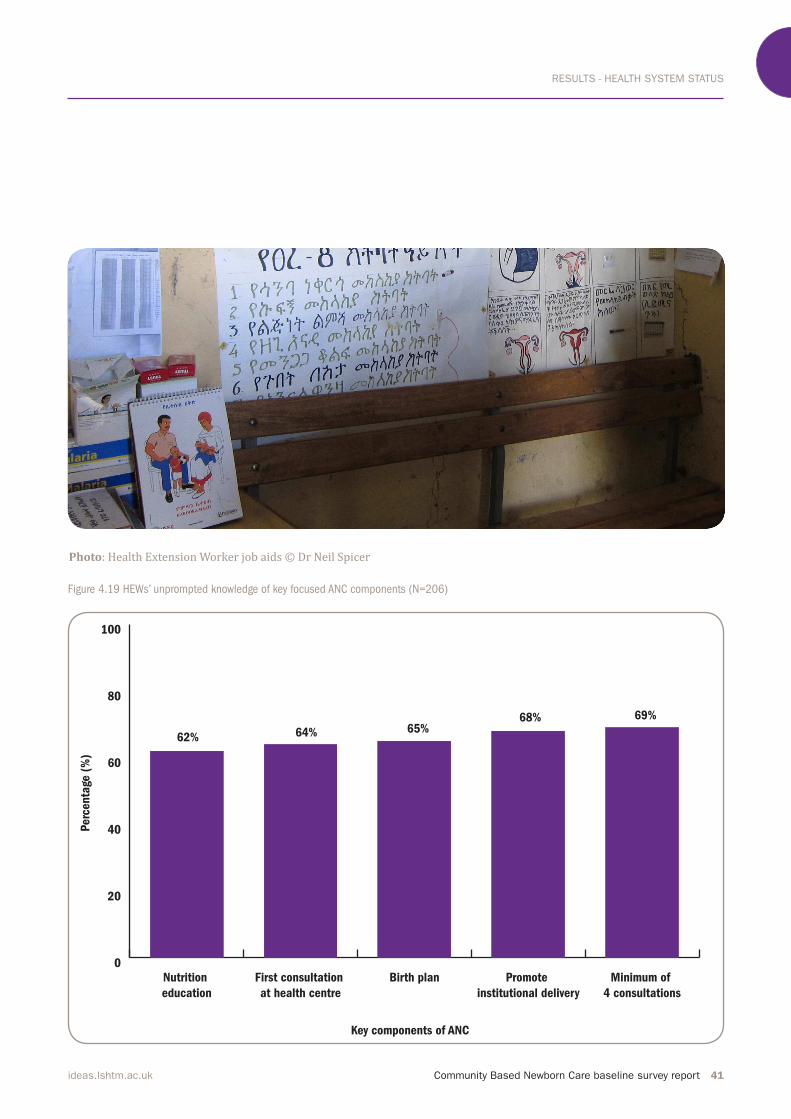
RESULTS - HEALTH SYSTEM STATUS
Community Based Newborn Care baseline survey report 41ideas.lshtm.ac.uk
Figure 4.19 HEWs’ unprompted knowledge of key focused ANC components (N=206)
0
20
40
60
80
100
Minimum of
4 consultations
Promote
institutional delivery
Birth planFirst consultation
at health centre
Nutrition
education
Key components of ANC
62%
69%
Perc
enta
ge (
%)
64% 65%68%
Photo: Health Extension Worker job aids © Dr Neil Spicer

RESULTS - HEALTH SYSTEM STATUS
42 Community Based Newborn Care baseline survey report ideas.lshtm.ac.uk
Amhara Oromia SNNP Tigray
n (%) n (%) n (%) n (%)
Total N of HEWs 50 82 58 16
Key components of focused ANC
Minimum of 4 consultations 29 (58) 62 (76) 35 (60) 16 (100)
First consultation at health centre 32 (64) 49 (60) 39 (67) 11 (69)
Birth plan 28 (56) 57 (70) 39 (67) 9 (56)
Institutional delivery 40 (80) 49 (60) 39 (67) 13 (81)
Prevent illness and promote health 32 (64) 46 (56) 35 (60) 8 (50)
Illnesses management 21 (42) 48 (59) 25 (43) 10 (63)
Danger signs 27 (54) 40 (49) 29 (50) 6 (38)
Breastfeeding 18 (36) 30 (37) 31 (53) 3 (19)
Family planning 17 (34) 32 (39) 26 (45) 4 (25)
Nutrition 32 (64) 51 (62) 34 (59) 11 (69)
Key components of first ANC Assessment
Estimating due date 34 (68) 59 (72) 37 (64) 7 (44)
Danger signs 27 (54) 46 (56) 37 (64) 10 (63)
Blood pressure 38 (76) 67 (82) 42 (72) 12 (75)
Weight 36 (72) 58 (71) 42 (72) 12 (75)
Inject TT vaccine 21 (42) 60 (73) 35 (60) 5 (31)
Provide iron and folate 28 (56) 50 (61) 36 (62) 11 (69)
Link mother with HDA network 10 (20) 26 (32) 24 (41) 2 (13)
Provide HEW number to family 7 (14) 23 (28) 18 (31) 4 (25)
Check history for past pregnancies with difficulties 17 (34) 36 (44) 25 (43) 9 (56)
Education on nutrition 27 (54) 59 (72) 26 (45) 7 (44)
Education on ITN use 10 (20) 23 (28) 18 (31) 2 (13)
Education on PMTCT 19 (38) 43 (52) 22 (38) 12 (75)
Education on HIV testing and STI 15 (30) 35 (43) 27 (47) 10 (63)
Education on birth preparedness and complication readiness 16 (32) 33 (40) 20 (35) 0 (0)
Encourage women to visit health centre during first trimester 22 (44) 37 (45) 22 (38) 5 (31)
Key components of 2nd ANC assessment and onwards
Weight 40 (80) 63 (77) 49 (85) 15 (94)
Iron and folate use 32 (64) 54 (66) 49 (85) 9 (56)
Danger signs 34 (68) 48 (59) 36 (62) 10 (63)
Signs of high risk pregnancies
Severe abdominal pain 30 (60) 47 (57) 31 (53) 7 (44)
Offensive discharge 15 (30) 54 (66) 39 (67) 10 (63)
Fever 26 (52) 47 (57) 41 (71) 11 (69)
Headache, dizziness or blurred vision 34 (68) 59 (72) 47 (81) 14 (88)
Convulsions or unconsciousness 29 (58) 52 (63) 42 (72) 8 (50)
Swollen hands and face 31 (62) 43 (52) 33 (57) 9 (56)
Vaginal bleeding 35 (70) 53 (65) 45 (78) 15 (94)
Table 4.9a HEWs’ unprompted knowledge of health provision across the continuum of care, by region: maternal
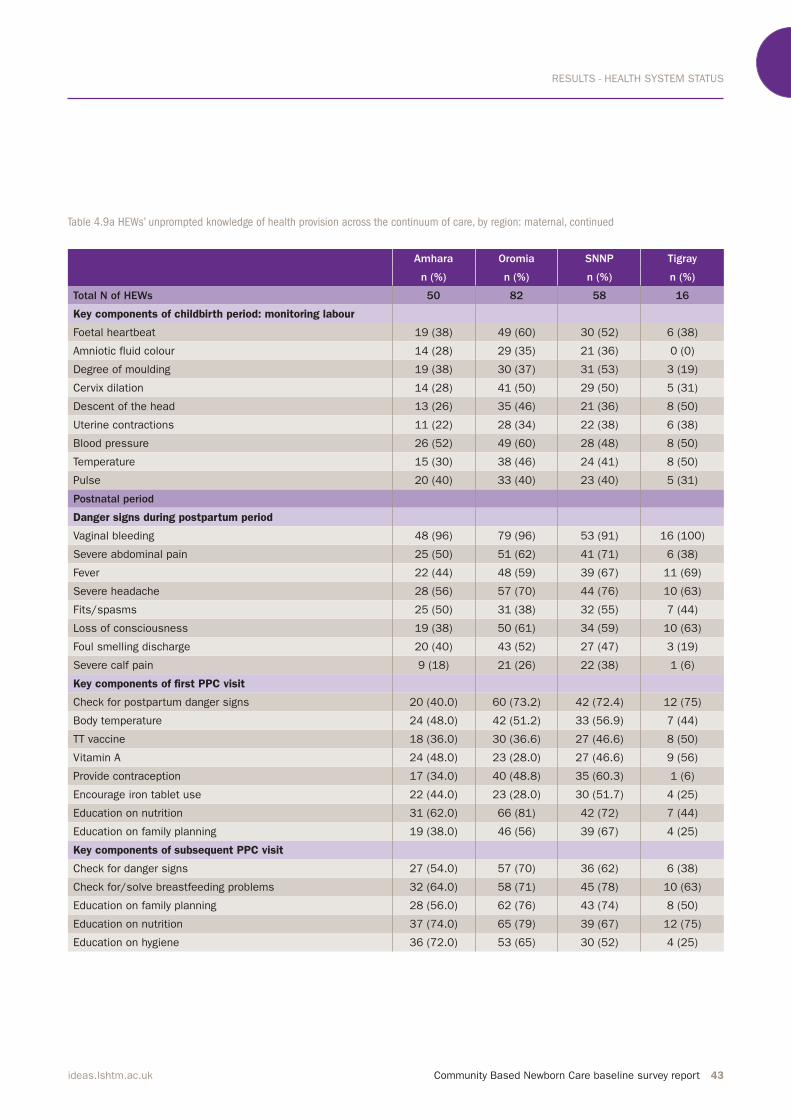
RESULTS - HEALTH SYSTEM STATUS
Community Based Newborn Care baseline survey report 43ideas.lshtm.ac.uk
Amhara Oromia SNNP Tigray
n (%) n (%) n (%) n (%)
Total N of HEWs 50 82 58 16
Key components of childbirth period: monitoring labour
Foetal heartbeat 19 (38) 49 (60) 30 (52) 6 (38)
Amniotic fluid colour 14 (28) 29 (35) 21 (36) 0 (0)
Degree of moulding 19 (38) 30 (37) 31 (53) 3 (19)
Cervix dilation 14 (28) 41 (50) 29 (50) 5 (31)
Descent of the head 13 (26) 35 (46) 21 (36) 8 (50)
Uterine contractions 11 (22) 28 (34) 22 (38) 6 (38)
Blood pressure 26 (52) 49 (60) 28 (48) 8 (50)
Temperature 15 (30) 38 (46) 24 (41) 8 (50)
Pulse 20 (40) 33 (40) 23 (40) 5 (31)
Postnatal period
Danger signs during postpartum period
Vaginal bleeding 48 (96) 79 (96) 53 (91) 16 (100)
Severe abdominal pain 25 (50) 51 (62) 41 (71) 6 (38)
Fever 22 (44) 48 (59) 39 (67) 11 (69)
Severe headache 28 (56) 57 (70) 44 (76) 10 (63)
Fits/spasms 25 (50) 31 (38) 32 (55) 7 (44)
Loss of consciousness 19 (38) 50 (61) 34 (59) 10 (63)
Foul smelling discharge 20 (40) 43 (52) 27 (47) 3 (19)
Severe calf pain 9 (18) 21 (26) 22 (38) 1 (6)
Key components of first PPC visit
Check for postpartum danger signs 20 (40.0) 60 (73.2) 42 (72.4) 12 (75)
Body temperature 24 (48.0) 42 (51.2) 33 (56.9) 7 (44)
TT vaccine 18 (36.0) 30 (36.6) 27 (46.6) 8 (50)
Vitamin A 24 (48.0) 23 (28.0) 27 (46.6) 9 (56)
Provide contraception 17 (34.0) 40 (48.8) 35 (60.3) 1 (6)
Encourage iron tablet use 22 (44.0) 23 (28.0) 30 (51.7) 4 (25)
Education on nutrition 31 (62.0) 66 (81) 42 (72) 7 (44)
Education on family planning 19 (38.0) 46 (56) 39 (67) 4 (25)
Key components of subsequent PPC visit
Check for danger signs 27 (54.0) 57 (70) 36 (62) 6 (38)
Check for/solve breastfeeding problems 32 (64.0) 58 (71) 45 (78) 10 (63)
Education on family planning 28 (56.0) 62 (76) 43 (74) 8 (50)
Education on nutrition 37 (74.0) 65 (79) 39 (67) 12 (75)
Education on hygiene 36 (72.0) 53 (65) 30 (52) 4 (25)
Table 4.9a HEWs’ unprompted knowledge of health provision across the continuum of care, by region: maternal, continued
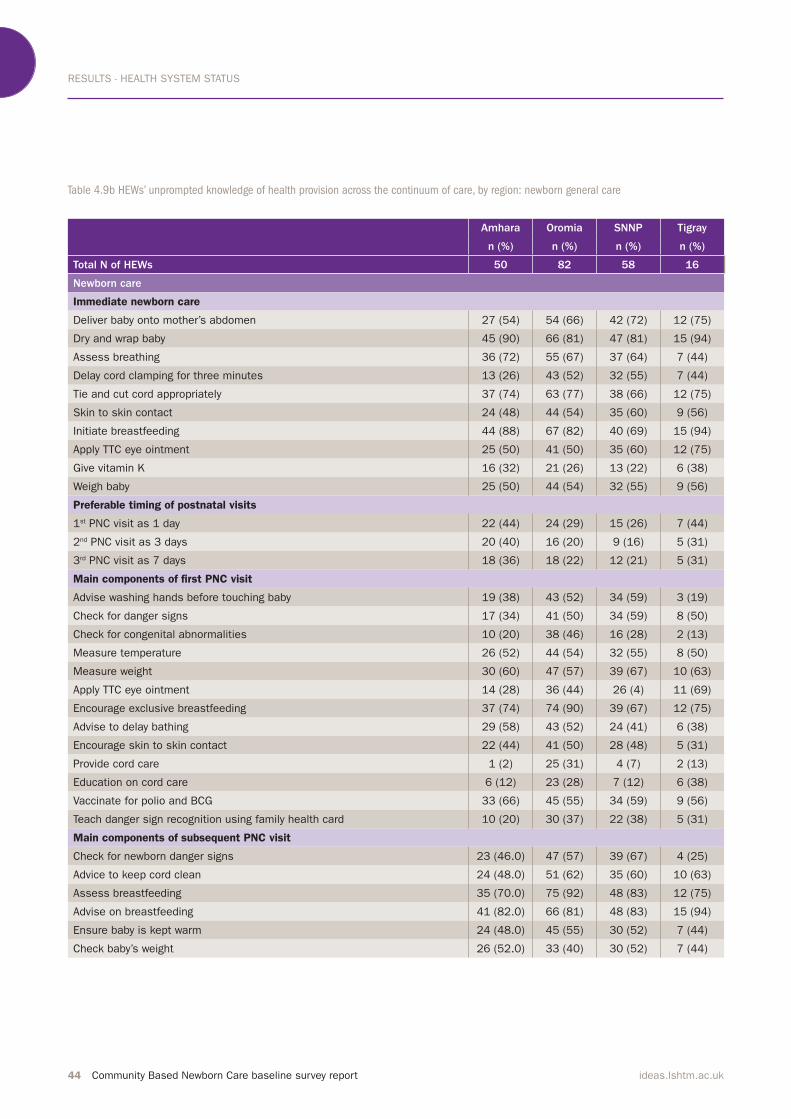
RESULTS - HEALTH SYSTEM STATUS
44 Community Based Newborn Care baseline survey report ideas.lshtm.ac.uk
Table 4.9b HEWs’ unprompted knowledge of health provision across the continuum of care, by region: newborn general care
Amhara Oromia SNNP Tigray
n (%) n (%) n (%) n (%)
Total N of HEWs 50 82 58 16
Newborn care
Immediate newborn care
Deliver baby onto mother’s abdomen 27 (54) 54 (66) 42 (72) 12 (75)
Dry and wrap baby 45 (90) 66 (81) 47 (81) 15 (94)
Assess breathing 36 (72) 55 (67) 37 (64) 7 (44)
Delay cord clamping for three minutes 13 (26) 43 (52) 32 (55) 7 (44)
Tie and cut cord appropriately 37 (74) 63 (77) 38 (66) 12 (75)
Skin to skin contact 24 (48) 44 (54) 35 (60) 9 (56)
Initiate breastfeeding 44 (88) 67 (82) 40 (69) 15 (94)
Apply TTC eye ointment 25 (50) 41 (50) 35 (60) 12 (75)
Give vitamin K 16 (32) 21 (26) 13 (22) 6 (38)
Weigh baby 25 (50) 44 (54) 32 (55) 9 (56)
Preferable timing of postnatal visits
1st PNC visit as 1 day 22 (44) 24 (29) 15 (26) 7 (44)
2nd PNC visit as 3 days 20 (40) 16 (20) 9 (16) 5 (31)
3rd PNC visit as 7 days 18 (36) 18 (22) 12 (21) 5 (31)
Main components of first PNC visit
Advise washing hands before touching baby 19 (38) 43 (52) 34 (59) 3 (19)
Check for danger signs 17 (34) 41 (50) 34 (59) 8 (50)
Check for congenital abnormalities 10 (20) 38 (46) 16 (28) 2 (13)
Measure temperature 26 (52) 44 (54) 32 (55) 8 (50)
Measure weight 30 (60) 47 (57) 39 (67) 10 (63)
Apply TTC eye ointment 14 (28) 36 (44) 26 (4) 11 (69)
Encourage exclusive breastfeeding 37 (74) 74 (90) 39 (67) 12 (75)
Advise to delay bathing 29 (58) 43 (52) 24 (41) 6 (38)
Encourage skin to skin contact 22 (44) 41 (50) 28 (48) 5 (31)
Provide cord care 1 (2) 25 (31) 4 (7) 2 (13)
Education on cord care 6 (12) 23 (28) 7 (12) 6 (38)
Vaccinate for polio and BCG 33 (66) 45 (55) 34 (59) 9 (56)
Teach danger sign recognition using family health card 10 (20) 30 (37) 22 (38) 5 (31)
Main components of subsequent PNC visit
Check for newborn danger signs 23 (46.0) 47 (57) 39 (67) 4 (25)
Advice to keep cord clean 24 (48.0) 51 (62) 35 (60) 10 (63)
Assess breastfeeding 35 (70.0) 75 (92) 48 (83) 12 (75)
Advise on breastfeeding 41 (82.0) 66 (81) 48 (83) 15 (94)
Ensure baby is kept warm 24 (48.0) 45 (55) 30 (52) 7 (44)
Check baby’s weight 26 (52.0) 33 (40) 30 (52) 7 (44)
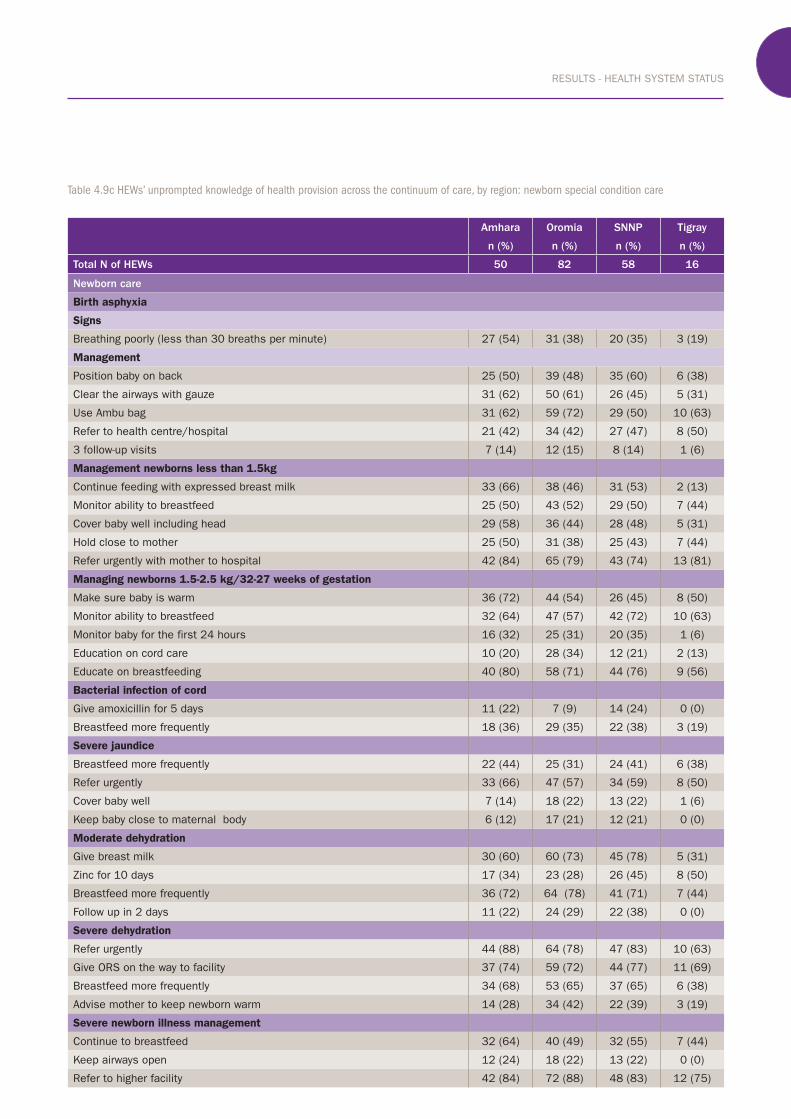
RESULTS - HEALTH SYSTEM STATUS
Community Based Newborn Care baseline survey report 45ideas.lshtm.ac.uk
Table 4.9c HEWs’ unprompted knowledge of health provision across the continuum of care, by region: newborn special condition care
Amhara Oromia SNNP Tigray
n (%) n (%) n (%) n (%)
Total N of HEWs 50 82 58 16
Newborn care
Birth asphyxia
Signs
Breathing poorly (less than 30 breaths per minute) 27 (54) 31 (38) 20 (35) 3 (19)
Management
Position baby on back 25 (50) 39 (48) 35 (60) 6 (38)
Clear the airways with gauze 31 (62) 50 (61) 26 (45) 5 (31)
Use Ambu bag 31 (62) 59 (72) 29 (50) 10 (63)
Refer to health centre/hospital 21 (42) 34 (42) 27 (47) 8 (50)
3 follow-up visits 7 (14) 12 (15) 8 (14) 1 (6)
Management newborns less than 1.5kg
Continue feeding with expressed breast milk 33 (66) 38 (46) 31 (53) 2 (13)
Monitor ability to breastfeed 25 (50) 43 (52) 29 (50) 7 (44)
Cover baby well including head 29 (58) 36 (44) 28 (48) 5 (31)
Hold close to mother 25 (50) 31 (38) 25 (43) 7 (44)
Refer urgently with mother to hospital 42 (84) 65 (79) 43 (74) 13 (81)
Managing newborns 1.5-2.5 kg/32-27 weeks of gestation
Make sure baby is warm 36 (72) 44 (54) 26 (45) 8 (50)
Monitor ability to breastfeed 32 (64) 47 (57) 42 (72) 10 (63)
Monitor baby for the first 24 hours 16 (32) 25 (31) 20 (35) 1 (6)
Education on cord care 10 (20) 28 (34) 12 (21) 2 (13)
Educate on breastfeeding 40 (80) 58 (71) 44 (76) 9 (56)
Bacterial infection of cord
Give amoxicillin for 5 days 11 (22) 7 (9) 14 (24) 0 (0)
Breastfeed more frequently 18 (36) 29 (35) 22 (38) 3 (19)
Severe jaundice
Breastfeed more frequently 22 (44) 25 (31) 24 (41) 6 (38)
Refer urgently 33 (66) 47 (57) 34 (59) 8 (50)
Cover baby well 7 (14) 18 (22) 13 (22) 1 (6)
Keep baby close to maternal body 6 (12) 17 (21) 12 (21) 0 (0)
Moderate dehydration
Give breast milk 30 (60) 60 (73) 45 (78) 5 (31)
Zinc for 10 days 17 (34) 23 (28) 26 (45) 8 (50)
Breastfeed more frequently 36 (72) 64 (78) 41 (71) 7 (44)
Follow up in 2 days 11 (22) 24 (29) 22 (38) 0 (0)
Severe dehydration
Refer urgently 44 (88) 64 (78) 47 (83) 10 (63)
Give ORS on the way to facility 37 (74) 59 (72) 44 (77) 11 (69)
Breastfeed more frequently 34 (68) 53 (65) 37 (65) 6 (38)
Advise mother to keep newborn warm 14 (28) 34 (42) 22 (39) 3 (19)
Severe newborn illness management
Continue to breastfeed 32 (64) 40 (49) 32 (55) 7 (44)
Keep airways open 12 (24) 18 (22) 13 (22) 0 (0)
Refer to higher facility 42 (84) 72 (88) 48 (83) 12 (75)
RESULTS - HEALTH SYSTEM STATUS
46 Community Based Newborn Care baseline survey report ideas.lshtm.ac.uk
4.3.4 Supervision
The CBNC programme relies on the
existing weekly supervisory visits of
health centre staff to the health posts to provide CBNC-specific technical support.In this survey, 82% of HEWs had received supportive supervision in the
three months prior to the survey.(Table 4.10) Among those that received supervision, 86% reported visits from health centres and half from woreda health offices. On average, HEWs received five supervisory visits in the previous three months. Less than half
the HEWs reported that the
supervisory visits covered discussions
on newborn special condition care; for
example management of very severe disease was discussed with 41% of HEWs.
HEWs were also asked about iCCM specific supportive supervision: 45% reported a visit in the previous three
months. These were mainly conducted
by the health centres and woreda health offices. 4.3.5 HEW linkage with the HDA in
the last three months
HEWs and HDA leaders play an
important role in the CBNC
programme. The HEWs are supported
by HDA leaders, who are voluntary
community health promoters. Each
HDA leader is networked with up to five households. Four or five HDA 1-5 networks are managed by one team
leader and this linkage is referred to as
the 1-30 network, or one development
team.
Almost all HEWs reported the
presence of HDA leaders in their kebeles (98%).(Table 4.11) In the clusters that were visited there
were a mean number of 136 one-to-five networks and 24 one-to-thirty networks.
CBNC aims to further strengthen the
existing mentoring, coaching and
follow-up of HDA leaders by HEWs. In
this survey, HEWs were asked about
their links with the HDA in the previous three months. (Table 4.11) The majority of HEWs had oriented the HDA on pregnancy identification, demand generation for MNCH services
and reporting pregnancies. However,
only half the HEWs had provided
training on how to use the family
health card. Ninety percent of HEWs
reported conducting monthly meetings
with HDA leaders. With respect to
reporting from HDA leaders in the same time period, over 80% of HEWs received information on pregnant
women, deliveries and birth control
status. Only half the HEWs reported
receiving information on neonates
with danger signs.
With respect to reporting from HDA leaders...over 80% of
HEWs received information on pregnant women, deliveries
and birth control status. Only half the HEWs reported
receiving information on neonates with danger signs.”
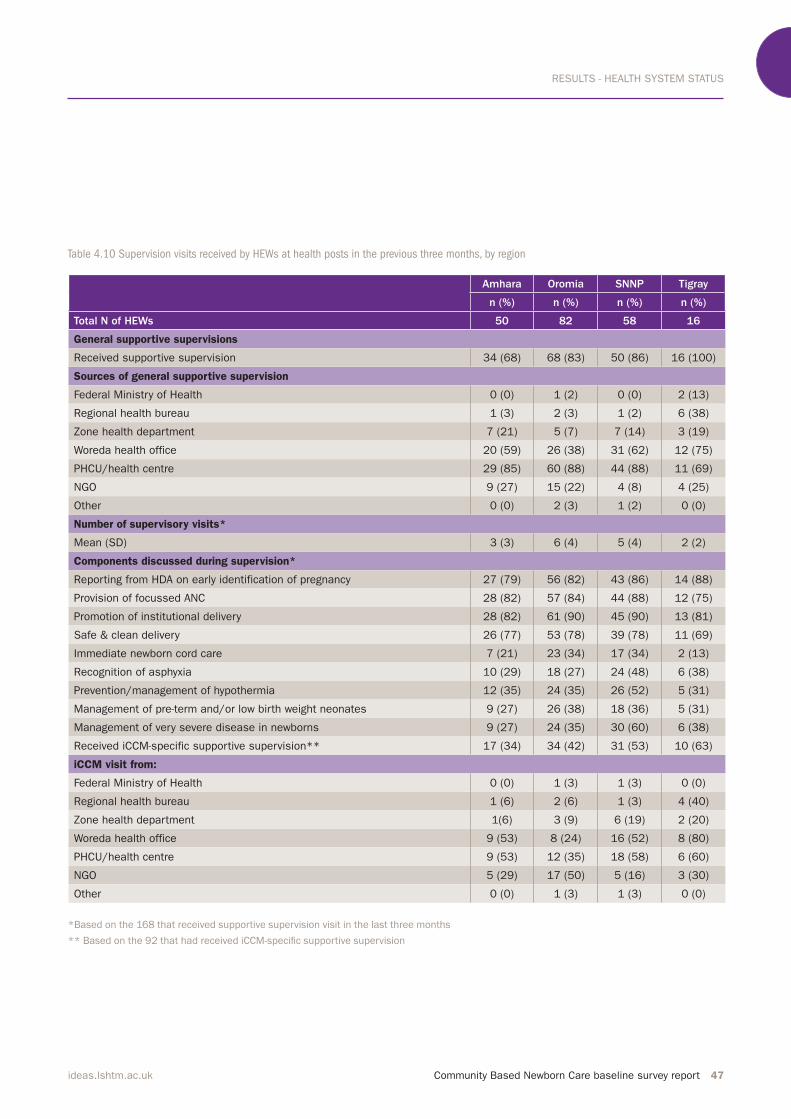
RESULTS - HEALTH SYSTEM STATUS
Community Based Newborn Care baseline survey report 47ideas.lshtm.ac.uk
Table 4.10 Supervision visits received by HEWs at health posts in the previous three months, by region
Amhara Oromia SNNP Tigray
n (%) n (%) n (%) n (%)
Total N of HEWs 50 82 58 16
General supportive supervisions
Received supportive supervision 34 (68) 68 (83) 50 (86) 16 (100)
Sources of general supportive supervision
Federal Ministry of Health 0 (0) 1 (2) 0 (0) 2 (13)
Regional health bureau 1 (3) 2 (3) 1 (2) 6 (38)
Zone health department 7 (21) 5 (7) 7 (14) 3 (19)
Woreda health office 20 (59) 26 (38) 31 (62) 12 (75)
PHCU/health centre 29 (85) 60 (88) 44 (88) 11 (69)
NGO 9 (27) 15 (22) 4 (8) 4 (25)
Other 0 (0) 2 (3) 1 (2) 0 (0)
Number of supervisory visits*
Mean (SD) 3 (3) 6 (4) 5 (4) 2 (2)
Components discussed during supervision*
Reporting from HDA on early identification of pregnancy 27 (79) 56 (82) 43 (86) 14 (88)
Provision of focussed ANC 28 (82) 57 (84) 44 (88) 12 (75)
Promotion of institutional delivery 28 (82) 61 (90) 45 (90) 13 (81)
Safe & clean delivery 26 (77) 53 (78) 39 (78) 11 (69)
Immediate newborn cord care 7 (21) 23 (34) 17 (34) 2 (13)
Recognition of asphyxia 10 (29) 18 (27) 24 (48) 6 (38)
Prevention/management of hypothermia 12 (35) 24 (35) 26 (52) 5 (31)
Management of pre-term and/or low birth weight neonates 9 (27) 26 (38) 18 (36) 5 (31)
Management of very severe disease in newborns 9 (27) 24 (35) 30 (60) 6 (38)
Received iCCM-specific supportive supervision** 17 (34) 34 (42) 31 (53) 10 (63)
iCCM visit from:
Federal Ministry of Health 0 (0) 1 (3) 1 (3) 0 (0)
Regional health bureau 1 (6) 2 (6) 1 (3) 4 (40)
Zone health department 1(6) 3 (9) 6 (19) 2 (20)
Woreda health office 9 (53) 8 (24) 16 (52) 8 (80)
PHCU/health centre 9 (53) 12 (35) 18 (58) 6 (60)
NGO 5 (29) 17 (50) 5 (16) 3 (30)
Other 0 (0) 1 (3) 1 (3) 0 (0)
*Based on the 168 that received supportive supervision visit in the last three months
** Based on the 92 that had received iCCM-speciic supportive supervision
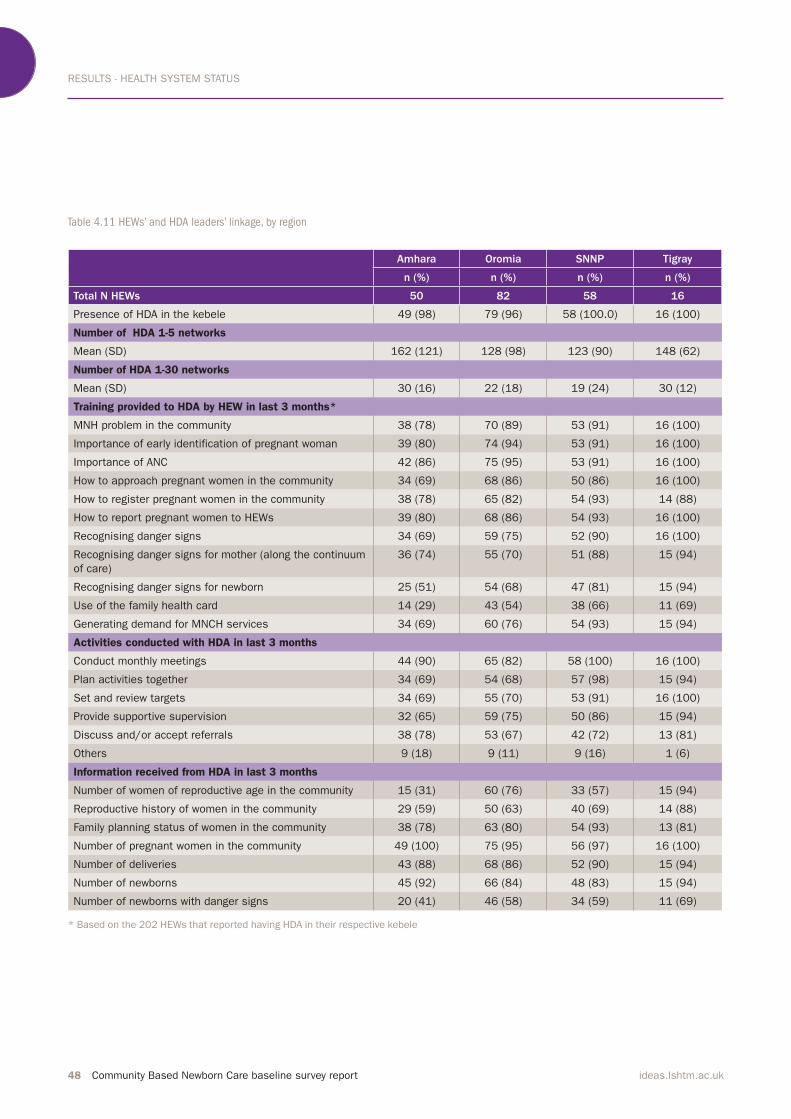
RESULTS - HEALTH SYSTEM STATUS
48 Community Based Newborn Care baseline survey report ideas.lshtm.ac.uk
Table 4.11 HEWs’ and HDA leaders’ linkage, by region
Amhara Oromia SNNP Tigray
n (%) n (%) n (%) n (%)
Total N HEWs 50 82 58 16
Presence of HDA in the kebele 49 (98) 79 (96) 58 (100.0) 16 (100)
Number of HDA 1-5 networks
Mean (SD) 162 (121) 128 (98) 123 (90) 148 (62)
Number of HDA 1-30 networks
Mean (SD) 30 (16) 22 (18) 19 (24) 30 (12)
Training provided to HDA by HEW in last 3 months*
MNH problem in the community 38 (78) 70 (89) 53 (91) 16 (100)
Importance of early identification of pregnant woman 39 (80) 74 (94) 53 (91) 16 (100)
Importance of ANC 42 (86) 75 (95) 53 (91) 16 (100)
How to approach pregnant women in the community 34 (69) 68 (86) 50 (86) 16 (100)
How to register pregnant women in the community 38 (78) 65 (82) 54 (93) 14 (88)
How to report pregnant women to HEWs 39 (80) 68 (86) 54 (93) 16 (100)
Recognising danger signs 34 (69) 59 (75) 52 (90) 16 (100)
Recognising danger signs for mother (along the continuum
of care)
36 (74) 55 (70) 51 (88) 15 (94)
Recognising danger signs for newborn 25 (51) 54 (68) 47 (81) 15 (94)
Use of the family health card 14 (29) 43 (54) 38 (66) 11 (69)
Generating demand for MNCH services 34 (69) 60 (76) 54 (93) 15 (94)
Activities conducted with HDA in last 3 months
Conduct monthly meetings 44 (90) 65 (82) 58 (100) 16 (100)
Plan activities together 34 (69) 54 (68) 57 (98) 15 (94)
Set and review targets 34 (69) 55 (70) 53 (91) 16 (100)
Provide supportive supervision 32 (65) 59 (75) 50 (86) 15 (94)
Discuss and/or accept referrals 38 (78) 53 (67) 42 (72) 13 (81)
Others 9 (18) 9 (11) 9 (16) 1 (6)
Information received from HDA in last 3 months
Number of women of reproductive age in the community 15 (31) 60 (76) 33 (57) 15 (94)
Reproductive history of women in the community 29 (59) 50 (63) 40 (69) 14 (88)
Family planning status of women in the community 38 (78) 63 (80) 54 (93) 13 (81)
Number of pregnant women in the community 49 (100) 75 (95) 56 (97) 16 (100)
Number of deliveries 43 (88) 68 (86) 52 (90) 15 (94)
Number of newborns 45 (92) 66 (84) 48 (83) 15 (94)
Number of newborns with danger signs 20 (41) 46 (58) 34 (59) 11 (69)
* Based on the 202 HEWs that reported having HDA in their respective kebele
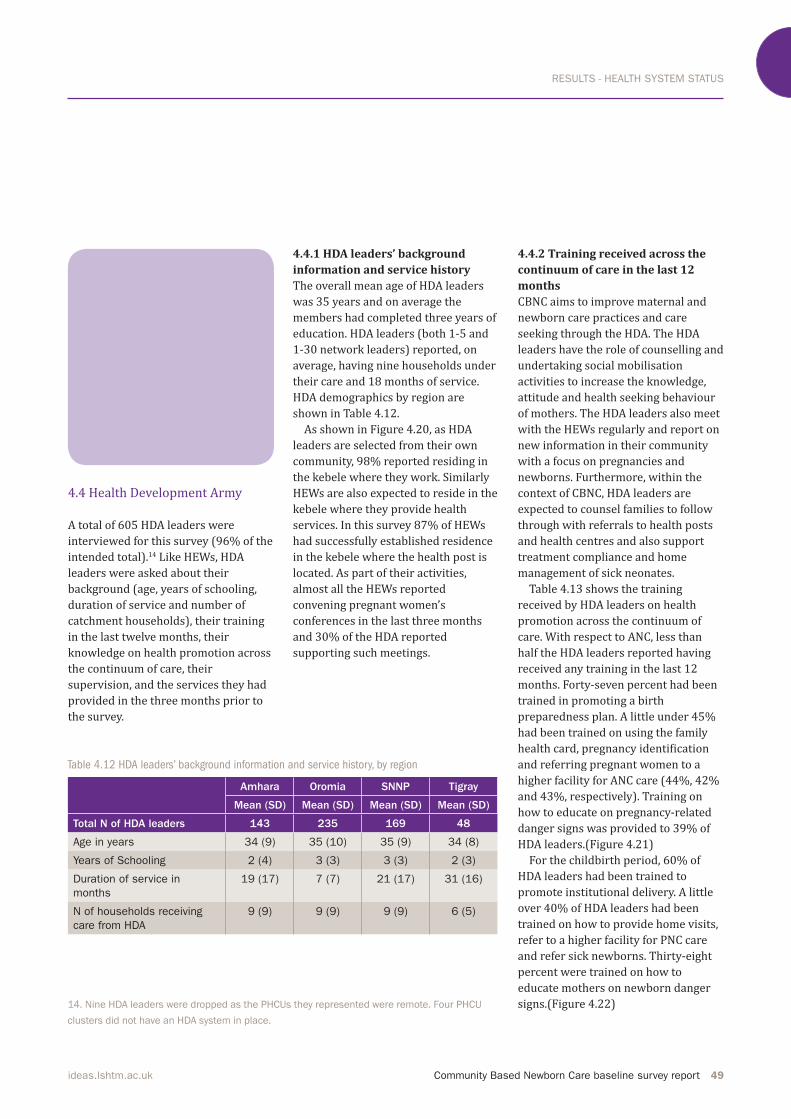
RESULTS - HEALTH SYSTEM STATUS
Community Based Newborn Care baseline survey report 49ideas.lshtm.ac.uk
4.4.1 HDA leaders’ background
information and service history
The overall mean age of HDA leaders
was 35 years and on average the
members had completed three years of
education. HDA leaders (both 1-5 and 1-30 network leaders) reported, on average, having nine households under
their care and 18 months of service.
HDA demographics by region are
shown in Table 4.12.
As shown in Figure 4.20, as HDA
leaders are selected from their own community, 98% reported residing in the kebele where they work. Similarly
HEWs are also expected to reside in the
kebele where they provide health services. In this survey 87% of HEWs had successfully established residence
in the kebele where the health post is
located. As part of their activities,
almost all the HEWs reported
convening pregnant women’s
conferences in the last three months and 30% of the HDA reported supporting such meetings.
Table 4.12 HDA leaders’ background information and service history, by region
14. Nine HDA leaders were dropped as the PHCUs they represented were remote. Four PHCU
clusters did not have an HDA system in place.
4.4.2 Training received across the
continuum of care in the last 12
months
CBNC aims to improve maternal and
newborn care practices and care
seeking through the HDA. The HDA
leaders have the role of counselling and
undertaking social mobilisation
activities to increase the knowledge,
attitude and health seeking behaviour
of mothers. The HDA leaders also meet
with the HEWs regularly and report on
new information in their community
with a focus on pregnancies and
newborns. Furthermore, within the
context of CBNC, HDA leaders are
expected to counsel families to follow
through with referrals to health posts
and health centres and also support
treatment compliance and home
management of sick neonates.
Table 4.13 shows the training
received by HDA leaders on health
promotion across the continuum of
care. With respect to ANC, less than
half the HDA leaders reported having
received any training in the last 12
months. Forty-seven percent had been
trained in promoting a birth preparedness plan. A little under 45% had been trained on using the family health card, pregnancy identification and referring pregnant women to a higher facility for ANC care (44%, 42% and 43%, respectively). Training on how to educate on pregnancy-related danger signs was provided to 39% of HDA leaders.(Figure 4.21)For the childbirth period, 60% of HDA leaders had been trained to
promote institutional delivery. A little over 40% of HDA leaders had been trained on how to provide home visits,
refer to a higher facility for PNC care
and refer sick newborns. Thirty-eight
percent were trained on how to
educate mothers on newborn danger signs.(Figure 4.22)
Amhara Oromia SNNP Tigray
Mean (SD) Mean (SD) Mean (SD) Mean (SD)
Total N of HDA leaders 143 235 169 48
Age in years 34 (9) 35 (10) 35 (9) 34 (8)
Years of Schooling 2 (4) 3 (3) 3 (3) 2 (3)
Duration of service in
months
19 (17) 7 (7) 21 (17) 31 (16)
N of households receiving
care from HDA
9 (9) 9 (9) 9 (9) 6 (5)
4.4 Health Development Army
A total of 605 HDA leaders were interviewed for this survey (96% of the intended total).14 Like HEWs, HDA
leaders were asked about their
background (age, years of schooling,
duration of service and number of catchment households), their training in the last twelve months, their
knowledge on health promotion across
the continuum of care, their
supervision, and the services they had
provided in the three months prior to
the survey.

RESULTS - HEALTH SYSTEM STATUS
50 Community Based Newborn Care baseline survey report ideas.lshtm.ac.uk
Figure 4.20 HEWs’ (N=206) and HDA leaders’
(N=605) residence and activities
Table 4.13 Training received by HDA leaders on health promotion across the continuum of care in the last 12 months, by region
Figure 4.21 Training received by HDA leaders
in the previous twelve months: ANC period
(N=605)
Figure 4.22 Training received by HDA leaders
in the previous twelve months: postnatal
period (N=605)
0
20
40
60
80
100
HDA HEWs
Convener/
supporter
of pregnant
women's conference
Local
residence
Perc
enta
ge (
%)
87%
99%
91%
30%0
20
40
60
80
100
Bir
th p
repare
dness
Pla
n
Use
of
fam
ily
healt
h c
ard
Refe
rrin
g f
or
AN
C
Pre
gnancy
identi
�cati
on
Educati
ng o
n d
ange
r si
gns
Components of training
39%
Perc
enta
ge (
%)
41% 43% 44% 47%
0
20
40
60
80
100
Refe
rrin
g s
ick new
born
s
Refe
rrin
g f
or
PN
C
Pro
vidin
g h
om
e v
isit
s
Educa
ting o
n d
ange
r
signs
for
new
born
s
Components of PNC
38%
Perc
enta
ge (
%)
41% 41% 42%
Amhara Oromia SNNP Tigray
n (%) n (%) n (%) n (%)
Total N of HDA leaders 146 239 172 48
ANC period
Pregnancy identification 49 (34) 104 (44) 57 (33) 40 (83)
Use of family health card 51 (35) 130 (54) 53 (31) 32 (67)
Educating on danger signs 46 (32) 108 (45) 52 (30) 31 (65)
Referring for ANC care 47 (32) 117 (49) 66 (38) 30 (63)
Birth preparedness plan 55 (38) 121 (51) 74 (43) 34 (71)
Childbirth period
Promotion of institutional delivery 75 (51) 153 (64) 92 (54) 43 (90)
Postnatal period
Providing home visits 48 (33) 99 (41) 63 (37) 37 (77)
Referring for PNC care 45 (31) 107 (45) 67 (39) 30 (63)
Educating on danger signs for newborns 43 (30) 99 (41) 55 (32) 33 (69)
Referring sick newborns 49 (34) 102 (43) 70 (41) 34 (71)

RESULTS - HEALTH SYSTEM STATUS
Community Based Newborn Care baseline survey report 51ideas.lshtm.ac.uk
Table 4.14 HDA leaders’ unprompted knowledge on health promotion across continuum of care, by region
Figure 4.23 HDA leaders’ unprompted knowledge of key focused ANC
components (N=605)
0
20
40
60
80
100
Fir
st C
onsu
ltati
on
at
healt
h c
entr
e
Inst
ituti
onal
delive
ry
Min
imum
of
4
consu
ltati
ons
Bir
th p
lan
Key components of focused ANC
59%
Perc
enta
ge (
%)
41%
60%55%
Amhara Oromia SNNP Tigray
n (%) n (%) n (%) n (%)
Total N of HDA leaders 146 239 172 48
ANC period
Focused ANC components
Minimum 4 ANC consultations 56 (38) 146 (61) 88 (52) 39 (81)
First ANC consultation at health centre 84 (58) 148 (62) 97 (57) 32 (67)
Ensure a birth plan 51 (35) 103 (43) 76 (45) 15 (31)
Institutional delivery 81 (56) 126 (53) 110 (65) 40 (83)
Danger signs across the continuum of care 28 (19) 72 (30) 31 (18) 22 (46)
Breastfeeding 49 (34) 96 (40) 92 (54) 23 (48)
Family planning 42 (29) 106 (44) 52 (31) 31 (65)
Nutrition 60 (41) 142 (59) 73 (43) 25 (52)
Childbirth period
Components of home delivery care
Using clean razor blade 104 (71) 150 (63) 127 (75) 31 (65)
Not putting anything on the umbilical cord 51 (35) 90 (38) 72 (42) 26 (54)
Keeping newborn warm 54 (37) 78 (33) 76 (45) 25 (52)
Delaying bathing 30 (21) 86 (36) 64 (38) 27 (56)
Postnatal period
Components of post-delivery care
Timely PNC home visits 22 (15) 64 (27) 28 (17) 22 (46)
Checking newborn for danger signs 20 (14) 56 (23) 27 (16) 21 (44)
Vaccination for newborns 70 (48) 126 (53) 98 (58) 39 (81)
Refer to health facility 53 (36) 135 (57) 82 (48) 13 (27)
Breastfeeding 83 (57) 131 (55) 115 (8) 37 (77)
Figure 4.24 HDA leaders’ unprompted knowledge of the key
components of clean and safe delivery at home (N=605)
0
20
40
60
80
100
Cle
an r
azo
r
bla
des
for
cord
No a
pplicati
o
toum
bilic
al cord
Keep n
ew
born
warm
Dela
y bath
ing
Components of safe and clean
delivery at home
40%
Perc
enta
ge (
%)
34%
68%
39%

RESULTS - HEALTH SYSTEM STATUS
52 Community Based Newborn Care baseline survey report ideas.lshtm.ac.uk
4.4.3 HDA knowledge on health
promotion across the continuum
of care
HDA leaders were asked about their
unprompted knowledge of elements of
ANC, childbirth and the postnatal period. (Table 4.14) As part of focused ANC, 60% of HDA leaders cited promotion of the first ANC consultation at the health centre and institutional delivery. Fifty-five percent cited the need for a minimum of four ANC
consultations and half mentioned
education on nutrition. Ensuring
pregnant women have birth plans and
promoting breastfeeding were cited by 41% and 43% of HDA leaders, respectively. Thirty-eight percent said
to promote family planning and only a
quarter said to educate on the danger
signs associated with pregnancy. Figure
4.23 shows the distribution of HDA
leaders’ knowledge of key ANC
components across all four regions.
When asked about the components of home delivery care, 68% of HDA leaders had unprompted knowledge of using clean razor blades. Around 40% said not to put anything on the
umbilical cord and to keep the baby
warm. Only around one-third said to delay bathing.(Figure 4.24)As part of the components of post-delivery care, 61% of HDA
mentioned promoting breastfeeding
for the newborn. Vaccination for
newborns and referring to a health facility were cited by 55% and 47% of HDA leaders, respectively. Less than a
quarter mentioned scheduling timely
PNC home visits and checking
newborns for danger signs (Figure 4.25).HEWs’ and HDA leaders’ unprompted
knowledge on key focused ANC
components were similar with respect to ANC first consultation being at a health centre and promotion of institutional delivery. (Figure 4.26) A greater gap was observed on
knowledge of promoting a birth plan (HEWs 65% vs. HDA leaders 41%) and four ANC consultations (HEWs 70% vs. HDA leaders 55%).4.4.4 Supportive supervision
provided to HDA leaders in the last
three months
Twenty-nine percent of HDA leaders
reported receiving supportive
supervision in the preceding three
months. Supportive supervision had
been provided by the woreda health office (8%), health centre (21%), HEW (15%) and command post (7%). As shown in Table 4.15, a greater
percentage of HDA leaders in Tigray
received supervisory visits. On average,
Table 4.15 Health system: supportive supervision provided to HDA leaders in the last three months, by region
Amhara Oromia SNNP Tigray
n (%) n (%) n (%) n (%)
Total N of HDA leaders 146 239 172 48
HDA leaders receiving supportive supervision 23 (16) 64 (27) 56 (32.6) 31 (65)
Source of supportive supervision
Woreda health office 7 (5) 17 (7) 11 (6) 11 (23)
Health centre 20 (14) 46 (19) 43(25) 19 (40)
Health post (HEW) 13 (9) 25 (11) 30 (17) 23 (48)
Command post 1 (1) 12 (5) 18 (11) 11 (23)
Other 0 (0) 3 (1) 2 (1) 0 (0)
Mean number of supervision visits(SD) 2 (1) 3 (2) 3 (3) 4 (2)
HDA leaders had received three
supervisory visits in the three months
prior to the survey, with Tigray
reporting an average of four visits and
Amhara reporting two visits. HDA
leaders were also provided with tools
and materials to support their work.
However, less than a quarter reported receiving data collection forms (20%), family health cards (22%) and leaflets on the continuum of care (24%).4.4.5 HDA services provided in the
last three months
In the three months leading up to the
survey, on average HDA leaders had identified 3.0 pregnancies and had provided education on ANC-related
danger signs to a mean number of 2.3
pregnant women. HDA leaders on
average referred 2.7 women to higher
facility care and 2.0 women for
pregnancy-related danger signs. With
respect to PNC home visits, HDA
leaders had provided, on average, 2.3
visits. The distribution of services
provided by HDA leaders by region is
shown in Table 4.16.

RESULTS - HEALTH SYSTEM STATUS
Community Based Newborn Care baseline survey report 53ideas.lshtm.ac.uk
Figure 4.25 HDA leaders’ unprompted knowledge of PNC (N=605)
Figure 4.26 Comparison of HEWs’ (N=206) and HDA leaders’ (N=605) unprompted knowledge of the key components of focused ANC
Table 4.16 Average number of women who received services from HDA leaders in the last three months, by region
Amhara Oromia SNNP Tigray
Mean (SD) Mean (SD) Mean (SD) Mean (SD)
Total N of HDA leaders 146 239 173 48
Pregnancy identified 2 (1) 3 (1) 4 (2) 2 (1)
Educated on danger signs 3(1) 2 (1) 3 (1) 2 (1)
Facility referral for ANC 2 (1) 2 (2) 3 (2) 2 (1)
Facility referral for danger signs 1 (1) 2 (1) 3 (2) 2 (1)
Number of PNC visits 3 (1) 2 (1) 2 (1) 2 (1)
0
20
40
60
80
100HDA HEW
Minimum of
4 consultations
Institutional deliveryBirth planFirst consultation
at health centre
41%
65%68%
64%
Perc
enta
ge (
%)
70%
55%59%60%
Key components of focused ANC
0
20
40
60
80
100
Pro
mote
bre
ast
feedin
g
Pro
mote
vaccin
ati
on
for
new
born
Refe
r to
healt
h
facilit
y
Vis
its
on
recom
mended d
ays
Check n
ew
born
for
dange
r si
gns
Key components of PNC
47%
Perc
enta
ge (
%)
21%
55%
23%
61%
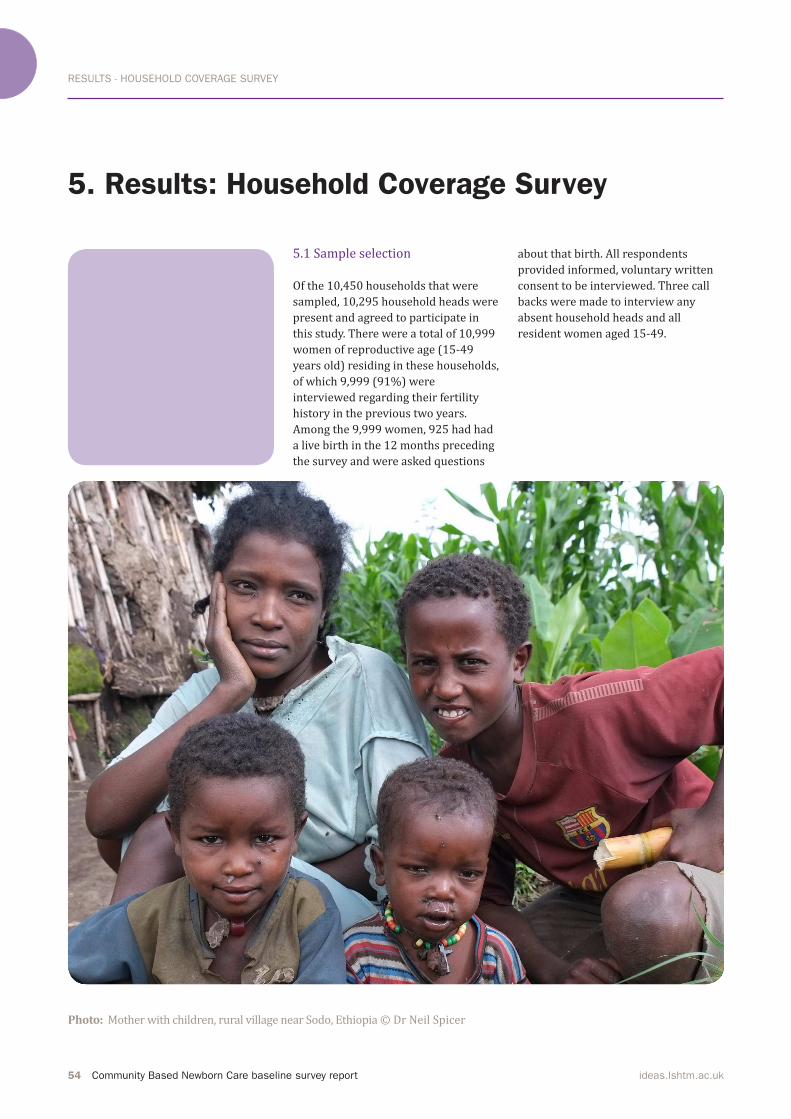
RESULTS - HOUSEHOLD COVERAGE SURVEY
54 Community Based Newborn Care baseline survey report ideas.lshtm.ac.uk
5.1 Sample selection
Of the 10,450 households that were
sampled, 10,295 household heads were
present and agreed to participate in
this study. There were a total of 10,999
women of reproductive age (15-49 years old) residing in these households, of which 9,999 (91%) were interviewed regarding their fertility
history in the previous two years.
Among the 9,999 women, 925 had had
a live birth in the 12 months preceding
the survey and were asked questions
about that birth. All respondents
provided informed, voluntary written
consent to be interviewed. Three call
backs were made to interview any
absent household heads and all
resident women aged 15-49.
Photo: Mother with children, rural village near Sodo, Ethiopia © Dr Neil Spicer
5. Results: Household Coverage Survey
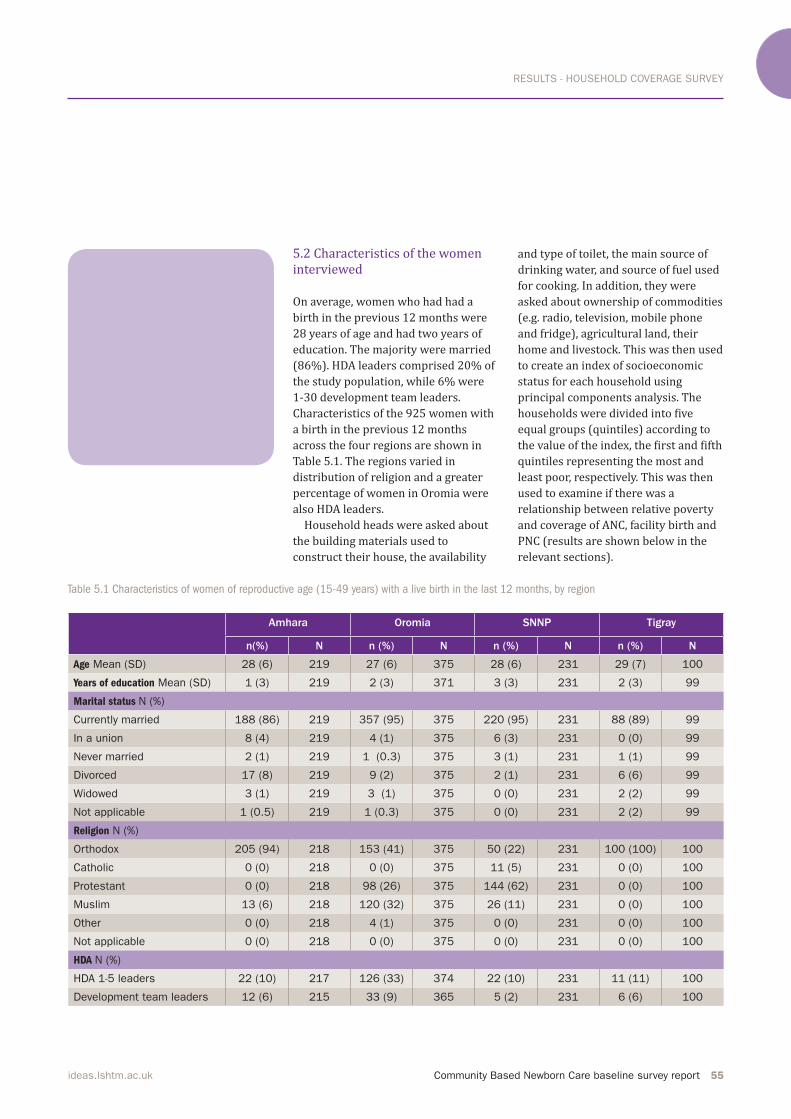
RESULTS - HOUSEHOLD COVERAGE SURVEY
Community Based Newborn Care baseline survey report 55ideas.lshtm.ac.uk
Table 5.1 Characteristics of women of reproductive age (15-49 years) with a live birth in the last 12 months, by region
5.2 Characteristics of the women
interviewed
On average, women who had had a
birth in the previous 12 months were
28 years of age and had two years of
education. The majority were married (86%). HDA leaders comprised 20% of the study population, while 6% were 1-30 development team leaders.
Characteristics of the 925 women with
a birth in the previous 12 months
across the four regions are shown in
Table 5.1. The regions varied in
distribution of religion and a greater
percentage of women in Oromia were
also HDA leaders.
Household heads were asked about
the building materials used to
construct their house, the availability
and type of toilet, the main source of
drinking water, and source of fuel used
for cooking. In addition, they were
asked about ownership of commodities
(e.g. radio, television, mobile phone and fridge), agricultural land, their home and livestock. This was then used
to create an index of socioeconomic
status for each household using
principal components analysis. The households were divided into five equal groups (quintiles) according to the value of the index, the first and fifth quintiles representing the most and
least poor, respectively. This was then
used to examine if there was a
relationship between relative poverty
and coverage of ANC, facility birth and
PNC (results are shown below in the relevant sections).Amhara Oromia SNNP Tigray
n(%) N n (%) N n (%) N n (%) N
Age Mean (SD) 28 (6) 219 27 (6) 375 28 (6) 231 29 (7) 100
Years of education Mean (SD) 1 (3) 219 2 (3) 371 3 (3) 231 2 (3) 99
Marital status N (%)
Currently married 188 (86) 219 357 (95) 375 220 (95) 231 88 (89) 99
In a union 8 (4) 219 4 (1) 375 6 (3) 231 0 (0) 99
Never married 2 (1) 219 1 (0.3) 375 3 (1) 231 1 (1) 99
Divorced 17 (8) 219 9 (2) 375 2 (1) 231 6 (6) 99
Widowed 3 (1) 219 3 (1) 375 0 (0) 231 2 (2) 99
Not applicable 1 (0.5) 219 1 (0.3) 375 0 (0) 231 2 (2) 99
Religion N (%)
Orthodox 205 (94) 218 153 (41) 375 50 (22) 231 100 (100) 100
Catholic 0 (0) 218 0 (0) 375 11 (5) 231 0 (0) 100
Protestant 0 (0) 218 98 (26) 375 144 (62) 231 0 (0) 100
Muslim 13 (6) 218 120 (32) 375 26 (11) 231 0 (0) 100
Other 0 (0) 218 4 (1) 375 0 (0) 231 0 (0) 100
Not applicable 0 (0) 218 0 (0) 375 0 (0) 231 0 (0) 100
HDA N (%)
HDA 1-5 leaders 22 (10) 217 126 (33) 374 22 (10) 231 11 (11) 100
Development team leaders 12 (6) 215 33 (9) 365 5 (2) 231 6 (6) 100

RESULTS - HOUSEHOLD COVERAGE SURVEY
56 Community Based Newborn Care baseline survey report ideas.lshtm.ac.uk
5.3 ANC period
CBNC aims to identify pregnant women
early so that there is an increased
opportunity for ANC, delivery and early
PNC contact. This can increase access
to newborns that need special care.
ANC coverage in the different regions is
shown in Table 5.2a.In this study, 69% of the women interviewed reported that they had at
least one ANC visit during their pregnancy, which is twice the figure of the data extracted from PHCU level records. The lower figure from the facility level may be due to poor record
keeping, incomplete transfer of data
from health posts to health centres
and/or high target setting by the
PHCUs. The mean gestational age at the first ANC visit was 16 weeks; on average,
ANC visits were taking place in the
second trimester. Twenty-nine percent of women were seen during their first trimester and the distribution by
region is shown in Figure 5.1.
Among women who had at least one
ANC visit, the percentage of those seen in the first trimester increases to 39%. Sixty-six percent of women received ANC at a health centre and 4% at a hospital. Thirty-nine percent of women
had four or more ANC visits.(Figure 5.2) When restricting this analysis to those that had at least one ANC visit,
over half went on to have four or more
ANC visits.
Having four or more pregnancy
interactions among women who were
from the least poor households was 64% higher compared to those from the most poor (33% vs. 54%). (Figure 5.3)With respect to care provided during
ANC visits, the majority had their
weight and blood pressure measured and 70% received information on HIV. Iron and folate tablets were provided to 60% of all women. Approximately half had received two or more TT
vaccines, information on birth
preparedness, breastfeeding and
pregnancy related danger signs. Forty
percent had their urine samples
assessed and less than a quarter had
their blood sample and STI status
assessed.
Maternal knowledge on birth
preparedness was assessed among
women who attended at least one ANC
visit. Almost all women cited the
importance of preparing nutritious
food. Clean clothes and a new razor were cited by 73% and 61% of women, respectively. Over half also mentioned making financial preparations. The other components of birth
preparedness were mentioned by less
than half of the study population.
Women were also asked about their
unprompted knowledge of pregnancy-
related danger signs. The majority of
women were not knowledgeable about
pregnancy-related danger signs with less than 40% naming any one of the key danger signs.
In practice, among women who had at least one ANC visit, 88% made some form of birth preparation. Level of birth
preparedness with respect to the six
clean birth components (gloves, soap,
cover to deliver on, clean clothes,
sterilised scissors/new razor and sterilised thread) were assessed and compared between all the women and
those that had at least one ANC visit.(Figure 5.4)Women who had one ANC interaction
were also asked if they had attended
any pregnant women’s conference, to which 23% said ‘yes’. The meetings promoted institutional delivery (88%), birth preparedness (80%) and ANC visits (75%). Seeking newborn care and importance of PNC were reported to have been discussed in only 67% and 58% of the meetings, respectively. Compared with other regions, fewer
meetings in the SNNP region were
reported to have covered the different
topics across the continuum of care.
Pregnant women’s conferences were mainly held at health posts and 15% of women also said they were held at health centres. (Table 5.2b)
The majority of women were
not knowledgeable about
pregnancy-related danger
signs with less than 40%
naming any one of the key
danger signs.”
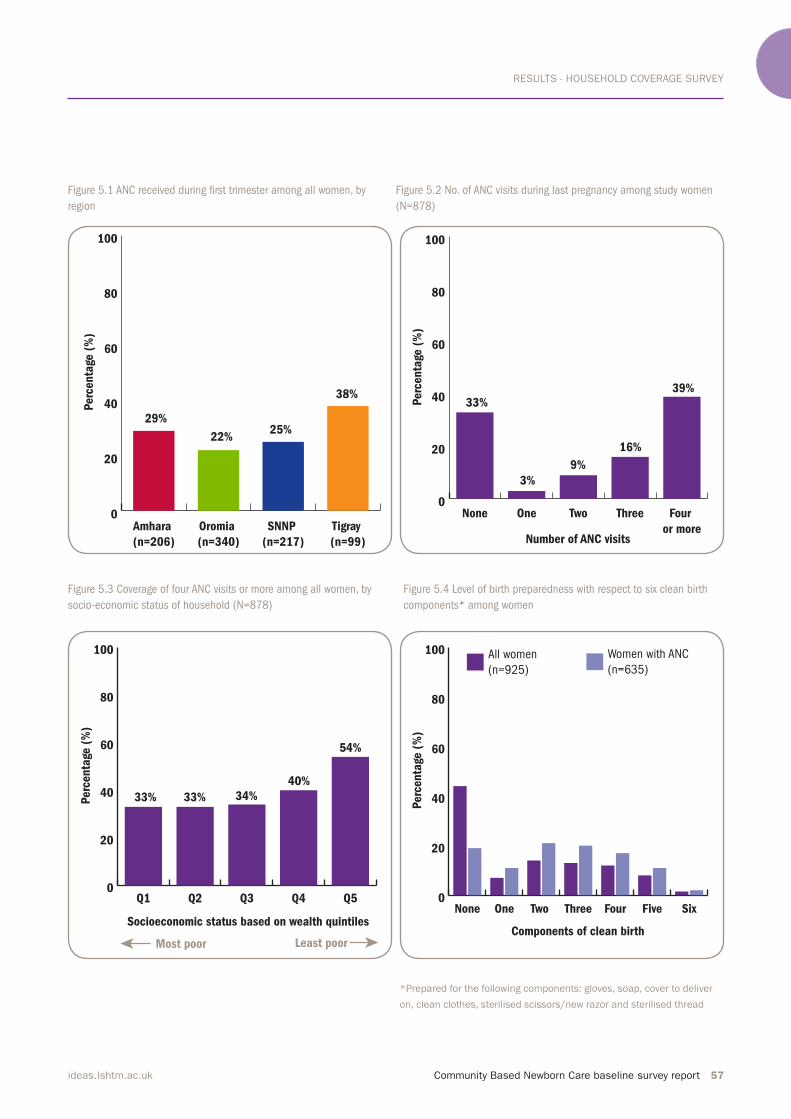
RESULTS - HOUSEHOLD COVERAGE SURVEY
Community Based Newborn Care baseline survey report 57ideas.lshtm.ac.uk
Figure 5.1 ANC received during irst trimester among all women, by
region
Figure 5.2 No. of ANC visits during last pregnancy among study women
(N=878)
Figure 5.3 Coverage of four ANC visits or more among all women, by
socio-economic status of household (N=878)
Figure 5.4 Level of birth preparedness with respect to six clean birth
components* among women
*Prepared for the following components: gloves, soap, cover to deliver
on, clean clothes, sterilised scissors/new razor and sterilised thread
0
20
40
60
80
100
Tigray
(n=99)
SNNP
(n=217)
Oromia
(n=340)
Amhara
(n=206)
38%
25%22%
29%
Perc
enta
ge (
%)
0
20
40
60
80
100
Four
or more
ThreeTwoOneNone
Number of ANC visits
39%
9%
3%
33%Perc
enta
ge (
%)
16%
0
20
40
60
80
100
Q5Q4Q3Q2Q1
Socioeconomic status based on wealth quintiles
54%
34%33%33%Perc
enta
ge (
%)
40%
Least poorMost poor
0
20
40
60
80
100 Women with ANC
(n=635)
All women
(n=925)
SixFiveFourThreeTwo OneNone
Components of clean birth
Perc
enta
ge (
%)

RESULTS - HOUSEHOLD COVERAGE SURVEY
58 Community Based Newborn Care baseline survey report ideas.lshtm.ac.uk
Amhara Oromia SNNP Tigray
n(%) N n (%) N n (%) N n (%) N
Early Pregnancy Identification
Gestational age in weeks at 1st ANC
visit, Mean (SD)
15 (8) 123 17 (8) 224 16 (9) 137 16 (18) 87
ANC coverage
Any ANC during pregnancy 135 (62) 219 259 (69) 374 149 (65) 229 92 (93) 99
ANC received during first trimester 60 (29) 206 73 (22) 340 55 (25) 217 36 (38) 94
Place where ANC was received
Home 25 (19) 135 19 (8) 254 15 (10) 149 10 (11) 92
Health post 59 (43) 136 104 (41) 255 81 (54) 150 50 (54) 92
Health centre 101 (75) 135 173 (67) 258 74 (50) 149 68 (75) 91
Hospital 2 (2) 135 11 (4) 255 6 (3) 149 3 (4) 92
Other 1 (1) 130 7 (3) 230 2 (1) 144 1 (1) 88
Completeness of ANC visit
N of ANC visits during last pregnancy
None 84 (39) 214 115 (33) 353 80 (37) 218 7 (8) 93
One 8 (4) 214 8 (2) 353 8 (4) 218 4 (4) 93
Two 25 (12) 214 32 (9) 353 18 (8) 218 5 (5) 93
Three 35 (16) 214 59 (17) 353 31 (14) 218 18 (19) 93
Four or more 62 (30) 214 139 (39) 353 81 (37) 218 59 (63) 93
N of ANC visits during last pregnancy among those that had any ANC visit
One 8 (6) 130 8 (3) 238 8 (6) 138 4 (5) 86
Two 25 (19) 130 32 (13) 238 18 (13) 138 5 (6) 86
Three 35 (27) 130 59 (25) 238 31 (23) 138 18 (21) 86
Four or more 62 (48) 130 139 (58) 238 81 (59) 138 59 (69) 86
ANC by individual aspect of care
Weight measured 96 (71) 135 210 (81) 259 111 (75) 149 84 (91) 92
Height measured 41 (30) 135 112 (43) 259 46 (31) 149 32 (35) 92
Blood pressure measured 98 (73) 135 208 (80) 259 92 (62) 149 67 (73) 92
Urine sample assessed 42 (31) 135 132 (51) 258 37 (25) 149 50 (54) 92
Blood sample assessed 16 (13) 128 44 (18) 243 17 (13) 136 30 (36) 84
STI status assessed 8 (6) 135 88 (34) 258 14 (10) 137 29 (32) 91
HIV information 86 (64) 135 177 (68) 259 97 (71) 137 85 (97) 88
Breastfeeding information 60 (44) 135 135 (52) 259 89 (60) 149 66 (73) 91
Nutrition information 89 (66) 135 171 (66) 259 87 (64) 136 82 (92) 89
Birth preparedness information 79 (59) 135 145 (56) 259 68 (49) 140 63 (70) 90
Pregnancy danger signs information 61 (45) 135 109 (42) 258 59 (42) 140 57 (63) 91
Folate/iron tablets received 93 (69) 135 115 (44) 259 100 (67) 149 72 (78) 92
TT vaccine:
None 76 (56) 135 44 (17) 259 35 (24) 149 38 (41) 92
One 15 (11) 135 42 (16) 259 19(13) 149 27 (29) 92
Two or more 43 (32) 135 173 (67) 259 95 (64) 149 27 (29) 92
Table 5.2a ANC period: identiication of pregnancy and ANC coverage, completeness, knowledge and practice among women, by region
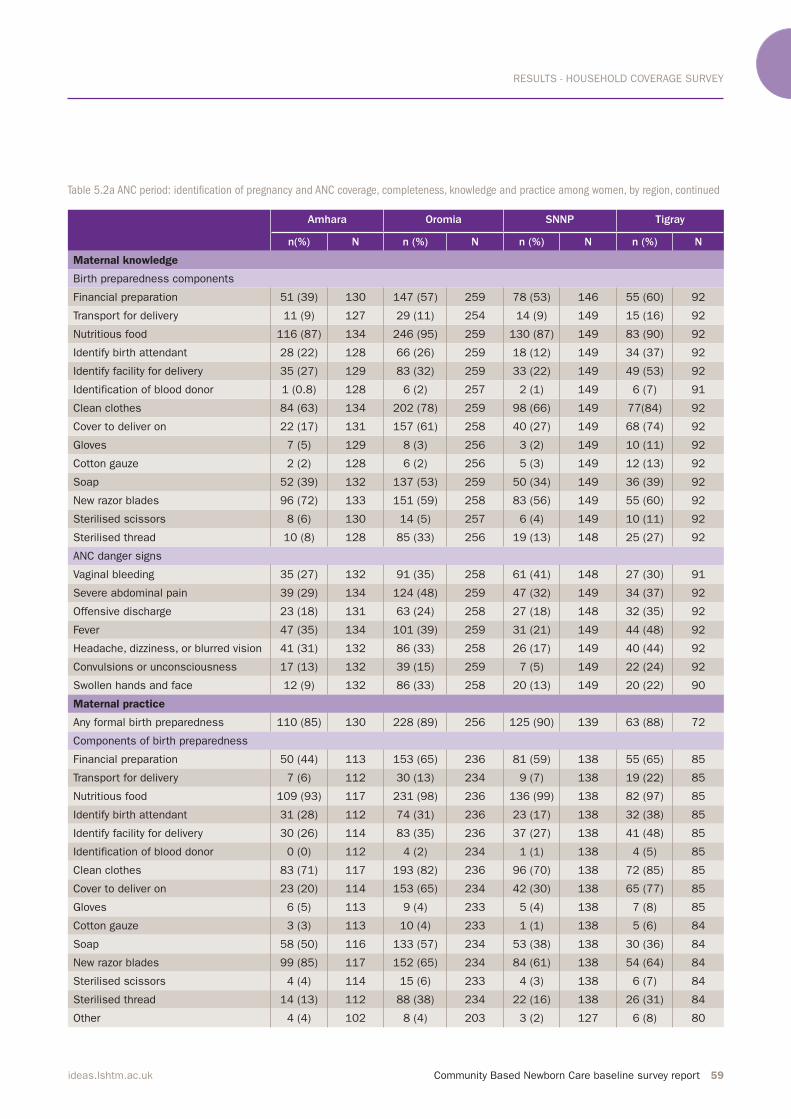
RESULTS - HOUSEHOLD COVERAGE SURVEY
Community Based Newborn Care baseline survey report 59ideas.lshtm.ac.uk
Amhara Oromia SNNP Tigray
n(%) N n (%) N n (%) N n (%) N
Maternal knowledge
Birth preparedness components
Financial preparation 51 (39) 130 147 (57) 259 78 (53) 146 55 (60) 92
Transport for delivery 11 (9) 127 29 (11) 254 14 (9) 149 15 (16) 92
Nutritious food 116 (87) 134 246 (95) 259 130 (87) 149 83 (90) 92
Identify birth attendant 28 (22) 128 66 (26) 259 18 (12) 149 34 (37) 92
Identify facility for delivery 35 (27) 129 83 (32) 259 33 (22) 149 49 (53) 92
Identification of blood donor 1 (0.8) 128 6 (2) 257 2 (1) 149 6 (7) 91
Clean clothes 84 (63) 134 202 (78) 259 98 (66) 149 77(84) 92
Cover to deliver on 22 (17) 131 157 (61) 258 40 (27) 149 68 (74) 92
Gloves 7 (5) 129 8 (3) 256 3 (2) 149 10 (11) 92
Cotton gauze 2 (2) 128 6 (2) 256 5 (3) 149 12 (13) 92
Soap 52 (39) 132 137 (53) 259 50 (34) 149 36 (39) 92
New razor blades 96 (72) 133 151 (59) 258 83 (56) 149 55 (60) 92
Sterilised scissors 8 (6) 130 14 (5) 257 6 (4) 149 10 (11) 92
Sterilised thread 10 (8) 128 85 (33) 256 19 (13) 148 25 (27) 92
ANC danger signs
Vaginal bleeding 35 (27) 132 91 (35) 258 61 (41) 148 27 (30) 91
Severe abdominal pain 39 (29) 134 124 (48) 259 47 (32) 149 34 (37) 92
Offensive discharge 23 (18) 131 63 (24) 258 27 (18) 148 32 (35) 92
Fever 47 (35) 134 101 (39) 259 31 (21) 149 44 (48) 92
Headache, dizziness, or blurred vision 41 (31) 132 86 (33) 258 26 (17) 149 40 (44) 92
Convulsions or unconsciousness 17 (13) 132 39 (15) 259 7 (5) 149 22 (24) 92
Swollen hands and face 12 (9) 132 86 (33) 258 20 (13) 149 20 (22) 90
Maternal practice
Any formal birth preparedness 110 (85) 130 228 (89) 256 125 (90) 139 63 (88) 72
Components of birth preparedness
Financial preparation 50 (44) 113 153 (65) 236 81 (59) 138 55 (65) 85
Transport for delivery 7 (6) 112 30 (13) 234 9 (7) 138 19 (22) 85
Nutritious food 109 (93) 117 231 (98) 236 136 (99) 138 82 (97) 85
Identify birth attendant 31 (28) 112 74 (31) 236 23 (17) 138 32 (38) 85
Identify facility for delivery 30 (26) 114 83 (35) 236 37 (27) 138 41 (48) 85
Identification of blood donor 0 (0) 112 4 (2) 234 1 (1) 138 4 (5) 85
Clean clothes 83 (71) 117 193 (82) 236 96 (70) 138 72 (85) 85
Cover to deliver on 23 (20) 114 153 (65) 234 42 (30) 138 65 (77) 85
Gloves 6 (5) 113 9 (4) 233 5 (4) 138 7 (8) 85
Cotton gauze 3 (3) 113 10 (4) 233 1 (1) 138 5 (6) 84
Soap 58 (50) 116 133 (57) 234 53 (38) 138 30 (36) 84
New razor blades 99 (85) 117 152 (65) 234 84 (61) 138 54 (64) 84
Sterilised scissors 4 (4) 114 15 (6) 233 4 (3) 138 6 (7) 84
Sterilised thread 14 (13) 112 88 (38) 234 22 (16) 138 26 (31) 84
Other 4 (4) 102 8 (4) 203 3 (2) 127 6 (8) 80
Table 5.2a ANC period: identiication of pregnancy and ANC coverage, completeness, knowledge and practice among women, by region, continued
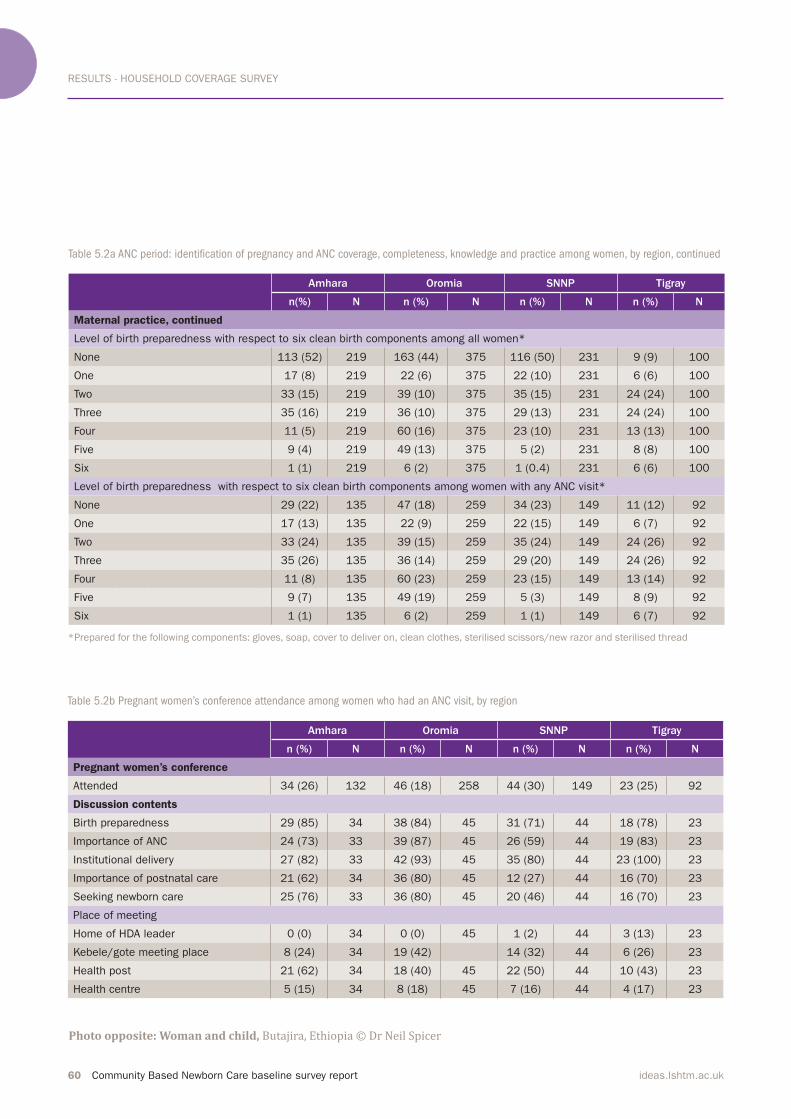
RESULTS - HOUSEHOLD COVERAGE SURVEY
60 Community Based Newborn Care baseline survey report ideas.lshtm.ac.uk
*Prepared for the following components: gloves, soap, cover to deliver on, clean clothes, sterilised scissors/new razor and sterilised thread
Table 5.2a ANC period: identiication of pregnancy and ANC coverage, completeness, knowledge and practice among women, by region, continued
Amhara Oromia SNNP Tigray
n(%) N n (%) N n (%) N n (%) N
Maternal practice, continued
Level of birth preparedness with respect to six clean birth components among all women*
None 113 (52) 219 163 (44) 375 116 (50) 231 9 (9) 100
One 17 (8) 219 22 (6) 375 22 (10) 231 6 (6) 100
Two 33 (15) 219 39 (10) 375 35 (15) 231 24 (24) 100
Three 35 (16) 219 36 (10) 375 29 (13) 231 24 (24) 100
Four 11 (5) 219 60 (16) 375 23 (10) 231 13 (13) 100
Five 9 (4) 219 49 (13) 375 5 (2) 231 8 (8) 100
Six 1 (1) 219 6 (2) 375 1 (0.4) 231 6 (6) 100
Level of birth preparedness with respect to six clean birth components among women with any ANC visit*
None 29 (22) 135 47 (18) 259 34 (23) 149 11 (12) 92
One 17 (13) 135 22 (9) 259 22 (15) 149 6 (7) 92
Two 33 (24) 135 39 (15) 259 35 (24) 149 24 (26) 92
Three 35 (26) 135 36 (14) 259 29 (20) 149 24 (26) 92
Four 11 (8) 135 60 (23) 259 23 (15) 149 13 (14) 92
Five 9 (7) 135 49 (19) 259 5 (3) 149 8 (9) 92
Six 1 (1) 135 6 (2) 259 1 (1) 149 6 (7) 92
Table 5.2b Pregnant women’s conference attendance among women who had an ANC visit, by region
Amhara Oromia SNNP Tigray
n (%) N n (%) N n (%) N n (%) N
Pregnant women’s conference
Attended 34 (26) 132 46 (18) 258 44 (30) 149 23 (25) 92
Discussion contents
Birth preparedness 29 (85) 34 38 (84) 45 31 (71) 44 18 (78) 23
Importance of ANC 24 (73) 33 39 (87) 45 26 (59) 44 19 (83) 23
Institutional delivery 27 (82) 33 42 (93) 45 35 (80) 44 23 (100) 23
Importance of postnatal care 21 (62) 34 36 (80) 45 12 (27) 44 16 (70) 23
Seeking newborn care 25 (76) 33 36 (80) 45 20 (46) 44 16 (70) 23
Place of meeting
Home of HDA leader 0 (0) 34 0 (0) 45 1 (2) 44 3 (13) 23
Kebele/gote meeting place 8 (24) 34 19 (42) 14 (32) 44 6 (26) 23
Health post 21 (62) 34 18 (40) 45 22 (50) 44 10 (43) 23
Health centre 5 (15) 34 8 (18) 45 7 (16) 44 4 (17) 23
*Prepared for the following components: gloves, soap, cover to deliver on, clean clothes, sterilised scissors/new razor and sterilised thread
Photo opposite: Woman and child, Butajira, Ethiopia © Dr Neil Spicer

RESULTS - HOUSEHOLD COVERAGE SURVEY
Community Based Newborn Care baseline survey report 61ideas.lshtm.ac.uk

RESULTS - HOUSEHOLD COVERAGE SURVEY
62 Community Based Newborn Care baseline survey report ideas.lshtm.ac.uk
5.4 Childbirth period
Women were asked about the place of
delivery and primary assistance at
delivery; the results are shown in Table 5.3a. Facility birth, defined by the Ethiopian Government to include
hospital and health centre births, was 23%. Another 3% of deliveries took place at a health post. Figure 5.5 shows
the distribution of home and facility
deliveries by region. The majority of women delivered at home (72%). Twenty-seven percent of women
delivered in the presence of a skilled
birth attendant, while the deliveries of 44% of women were attended by a relative or a friend.
When asked about the multiple
reasons for choosing a place of delivery, 61% of women chose to deliver at home because that was where they had
given birth in the past, due to family practice.(Figure 5.6) Among those that delivered at a health facility, half said
that it was convenient. Other reasons
included the existence of underlying
illness or delivery related
complications such as a prolonged labour (32% and 29%, respectively). Twenty-three percent of women also
said they delivered at a facility due to
their attendance at a pregnant women’s conference.(Figure 5.7)Looking across the socio-economic
status; with increasing poverty, there is
a trend showing less use of skilled birth
attendance (delivery by medical doctor, nurse or midwife).(Figure 5.8)Home and facility births were also
assessed separately for practices
during delivery, delivery complications and associated referrals.(Table 5.3b) There were notable differences in the
maternal report of these indicators by
place of delivery. When asked if birth
attendants washed their hands, based
on their perception and understanding of delivery practices, 70% of women who delivered at home said ‘yes’,
whereas among women who delivered
at a facility, the percentage increased to 88%. Use of gloves by a delivery assistant was reported by 96% of women who delivered in a facility
while a similar practice was reported by only in 13% of women who delivered at home. Three percent of
women who delivered at home and 63% of women who delivered in a facility said they took medication to
control their bleeding. Minor
differences were observed with respect
to delivery on a clean surface.Forty-five percent of women who gave birth at home said that they had a
delivery complication and of those that delivered at a facility 62% reported a complication. The higher percentage of
delivery complications reported among
those who had a facility delivery could
be due to the fact that when delivery
becomes challenging in the home
setting women tend to go to a health
facility for assistance.
Among women who reported having a complication, 64% of women who delivered at home cited heavy bleeding
as a type of complication and among
facility births the same percentage said
they had a prolonged labour. Among
women with a complicated delivery who gave birth at home, only 15% were advised to go to a higher facility, and of those, 15% sought care.(Figure 5.9) Among those that did not go to a health
facility, over half said that family
members did not provide permission
for them to go and a quarter said that
the health facility was too far. Among
women who reported a delivery
complication during a facility birth, a
much larger percentage were advised to go to a higher facility (61%), of which 93% accomplished their referral. The 7% that did not follow their advised referral, cited the associated
expenses for not seeking care at a
higher facility.
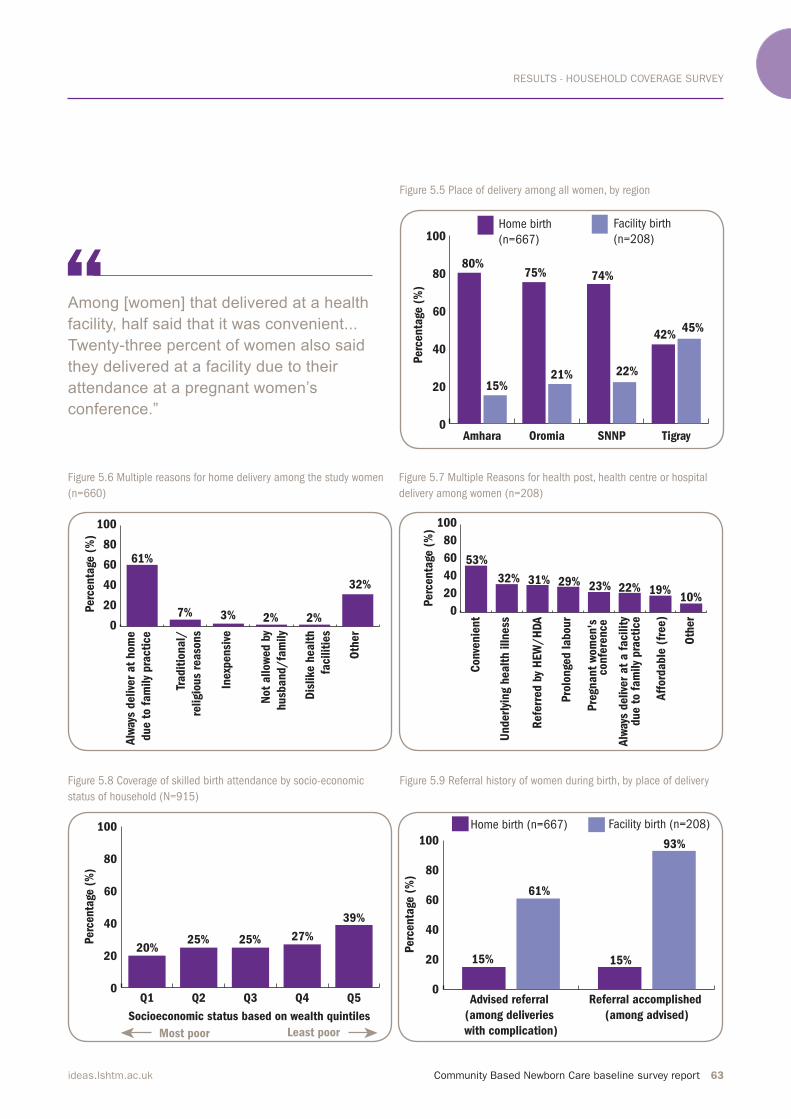
RESULTS - HOUSEHOLD COVERAGE SURVEY
Community Based Newborn Care baseline survey report 63ideas.lshtm.ac.uk
Figure 5.5 Place of delivery among all women, by region
Figure 5.6 Multiple reasons for home delivery among the study women
(n=660)
Figure 5.7 Multiple Reasons for health post, health centre or hospital
delivery among women (n=208)
Figure 5.8 Coverage of skilled birth attendance by socio-economic
status of household (N=915)
Figure 5.9 Referral history of women during birth, by place of delivery
0
20
40
60
80
100Facility birth
(n=208)
Home birth
(n=667)
TigraySNNPOromiaAmhara
Perc
enta
ge (
%)
80%
15%
75%
21%
74%
22%
42%45%
0
20
40
60
80
100
Oth
er
Dis
like h
ealt
h
facilit
ies
Not
allow
ed b
y
husb
and/
fam
ily
Inexp
ensi
ve
Tradit
ional/
religio
us
reaso
ns
Alw
ays
delive
r at
hom
e
due t
o f
am
ily
pra
cti
ce
Perc
enta
ge (
%)
61%
2% 2%
32%
3%7% 0
20
40
60
80
100
Oth
er
Aff
ord
able
(fr
ee)
Alw
ays
delive
r at
a f
acilit
y
Pre
gnant
wom
en's
Pro
longe
d labour
Refe
rred b
y H
EW
/H
DA
Underl
ying h
ealt
h illness
Conve
nie
nt
Perc
enta
ge (
%)
53%
22% 19%10%
31%32% 29% 23%
due t
o f
am
ily
pra
cti
ce
confe
rence
0
20
40
60
80
100
Q5Q4Q3Q2Q1
Socioeconomic status based on wealth quintiles
39%
25%25%20%
Perc
enta
ge (
%)
27%
Least poorMost poor
0
20
40
60
80
100
Facility birth (n=208)Home birth (n=667)
Referral accomplished
(among advised)
Advised referral
(among deliveries
with complication)
Perc
enta
ge (
%)
61%
15% 15%
93%
Among [women] that delivered at a health
facility, half said that it was convenient...
Twenty-three percent of women also said
they delivered at a facility due to their
attendance at a pregnant women’s
conference.”
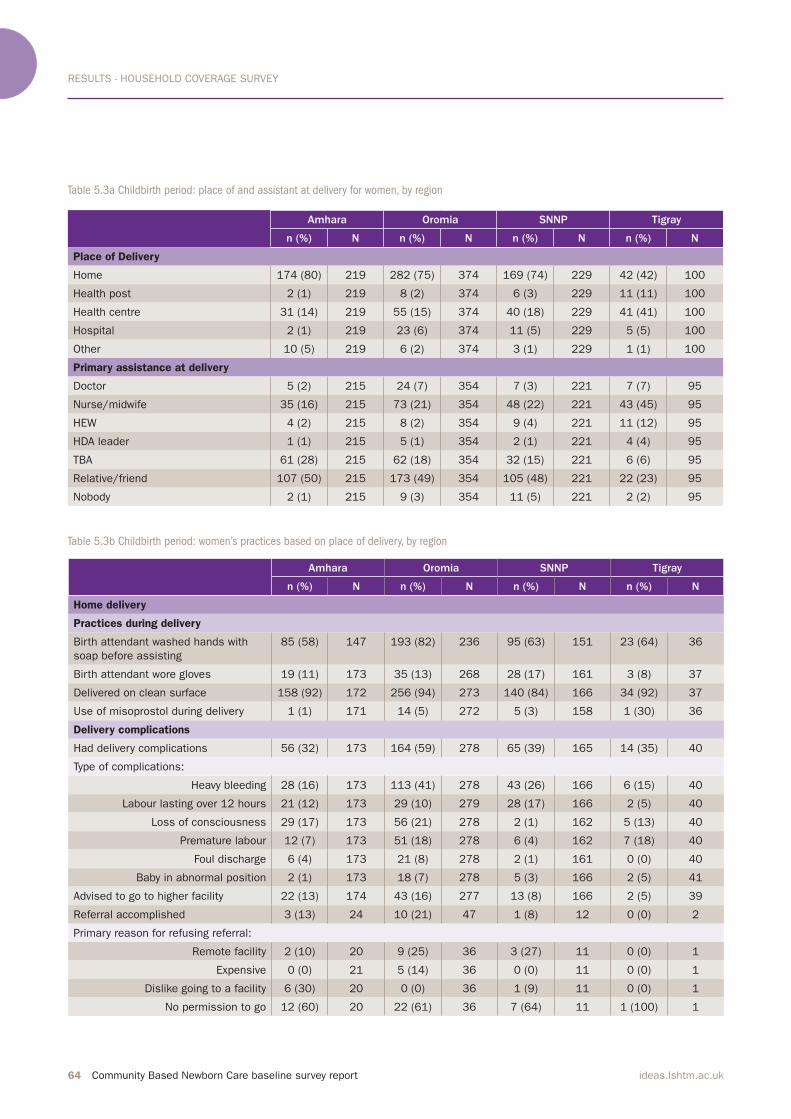
RESULTS - HOUSEHOLD COVERAGE SURVEY
64 Community Based Newborn Care baseline survey report ideas.lshtm.ac.uk
Table 5.3a Childbirth period: place of and assistant at delivery for women, by region
Table 5.3b Childbirth period: women’s practices based on place of delivery, by region
Amhara Oromia SNNP Tigray
n (%) N n (%) N n (%) N n (%) N
Place of Delivery
Home 174 (80) 219 282 (75) 374 169 (74) 229 42 (42) 100
Health post 2 (1) 219 8 (2) 374 6 (3) 229 11 (11) 100
Health centre 31 (14) 219 55 (15) 374 40 (18) 229 41 (41) 100
Hospital 2 (1) 219 23 (6) 374 11 (5) 229 5 (5) 100
Other 10 (5) 219 6 (2) 374 3 (1) 229 1 (1) 100
Primary assistance at delivery
Doctor 5 (2) 215 24 (7) 354 7 (3) 221 7 (7) 95
Nurse/midwife 35 (16) 215 73 (21) 354 48 (22) 221 43 (45) 95
HEW 4 (2) 215 8 (2) 354 9 (4) 221 11 (12) 95
HDA leader 1 (1) 215 5 (1) 354 2 (1) 221 4 (4) 95
TBA 61 (28) 215 62 (18) 354 32 (15) 221 6 (6) 95
Relative/friend 107 (50) 215 173 (49) 354 105 (48) 221 22 (23) 95
Nobody 2 (1) 215 9 (3) 354 11 (5) 221 2 (2) 95
Amhara Oromia SNNP Tigray
n (%) N n (%) N n (%) N n (%) N
Home delivery
Practices during delivery
Birth attendant washed hands with
soap before assisting
85 (58) 147 193 (82) 236 95 (63) 151 23 (64) 36
Birth attendant wore gloves 19 (11) 173 35 (13) 268 28 (17) 161 3 (8) 37
Delivered on clean surface 158 (92) 172 256 (94) 273 140 (84) 166 34 (92) 37
Use of misoprostol during delivery 1 (1) 171 14 (5) 272 5 (3) 158 1 (30) 36
Delivery complications
Had delivery complications 56 (32) 173 164 (59) 278 65 (39) 165 14 (35) 40
Type of complications:
Heavy bleeding 28 (16) 173 113 (41) 278 43 (26) 166 6 (15) 40
Labour lasting over 12 hours 21 (12) 173 29 (10) 279 28 (17) 166 2 (5) 40
Loss of consciousness 29 (17) 173 56 (21) 278 2 (1) 162 5 (13) 40
Premature labour 12 (7) 173 51 (18) 278 6 (4) 162 7 (18) 40
Foul discharge 6 (4) 173 21 (8) 278 2 (1) 161 0 (0) 40
Baby in abnormal position 2 (1) 173 18 (7) 278 5 (3) 166 2 (5) 41
Advised to go to higher facility 22 (13) 174 43 (16) 277 13 (8) 166 2 (5) 39
Referral accomplished 3 (13) 24 10 (21) 47 1 (8) 12 0 (0) 2
Primary reason for refusing referral:
Remote facility 2 (10) 20 9 (25) 36 3 (27) 11 0 (0) 1
Expensive 0 (0) 21 5 (14) 36 0 (0) 11 0 (0) 1
Dislike going to a facility 6 (30) 20 0 (0) 36 1 (9) 11 0 (0) 1
No permission to go 12 (60) 20 22 (61) 36 7 (64) 11 1 (100) 1
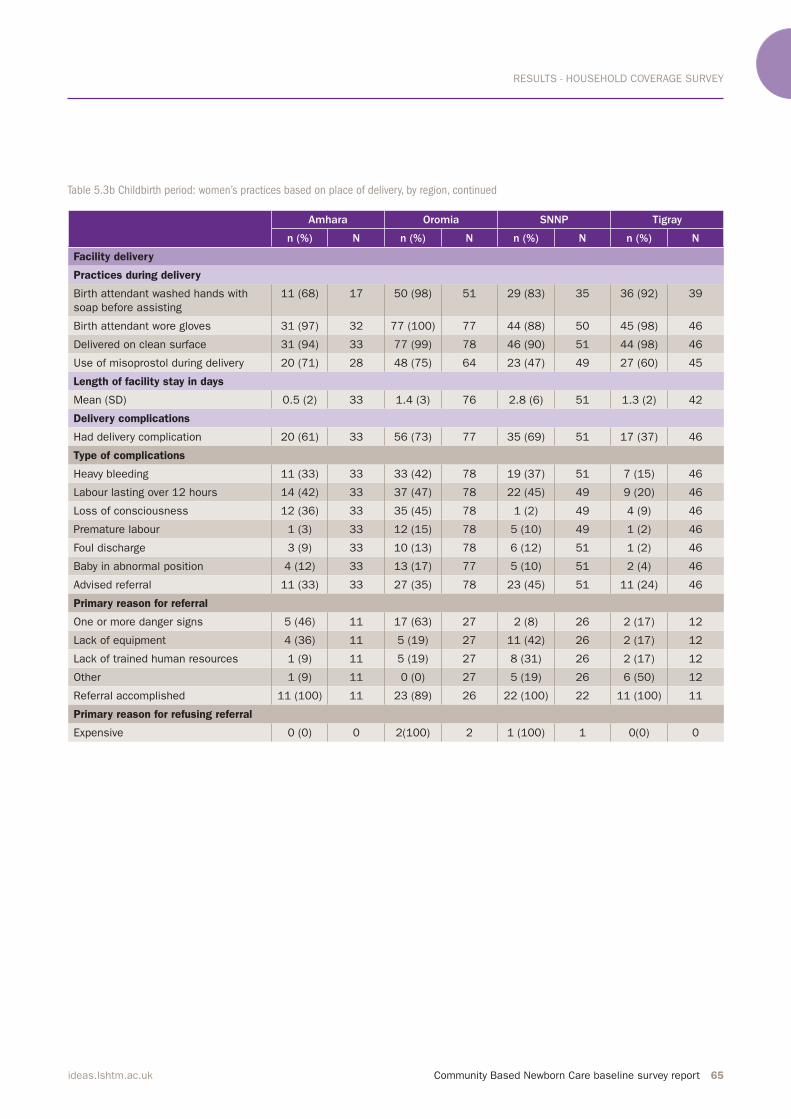
RESULTS - HOUSEHOLD COVERAGE SURVEY
Community Based Newborn Care baseline survey report 65ideas.lshtm.ac.uk
Amhara Oromia SNNP Tigray
n (%) N n (%) N n (%) N n (%) N
Facility delivery
Practices during delivery
Birth attendant washed hands with
soap before assisting
11 (68) 17 50 (98) 51 29 (83) 35 36 (92) 39
Birth attendant wore gloves 31 (97) 32 77 (100) 77 44 (88) 50 45 (98) 46
Delivered on clean surface 31 (94) 33 77 (99) 78 46 (90) 51 44 (98) 46
Use of misoprostol during delivery 20 (71) 28 48 (75) 64 23 (47) 49 27 (60) 45
Length of facility stay in days
Mean (SD) 0.5 (2) 33 1.4 (3) 76 2.8 (6) 51 1.3 (2) 42
Delivery complications
Had delivery complication 20 (61) 33 56 (73) 77 35 (69) 51 17 (37) 46
Type of complications
Heavy bleeding 11 (33) 33 33 (42) 78 19 (37) 51 7 (15) 46
Labour lasting over 12 hours 14 (42) 33 37 (47) 78 22 (45) 49 9 (20) 46
Loss of consciousness 12 (36) 33 35 (45) 78 1 (2) 49 4 (9) 46
Premature labour 1 (3) 33 12 (15) 78 5 (10) 49 1 (2) 46
Foul discharge 3 (9) 33 10 (13) 78 6 (12) 51 1 (2) 46
Baby in abnormal position 4 (12) 33 13 (17) 77 5 (10) 51 2 (4) 46
Advised referral 11 (33) 33 27 (35) 78 23 (45) 51 11 (24) 46
Primary reason for referral
One or more danger signs 5 (46) 11 17 (63) 27 2 (8) 26 2 (17) 12
Lack of equipment 4 (36) 11 5 (19) 27 11 (42) 26 2 (17) 12
Lack of trained human resources 1 (9) 11 5 (19) 27 8 (31) 26 2 (17) 12
Other 1 (9) 11 0 (0) 27 5 (19) 26 6 (50) 12
Referral accomplished 11 (100) 11 23 (89) 26 22 (100) 22 11 (100) 11
Primary reason for refusing referral
Expensive 0 (0) 0 2(100) 2 1 (100) 1 0(0) 0
Table 5.3b Childbirth period: women’s practices based on place of delivery, by region, continued
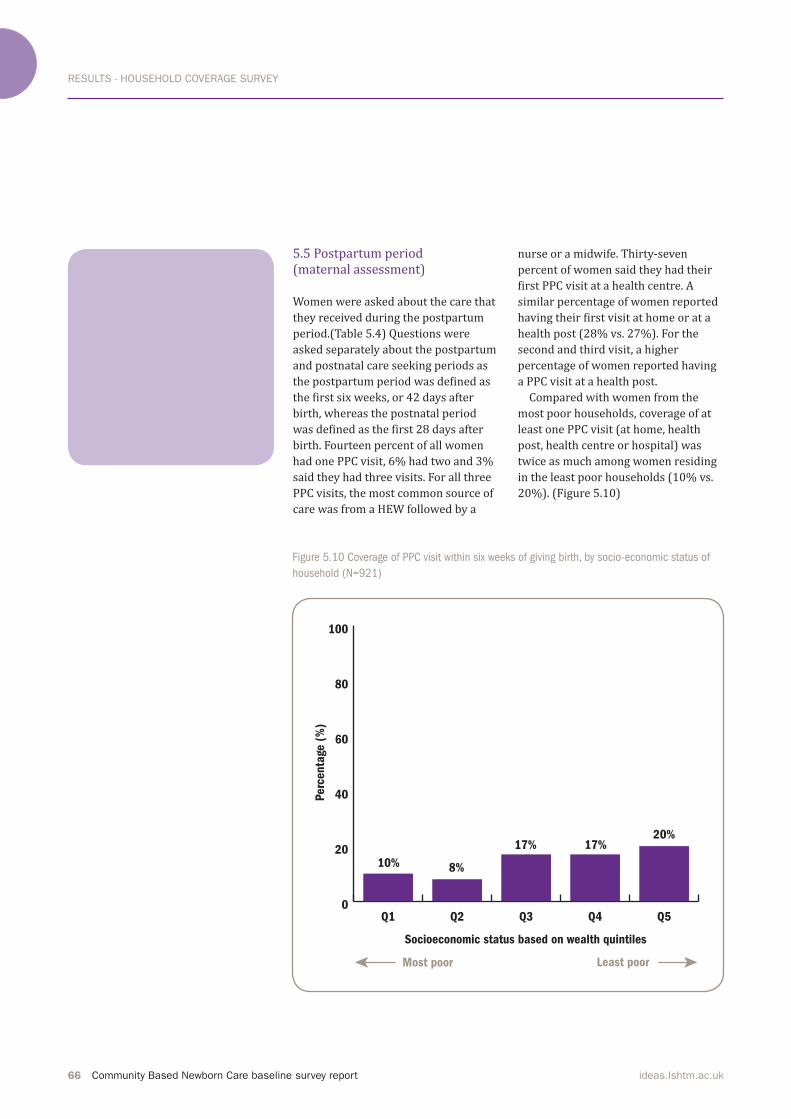
RESULTS - HOUSEHOLD COVERAGE SURVEY
66 Community Based Newborn Care baseline survey report ideas.lshtm.ac.uk
5.5 Postpartum period (maternal assessment) Women were asked about the care that
they received during the postpartum period.(Table 5.4) Questions were asked separately about the postpartum
and postnatal care seeking periods as the postpartum period was defined as the first six weeks, or 42 days after birth, whereas the postnatal period was defined as the first 28 days after birth. Fourteen percent of all women had one PPC visit, 6% had two and 3% said they had three visits. For all three
PPC visits, the most common source of
care was from a HEW followed by a
nurse or a midwife. Thirty-seven
percent of women said they had their first PPC visit at a health centre. A similar percentage of women reported having their first visit at home or at a health post (28% vs. 27%). For the second and third visit, a higher
percentage of women reported having
a PPC visit at a health post.
Compared with women from the
most poor households, coverage of at
least one PPC visit (at home, health post, health centre or hospital) was twice as much among women residing in the least poor households (10% vs. 20%). (Figure 5.10)
Figure 5.10 Coverage of PPC visit within six weeks of giving birth, by socio-economic status of
household (N=921)
0
20
40
60
80
100
Q5Q4Q3Q2Q1
Socioeconomic status based on wealth quintiles
20%17%
8%10%
Perc
enta
ge (
%)
17%
Least poorMost poor
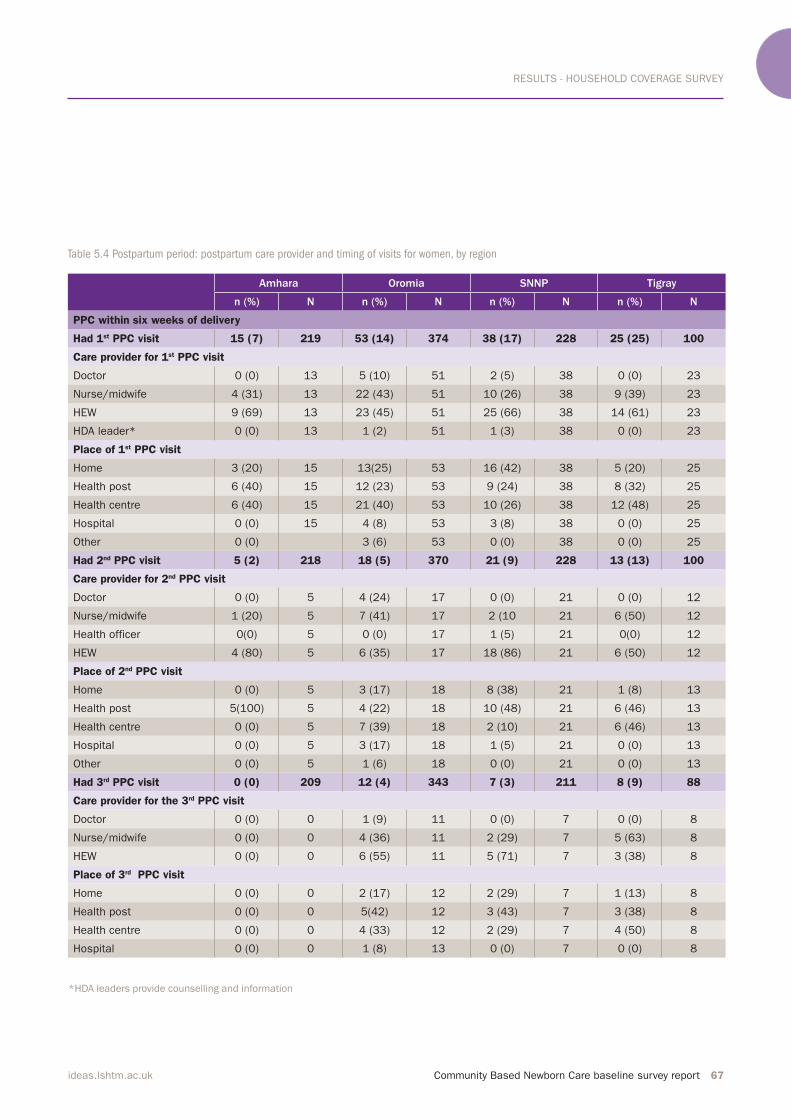
RESULTS - HOUSEHOLD COVERAGE SURVEY
Community Based Newborn Care baseline survey report 67ideas.lshtm.ac.uk
Table 5.4 Postpartum period: postpartum care provider and timing of visits for women, by region
*HDA leaders provide counselling and information
Amhara Oromia SNNP Tigray
n (%) N n (%) N n (%) N n (%) N
PPC within six weeks of delivery
Had 1st PPC visit 15 (7) 219 53 (14) 374 38 (17) 228 25 (25) 100
Care provider for 1st PPC visit
Doctor 0 (0) 13 5 (10) 51 2 (5) 38 0 (0) 23
Nurse/midwife 4 (31) 13 22 (43) 51 10 (26) 38 9 (39) 23
HEW 9 (69) 13 23 (45) 51 25 (66) 38 14 (61) 23
HDA leader* 0 (0) 13 1 (2) 51 1 (3) 38 0 (0) 23
Place of 1st PPC visit
Home 3 (20) 15 13(25) 53 16 (42) 38 5 (20) 25
Health post 6 (40) 15 12 (23) 53 9 (24) 38 8 (32) 25
Health centre 6 (40) 15 21 (40) 53 10 (26) 38 12 (48) 25
Hospital 0 (0) 15 4 (8) 53 3 (8) 38 0 (0) 25
Other 0 (0) 3 (6) 53 0 (0) 38 0 (0) 25
Had 2nd PPC visit 5 (2) 218 18 (5) 370 21 (9) 228 13 (13) 100
Care provider for 2nd PPC visit
Doctor 0 (0) 5 4 (24) 17 0 (0) 21 0 (0) 12
Nurse/midwife 1 (20) 5 7 (41) 17 2 (10 21 6 (50) 12
Health officer 0(0) 5 0 (0) 17 1 (5) 21 0(0) 12
HEW 4 (80) 5 6 (35) 17 18 (86) 21 6 (50) 12
Place of 2nd PPC visit
Home 0 (0) 5 3 (17) 18 8 (38) 21 1 (8) 13
Health post 5(100) 5 4 (22) 18 10 (48) 21 6 (46) 13
Health centre 0 (0) 5 7 (39) 18 2 (10) 21 6 (46) 13
Hospital 0 (0) 5 3 (17) 18 1 (5) 21 0 (0) 13
Other 0 (0) 5 1 (6) 18 0 (0) 21 0 (0) 13
Had 3rd PPC visit 0 (0) 209 12 (4) 343 7 (3) 211 8 (9) 88
Care provider for the 3rd PPC visit
Doctor 0 (0) 0 1 (9) 11 0 (0) 7 0 (0) 8
Nurse/midwife 0 (0) 0 4 (36) 11 2 (29) 7 5 (63) 8
HEW 0 (0) 0 6 (55) 11 5 (71) 7 3 (38) 8
Place of 3rd PPC visit
Home 0 (0) 0 2 (17) 12 2 (29) 7 1 (13) 8
Health post 0 (0) 0 5(42) 12 3 (43) 7 3 (38) 8
Health centre 0 (0) 0 4 (33) 12 2 (29) 7 4 (50) 8
Hospital 0 (0) 0 1 (8) 13 0 (0) 7 0 (0) 8
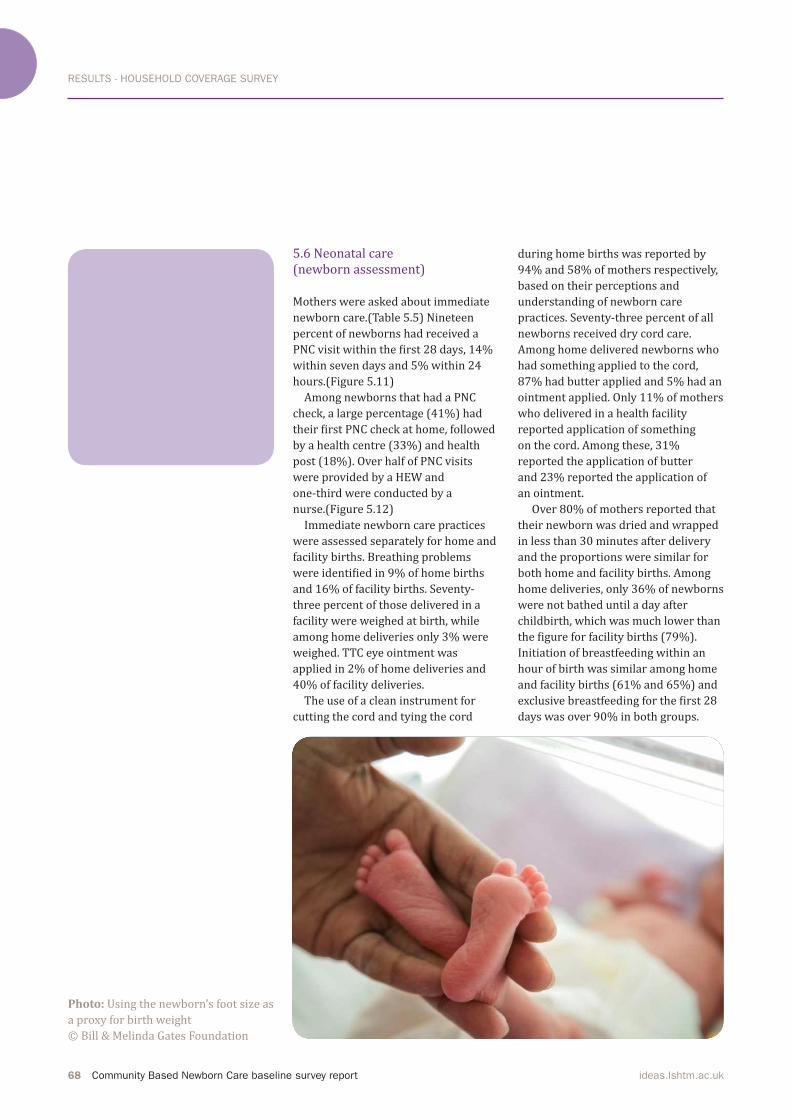
RESULTS - HOUSEHOLD COVERAGE SURVEY
68 Community Based Newborn Care baseline survey report ideas.lshtm.ac.uk
5.6 Neonatal care (newborn assessment) Mothers were asked about immediate newborn care.(Table 5.5) Nineteen percent of newborns had received a PNC visit within the first 28 days, 14% within seven days and 5% within 24 hours.(Figure 5.11)
Among newborns that had a PNC check, a large percentage (41%) had their first PNC check at home, followed by a health centre (33%) and health post (18%). Over half of PNC visits were provided by a HEW and
one-third were conducted by a nurse.(Figure 5.12)Immediate newborn care practices
were assessed separately for home and
facility births. Breathing problems were identified in 9% of home births and 16% of facility births. Seventy-three percent of those delivered in a
facility were weighed at birth, while among home deliveries only 3% were weighed. TTC eye ointment was applied in 2% of home deliveries and 40% of facility deliveries.
The use of a clean instrument for
cutting the cord and tying the cord
during home births was reported by 94% and 58% of mothers respectively, based on their perceptions and
understanding of newborn care
practices. Seventy-three percent of all
newborns received dry cord care.
Among home delivered newborns who
had something applied to the cord, 87% had butter applied and 5% had an ointment applied. Only 11% of mothers who delivered in a health facility
reported application of something on the cord. Among these, 31% reported the application of butter and 23% reported the application of an ointment. Over 80% of mothers reported that their newborn was dried and wrapped
in less than 30 minutes after delivery
and the proportions were similar for
both home and facility births. Among home deliveries, only 36% of newborns were not bathed until a day after
childbirth, which was much lower than the figure for facility births (79%). Initiation of breastfeeding within an
hour of birth was similar among home and facility births (61% and 65%) and exclusive breastfeeding for the first 28 days was over 90% in both groups.
Photo: Using the newborn’s foot size as
a proxy for birth weight
© Bill & Melinda Gates Foundation
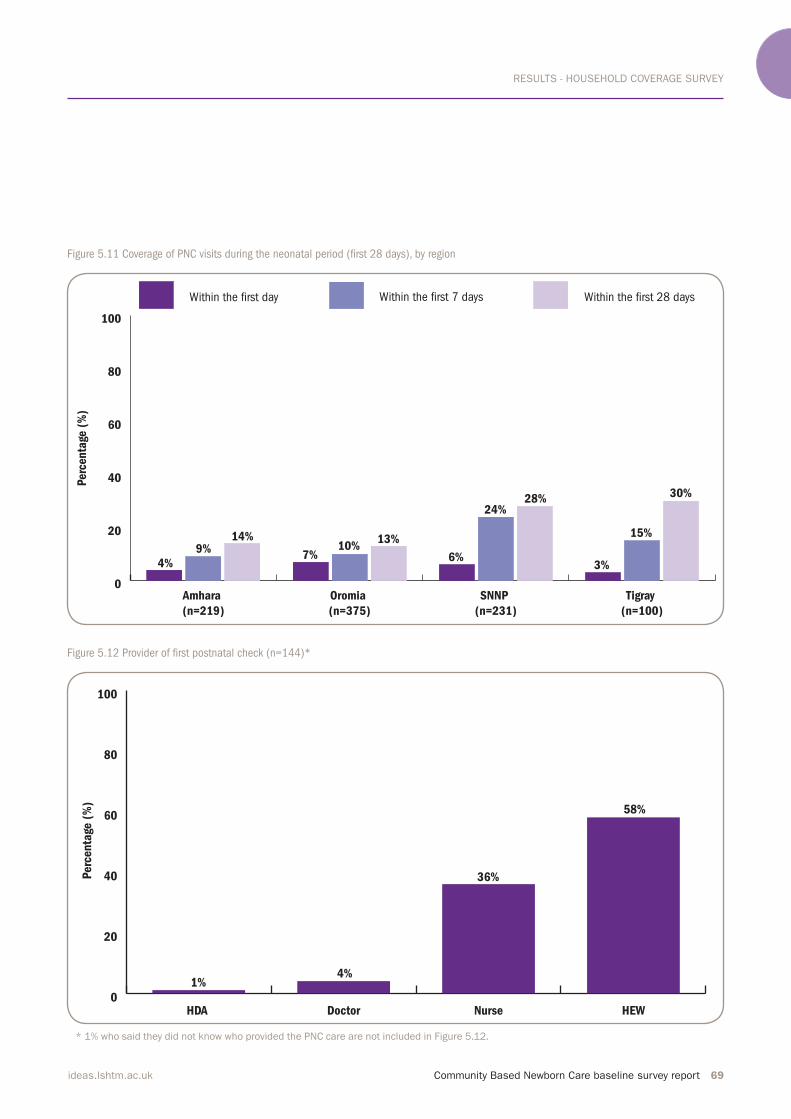
RESULTS - HOUSEHOLD COVERAGE SURVEY
Community Based Newborn Care baseline survey report 69ideas.lshtm.ac.uk
Figure 5.11 Coverage of PNC visits during the neonatal period (irst 28 days), by region
Figure 5.12 Provider of irst postnatal check (n=144)*
0
20
40
60
80
100
Within the irst 28 days Within the irst 7 daysWithin the irst day
Tigray
(n=100)
SNNP
(n=231)
Oromia
(n=375)
Amhara
(n=219)
4%
Perc
enta
ge (
%)
9%14%
7%10%
13%
6%
24%28%
3%
15%
30%
0
20
40
60
80
100
HEWNurseDoctorHDA
1%
Perc
enta
ge (
%)
4%
36%
58%
* 1% who said they did not know who provided the PNC care are not included in Figure 5.12.
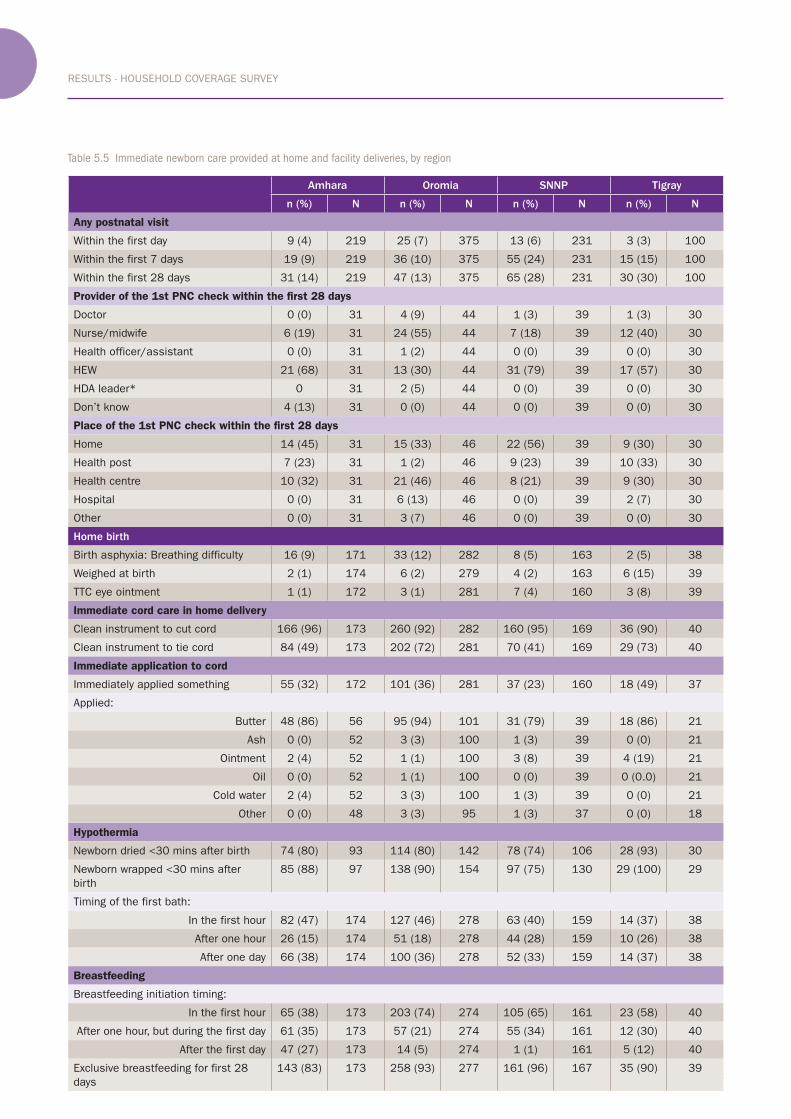
RESULTS - HOUSEHOLD COVERAGE SURVEY
70 Community Based Newborn Care baseline survey report ideas.lshtm.ac.uk
Table 5.5 Immediate newborn care provided at home and facility deliveries, by region
Amhara Oromia SNNP Tigray
n (%) N n (%) N n (%) N n (%) N
Any postnatal visit
Within the first day 9 (4) 219 25 (7) 375 13 (6) 231 3 (3) 100
Within the first 7 days 19 (9) 219 36 (10) 375 55 (24) 231 15 (15) 100
Within the first 28 days 31 (14) 219 47 (13) 375 65 (28) 231 30 (30) 100
Provider of the 1st PNC check within the first 28 days
Doctor 0 (0) 31 4 (9) 44 1 (3) 39 1 (3) 30
Nurse/midwife 6 (19) 31 24 (55) 44 7 (18) 39 12 (40) 30
Health officer/assistant 0 (0) 31 1 (2) 44 0 (0) 39 0 (0) 30
HEW 21 (68) 31 13 (30) 44 31 (79) 39 17 (57) 30
HDA leader* 0 31 2 (5) 44 0 (0) 39 0 (0) 30
Don’t know 4 (13) 31 0 (0) 44 0 (0) 39 0 (0) 30
Place of the 1st PNC check within the first 28 days
Home 14 (45) 31 15 (33) 46 22 (56) 39 9 (30) 30
Health post 7 (23) 31 1 (2) 46 9 (23) 39 10 (33) 30
Health centre 10 (32) 31 21 (46) 46 8 (21) 39 9 (30) 30
Hospital 0 (0) 31 6 (13) 46 0 (0) 39 2 (7) 30
Other 0 (0) 31 3 (7) 46 0 (0) 39 0 (0) 30
Home birth
Birth asphyxia: Breathing difficulty 16 (9) 171 33 (12) 282 8 (5) 163 2 (5) 38
Weighed at birth 2 (1) 174 6 (2) 279 4 (2) 163 6 (15) 39
TTC eye ointment 1 (1) 172 3 (1) 281 7 (4) 160 3 (8) 39
Immediate cord care in home delivery
Clean instrument to cut cord 166 (96) 173 260 (92) 282 160 (95) 169 36 (90) 40
Clean instrument to tie cord 84 (49) 173 202 (72) 281 70 (41) 169 29 (73) 40
Immediate application to cord
Immediately applied something 55 (32) 172 101 (36) 281 37 (23) 160 18 (49) 37
Applied:
Butter 48 (86) 56 95 (94) 101 31 (79) 39 18 (86) 21
Ash 0 (0) 52 3 (3) 100 1 (3) 39 0 (0) 21
Ointment 2 (4) 52 1 (1) 100 3 (8) 39 4 (19) 21
Oil 0 (0) 52 1 (1) 100 0 (0) 39 0 (0.0) 21
Cold water 2 (4) 52 3 (3) 100 1 (3) 39 0 (0) 21
Other 0 (0) 48 3 (3) 95 1 (3) 37 0 (0) 18
Hypothermia
Newborn dried <30 mins after birth 74 (80) 93 114 (80) 142 78 (74) 106 28 (93) 30
Newborn wrapped <30 mins after
birth
85 (88) 97 138 (90) 154 97 (75) 130 29 (100) 29
Timing of the first bath:
In the first hour 82 (47) 174 127 (46) 278 63 (40) 159 14 (37) 38
After one hour 26 (15) 174 51 (18) 278 44 (28) 159 10 (26) 38
After one day 66 (38) 174 100 (36) 278 52 (33) 159 14 (37) 38
Breastfeeding
Breastfeeding initiation timing:
In the first hour 65 (38) 173 203 (74) 274 105 (65) 161 23 (58) 40
After one hour, but during the first day 61 (35) 173 57 (21) 274 55 (34) 161 12 (30) 40
After the first day 47 (27) 173 14 (5) 274 1 (1) 161 5 (12) 40
Exclusive breastfeeding for first 28
days
143 (83) 173 258 (93) 277 161 (96) 167 35 (90) 39
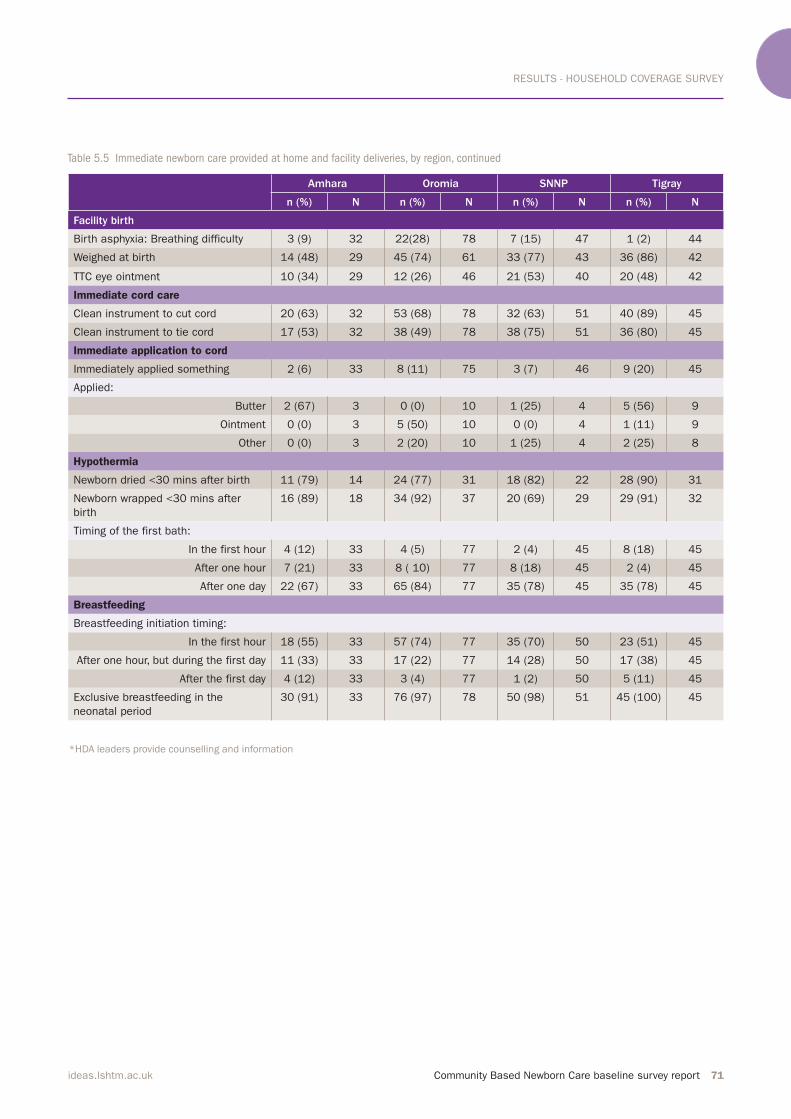
RESULTS - HOUSEHOLD COVERAGE SURVEY
Community Based Newborn Care baseline survey report 71ideas.lshtm.ac.uk
Amhara Oromia SNNP Tigray
n (%) N n (%) N n (%) N n (%) N
Facility birth
Birth asphyxia: Breathing difficulty 3 (9) 32 22(28) 78 7 (15) 47 1 (2) 44
Weighed at birth 14 (48) 29 45 (74) 61 33 (77) 43 36 (86) 42
TTC eye ointment 10 (34) 29 12 (26) 46 21 (53) 40 20 (48) 42
Immediate cord care
Clean instrument to cut cord 20 (63) 32 53 (68) 78 32 (63) 51 40 (89) 45
Clean instrument to tie cord 17 (53) 32 38 (49) 78 38 (75) 51 36 (80) 45
Immediate application to cord
Immediately applied something 2 (6) 33 8 (11) 75 3 (7) 46 9 (20) 45
Applied:
Butter 2 (67) 3 0 (0) 10 1 (25) 4 5 (56) 9
Ointment 0 (0) 3 5 (50) 10 0 (0) 4 1 (11) 9
Other 0 (0) 3 2 (20) 10 1 (25) 4 2 (25) 8
Hypothermia
Newborn dried <30 mins after birth 11 (79) 14 24 (77) 31 18 (82) 22 28 (90) 31
Newborn wrapped <30 mins after
birth
16 (89) 18 34 (92) 37 20 (69) 29 29 (91) 32
Timing of the first bath:
In the first hour 4 (12) 33 4 (5) 77 2 (4) 45 8 (18) 45
After one hour 7 (21) 33 8 ( 10) 77 8 (18) 45 2 (4) 45
After one day 22 (67) 33 65 (84) 77 35 (78) 45 35 (78) 45
Breastfeeding
Breastfeeding initiation timing:
In the first hour 18 (55) 33 57 (74) 77 35 (70) 50 23 (51) 45
After one hour, but during the first day 11 (33) 33 17 (22) 77 14 (28) 50 17 (38) 45
After the first day 4 (12) 33 3 (4) 77 1 (2) 50 5 (11) 45
Exclusive breastfeeding in the
neonatal period
30 (91) 33 76 (97) 78 50 (98) 51 45 (100) 45
*HDA leaders provide counselling and information
Table 5.5 Immediate newborn care provided at home and facility deliveries, by region, continued

RESULTS - HOUSEHOLD COVERAGE SURVEY
72 Community Based Newborn Care baseline survey report ideas.lshtm.ac.uk
5.7 Management of neonatal illness
Information on history of illness during the first 28 days of life was collected from mothers. (Table 5.6) Twelve percent reported that their newborns
had symptoms of an illness and among these 41% sought formal medical care. Among all newborns, 5% had symptoms of severe neonatal infection (difficulty breathing, chest in-drawing and/or convulsions) and the distribution by regions is shown in
Figure 5.13. Twenty-eight percent of
newborns with severe neonatal
infection received treatment with an
Table 5.6 Management of neonatal illness, by region
Amhara Oromia SNNP Tigray
n (%) N n (%) N n (%) N n (%) N
Neonatal illness
History of sickness 28 (13) 216 47 (14) 334 20 (10) 205 9 (10) 91
Formal health care seeking among ill
neonates
13 (43) 30 20 (41) 49 7 (33) 21 5 (56) 9
Neonatal sepsis
Newborns with severe neonatal
infection
11 (39) 28 18 (38) 47 5 (25) 20 3 (33) 9
Antibiotic care received among
neonatal sepsis
4 (33) 12 4 (21) 19 2 (40) 5 1 (33) 3
antibiotic regimen at a health centre or
hospital.Of the interviewed mothers, 18 (2%) reported that their newborns had died in the first 28 days of life. Of the 18 neonatal deaths only 25% had sought formal medical care. (Figure 5.14)
Photos: Antibiotic samples for training Health Extension Workers
© Neil Lensink
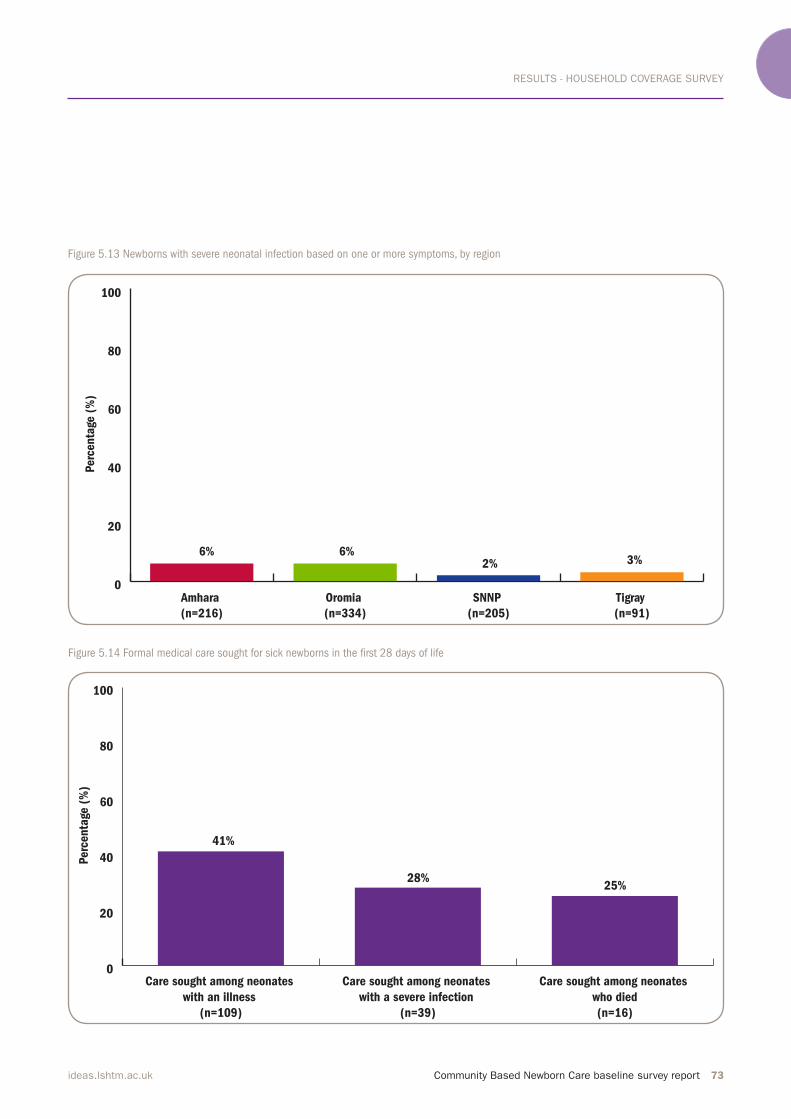
RESULTS - HOUSEHOLD COVERAGE SURVEY
Community Based Newborn Care baseline survey report 73ideas.lshtm.ac.uk
Figure 5.13 Newborns with severe neonatal infection based on one or more symptoms, by region
Figure 5.14 Formal medical care sought for sick newborns in the irst 28 days of life
0
20
40
60
80
100
Tigray
(n=91)
SNNP
(n=205)
Oromia
(n=334)
Amhara
(n=216)
3%2%6%6%
Perc
enta
ge (
%)
0
20
40
60
80
100
Care sought among neonates
who died
(n=16)
Care sought among neonates
with a severe infection
(n=39)
Care sought among neonates
with an illness
(n=109)
25%28%
41%
Perc
enta
ge (
%)
DISCUSSION
74 Community Based Newborn Care baseline survey report ideas.lshtm.ac.uk
6. Discussion
This report presents the findings from the CBNC baseline survey that was
conducted from October-
November of 2013.
The survey was completed on time,
within six months of the request from
the Federal Ministry of Health and
reached 206 health centres, health
posts and HEWs, 605 HDA leaders and
10,295 households. The health system
status and readiness to provide the
CBNC programme has been described
in detail. At household level, the
coverage level of MNH interventions reflecting the programmatic aspects of CBNC has been presented.
With respect to the health system,
health centres on average had two
midwives and seven nurses. PHCUs had
a relative shortage of HEWs as on
average a health centre had six satellite
health posts and 10 HEWs. Less than
half of health centres had motorised
transport, indicating the limited
capacity for transporting pregnant
women to health centres for delivery.
Many of the health centres and health
posts did not have an adequate supply
of piped water and electricity. Almost
all health centres had a functional
fridge. Over 80% of both health centres and health posts had IMNCI and iCCM
registers, respectively. However, there
was low and variable availability of job
aids and forms, which has implications
for the CBNC programme. For example,
the chart booklet which is used for
assessing, classifying and treating a
sick newborn or child was available in 66% of health posts. As mentioned earlier, chart booklets might not have
been available in a third of the
surveyed health posts due to the
interviewed HEW not having received
iCCM training, attrition of trained
HEWs, or the booklet not being
physically present at the health post on
the day of the survey. Furthermore, the
family health card, a MNH-related BCC
tool used by HEWs and HDA leaders to
educate pregnant women and their
families about important MNH messages, was available in 68% of health posts.
An assessment of the service
utilisation gap of PHCUs showed that of the expected pregnancies, a significant proportion of pregnant women are not identified by the health system and do not get ANC care. The largest gap was
service utilisation for optimal ANC and
PNC visits. Of the expected pregnancies
and deliveries, a large majority did not
receive four ANC and four PNC visits, respectively. These figures are based on records of service utilisation against
targets set by the PHCUs, and are used
to assess health centre and health post
performance. The observed gaps in
service utilisation could be due to high
target setting, poor record keeping,
incomplete transfer of data from health
posts to health centre, and/or lack of
service utilisation.
With respect to the health workforce,
a detailed assessment of HEWs’
training and unprompted knowledge
across the continuum of care has identified some of their knowledge gaps. The CBNC programme can focus
on training HEWs and HDA leaders
based on the gaps that have been identified. For example, only one-third of HEWs cited an MNH-related
integrated refresher training in the
twelve months preceding the survey.
Almost all PHCUs had an established
HDA system, a promising fact given the
role HDA leaders play in the CBNC
programme. Furthermore, HEWs
interacted with HDA leaders regularly
and provided them with training on
different components across the
continuum of care. However, only half
the HEWs had provided training on
Photo above: Girl near Sodo, Ethiopia
© Dr Neil Spicer
DISCUSSION
Community Based Newborn Care baseline survey report 75ideas.lshtm.ac.uk
how to use the family health card. In
order for HDA leaders to undertake
health promotion and counselling
activities that improve MNH knowledge
and health seeking behaviour, supplies
of the family health card and training
on its effective use are necessary.
For the purpose of the household
survey discussion, we have made
comparisons of a few indicators from
the CBNC baseline survey with two
data sets that have different sources,
timeframe and collection methods:
2011 Ethiopia DHS (population-based survey on services provided in the five years before the survey) and 2011/2012 HMIS data (facility-based
routine data collection on services
provided in the specified year). With the recommendation from the
Technical Working Group, comparisons
of the CBNC baseline survey results
were made with both Ethiopia DHS and
HMIS data to provide a comprehensive understanding of the findings. With respect to communities, 69% of women reported having one ANC visit,
which lies in-between the 2011 Ethiopia DHS (43%) and 2011/2012 HMIS (89%) data. In this survey 39% of women reported having the
recommended four ANC visits, which is
twice the coverage level reported by 2011 Ethiopia DHS (19%). Among women who had an ANC visit, the majority received care after the first trimester and about one-third never
sought care at a health centre or
hospital. Twenty-three percent of
women who had an ANC visit had
attended a pregnant women’s
conference, which effectively
communicated the importance of
institutional delivery and birth
preparedness across all four regions.
However, PNC and newborn care were
not consistently addressed. Health
posts are the primary location where
pregnant women’s conferences are
held. Some conferences were also held
at health centres. Further exploration
is needed to assess if meetings held at
health centres are as effective as
meetings held at health posts. A
pregnant women’s conference is a
major opportunity for community
awareness and mobilisation. It has the
potential to be a platform where
important topics across the continuum
of care are discussed, however
currently it does not adequately
address newborn care seeking
behaviour.
More can be done by HEWs and HDA
leaders in referring pregnant women to deliver in facilities. In this survey 23% reported delivering in a health facility,
which is similar to data from HMIS (20%) and more than double the coverage levels reported in the 2011 Ethiopia DHS (10%). Births are still taking place at health posts and some
home births are being attended by
HEWs and HDA leaders. Although other
reasons were cited for home delivery,
the majority preferred home births out
of habit. This indicates that there is a
need to address training gaps to ensure
that HEWs promote and facilitate
facility birth.
Almost all PHCUs had an established HDA system, a
promising fact given the role HDA leaders play in the
CBNC programme.”

DISCUSSION
76 Community Based Newborn Care baseline survey report ideas.lshtm.ac.uk
Overall, referrals by the birth
attendant for complicated deliveries
were low. Furthermore, among women
who delivered at home and were
referred for a complication, few were
able to reach the next level of health
facility. Due to the operational definitions of PPC (six weeks) and PNC (28 days), care seeking behaviour for these two
periods were assessed separately.
Overall very few women received PPC (14%). This figure falls between 2011 Ethiopia DHS (8.5%) and 2011/2012 HMIS data (45%), though it is relatively closer to the former. Low coverage of
PPC in this survey is particularly
striking given the high percentage of
women who reported a delivery
complication, very few received
specialised care (e.g. PPC visit with a medical doctor).With respect to immediate newborn
care, very few newborns had received PNC in the first 28 days after birth. As expected, there were also notable
differences in newborn care practices
by place of delivery. Fewer cases of
breathing problems were reported by
mothers who delivered at home,
indicating that birth asphyxia is unlikely to be identified among home births. With respect to cord care, the
government policy of dry cord care is showing promising results as 73% of all newborns had nothing applied to
their cord. This was more evident
among facility births where dry cord care was provided to 89% of newborns. With CBNC, the Ministry of Health is
recommending cord care with
chlorhexidine. The CBNC programme
needs to ensure that changing the dry
cord care recommendation to care with
chlorhexidine does not increase
harmful traditional practices (e.g.
application of butter, oil or ash to the cord).With respect to keeping newborns
warm, facility births have succeeded in
delaying bathing until the second day
of life. However, for a majority of home
births bathing took place on the same
day as delivery. Timing of breastfeeding
initiation and exclusive breastfeeding during the PNC period (28 days) were very similar by place of delivery.
Minimal care was sought for
newborns with illness and severe
newborn infection. Among neonates
that died, the percentage where care
was sought is remarkably low. This has
major implications for the CBNC
programme. HEWs and HDA leaders
need to have access to newborns so
they can identify the danger signs and
ensure that sick newborns receive and
complete their treatment.
Limitations
There are a number of limitations in
this survey. The sample size
calculations for the household survey
are based on detecting a differential
change over time between intervention
and comparison areas in the coverage
of key interventions. Based on a
recommendation made by the
Technical Working Group after
completion of the survey, results have
been presented by region. However, the sample size is not sufficient to make statistical analysis for regional
comparisons nor is the sample size sufficient to estimate newborn mortality, which requires a very large
sample size to present the results with
reasonable power. A sample size of
such a magnitude was beyond the
resources that were available for this
survey.
Comparison areas were selected
from zones where CBNC roll-out is
planned to be as late as possible based
on the need to build iCCM, HDA, HEW
and PHCU platforms in these zones.
This has implications on the
comparability of these zones with the
intervention zones in relation to
certain indicators.
With respect to the facility survey,
there was limited consistency and
reliability in the data that were
extracted from facility records and
registers. Data of reasonable quality
were available on equipment, supplies,
drugs, administrative forms and job
aids, however the quality of data on
Photo: Health post, Ethiopia © Neil Lensink
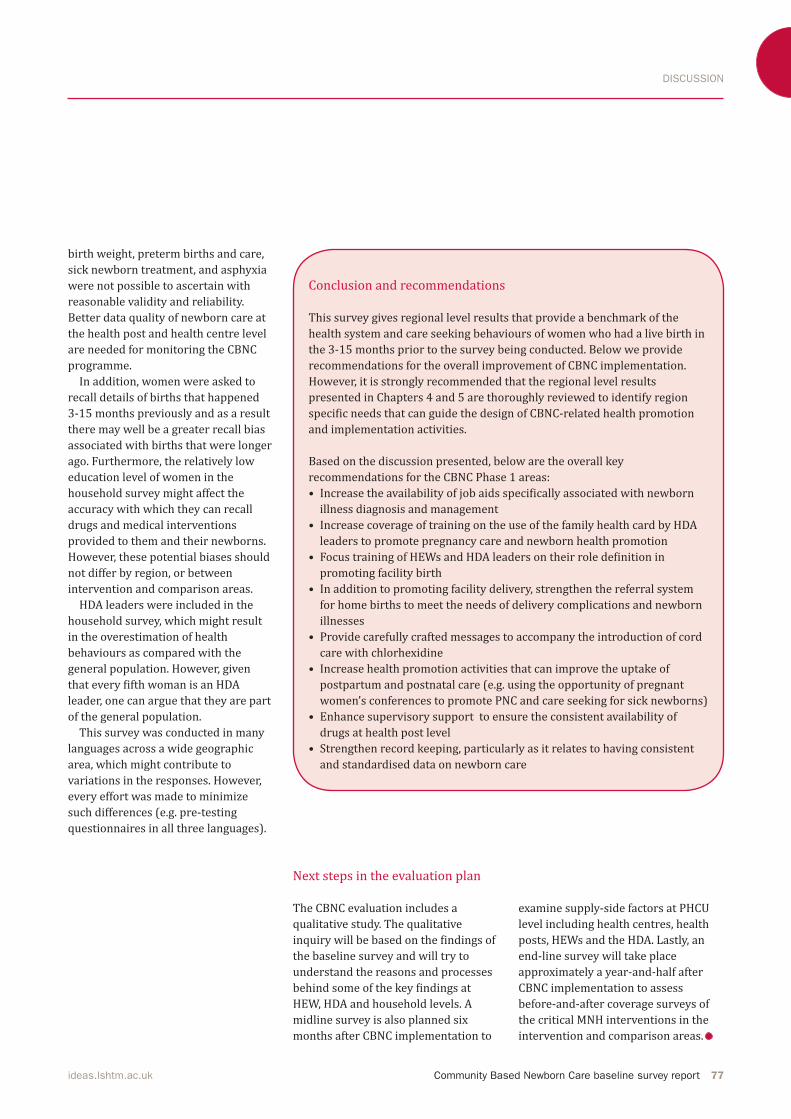
DISCUSSION
Community Based Newborn Care baseline survey report 77ideas.lshtm.ac.uk
birth weight, preterm births and care,
sick newborn treatment, and asphyxia
were not possible to ascertain with
reasonable validity and reliability.
Better data quality of newborn care at
the health post and health centre level
are needed for monitoring the CBNC
programme.
In addition, women were asked to
recall details of births that happened
3-15 months previously and as a result
there may well be a greater recall bias
associated with births that were longer
ago. Furthermore, the relatively low
education level of women in the
household survey might affect the
accuracy with which they can recall
drugs and medical interventions
provided to them and their newborns.
However, these potential biases should
not differ by region, or between
intervention and comparison areas.
HDA leaders were included in the
household survey, which might result
in the overestimation of health
behaviours as compared with the
general population. However, given that every fifth woman is an HDA leader, one can argue that they are part
of the general population.
This survey was conducted in many
languages across a wide geographic
area, which might contribute to
variations in the responses. However,
every effort was made to minimize
such differences (e.g. pre-testing questionnaires in all three languages).
Conclusion and recommendations
This survey gives regional level results that provide a benchmark of the
health system and care seeking behaviours of women who had a live birth in
the 3-15 months prior to the survey being conducted. Below we provide
recommendations for the overall improvement of CBNC implementation.
However, it is strongly recommended that the regional level results
presented in Chapters 4 and 5 are thoroughly reviewed to identify region specific needs that can guide the design of CBNC-related health promotion and implementation activities.
Based on the discussion presented, below are the overall key
recommendations for the CBNC Phase 1 areas: • Increase the availability of job aids specifically associated with newborn illness diagnosis and management • Increase coverage of training on the use of the family health card by HDA
leaders to promote pregnancy care and newborn health promotion • Focus training of HEWs and HDA leaders on their role definition in promoting facility birth • In addition to promoting facility delivery, strengthen the referral system
for home births to meet the needs of delivery complications and newborn
illnesses • Provide carefully crafted messages to accompany the introduction of cord
care with chlorhexidine• Increase health promotion activities that can improve the uptake of
postpartum and postnatal care (e.g. using the opportunity of pregnant women’s conferences to promote PNC and care seeking for sick newborns)• Enhance supervisory support to ensure the consistent availability of
drugs at health post level• Strengthen record keeping, particularly as it relates to having consistent
and standardised data on newborn care
Next steps in the evaluation plan
The CBNC evaluation includes a
qualitative study. The qualitative inquiry will be based on the findings of the baseline survey and will try to
understand the reasons and processes behind some of the key findings at HEW, HDA and household levels. A
midline survey is also planned six
months after CBNC implementation to
examine supply-side factors at PHCU
level including health centres, health
posts, HEWs and the HDA. Lastly, an
end-line survey will take place
approximately a year-and-half after
CBNC implementation to assess
before-and-after coverage surveys of
the critical MNH interventions in the
intervention and comparison areas.
ANNEX
78 Community Based Newborn Care baseline survey report ideas.lshtm.ac.uk
Annexes
In this section we present a brief
introduction and summary to the CBNC
survey by intervention and comparison
areas. This is followed by Annexes II
and III, which provide results of the
healthy system and household level findings respectively. For ease of referencing, tables and figures in Annexes II and III are numbered in the
same way as those showing regional
level analysis in the main report.
Figures that represent overall totals are
not repeated in the Annexes.
Implementation of CBNC in the
Phase 1 intervention zones started
after the baseline survey was
conducted in Eastern Tigray, East
Gojam, North Shewa, East Shewa, Gurage, Wolayita and Sidama. The five comparison zones selected were
Southern Tigray, North Gondar, East
Wellega, Ilu Aba Bora and South Omo.
Comparison zones were selected based
on the Ministry of Health’s
recommendation, with the
understanding that CBNC
implementation in these zones is likely
to take place after the end-line survey.
Overall, the sampling procedure
resulted in a total of 209 (104 intervention and 105 comparison) PHCUs. In each PHCU a health centre, a
satellite health post, three HDA leaders
and 50 households in the catchment
area of the selected health post (for a total of 10,450 households) were surveyed. The proposed sample size of
10,450 households will allow us to
detect differences in coverage rates of
at least 10 percentage points in key
interventions, including ANC, skilled birth attendance and PNC, with 80% power, 5% significance and assuming a design effect of 1.4 and 90% completeness. Confidence intervals given in the intervention comparison area tables in
Annexes II and III have been adjusted
for clustering at PHCU level. Rather
than population based estimates
(which require weighted summaries) the results focus on PHCU clusters, the
basic implementation unit of the CBNC
programme.
In Annex II we present results that
explore the current status of the health
system. The survey comprised of 206
out of the 209 sampled PHCUs. More specifically, it included 104 intervention and 102 comparison area
health centres, health posts and HEWs.
Furthermore the study included 308
HDA leaders from intervention areas
and 297 from comparison areas (making a total of 605 HDA leaders). In health centres and health posts,
the survey assessed facilities’ service
status and readiness to provide MNH
services with a focus on CBNC
programmatic aspects. For HEWs and
HDA leaders, we present data on
training, knowledge and practice in
MNH services. In Annex III we present finding from the household survey. Of the 10,450
households that were sampled, 10,295
household heads were available and
agreed to participate in this study.
There were a total of 10,999 women of reproductive age (15-49 years old) residing in these households, of which 9,999 (91%) were interviewed regarding their fertility history in the
previous two years. Among the 9,999
women, 925 (451 from intervention areas and 474 from comparison areas) had had a live birth in the 12 months
preceding the survey and were asked
questions about that birth. Three call
backs were made to interview any
absent household heads and all
resident women aged 15-49.
All respondents provided informed,
voluntary written consent to be
interviewed. Below are some key findings from intervention and comparison areas
from the health centre, health post,
HEWs, HDA leaders and household
surveys. Detailed information
Annex I
Brief summary of CBNC
survey by intervention
and comparison areas

ANNEX
Community Based Newborn Care baseline survey report 79ideas.lshtm.ac.uk
regarding each of the collected
indicators is available in the tables and figures presented in Annexes II and III. Health system survey
For health centres and health posts,
the survey assessed facilities’ service
status and readiness to provide MNH
services with a focus on CBNC
programmatic aspects. For HEWs and
HDA leaders, we present data on
training, knowledge and practice in
MNH services.
Health centres and health posts in
intervention and comparison areas
were similar in terms of facility description (e.g. electricity). However there were statistically significant differences with respect to the
availability of MNCH related job aids
and administrative forms at health
centre and health post levels (e.g. family health cards). There were also significant differences in the availability of equipment such as a clinical thermometer (89% [95% CI 81,93] vs. 64% [95% CI 54,73]). A higher percentage of health posts in
intervention areas reported having a chart booklet (79% [95% CI 70,86] vs. 52% [95% CI 42,62]. Though health centres were similar with respect to
the availability of medicines and vaccines, there were significant differences between health posts in
intervention and comparison areas
with respect to the availability of iron,
TTC eye ointment and Vitamin A.
Similar percentages of intervention and
comparison area health centres and
health posts reported routinely offering
MNH services.
HEWs and HDA leaders in
intervention and comparison areas
were similar in mean age, years of
education and employment. Among HDA leaders, a significantly higher proportion in intervention areas had
an unprompted knowledge on health
promotion across the continuum of
care. In general, more HEWs in
comparison areas reported receiving
training across the continuum of care
in the previous 12 months. For
example, iCCM training in the last 12 months was reported by 33% (95% CI 24,42) of HEWs in intervention areas and 71% (95% CI 62,79) in comparison areas. The two areas were similar with
respect to HEWs’ and HDA leaders’
linkages, supervision visits received by
HEWs, and HEWs’ unprompted
knowledge of health provision across
the continuum of care.
Household survey
At the household level, intervention
and comparison areas were very
similar in key indicators across the
continuum of care. For the ANC period,
a similar percentage of women in both
areas reported having at least one ANC visit (70% [95% CI 65,74] vs. 68% [95% CI 64,72]); four or more visits (41% [95% CI 37,46] vs. 37% [95% CI 32,41]); and a visit in the first trimester (29% [95% CI 23,35] vs. 24% [95% CI 19,28]). There was also no statistically significant difference between
intervention and comparison areas with respect to home delivery (69% [95% CI 65,74] vs. 75% [95% CI 71,79]). However, a significantly higher percentage of women in intervention
areas reported delivering at a health centre (22% [95% CI 19,27] vs. 14% [11,17]). Indicators for the management of
hypothermia, such as the timing of
newborn drying, wrapping and bathing, were not significantly different between intervention and comparison
areas. Initiation of breastfeeding was also similar, with a little over 60% (62% [95% CI 58,67] vs. 61% [95% CI
56,65]) of women in intervention and comparison areas reporting that they breastfed their newborn in the first hour after birth. Twenty-two percent [95% CI 19,27] of women in intervention areas and 15% [95% CI 12,19] in comparison areas reported
that their newborn was weighed.PNC within the first day was low in both intervention and comparison areas (3% [95% CI 2,6] vs. 7% [95% CI 5,11]), with a little under 20% in each group reporting PNC within the first 28 days. Burden of neonatal illness was
similar in intervention and comparison areas (11% [95% CI 8,15] vs. 13% [95% CI 11,17]). Among those with a reported illness, symptoms for severe
neonatal infection were reported in 32% [95% CI 19, 48] of newborns in intervention areas and 38% [95% CI 28,50] of newborns in comparison
areas.
Overall, although there were some significant differences at health facility level, intervention and comparison
areas were similar with respect to the
majority of indicators for HEWs and
HDA leaders. Intervention and
comparison areas were also similar at
the household level, for key indicators
across the continuum of care. These findings indicate that generally, the intervention and comparison areas are
similar at both health system and
household levels, making the two arms
suitable for the evaluation of the CBNC
Phase 1 programme.
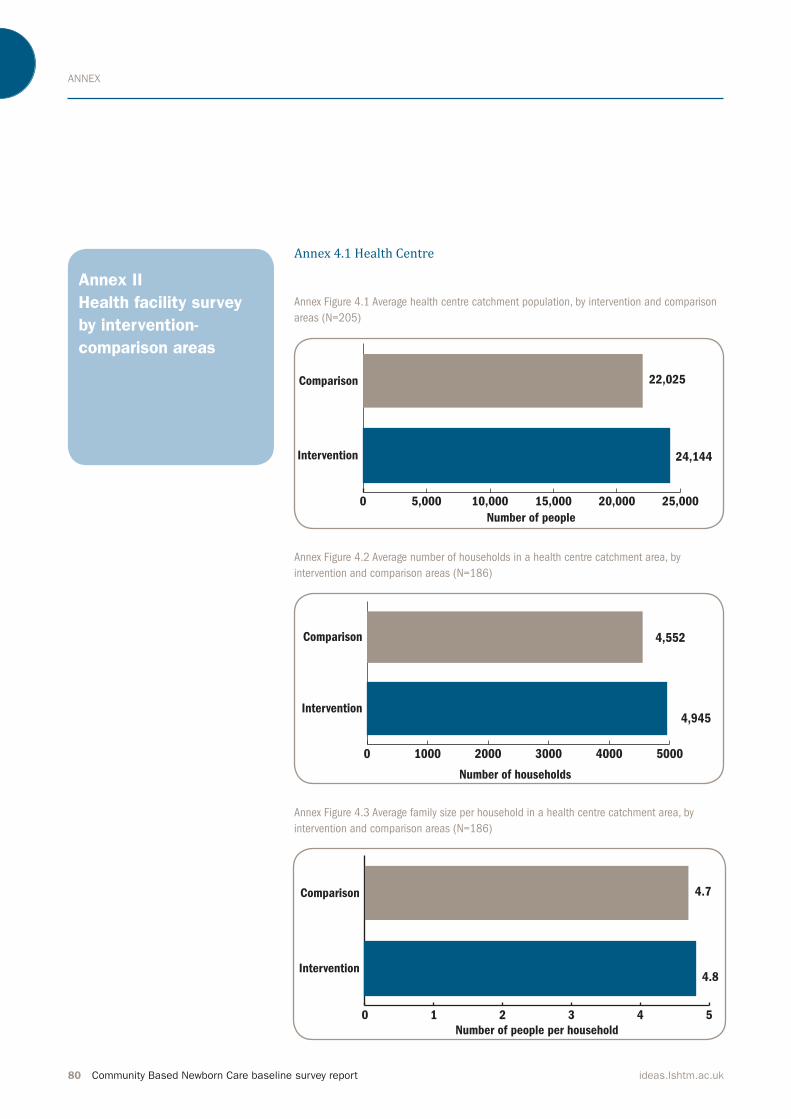
ANNEX
80 Community Based Newborn Care baseline survey report ideas.lshtm.ac.uk
Annex II
Health facility survey
by intervention-
comparison areas
Annex 4.1 Health Centre
Annex Figure 4.1 Average health centre catchment population, by intervention and comparison
areas (N=205)
Annex Figure 4.2 Average number of households in a health centre catchment area, by
intervention and comparison areas (N=186)
Annex Figure 4.3 Average family size per household in a health centre catchment area, by
intervention and comparison areas (N=186)
0 5,000 10,000 15,000 20,000 25,000
Intervention
Comparison
Number of people
24,144
22,025
0 1000 2000 3000 4000 5000
Intervention
Comparison
Number of households
4,945
4,552
0 1 2 3 4 5
Intervention
Comparison
Number of people per household
4.8
4.7

ANNEX
Community Based Newborn Care baseline survey report 81ideas.lshtm.ac.uk
Annex Figure 4.4 Average number of women of reproductive age in a
health centre catchment area, by intervention and comparison areas
(N=154)
Annex Figure 4.5 Average number of women of reproductive age per
household in a health centre catchment area, by intervention and
comparison areas (N=144)
Annex Figure 4.7 Average number of health posts and HEWs in a health
centre catchment area, by intervention and comparison (N = 204)
Annex Figure 4.9 PHCUs: Service utilisation gap across the continuum of
care, by intervention and comparison areas
0 1000 2000 3000 4000 5000 6000 7000 8000
Intervention
Comparison
Number of women of reproductive age
6,257
4,695
0.0 0.2 0.4 0.6 0.8 1.0 1.2
Intervention
Comparison
Number of women of reproductive age per
1.2
1.0
0
2
4
6
8
10
12
ComparisonIntervention
HEWsHealth post
Num
ber
6
5
9
11
0
20
40
60
80
100
20
40
60
80
100
45%
33%
66% 68%
84%89%
Identi
�ed?
Any
AN
C v
isit
s?
Four
AN
C v
isit
s?
Any
PN
C v
isit
s?
Four
PN
C v
isit
s?
% Y
es
% N
o
Antenatal Birth Postnatal
Healt
h f
acilit
y
delive
ry?
55%
67%
34% 32%
16%11%
Among expected
pregnancies
Among expected
deliveries
86% 87%81% 78%
91% 95%
14% 13%19% 22%
9% 5%
Comparison
Intervention
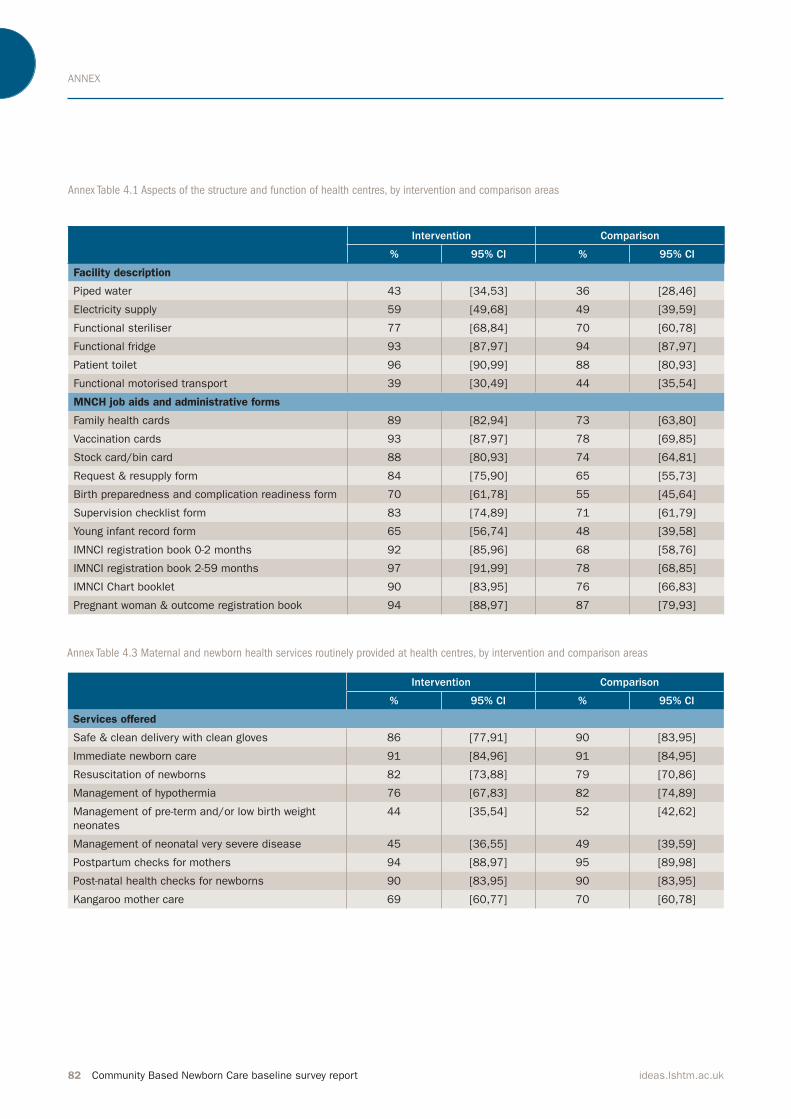
ANNEX
82 Community Based Newborn Care baseline survey report ideas.lshtm.ac.uk
Annex Table 4.1 Aspects of the structure and function of health centres, by intervention and comparison areas
Annex Table 4.3 Maternal and newborn health services routinely provided at health centres, by intervention and comparison areas
Intervention Comparison
% 95% CI % 95% CI
Facility description
Piped water 43 [34,53] 36 [28,46]
Electricity supply 59 [49,68] 49 [39,59]
Functional steriliser 77 [68,84] 70 [60,78]
Functional fridge 93 [87,97] 94 [87,97]
Patient toilet 96 [90,99] 88 [80,93]
Functional motorised transport 39 [30,49] 44 [35,54]
MNCH job aids and administrative forms
Family health cards 89 [82,94] 73 [63,80]
Vaccination cards 93 [87,97] 78 [69,85]
Stock card/bin card 88 [80,93] 74 [64,81]
Request & resupply form 84 [75,90] 65 [55,73]
Birth preparedness and complication readiness form 70 [61,78] 55 [45,64]
Supervision checklist form 83 [74,89] 71 [61,79]
Young infant record form 65 [56,74] 48 [39,58]
IMNCI registration book 0-2 months 92 [85,96] 68 [58,76]
IMNCI registration book 2-59 months 97 [91,99] 78 [68,85]
IMNCI Chart booklet 90 [83,95] 76 [66,83]
Pregnant woman & outcome registration book 94 [88,97] 87 [79,93]
Intervention Comparison
% 95% CI % 95% CI
Services offered
Safe & clean delivery with clean gloves 86 [77,91] 90 [83,95]
Immediate newborn care 91 [84,96] 91 [84,95]
Resuscitation of newborns 82 [73,88] 79 [70,86]
Management of hypothermia 76 [67,83] 82 [74,89]
Management of pre-term and/or low birth weight
neonates
44 [35,54] 52 [42,62]
Management of neonatal very severe disease 45 [36,55] 49 [39,59]
Postpartum checks for mothers 94 [88,97] 95 [89,98]
Post-natal health checks for newborns 90 [83,95] 90 [83,95]
Kangaroo mother care 69 [60,77] 70 [60,78]

ANNEX
Community Based Newborn Care baseline survey report 83ideas.lshtm.ac.uk
Annex Table 4.2 Maternal and newborn health related functional equipment, supplies and medicine available at the health centre on the day of
the survey, by intervention and comparison areas
Intervention Comparison
% 95% CI % 95% CI
Equipment
Blood pressure cuff 95 [89,98] 92 [85,96]
Examination couch 97 [91,99] 93 [86,97]
Privacy curtain 65 [56,74] 36 [28,46]
Clinical thermometer 89 [81,93] 64 [54,73]
Stethoscope 100 n/a 97 [91,99]
Clock 67 [58,76] 53 [43,63]
Washable mackintosh 52 [42,61] 31 [23,41]
Ambu bag 87 [79,92] 83 [75,89]
Infant scale 97 [91,99] 92 [85,96]
Tape measure 91 [84,96] 81 [73,88]
Suction bulb 87 [79,92] 72 [62,80]
Warmer for newborn care 34 [25,43] 17 [11,25]
Supplies
Surgical gloves 95 [89,98] 99 [93,100]
Syringes with needles 98 [93,100] 96 [90,99]
Water for injection 83 [74,89] 79 [70,86]
IV cannula 96 [90,99] 92 [85,96]
Pregnancy test kit 89 [81,93] 85 [77,91]
Proteinuria test kit 63 [53,71] 60 [50,69]
HIV test kit 98 [93,100] 90 [83,95]
Syphilis test kit 51 [41,61] 34 [26,44]
Blood haemoglobin test kit 58 [48,67] 36 [28,46]
Blood glucose test kit 37 [28,46] 25 [17,34]
Medicine/vaccines
Iron 91 [84,96] 80 [72,87]
Folate 65 [56,74] 55 [45,64]
Gentamycin 61 [51,70] 67 [57,75]
Amoxicillin suspension (125mg/5ml) 88 [80,93] 75 [65,82]
Amoxicillin tab 250 mg (dispersible) 84 [75,90] 80 [72,87]
TTC eye ointment 90 [83,95] 80 [72,87]
Vitamin K 1mg 48 [39,58] 47 [38,57]
Vitamin A 200,000 IU 55 [45,64] 39 [30,49]
Vitamin A 100,000 IU 74 [65,82] 63 [53,72]
BCG 89 [82,94] 83 [75,89]
Polio vaccine 89 [81,93] 83 [75,89]
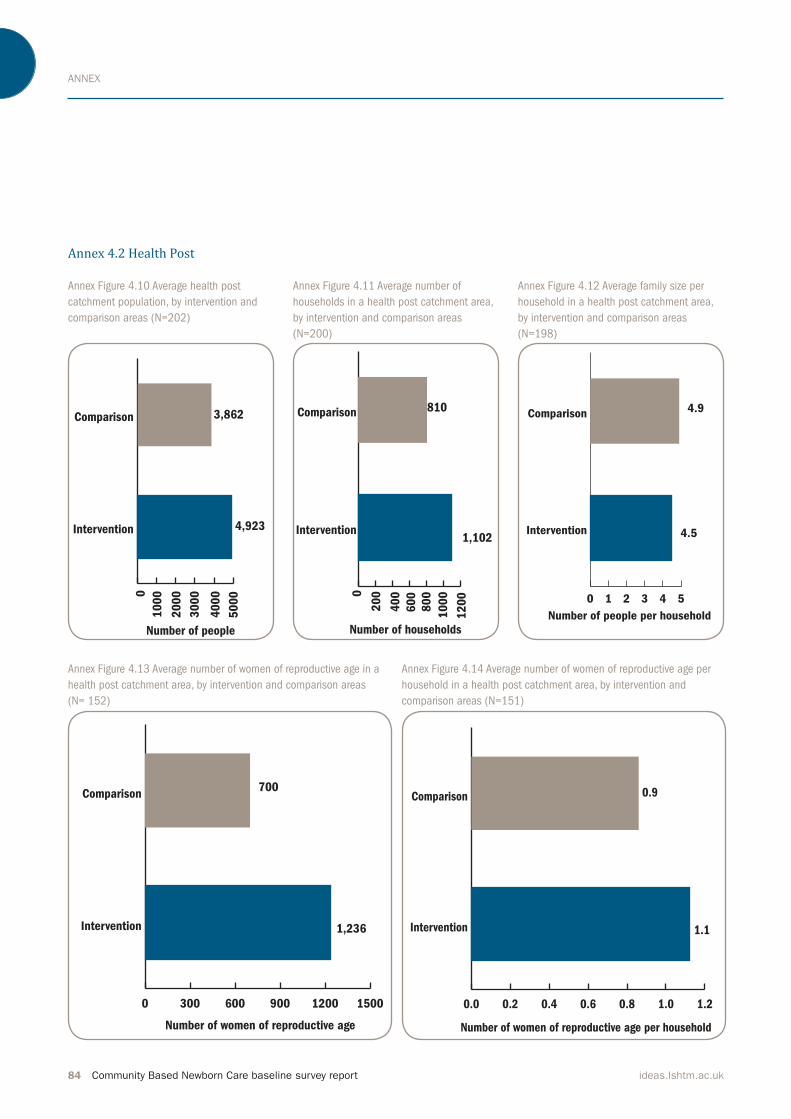
ANNEX
84 Community Based Newborn Care baseline survey report ideas.lshtm.ac.uk
Annex 4.2 Health Post
Annex Figure 4.10 Average health post
catchment population, by intervention and
comparison areas (N=202)
Annex Figure 4.11 Average number of
households in a health post catchment area,
by intervention and comparison areas
(N=200)
Annex Figure 4.12 Average family size per
household in a health post catchment area,
by intervention and comparison areas
(N=198)
Annex Figure 4.13 Average number of women of reproductive age in a
health post catchment area, by intervention and comparison areas
(N= 152)
Annex Figure 4.14 Average number of women of reproductive age per
household in a health post catchment area, by intervention and
comparison areas (N=151)
0
10
00
20
00
30
00
40
00
50
00Intervention
Comparison
Number of people
4,923
3,862
50
00 0
20
0
40
0
60
0
80
0
10
00
12
00Intervention
Comparison
Number of households
1,102
810
12
00 0 1 2 3 4 5
Intervention
Comparison
Number of people per household
4.5
4.9
0 300 600 900 1200 1500
Intervention
Comparison
Number of women of reproductive age
1,236
700
0.0 0.2 0.4 0.6 0.8 1.0 1.2
Intervention
Comparison
Number of women of reproductive age per household
1.1
0.9
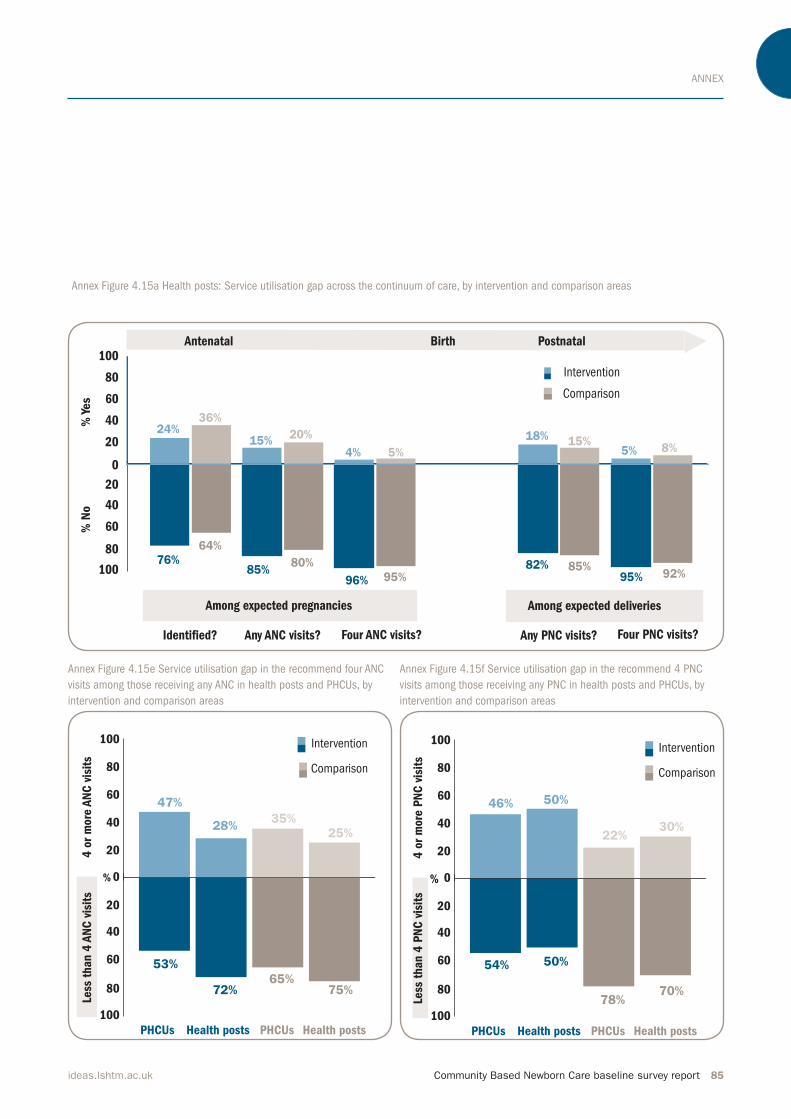
ANNEX
Community Based Newborn Care baseline survey report 85ideas.lshtm.ac.uk
Annex Figure 4.15a Health posts: Service utilisation gap across the continuum of care, by intervention and comparison areas
Annex Figure 4.15e Service utilisation gap in the recommend four ANC
visits among those receiving any ANC in health posts and PHCUs, by
intervention and comparison areas
Annex Figure 4.15f Service utilisation gap in the recommend 4 PNC
visits among those receiving any PNC in health posts and PHCUs, by
intervention and comparison areas
0
20
40
60
80
100
20
40
60
80
100
76%
64%
85%80%
96% 95%
Identi�ed? Any ANC visits? Four ANC visits? Any PNC visits? Four PNC visits?
% Y
es
% N
o
Antenatal Birth Postnatal
24%36%
15%20%
4% 5%
Among expected pregnancies Among expected deliveries
82% 85%95% 92%
18% 15%5% 8%
Comparison
Intervention
0
20
40
60
80
100
20
40
60
80
100
4 o
r m
ore
AN
C v
isit
s
PHCUs Health posts PHCUs Health posts
Less
than 4
AN
C v
isit
s
53%
72%65%
75%
%
47%
28%35%
25%
Comparison
Intervention
0
20
40
60
80
100
20
40
60
80
100
4 o
r m
ore
PN
C v
isit
s
PHCUs Health posts PHCUs Health posts
Less
than 4
PN
C v
isit
s
54% 50%
78%70%
%
46% 50%
22%30%
Comparison
Intervention
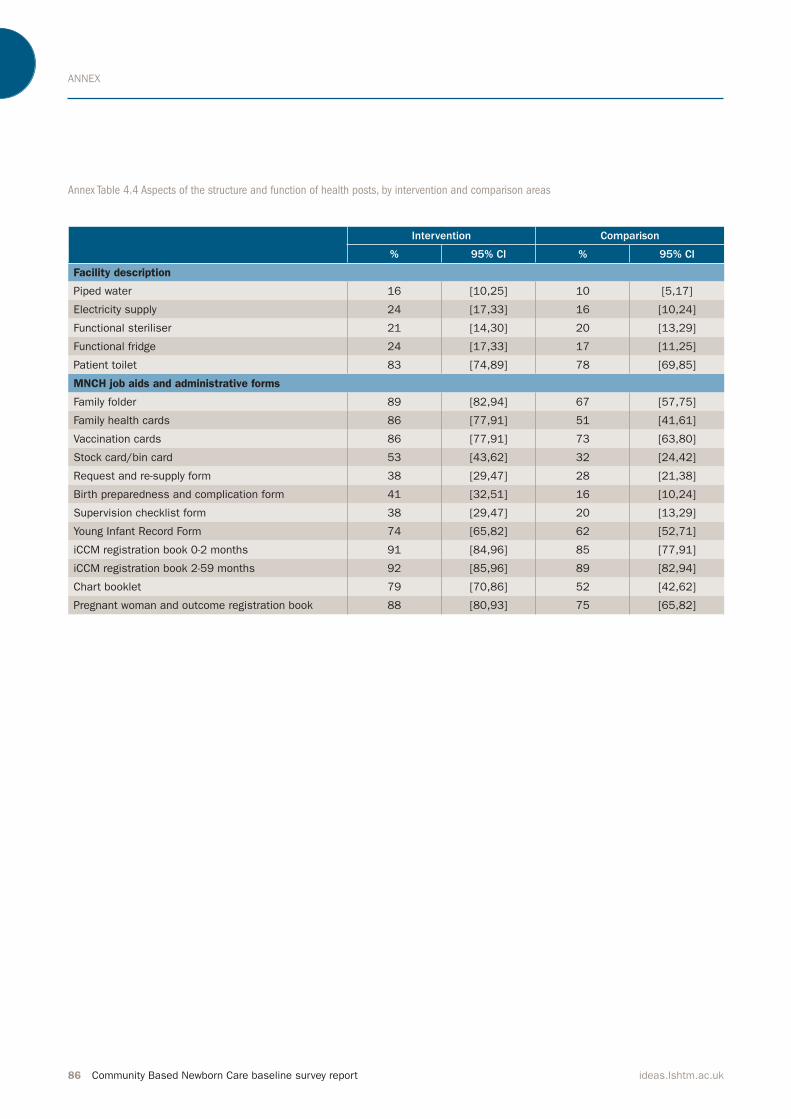
ANNEX
86 Community Based Newborn Care baseline survey report ideas.lshtm.ac.uk
Annex Table 4.4 Aspects of the structure and function of health posts, by intervention and comparison areas
Intervention Comparison
% 95% CI % 95% CI
Facility description
Piped water 16 [10,25] 10 [5,17]
Electricity supply 24 [17,33] 16 [10,24]
Functional steriliser 21 [14,30] 20 [13,29]
Functional fridge 24 [17,33] 17 [11,25]
Patient toilet 83 [74,89] 78 [69,85]
MNCH job aids and administrative forms
Family folder 89 [82,94] 67 [57,75]
Family health cards 86 [77,91] 51 [41,61]
Vaccination cards 86 [77,91] 73 [63,80]
Stock card/bin card 53 [43,62] 32 [24,42]
Request and re-supply form 38 [29,47] 28 [21,38]
Birth preparedness and complication form 41 [32,51] 16 [10,24]
Supervision checklist form 38 [29,47] 20 [13,29]
Young Infant Record Form 74 [65,82] 62 [52,71]
iCCM registration book 0-2 months 91 [84,96] 85 [77,91]
iCCM registration book 2-59 months 92 [85,96] 89 [82,94]
Chart booklet 79 [70,86] 52 [42,62]
Pregnant woman and outcome registration book 88 [80,93] 75 [65,82]
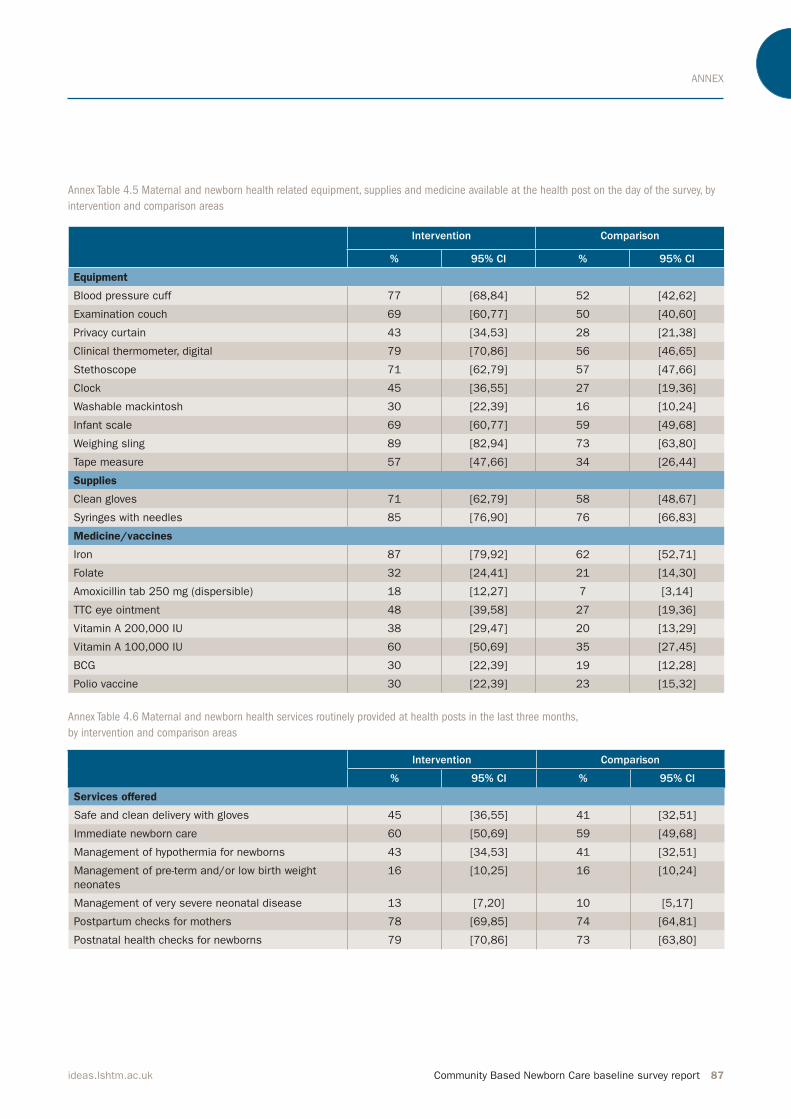
ANNEX
Community Based Newborn Care baseline survey report 87ideas.lshtm.ac.uk
Annex Table 4.5 Maternal and newborn health related equipment, supplies and medicine available at the health post on the day of the survey, by
intervention and comparison areas
Annex Table 4.6 Maternal and newborn health services routinely provided at health posts in the last three months,
by intervention and comparison areas
Intervention Comparison
% 95% CI % 95% CI
Equipment
Blood pressure cuff 77 [68,84] 52 [42,62]
Examination couch 69 [60,77] 50 [40,60]
Privacy curtain 43 [34,53] 28 [21,38]
Clinical thermometer, digital 79 [70,86] 56 [46,65]
Stethoscope 71 [62,79] 57 [47,66]
Clock 45 [36,55] 27 [19,36]
Washable mackintosh 30 [22,39] 16 [10,24]
Infant scale 69 [60,77] 59 [49,68]
Weighing sling 89 [82,94] 73 [63,80]
Tape measure 57 [47,66] 34 [26,44]
Supplies
Clean gloves 71 [62,79] 58 [48,67]
Syringes with needles 85 [76,90] 76 [66,83]
Medicine/vaccines
Iron 87 [79,92] 62 [52,71]
Folate 32 [24,41] 21 [14,30]
Amoxicillin tab 250 mg (dispersible) 18 [12,27] 7 [3,14]
TTC eye ointment 48 [39,58] 27 [19,36]
Vitamin A 200,000 IU 38 [29,47] 20 [13,29]
Vitamin A 100,000 IU 60 [50,69] 35 [27,45]
BCG 30 [22,39] 19 [12,28]
Polio vaccine 30 [22,39] 23 [15,32]
Intervention Comparison
% 95% CI % 95% CI
Services offered
Safe and clean delivery with gloves 45 [36,55] 41 [32,51]
Immediate newborn care 60 [50,69] 59 [49,68]
Management of hypothermia for newborns 43 [34,53] 41 [32,51]
Management of pre-term and/or low birth weight
neonates
16 [10,25] 16 [10,24]
Management of very severe neonatal disease 13 [7,20] 10 [5,17]
Postpartum checks for mothers 78 [69,85] 74 [64,81]
Postnatal health checks for newborns 79 [70,86] 73 [63,80]

ANNEX
88 Community Based Newborn Care baseline survey report ideas.lshtm.ac.uk
Annex 4.3 Health Extension Worker
Annex Table 4.7 HEWs’ background information and professional history, by intervention and comparison areas
Annex Table 4.8 HEWs’ training received across the continuum of care in the last 12 months, by intervention and comparison areas
Intervention Comparison
Age in years Mean (SD) 27 (4) 26 (3)
Years of education Mean (SD) 11 (1) 11 (1)
Employment duration in years Mean (SD) 5 (2) 5 (3)
Employment duration locally in years Mean (SD) 5 (2) 4 (3)
Local residence % [95% CI] 88 [80,93] 87 [79,93]
Intervention Comparison
% 95% CI % 95% CI
ANC period
Family planning services 34 [25,43] 39 [30,49]
ANC services 23 [16,32] 31 [23,41]
Estimated due date assessment 22 [15,31] 27 [19,36]
Birth preparedness 38 [29,47] 48 [39,58]
PMTCT counselling 26 [18,35] 28 [20,37]
Childbirth period
Attending normal deliveries 18 [12,27] 21 [14,30]
Misoprostol 7 [3,14] 4 [2,10]
Managing asphyxia 16 [10,25] 40 [31,50]
Postnatal period
Postpartum care 30 [22,39] 40 [31,50]
Postnatal care 23 [16,32] 45 [36,55]
Local bacterial infection 13 [7,20] 38 [29,48]
Neonatal jaundice 15 [10,24] 28 [21,38]
Neonatal diarrhoea 21 [14,30] 52 [42,62]
Neonatal underweight 27 [19,36] 49 [39,59]
Severe newborn infection
Identifying signs of severe newborn illness 19 [13,28] 36 [28,46]
Integrated MNH training 26 [18,35] 39 [30,49]
iCCM training 33 [24, 42] 71 [62, 79]
Table 4.9a HEWs’ unprompted knowledge of health provision across the continuum of care, by intervention and comparison areas: maternal
see page 90
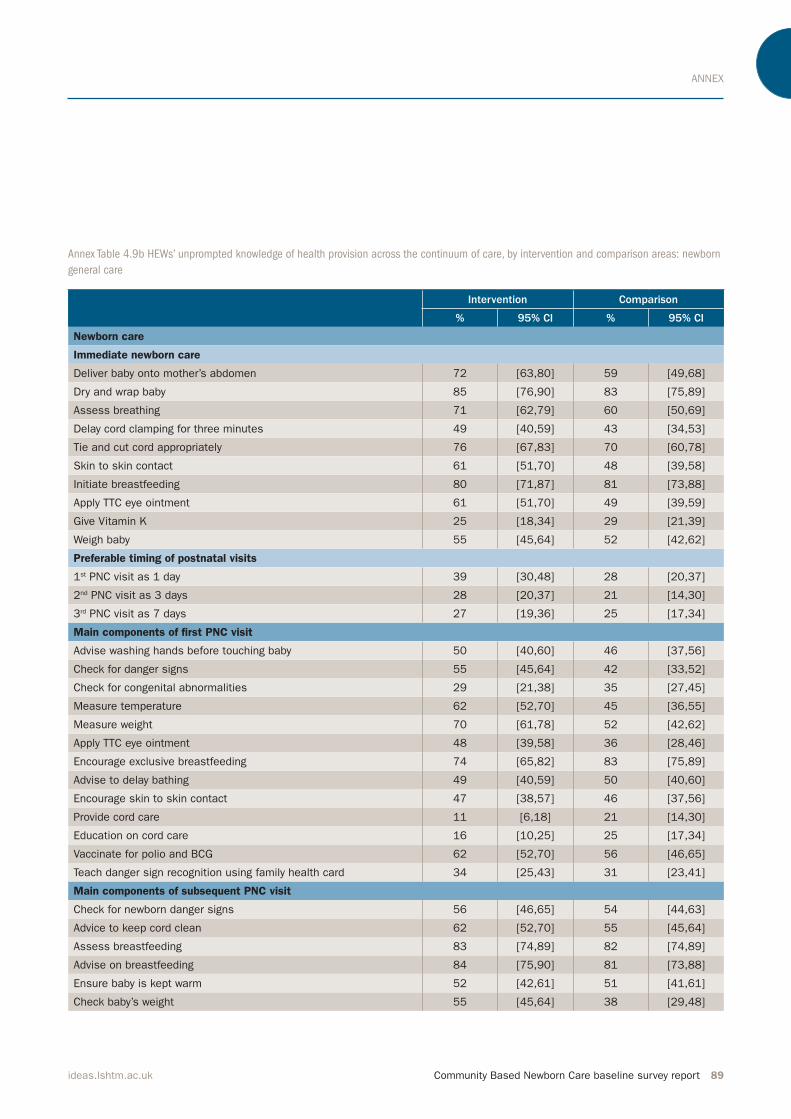
ANNEX
Community Based Newborn Care baseline survey report 89ideas.lshtm.ac.uk
Intervention Comparison
% 95% CI % 95% CI
Newborn care
Immediate newborn care
Deliver baby onto mother’s abdomen 72 [63,80] 59 [49,68]
Dry and wrap baby 85 [76,90] 83 [75,89]
Assess breathing 71 [62,79] 60 [50,69]
Delay cord clamping for three minutes 49 [40,59] 43 [34,53]
Tie and cut cord appropriately 76 [67,83] 70 [60,78]
Skin to skin contact 61 [51,70] 48 [39,58]
Initiate breastfeeding 80 [71,87] 81 [73,88]
Apply TTC eye ointment 61 [51,70] 49 [39,59]
Give Vitamin K 25 [18,34] 29 [21,39]
Weigh baby 55 [45,64] 52 [42,62]
Preferable timing of postnatal visits
1st PNC visit as 1 day 39 [30,48] 28 [20,37]
2nd PNC visit as 3 days 28 [20,37] 21 [14,30]
3rd PNC visit as 7 days 27 [19,36] 25 [17,34]
Main components of first PNC visit
Advise washing hands before touching baby 50 [40,60] 46 [37,56]
Check for danger signs 55 [45,64] 42 [33,52]
Check for congenital abnormalities 29 [21,38] 35 [27,45]
Measure temperature 62 [52,70] 45 [36,55]
Measure weight 70 [61,78] 52 [42,62]
Apply TTC eye ointment 48 [39,58] 36 [28,46]
Encourage exclusive breastfeeding 74 [65,82] 83 [75,89]
Advise to delay bathing 49 [40,59] 50 [40,60]
Encourage skin to skin contact 47 [38,57] 46 [37,56]
Provide cord care 11 [6,18] 21 [14,30]
Education on cord care 16 [10,25] 25 [17,34]
Vaccinate for polio and BCG 62 [52,70] 56 [46,65]
Teach danger sign recognition using family health card 34 [25,43] 31 [23,41]
Main components of subsequent PNC visit
Check for newborn danger signs 56 [46,65] 54 [44,63]
Advice to keep cord clean 62 [52,70] 55 [45,64]
Assess breastfeeding 83 [74,89] 82 [74,89]
Advise on breastfeeding 84 [75,90] 81 [73,88]
Ensure baby is kept warm 52 [42,61] 51 [41,61]
Check baby’s weight 55 [45,64] 38 [29,48]
Annex Table 4.9b HEWs’ unprompted knowledge of health provision across the continuum of care, by intervention and comparison areas: newborn
general care
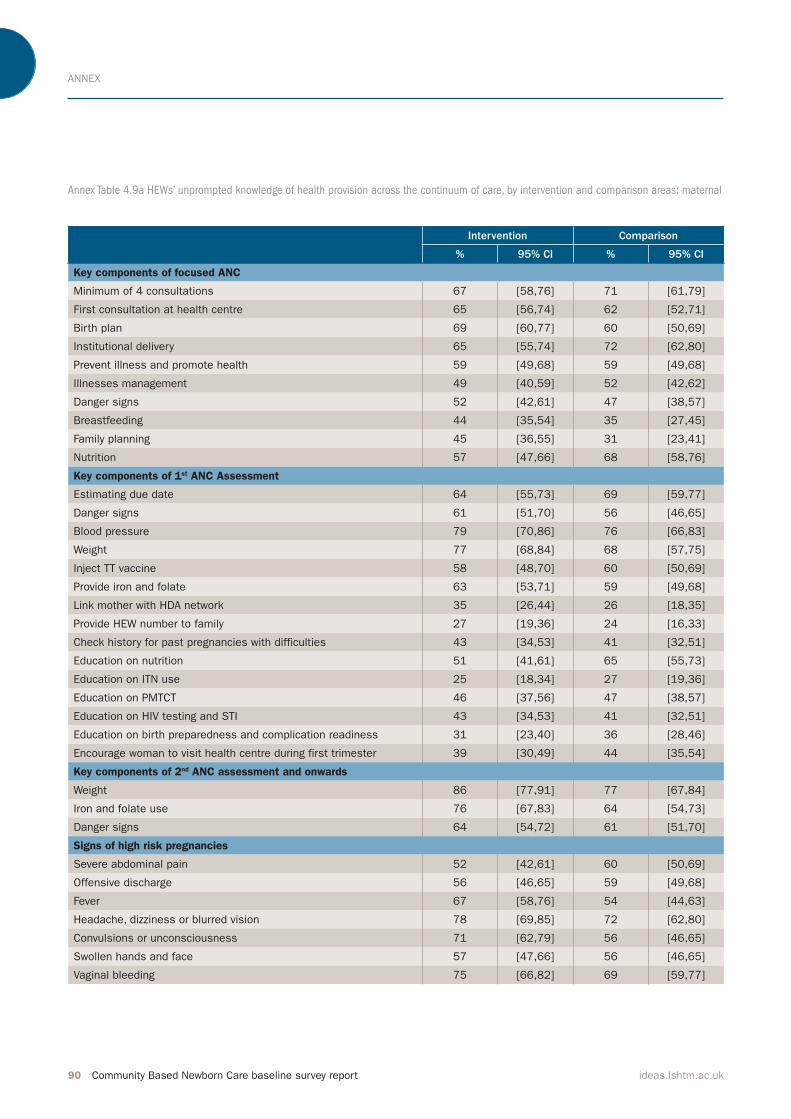
ANNEX
90 Community Based Newborn Care baseline survey report ideas.lshtm.ac.uk
Annex Table 4.9a HEWs’ unprompted knowledge of health provision across the continuum of care, by intervention and comparison areas: maternal
Intervention Comparison
% 95% CI % 95% CI
Key components of focused ANC
Minimum of 4 consultations 67 [58,76] 71 [61,79]
First consultation at health centre 65 [56,74] 62 [52,71]
Birth plan 69 [60,77] 60 [50,69]
Institutional delivery 65 [55,74] 72 [62,80]
Prevent illness and promote health 59 [49,68] 59 [49,68]
Illnesses management 49 [40,59] 52 [42,62]
Danger signs 52 [42,61] 47 [38,57]
Breastfeeding 44 [35,54] 35 [27,45]
Family planning 45 [36,55] 31 [23,41]
Nutrition 57 [47,66] 68 [58,76]
Key components of 1st ANC Assessment
Estimating due date 64 [55,73] 69 [59,77]
Danger signs 61 [51,70] 56 [46,65]
Blood pressure 79 [70,86] 76 [66,83]
Weight 77 [68,84] 68 [57,75]
Inject TT vaccine 58 [48,70] 60 [50,69]
Provide iron and folate 63 [53,71] 59 [49,68]
Link mother with HDA network 35 [26,44] 26 [18,35]
Provide HEW number to family 27 [19,36] 24 [16,33]
Check history for past pregnancies with difficulties 43 [34,53] 41 [32,51]
Education on nutrition 51 [41,61] 65 [55,73]
Education on ITN use 25 [18,34] 27 [19,36]
Education on PMTCT 46 [37,56] 47 [38,57]
Education on HIV testing and STI 43 [34,53] 41 [32,51]
Education on birth preparedness and complication readiness 31 [23,40] 36 [28,46]
Encourage woman to visit health centre during first trimester 39 [30,49] 44 [35,54]
Key components of 2nd ANC assessment and onwards
Weight 86 [77,91] 77 [67,84]
Iron and folate use 76 [67,83] 64 [54,73]
Danger signs 64 [54,72] 61 [51,70]
Signs of high risk pregnancies
Severe abdominal pain 52 [42,61] 60 [50,69]
Offensive discharge 56 [46,65] 59 [49,68]
Fever 67 [58,76] 54 [44,63]
Headache, dizziness or blurred vision 78 [69,85] 72 [62,80]
Convulsions or unconsciousness 71 [62,79] 56 [46,65]
Swollen hands and face 57 [47,66] 56 [46,65]
Vaginal bleeding 75 [66,82] 69 [59,77]
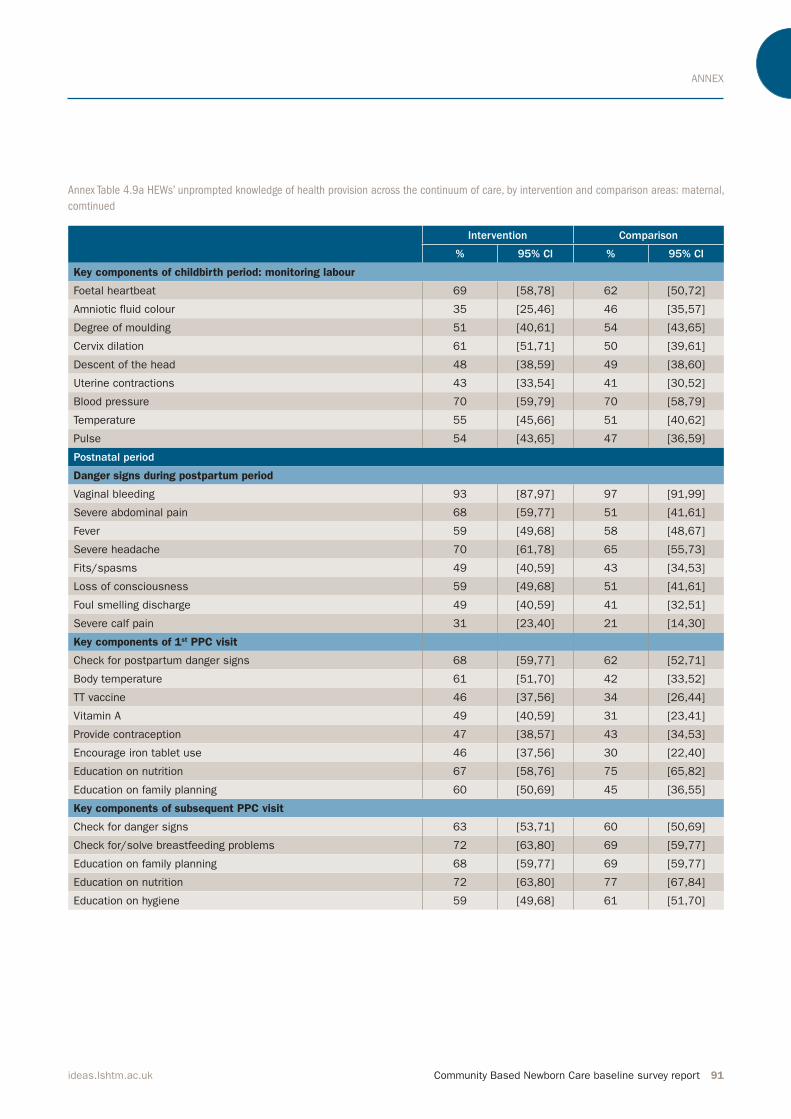
ANNEX
Community Based Newborn Care baseline survey report 91ideas.lshtm.ac.uk
Annex Table 4.9a HEWs’ unprompted knowledge of health provision across the continuum of care, by intervention and comparison areas: maternal,
comtinued
Intervention Comparison
% 95% CI % 95% CI
Key components of childbirth period: monitoring labour
Foetal heartbeat 69 [58,78] 62 [50,72]
Amniotic fluid colour 35 [25,46] 46 [35,57]
Degree of moulding 51 [40,61] 54 [43,65]
Cervix dilation 61 [51,71] 50 [39,61]
Descent of the head 48 [38,59] 49 [38,60]
Uterine contractions 43 [33,54] 41 [30,52]
Blood pressure 70 [59,79] 70 [58,79]
Temperature 55 [45,66] 51 [40,62]
Pulse 54 [43,65] 47 [36,59]
Postnatal period
Danger signs during postpartum period
Vaginal bleeding 93 [87,97] 97 [91,99]
Severe abdominal pain 68 [59,77] 51 [41,61]
Fever 59 [49,68] 58 [48,67]
Severe headache 70 [61,78] 65 [55,73]
Fits/spasms 49 [40,59] 43 [34,53]
Loss of consciousness 59 [49,68] 51 [41,61]
Foul smelling discharge 49 [40,59] 41 [32,51]
Severe calf pain 31 [23,40] 21 [14,30]
Key components of 1st PPC visit
Check for postpartum danger signs 68 [59,77] 62 [52,71]
Body temperature 61 [51,70] 42 [33,52]
TT vaccine 46 [37,56] 34 [26,44]
Vitamin A 49 [40,59] 31 [23,41]
Provide contraception 47 [38,57] 43 [34,53]
Encourage iron tablet use 46 [37,56] 30 [22,40]
Education on nutrition 67 [58,76] 75 [65,82]
Education on family planning 60 [50,69] 45 [36,55]
Key components of subsequent PPC visit
Check for danger signs 63 [53,71] 60 [50,69]
Check for/solve breastfeeding problems 72 [63,80] 69 [59,77]
Education on family planning 68 [59,77] 69 [59,77]
Education on nutrition 72 [63,80] 77 [67,84]
Education on hygiene 59 [49,68] 61 [51,70]
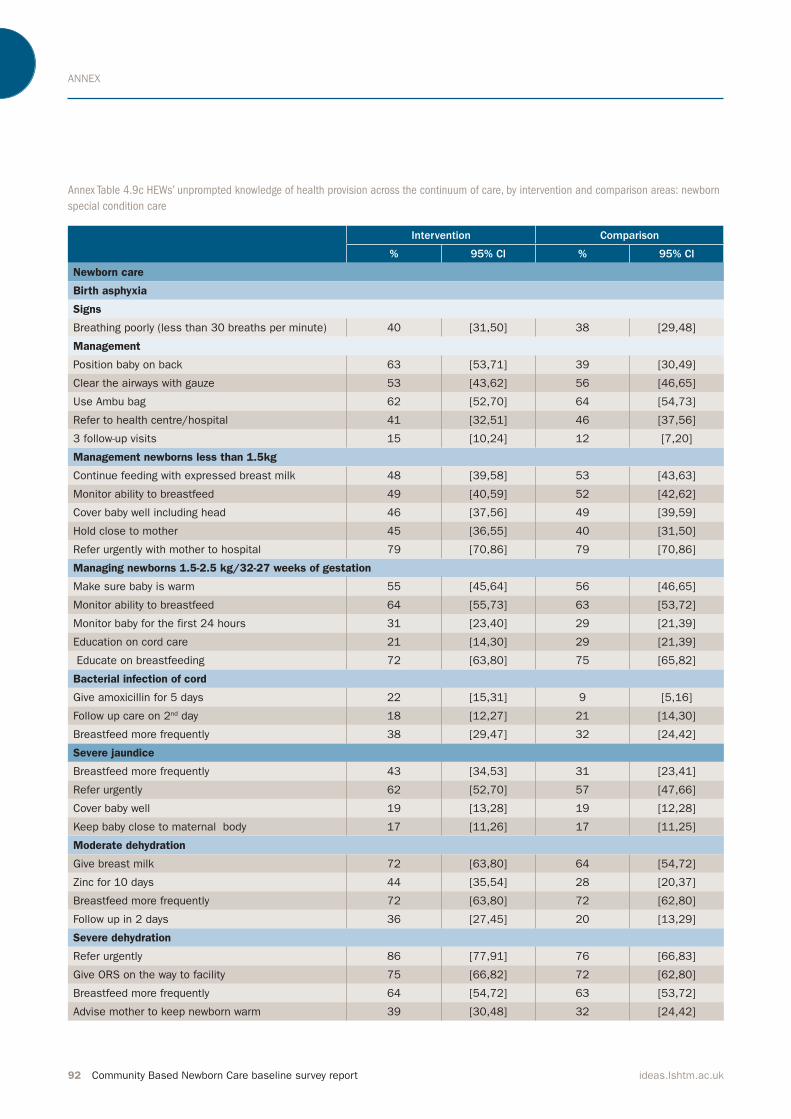
ANNEX
92 Community Based Newborn Care baseline survey report ideas.lshtm.ac.uk
Annex Table 4.9c HEWs’ unprompted knowledge of health provision across the continuum of care, by intervention and comparison areas: newborn
special condition care
Intervention Comparison
% 95% CI % 95% CI
Newborn care
Birth asphyxia
Signs
Breathing poorly (less than 30 breaths per minute) 40 [31,50] 38 [29,48]
Management
Position baby on back 63 [53,71] 39 [30,49]
Clear the airways with gauze 53 [43,62] 56 [46,65]
Use Ambu bag 62 [52,70] 64 [54,73]
Refer to health centre/hospital 41 [32,51] 46 [37,56]
3 follow-up visits 15 [10,24] 12 [7,20]
Management newborns less than 1.5kg
Continue feeding with expressed breast milk 48 [39,58] 53 [43,63]
Monitor ability to breastfeed 49 [40,59] 52 [42,62]
Cover baby well including head 46 [37,56] 49 [39,59]
Hold close to mother 45 [36,55] 40 [31,50]
Refer urgently with mother to hospital 79 [70,86] 79 [70,86]
Managing newborns 1.5-2.5 kg/32-27 weeks of gestation
Make sure baby is warm 55 [45,64] 56 [46,65]
Monitor ability to breastfeed 64 [55,73] 63 [53,72]
Monitor baby for the first 24 hours 31 [23,40] 29 [21,39]
Education on cord care 21 [14,30] 29 [21,39]
Educate on breastfeeding 72 [63,80] 75 [65,82]
Bacterial infection of cord
Give amoxicillin for 5 days 22 [15,31] 9 [5,16]
Follow up care on 2nd day 18 [12,27] 21 [14,30]
Breastfeed more frequently 38 [29,47] 32 [24,42]
Severe jaundice
Breastfeed more frequently 43 [34,53] 31 [23,41]
Refer urgently 62 [52,70] 57 [47,66]
Cover baby well 19 [13,28] 19 [12,28]
Keep baby close to maternal body 17 [11,26] 17 [11,25]
Moderate dehydration
Give breast milk 72 [63,80] 64 [54,72]
Zinc for 10 days 44 [35,54] 28 [20,37]
Breastfeed more frequently 72 [63,80] 72 [62,80]
Follow up in 2 days 36 [27,45] 20 [13,29]
Severe dehydration
Refer urgently 86 [77,91] 76 [66,83]
Give ORS on the way to facility 75 [66,82] 72 [62,80]
Breastfeed more frequently 64 [54,72] 63 [53,72]
Advise mother to keep newborn warm 39 [30,48] 32 [24,42]
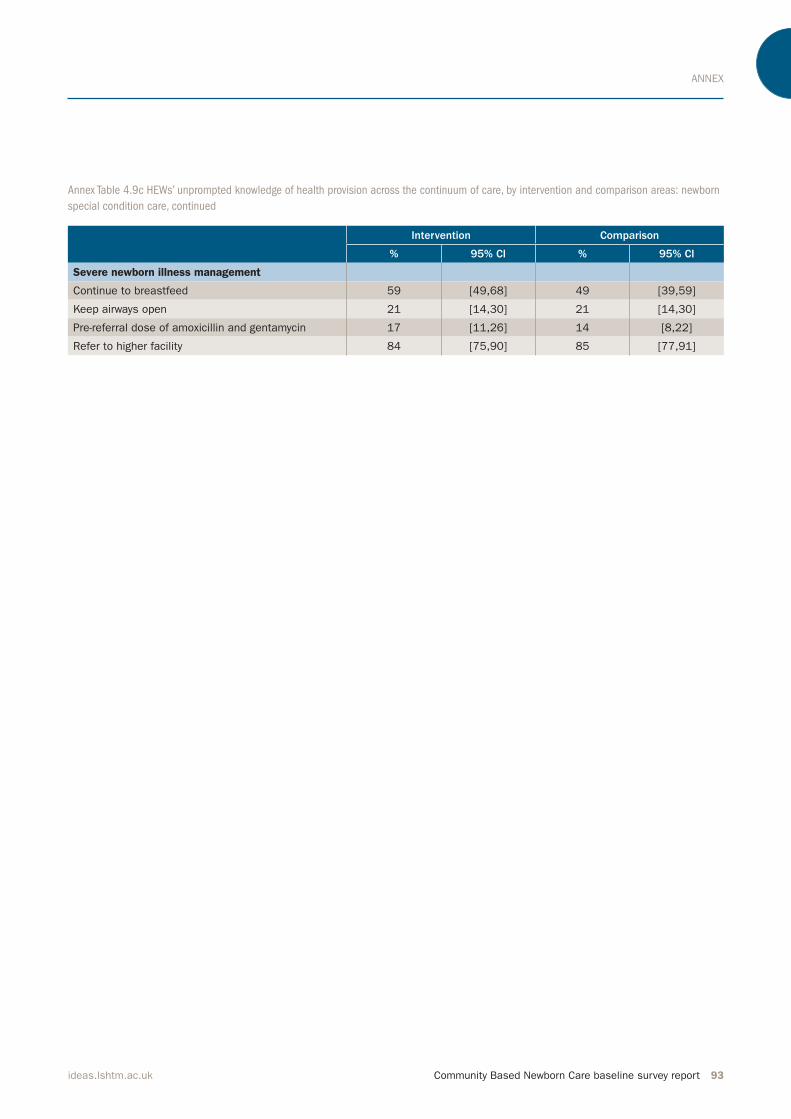
ANNEX
Community Based Newborn Care baseline survey report 93ideas.lshtm.ac.uk
Intervention Comparison
% 95% CI % 95% CI
Severe newborn illness management
Continue to breastfeed 59 [49,68] 49 [39,59]
Keep airways open 21 [14,30] 21 [14,30]
Pre-referral dose of amoxicillin and gentamycin 17 [11,26] 14 [8,22]
Refer to higher facility 84 [75,90] 85 [77,91]
Annex Table 4.9c HEWs’ unprompted knowledge of health provision across the continuum of care, by intervention and comparison areas: newborn
special condition care, continued
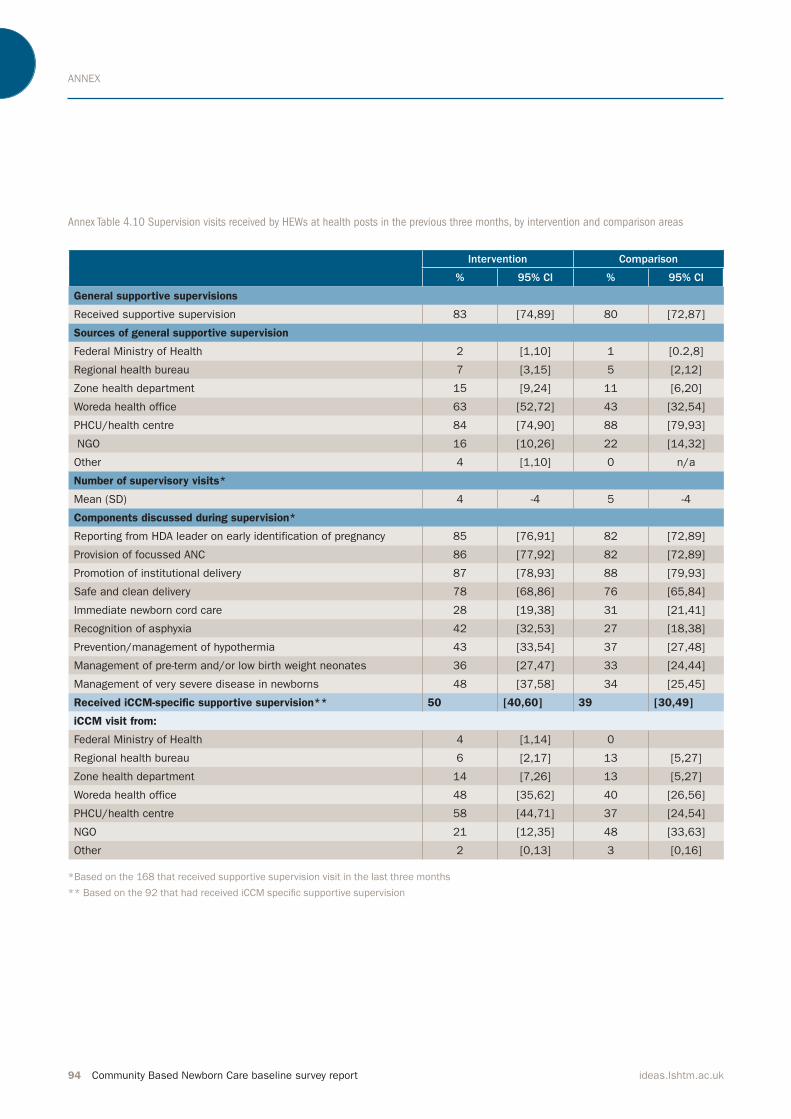
ANNEX
94 Community Based Newborn Care baseline survey report ideas.lshtm.ac.uk
Annex Table 4.10 Supervision visits received by HEWs at health posts in the previous three months, by intervention and comparison areas
Intervention Comparison
% 95% CI % 95% CI
General supportive supervisions
Received supportive supervision 83 [74,89] 80 [72,87]
Sources of general supportive supervision
Federal Ministry of Health 2 [1,10] 1 [0.2,8]
Regional health bureau 7 [3,15] 5 [2,12]
Zone health department 15 [9,24] 11 [6,20]
Woreda health office 63 [52,72] 43 [32,54]
PHCU/health centre 84 [74,90] 88 [79,93]
NGO 16 [10,26] 22 [14,32]
Other 4 [1,10] 0 n/a
Number of supervisory visits*
Mean (SD) 4 -4 5 -4
Components discussed during supervision*
Reporting from HDA leader on early identification of pregnancy 85 [76,91] 82 [72,89]
Provision of focussed ANC 86 [77,92] 82 [72,89]
Promotion of institutional delivery 87 [78,93] 88 [79,93]
Safe and clean delivery 78 [68,86] 76 [65,84]
Immediate newborn cord care 28 [19,38] 31 [21,41]
Recognition of asphyxia 42 [32,53] 27 [18,38]
Prevention/management of hypothermia 43 [33,54] 37 [27,48]
Management of pre-term and/or low birth weight neonates 36 [27,47] 33 [24,44]
Management of very severe disease in newborns 48 [37,58] 34 [25,45]
Received iCCM-specific supportive supervision** 50 [40,60] 39 [30,49]
iCCM visit from:
Federal Ministry of Health 4 [1,14] 0
Regional health bureau 6 [2,17] 13 [5,27]
Zone health department 14 [7,26] 13 [5,27]
Woreda health office 48 [35,62] 40 [26,56]
PHCU/health centre 58 [44,71] 37 [24,54]
NGO 21 [12,35] 48 [33,63]
Other 2 [0,13] 3 [0,16]
*Based on the 168 that received supportive supervision visit in the last three months
** Based on the 92 that had received iCCM speciic supportive supervision
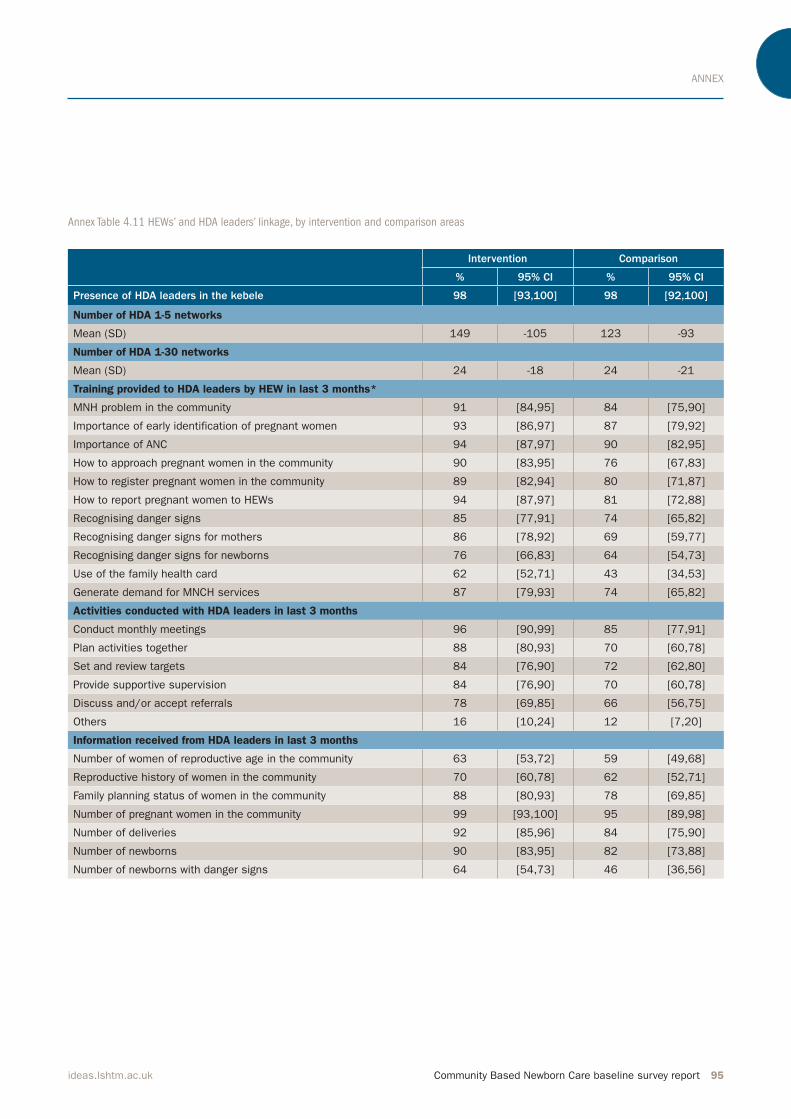
ANNEX
Community Based Newborn Care baseline survey report 95ideas.lshtm.ac.uk
Annex Table 4.11 HEWs’ and HDA leaders’ linkage, by intervention and comparison areas
Intervention Comparison
% 95% CI % 95% CI
Presence of HDA leaders in the kebele 98 [93,100] 98 [92,100]
Number of HDA 1-5 networks
Mean (SD) 149 -105 123 -93
Number of HDA 1-30 networks
Mean (SD) 24 -18 24 -21
Training provided to HDA leaders by HEW in last 3 months*
MNH problem in the community 91 [84,95] 84 [75,90]
Importance of early identification of pregnant women 93 [86,97] 87 [79,92]
Importance of ANC 94 [87,97] 90 [82,95]
How to approach pregnant women in the community 90 [83,95] 76 [67,83]
How to register pregnant women in the community 89 [82,94] 80 [71,87]
How to report pregnant women to HEWs 94 [87,97] 81 [72,88]
Recognising danger signs 85 [77,91] 74 [65,82]
Recognising danger signs for mothers 86 [78,92] 69 [59,77]
Recognising danger signs for newborns 76 [66,83] 64 [54,73]
Use of the family health card 62 [52,71] 43 [34,53]
Generate demand for MNCH services 87 [79,93] 74 [65,82]
Activities conducted with HDA leaders in last 3 months
Conduct monthly meetings 96 [90,99] 85 [77,91]
Plan activities together 88 [80,93] 70 [60,78]
Set and review targets 84 [76,90] 72 [62,80]
Provide supportive supervision 84 [76,90] 70 [60,78]
Discuss and/or accept referrals 78 [69,85] 66 [56,75]
Others 16 [10,24] 12 [7,20]
Information received from HDA leaders in last 3 months
Number of women of reproductive age in the community 63 [53,72] 59 [49,68]
Reproductive history of women in the community 70 [60,78] 62 [52,71]
Family planning status of women in the community 88 [80,93] 78 [69,85]
Number of pregnant women in the community 99 [93,100] 95 [89,98]
Number of deliveries 92 [85,96] 84 [75,90]
Number of newborns 90 [83,95] 82 [73,88]
Number of newborns with danger signs 64 [54,73] 46 [36,56]
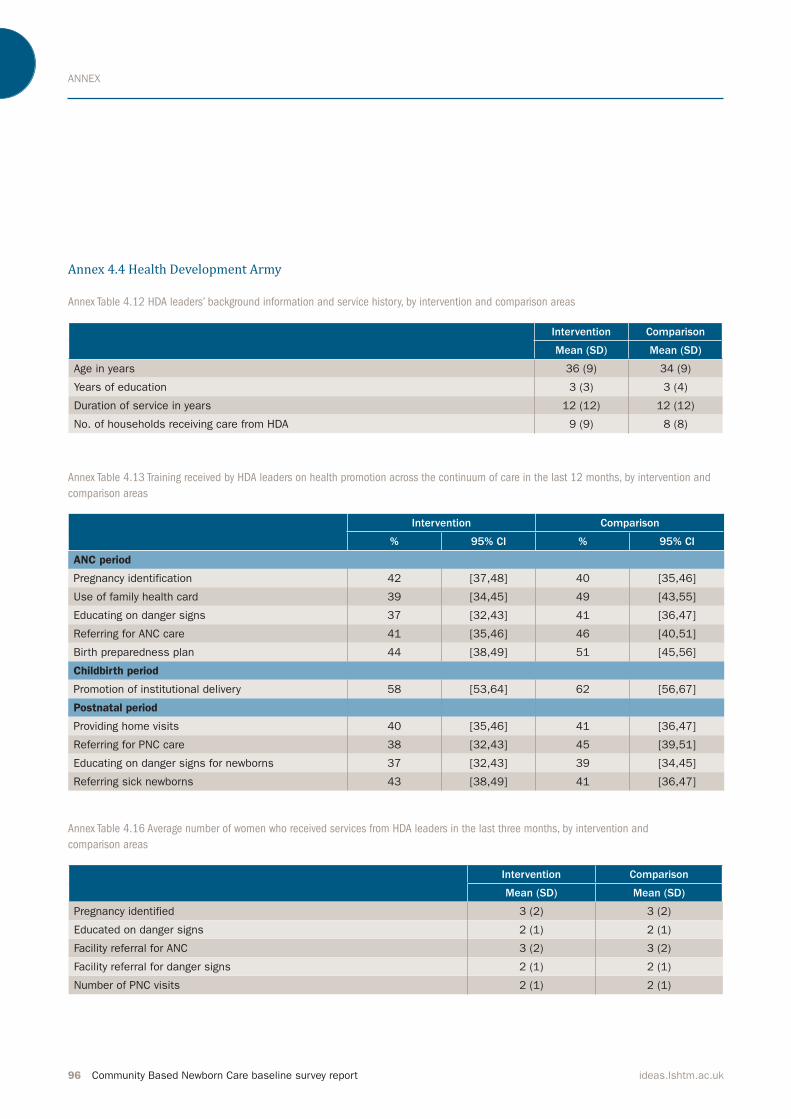
ANNEX
96 Community Based Newborn Care baseline survey report ideas.lshtm.ac.uk
Annex 4.4 Health Development Army
Annex Table 4.12 HDA leaders’ background information and service history, by intervention and comparison areas
Annex Table 4.13 Training received by HDA leaders on health promotion across the continuum of care in the last 12 months, by intervention and
comparison areas
Annex Table 4.16 Average number of women who received services from HDA leaders in the last three months, by intervention and
comparison areas
Intervention Comparison
Mean (SD) Mean (SD)
Age in years 36 (9) 34 (9)
Years of education 3 (3) 3 (4)
Duration of service in years 12 (12) 12 (12)
No. of households receiving care from HDA 9 (9) 8 (8)
Intervention Comparison
% 95% CI % 95% CI
ANC period
Pregnancy identification 42 [37,48] 40 [35,46]
Use of family health card 39 [34,45] 49 [43,55]
Educating on danger signs 37 [32,43] 41 [36,47]
Referring for ANC care 41 [35,46] 46 [40,51]
Birth preparedness plan 44 [38,49] 51 [45,56]
Childbirth period
Promotion of institutional delivery 58 [53,64] 62 [56,67]
Postnatal period
Providing home visits 40 [35,46] 41 [36,47]
Referring for PNC care 38 [32,43] 45 [39,51]
Educating on danger signs for newborns 37 [32,43] 39 [34,45]
Referring sick newborns 43 [38,49] 41 [36,47]
Intervention Comparison
Mean (SD) Mean (SD)
Pregnancy identified 3 (2) 3 (2)
Educated on danger signs 2 (1) 2 (1)
Facility referral for ANC 3 (2) 3 (2)
Facility referral for danger signs 2 (1) 2 (1)
Number of PNC visits 2 (1) 2 (1)
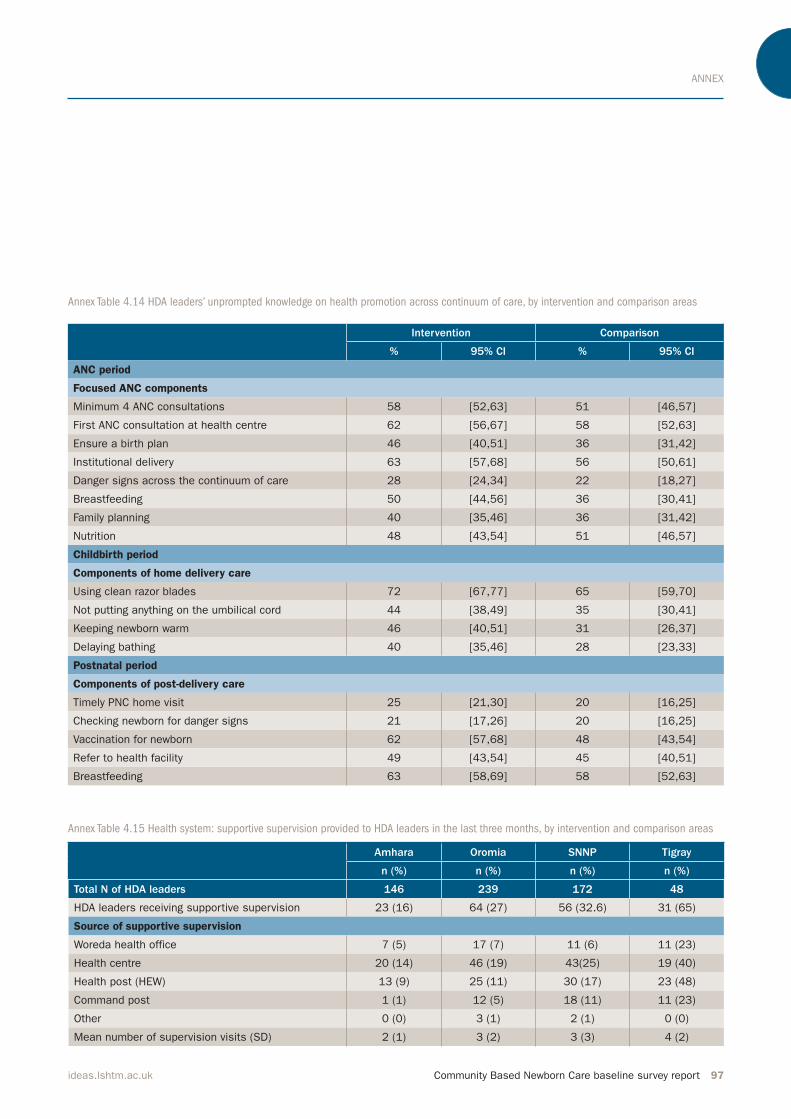
ANNEX
Community Based Newborn Care baseline survey report 97ideas.lshtm.ac.uk
Annex Table 4.14 HDA leaders’ unprompted knowledge on health promotion across continuum of care, by intervention and comparison areas
Annex Table 4.15 Health system: supportive supervision provided to HDA leaders in the last three months, by intervention and comparison areas
Intervention Comparison
% 95% CI % 95% CI
ANC period
Focused ANC components
Minimum 4 ANC consultations 58 [52,63] 51 [46,57]
First ANC consultation at health centre 62 [56,67] 58 [52,63]
Ensure a birth plan 46 [40,51] 36 [31,42]
Institutional delivery 63 [57,68] 56 [50,61]
Danger signs across the continuum of care 28 [24,34] 22 [18,27]
Breastfeeding 50 [44,56] 36 [30,41]
Family planning 40 [35,46] 36 [31,42]
Nutrition 48 [43,54] 51 [46,57]
Childbirth period
Components of home delivery care
Using clean razor blades 72 [67,77] 65 [59,70]
Not putting anything on the umbilical cord 44 [38,49] 35 [30,41]
Keeping newborn warm 46 [40,51] 31 [26,37]
Delaying bathing 40 [35,46] 28 [23,33]
Postnatal period
Components of post-delivery care
Timely PNC home visit 25 [21,30] 20 [16,25]
Checking newborn for danger signs 21 [17,26] 20 [16,25]
Vaccination for newborn 62 [57,68] 48 [43,54]
Refer to health facility 49 [43,54] 45 [40,51]
Breastfeeding 63 [58,69] 58 [52,63]
Amhara Oromia SNNP Tigray
n (%) n (%) n (%) n (%)
Total N of HDA leaders 146 239 172 48
HDA leaders receiving supportive supervision 23 (16) 64 (27) 56 (32.6) 31 (65)
Source of supportive supervision
Woreda health office 7 (5) 17 (7) 11 (6) 11 (23)
Health centre 20 (14) 46 (19) 43(25) 19 (40)
Health post (HEW) 13 (9) 25 (11) 30 (17) 23 (48)
Command post 1 (1) 12 (5) 18 (11) 11 (23)
Other 0 (0) 3 (1) 2 (1) 0 (0)
Mean number of supervision visits (SD) 2 (1) 3 (2) 3 (3) 4 (2)
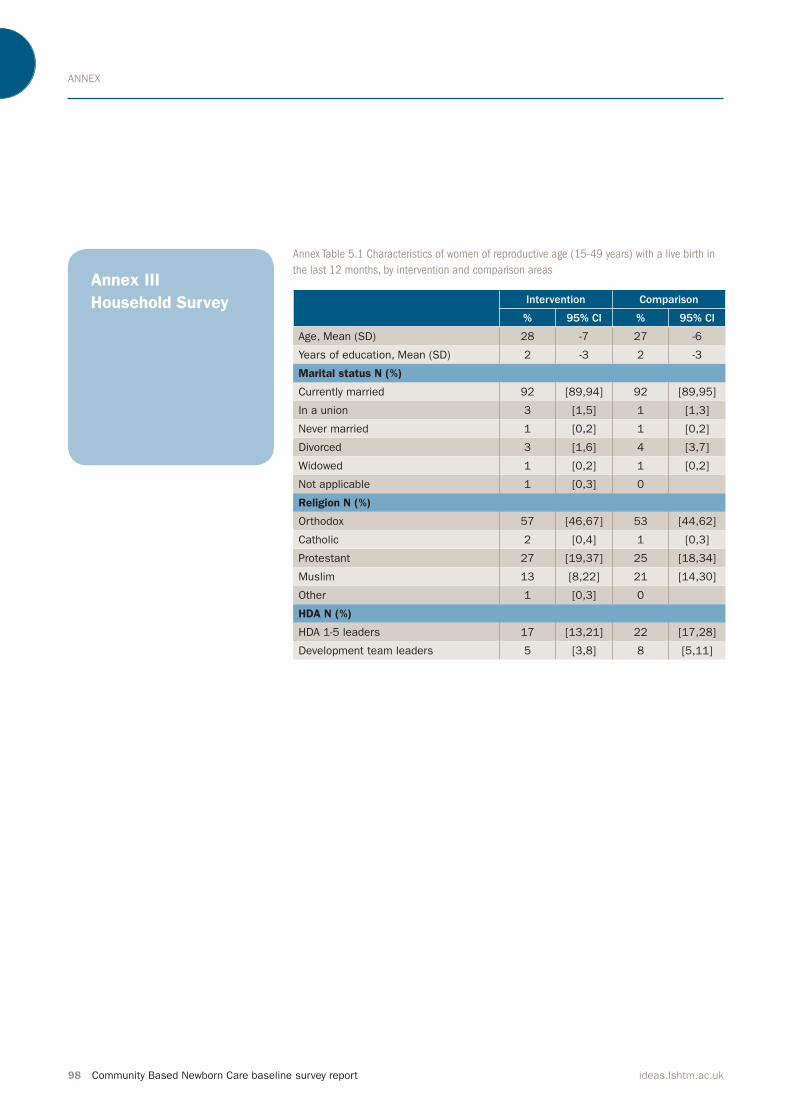
ANNEX
98 Community Based Newborn Care baseline survey report ideas.lshtm.ac.uk
Annex III
Household Survey
Annex Table 5.1 Characteristics of women of reproductive age (15-49 years) with a live birth in
the last 12 months, by intervention and comparison areas
Intervention Comparison
% 95% CI % 95% CI
Age, Mean (SD) 28 -7 27 -6
Years of education, Mean (SD) 2 -3 2 -3
Marital status N (%)
Currently married 92 [89,94] 92 [89,95]
In a union 3 [1,5] 1 [1,3]
Never married 1 [0,2] 1 [0,2]
Divorced 3 [1,6] 4 [3,7]
Widowed 1 [0,2] 1 [0,2]
Not applicable 1 [0,3] 0
Religion N (%)
Orthodox 57 [46,67] 53 [44,62]
Catholic 2 [0,4] 1 [0,3]
Protestant 27 [19,37] 25 [18,34]
Muslim 13 [8,22] 21 [14,30]
Other 1 [0,3] 0
HDA N (%)
HDA 1-5 leaders 17 [13,21] 22 [17,28]
Development team leaders 5 [3,8] 8 [5,11]

ANNEX
Community Based Newborn Care baseline survey report 99ideas.lshtm.ac.uk
Annex Figure 5.1 ANC received during irst trimester among all women,
by intervention and comparison areas
Annex Figure 5.5 Place of delivery among all women, by intervention and
comparison areas
Annex Figure 5.11 Coverage of PNC visits during neonatal period (irst
28 days), by intervention and comparison
Annex Figure 5.13 Newborns with severe neonatal infection based on
one or more symptoms, by intervention and caparison areas
0
20
40
60
80
100
ComparisonIntervention
Perc
enta
ge (
%)
24%29%
0
20
40
60
80
100
ComparisonIntervention
Home birthHospital and health
centre birth
Perc
enta
ge (
%)
18%
27%
69%
75%
0
20
40
60
80
100
ComparisonIntervention
Within the
�rst 28 days
Within the
�rst 7 days
Within the
�rst day
Perc
enta
ge (
%)
7%3%
12% 15%19% 18%
0
20
40
60
80
100
ComparisonIntervention
Perc
enta
ge (
%)
4%6%

ANNEX
100 Community Based Newborn Care baseline survey report ideas.lshtm.ac.uk
Intervention Comparison
% 95% CI % 95% CI
Early Pregnancy Identification
Gestational age in weeks at 1st ANC visit, Mean (SD) 16 -9 17 -7
ANC coverage
Any ANC during pregnancy 70 [65,74] 68 [64,72]
ANC received during first trimester 29 [23,35] 24 [19,28]
Place where ANC was received:
Home 12 [8,16] 10 [6,16]
Health post 47 [38,56] 46 [38,54]
Health centre 62 [54,69] 69 [61,76]
Hospital 4 [2,10] 3 [1,6]
Other 3 [1,6] 1 [0,4]
Completeness of ANC visit
N of ANC visits during last pregnancy:
None 32 [26,39] 33 [28,38]
One 4 [2,6] 3 [2,5]
Two 8 [5,11] 11 [8,13]
Three 15 [12,19] 17 [14,21]
Four or more 41 [37,46] 37 [32,41]
N of ANC visits during last pregnancy among those that had any ANC visit
One 5 [3,9] 4 [2,7]
Two 11 [7,17] 16 [12,20]
Three 22 [18,28] 26 [21,31]
Four or more 61 [54,68] 54 [49,60]
ANC by individual aspect of care
Weight measured 80 [76,84] 77 [73,82]
Height measured 37 [32,43] 36 [31,41]
Blood pressure measured 73 [68,78] 73 [68,78]
Urine sample assessed 43 [37,48] 40 [34,45]
Blood sample assessed 21 [17,26] 15 [12,20]
STI status assessed 23 [19,28] 22 [18,27]
HIV information 76 [71,80] 68 [63,73]
Breastfeeding information 60 [54,65] 51 [45,56]
Nutrition information 74 [68,78] 65 [60,70]
Birth preparedness information 56 [51,62] 58 [52,63]
Pregnancy danger signs information 49 [44,55] 43 [37,48]
Folate/iron tablets received 66 [61,71] 54 [48,59]
TT vaccine:
None 25 [19,31] 36 [29,43]
One 19 [13,25] 14 [11,18]
Two or more 57 [49,64] 50 [43,57]
Annex Table 5.2a ANC period: identiication of pregnancy and ANC coverage, completeness, knowledge and practice among women, by
intervention and comparison areas
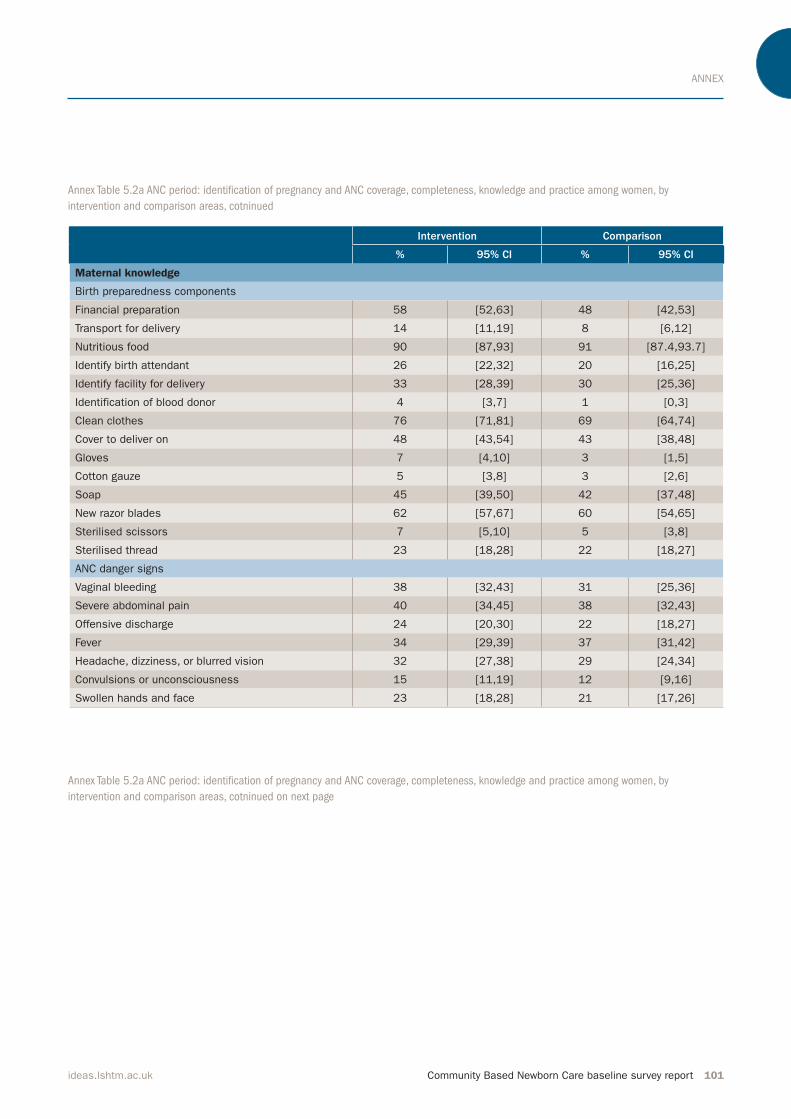
ANNEX
Community Based Newborn Care baseline survey report 101ideas.lshtm.ac.uk
Intervention Comparison
% 95% CI % 95% CI
Maternal knowledge
Birth preparedness components
Financial preparation 58 [52,63] 48 [42,53]
Transport for delivery 14 [11,19] 8 [6,12]
Nutritious food 90 [87,93] 91 [87.4,93.7]
Identify birth attendant 26 [22,32] 20 [16,25]
Identify facility for delivery 33 [28,39] 30 [25,36]
Identification of blood donor 4 [3,7] 1 [0,3]
Clean clothes 76 [71,81] 69 [64,74]
Cover to deliver on 48 [43,54] 43 [38,48]
Gloves 7 [4,10] 3 [1,5]
Cotton gauze 5 [3,8] 3 [2,6]
Soap 45 [39,50] 42 [37,48]
New razor blades 62 [57,67] 60 [54,65]
Sterilised scissors 7 [5,10] 5 [3,8]
Sterilised thread 23 [18,28] 22 [18,27]
ANC danger signs
Vaginal bleeding 38 [32,43] 31 [25,36]
Severe abdominal pain 40 [34,45] 38 [32,43]
Offensive discharge 24 [20,30] 22 [18,27]
Fever 34 [29,39] 37 [31,42]
Headache, dizziness, or blurred vision 32 [27,38] 29 [24,34]
Convulsions or unconsciousness 15 [11,19] 12 [9,16]
Swollen hands and face 23 [18,28] 21 [17,26]
Annex Table 5.2a ANC period: identiication of pregnancy and ANC coverage, completeness, knowledge and practice among women, by
intervention and comparison areas, cotninued
Annex Table 5.2a ANC period: identiication of pregnancy and ANC coverage, completeness, knowledge and practice among women, by
intervention and comparison areas, cotninued on next page

ANNEX
102 Community Based Newborn Care baseline survey report ideas.lshtm.ac.uk
Intervention Comparison
% 95% CI % 95% CI
Maternal practice
Any formal birth preparedness 90 [86,93] 86 [82,90]
Components of birth preparedness
Financial preparation 63 [57,68] 56 [50,61]
Transport for delivery 14 [11,19] 9 [6,12]
Nutritious food 98 [96,99] 96 [93,98]
Identify birth attendant 29 [24,35] 27 [22,32]
Identify facility for delivery 35 [30,41] 32 [27,37]
Identification of blood donor 3 [1,6] 0.4 [0.0,3]
Clean clothes 78 [73,82] 76 [71,81]
Cover to deliver on 48 [42,54] 51 [45,57]
Gloves 6 [4,10] 3 [2,6]
Cotton gauze 3 [2,6] 4 [2,7]
Soap 50 [45,56] 45 [40,51]
New razor blades 66 [61,72] 69 [64,75]
Sterilised scissors 5 [3,8] 6 [4,9]
Sterilised thread 25 [21,31] 28 [23,33]
Other 5 [3,8] 4 [2,7]
Level of birth preparedness with respect to six clean birth components among all women*
None 42 [35, 48] 47 [41, 53]
One 8 [6, 11] 7 [5, 9]
Two 16 [12, 21] 12 [9, 16]
Three 14 [11, 17] 13 [10, 17]
Four 12 [9, 15] 11 [8, 15]
Five 6 [4, 10] 9 [6, 13]
Six 2 [1, 6] 1 [0, 2]
Level of birth preparedness with respect to six clean birth components among women with any ANC visit*
None 16 [11,21] 22 [18,30]
One 12 [8,16] 10 [7,13]
Two 23 [18,29] 18 [14,24]
Three 20 [16,24] 20 [15,24]
Four 17 [14,21] 16 [12,21]
Five 9 [6,13] 13 [9,18]
Six 4 [1,8] 0 [0,3]
Annex Table 5.2a ANC period: identiication of pregnancy and ANC coverage, completeness, knowledge and practice among women, by
intervention and comparison areas, cotninued
*Prepared for the following components: gloves, soap, cover to deliver on, clean clothes, sterilised scissors/new razor and sterilised thread

ANNEX
Community Based Newborn Care baseline survey report 103ideas.lshtm.ac.uk
Annex Table 5.3a Women’s place of and assistant at delivery, by intervention and comparison areas
Intervention Comparison
% 95% CI % 95% CI
Place of delivery
Home 69 [65,74] 75 [71,79]
Health post 2 [1,4] 4 [3,6]
Health centre 22 [19,27] 14 [11,17]
Hospital 5 [3,7] 4 [3,7]
Other 2 [1,4] 3 [1,4]
Primary assistance at delivery
Doctor 5 [3,8] 5 [3,7]
Nurse/midwife 26 [22,30] 19 [16,23]
HEW 3 [2,5] 4 [3,6]
HDA leader 1 [1,3] 2 [1,3]
TBA 19 [15,23] 18 [15,22]
Relative/friend 41 [36,46] 47 [43,52]
Nobody 3 [2,5] 3 [2,5]
Annex Table 5.2b Pregnant women’s conference attendance among women who had an ANC visit, by intervention and comparison areas
Intervention Comparison
% 95% CI % 95% CI
Pregnant women conference
Attended 27 [23,33] 19 [15,24]
Discussion contents
Birth preparedness 82 [73,89] 75 [63,85]
Importance of ANC 77 [67,85] 71 [58,81]
Institutional delivery 92 [83,96] 82 [70,90]
Importance of post natal care 59 [48,69] 57 [45,69]
Seeking newborn care 62 [51,72] 74 [61,83]
Place of meeting
Home of HDA leader 4 [1,11] 2 [0,11]
Kebele/gote meeting place 28 [19,40] 38 [24,53]
Health post 47 [36,58] 51 [37,64]
Health centre 21 [12,34] 10 [4,24]
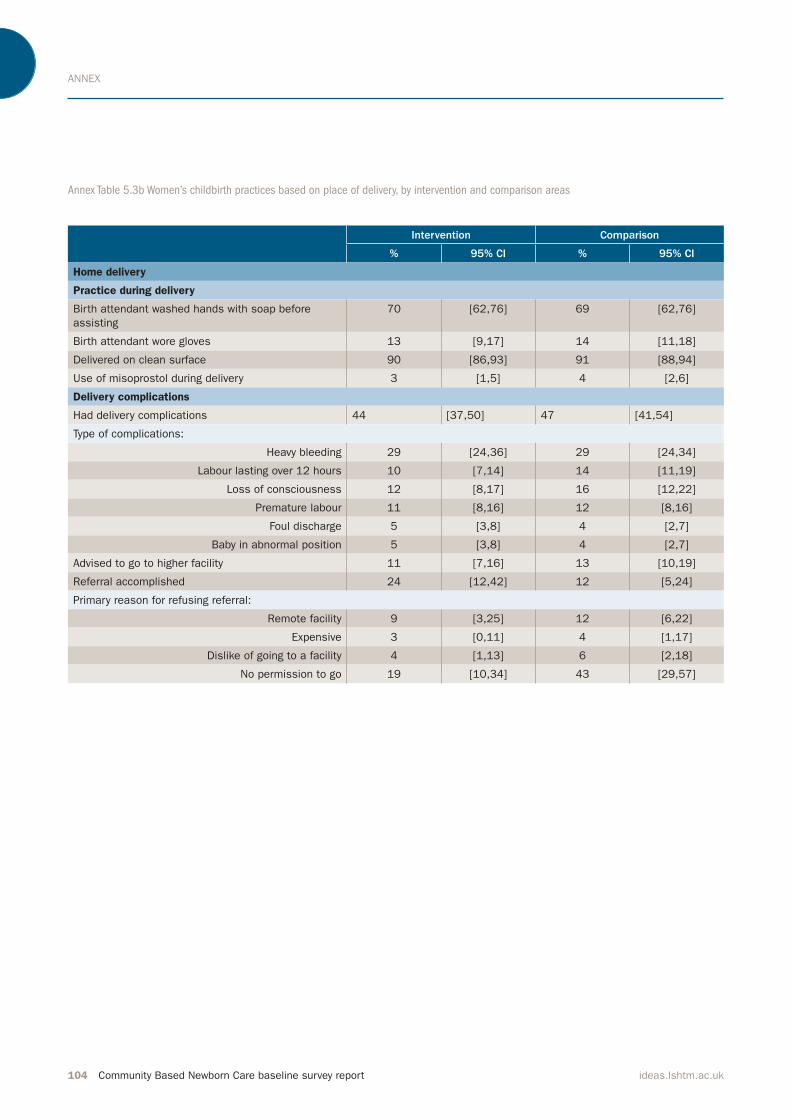
ANNEX
104 Community Based Newborn Care baseline survey report ideas.lshtm.ac.uk
Annex Table 5.3b Women’s childbirth practices based on place of delivery, by intervention and comparison areas
Intervention Comparison
% 95% CI % 95% CI
Home delivery
Practice during delivery
Birth attendant washed hands with soap before
assisting
70 [62,76] 69 [62,76]
Birth attendant wore gloves 13 [9,17] 14 [11,18]
Delivered on clean surface 90 [86,93] 91 [88,94]
Use of misoprostol during delivery 3 [1,5] 4 [2,6]
Delivery complications
Had delivery complications 44 [37,50] 47 [41,54]
Type of complications:
Heavy bleeding 29 [24,36] 29 [24,34]
Labour lasting over 12 hours 10 [7,14] 14 [11,19]
Loss of consciousness 12 [8,17] 16 [12,22]
Premature labour 11 [8,16] 12 [8,16]
Foul discharge 5 [3,8] 4 [2,7]
Baby in abnormal position 5 [3,8] 4 [2,7]
Advised to go to higher facility 11 [7,16] 13 [10,19]
Referral accomplished 24 [12,42] 12 [5,24]
Primary reason for refusing referral:
Remote facility 9 [3,25] 12 [6,22]
Expensive 3 [0,11] 4 [1,17]
Dislike of going to a facility 4 [1,13] 6 [2,18]
No permission to go 19 [10,34] 43 [29,57]

ANNEX
Community Based Newborn Care baseline survey report 105ideas.lshtm.ac.uk
Intervention Comparison
% 95% CI % 95% CI
Facility Delivery
Practices during delivery
Birth attendant washed hands with soap before
assisting
87 [76, 93] 91 [80, 96]
Birth attendant wore gloves 95 [84, 98] 98 [90, 99]
Delivered on clean surface 94 [84,98] 96 [90, 99]
Use of misoprostol during delivery 61 [49,71] 67 [55, 77]
Length of facility stay in days
Mean (SD) 2 5 1 2
Delivery complications
Had delivery complication 60 [48, 71] 64 [51, 75]
Type of complications
Heavy bleeding 33 [24,43] 34 [25,46]
Labour lasting over 12 hours 34 [25,43] 48 [37,60]
Loss of consciousness 18 [11,27] 36 [25,47]
Premature labour 11 [5,22] 7 [3,15]
Foul discharge 11 [6,20] 8 [4,16]
Baby in abnormal position 12 [6,20] 12 [6,22]
Advised referral 37 [27,49] 42 [29,56]
Primary reason for referral 33 [25,42] 37 [26,49]
One or more danger signs 25 [14,42] 48 [32,65]
Lack of equipment 30 [17,47] 29 [17,44]
Lack of trained human resources 23 [11,41] 19 [9,37]
Other 23 [11,42] 3 [0,21]
Referral accomplished 92 [77,98] 100 n/a
Primary reason for refusing referral
Expensive 3 n/a 0 n/a
Annex Table 5.3b Women’s childbirth practices based on place of delivery, by intervention and comparison areas, continued
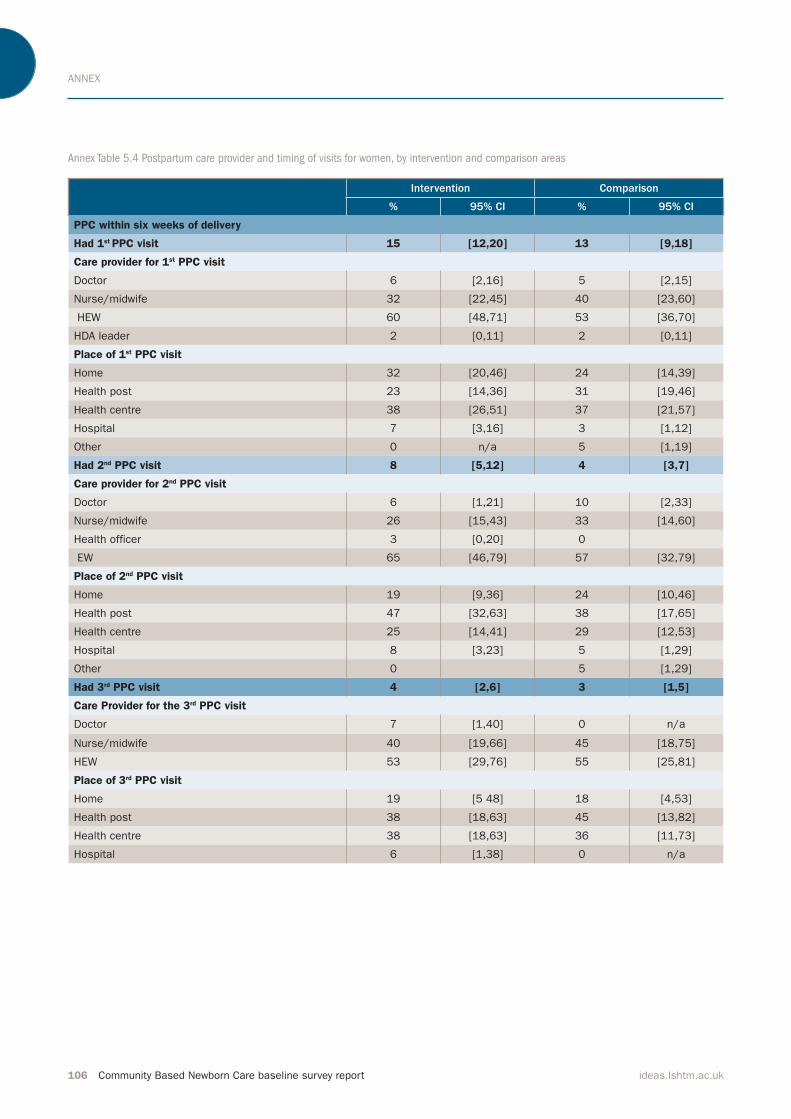
ANNEX
106 Community Based Newborn Care baseline survey report ideas.lshtm.ac.uk
Annex Table 5.4 Postpartum care provider and timing of visits for women, by intervention and comparison areas
Intervention Comparison
% 95% CI % 95% CI
PPC within six weeks of delivery
Had 1st PPC visit 15 [12,20] 13 [9,18]
Care provider for 1st PPC visit
Doctor 6 [2,16] 5 [2,15]
Nurse/midwife 32 [22,45] 40 [23,60]
HEW 60 [48,71] 53 [36,70]
HDA leader 2 [0,11] 2 [0,11]
Place of 1st PPC visit
Home 32 [20,46] 24 [14,39]
Health post 23 [14,36] 31 [19,46]
Health centre 38 [26,51] 37 [21,57]
Hospital 7 [3,16] 3 [1,12]
Other 0 n/a 5 [1,19]
Had 2nd PPC visit 8 [5,12] 4 [3,7]
Care provider for 2nd PPC visit
Doctor 6 [1,21] 10 [2,33]
Nurse/midwife 26 [15,43] 33 [14,60]
Health officer 3 [0,20] 0
EW 65 [46,79] 57 [32,79]
Place of 2nd PPC visit
Home 19 [9,36] 24 [10,46]
Health post 47 [32,63] 38 [17,65]
Health centre 25 [14,41] 29 [12,53]
Hospital 8 [3,23] 5 [1,29]
Other 0 5 [1,29]
Had 3rd PPC visit 4 [2,6] 3 [1,5]
Care Provider for the 3rd PPC visit
Doctor 7 [1,40] 0 n/a
Nurse/midwife 40 [19,66] 45 [18,75]
HEW 53 [29,76] 55 [25,81]
Place of 3rd PPC visit
Home 19 [5 48] 18 [4,53]
Health post 38 [18,63] 45 [13,82]
Health centre 38 [18,63] 36 [11,73]
Hospital 6 [1,38] 0 n/a

ANNEX
Community Based Newborn Care baseline survey report 107ideas.lshtm.ac.uk
Annex Table 5.5 Immediate newborn care provided at home and facility deliveries, by intervention and comparison areas
Intervention Comparison
% 95% CI % 95% CI
Any postnatal visit
Within the first day 3 [2,6] 7 [5,11]
Within the first 7 days 12 [8,17] 15 [11,20]
Within the first 28 days 19 [14,25] 18 [14,23]
Provider of the 1st PNC check within the first 28 days
Doctor 4 [1,13] 4 [1,11]
Nurse/midwife 25 [17,36] 42 [29,56]
Health officer/assistant 0 n/a 1 [0,9]
HEW 67 [56,77] 48 [34,62]
HDA leader 0 n/a 3 [1,10]
Don’t know 3 [1,12] 3 [1.10]
Place of the 1st PNC check within the first 28 days
Home 39 [26,53] 43 [31,56]
Health post 28 [18,41] 10 [5,20]
Health centre 28 [20,39] 37 [24,52]
Hospital 4 [1,14] 6 [3,14]
Other 0 n/a 4 [1,15]
Home birth
Birth asphyxia: Breathing difficulty 7 [5,11] 11 [7,15]
Weighed at birth 2 [1,5] 3 [2,6]
TTC eye ointment 4 [2, 7] 1 [0,3]
Immediate cord care in home delivery
Clean instrument to cut cord 94 [91,96] 94 [90,96]
Clean instrument to tie cord 53 [48,59] 62 [57,67]
Immediate application to cord
Immediately applied something 39 [31, 47] 27 [21, 33]
Applied:
Butter 92 [83,96] 84 [76,90]
Ash 3 [1,8] 0
Ointment 2 [0,7] 9 [4,17]
Cold water 2 [1,6] 0
Other 0 n/a 5 [2,12]
Hypothermia
Newborn dried <30 mins after birth 80 [73,85] 79 [73,84]
Newborn wrapped <30 mins after birth 82 [76,87] 88 [83,92]
Timing of the first bath:
In the first hour 40 [33,48] 47 [39,55]
After one hour 26 [21,31] 15 [11,20]
After one day 34 [27,41] 37 [30,45]
Breastfeeding
Breastfeeding initiation timing:
In the first hour 63 [57,69] 59 [52,66]
After one hour but during the first day 28 [23,34] 30 [23,35]
After the first day 9 [6,14] 12 [8,17]
Exclusive Breastfeeding for first 28 days 93 [88,96] 89 [84,93]
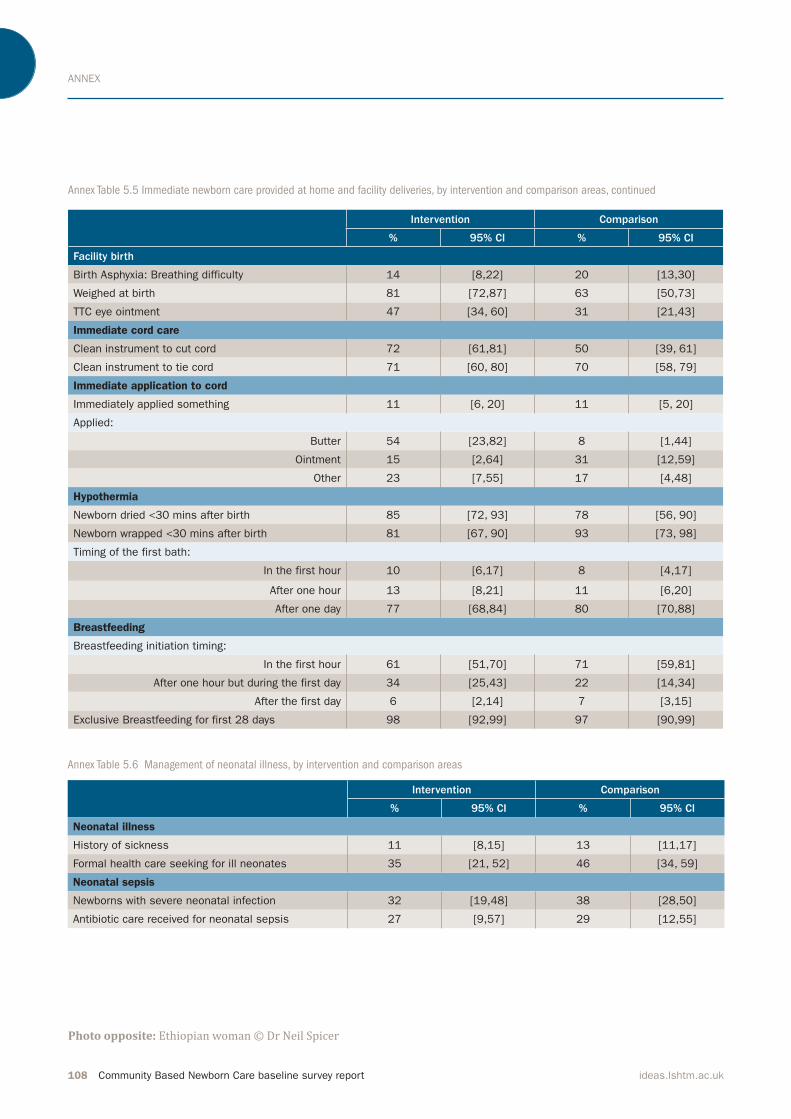
ANNEX
108 Community Based Newborn Care baseline survey report ideas.lshtm.ac.uk
Annex Table 5.6 Management of neonatal illness, by intervention and comparison areas
Intervention Comparison
% 95% CI % 95% CI
Neonatal illness
History of sickness 11 [8,15] 13 [11,17]
Formal health care seeking for ill neonates 35 [21, 52] 46 [34, 59]
Neonatal sepsis
Newborns with severe neonatal infection 32 [19,48] 38 [28,50]
Antibiotic care received for neonatal sepsis 27 [9,57] 29 [12,55]
Intervention Comparison
% 95% CI % 95% CI
Facility birth
Birth Asphyxia: Breathing difficulty 14 [8,22] 20 [13,30]
Weighed at birth 81 [72,87] 63 [50,73]
TTC eye ointment 47 [34, 60] 31 [21,43]
Immediate cord care
Clean instrument to cut cord 72 [61,81] 50 [39, 61]
Clean instrument to tie cord 71 [60, 80] 70 [58, 79]
Immediate application to cord
Immediately applied something 11 [6, 20] 11 [5, 20]
Applied:
Butter 54 [23,82] 8 [1,44]
Ointment 15 [2,64] 31 [12,59]
Other 23 [7,55] 17 [4,48]
Hypothermia
Newborn dried <30 mins after birth 85 [72, 93] 78 [56, 90]
Newborn wrapped <30 mins after birth 81 [67, 90] 93 [73, 98]
Timing of the first bath:
In the first hour 10 [6,17] 8 [4,17]
After one hour 13 [8,21] 11 [6,20]
After one day 77 [68,84] 80 [70,88]
Breastfeeding
Breastfeeding initiation timing:
In the first hour 61 [51,70] 71 [59,81]
After one hour but during the first day 34 [25,43] 22 [14,34]
After the first day 6 [2,14] 7 [3,15]
Exclusive Breastfeeding for first 28 days 98 [92,99] 97 [90,99]
Annex Table 5.5 Immediate newborn care provided at home and facility deliveries, by intervention and comparison areas, continued
Photo opposite: Ethiopian woman © Dr Neil Spicer
Community Based Newborn Care baseline survey report 109
BASELINE SURVEY REPORT
ideas.lshtm.ac.uk
Department of Disease Control
Faculty of Infectious & Tropical Diseases
London School of Hygiene & Tropical Medicine
Keppel Street, London, WC1E 7HT, UK
t +44 (0)207 927 2871
w ideas.lshtm.ac.uk
@LSHTM_IDEAS
IDEAS projectIDEAS (Informed Decisions for Actions) aims to improve the health and survival of mothers and
babies through generating evidence to inform policy
and practice. Working in Ethiopia, northeast Nigeria
and the state of Uttar Pradesh in India, IDEAS uses measurement, learning and evaluation to find out what works, why and how in maternal and newborn
health programmes.
IDEAS is funded between 2010 and 2016 by a grant
from the Bill & Melinda Gates foundation to the
London School of Hygiene & Tropical Medicine.
ideas.lshtm.ac.uk
London School of Hygiene & Tropical Medicine
The London School of Hygiene & Tropical Medicine
is a world-leading centre for research and
postgraduate education in public and global health,
with 4,000 students and more than 1,300 staff
working in over 100 countries. The School is one
of the highest-rated research institutions in the
UK, and was recently cited as one of the world’s
top universities for collaborative research.
www.lshtm.ac.uk


![Immediate Newborn Care [Autosaved]](https://static.fdocuments.us/doc/165x107/55cf882c55034664618e16d3/immediate-newborn-care-autosaved.jpg)