Community and Biodiversity Consequences of Drought · Scott Woolbright - molecular genetics...
30
Community and Evolutionary Consequences of Record Drought in the Southwest Gery Allan – molecular systematics Joe Bailey – community ecology Randy Bangert – biogeography Brad Blake – restoration biology Samatha Chapman – nutrient cycling Aimee Classen – nutrient cycling Neil Cobb – insect ecology Ron Deckert – endophyte ecology Steve DiFazio – molecular ecology Eck Doerry – bio-informatics Dylan Fischer – ecophysiology Kevin Floate – insect ecology Robert Foottit – molecular systematics Catherine Gehring – microbial ecology Alicyn Gitlin – restoration ecology Allen Haden – aquatic ecology Steve Hart – ecosystem/soil ecology Kristin Haskins – mycorrhizal ecology Paul Heinrich – public outreach Barbara Honchak – ecological genetics Paul Keim – microbial/bacteria genetics Art Keith – insect community ecology Karla Kennedy – resotration ecology George Koch – ecophysiology Zsuzsi Kovacs – mycorrhizal ecology Carri LeRoy – aquatic ecology Rick Lindroth – chemical ecology Eric Lonsdorf – genetic modeling Jane Marks – aquatic ecology Greg Martinsen – ecological genetics Nashelly Meneses – ecological genetics Becky Mueller – plant ecology Brad Potts – population genetics Brian Rehill – chemical ecology Jen Schweitzer – ecosystems Crescent Scudder – plant demography Steve Shuster – theoretical genetics Adrian Stone – insect communities Chris Stulz – population ecology Richard Turek – statistics Randy Swaty – conservation biology Talbot Trotter – dendrochronology Amy Whipple – ecological genetics Tom Whitham – ecology Gina Wimp – community ecology Stuart Wooley – phytochemistry Scott Woolbright - molecular genetics Tong-Ming Yin – quantitative genetics
-
Upload
duonghuong -
Category
Documents
-
view
214 -
download
0
Transcript of Community and Biodiversity Consequences of Drought · Scott Woolbright - molecular genetics...

Community and Evolutionary Consequences of Record Drought in the Southwest
Gery Allan – molecular systematics Joe Bailey – community ecology Randy Bangert – biogeography Brad Blake – restoration biologySamatha Chapman – nutrient cycling Aimee Classen – nutrient cycling Neil Cobb – insect ecology Ron Deckert – endophyte ecology Steve DiFazio – molecular ecology Eck Doerry – bio-informaticsDylan Fischer – ecophysiology Kevin Floate – insect ecologyRobert Foottit – molecular systematics Catherine Gehring – microbial ecologyAlicyn Gitlin – restoration ecology Allen Haden – aquatic ecology Steve Hart – ecosystem/soil ecology Kristin Haskins – mycorrhizal ecologyPaul Heinrich – public outreach Barbara Honchak – ecological geneticsPaul Keim – microbial/bacteria genetics Art Keith – insect community ecologyKarla Kennedy – resotration ecology George Koch – ecophysiologyZsuzsi Kovacs – mycorrhizal ecology Carri LeRoy – aquatic ecologyRick Lindroth – chemical ecology Eric Lonsdorf – genetic modelingJane Marks – aquatic ecology Greg Martinsen – ecological geneticsNashelly Meneses – ecological genetics Becky Mueller – plant ecologyBrad Potts – population genetics Brian Rehill – chemical ecologyJen Schweitzer – ecosystems Crescent Scudder – plant demographySteve Shuster – theoretical genetics Adrian Stone – insect communitiesChris Stulz – population ecology Richard Turek – statisticsRandy Swaty – conservation biology Talbot Trotter – dendrochronologyAmy Whipple – ecological genetics Tom Whitham – ecologyGina Wimp – community ecology Stuart Wooley – phytochemistryScott Woolbright - molecular genetics Tong-Ming Yin – quantitative genetics

Key Issues1. Climate change alters community structure and
negatively affects biodiversity.2. Drought impacts on dominant and
keystone species are most important because they are community drivers.
3. Some vegetation types are far more likely to be affected than others.
4. Drought is likely to be an evolutionary event.5. There are likely to be major surprises with
drought events that cannot be predicted.
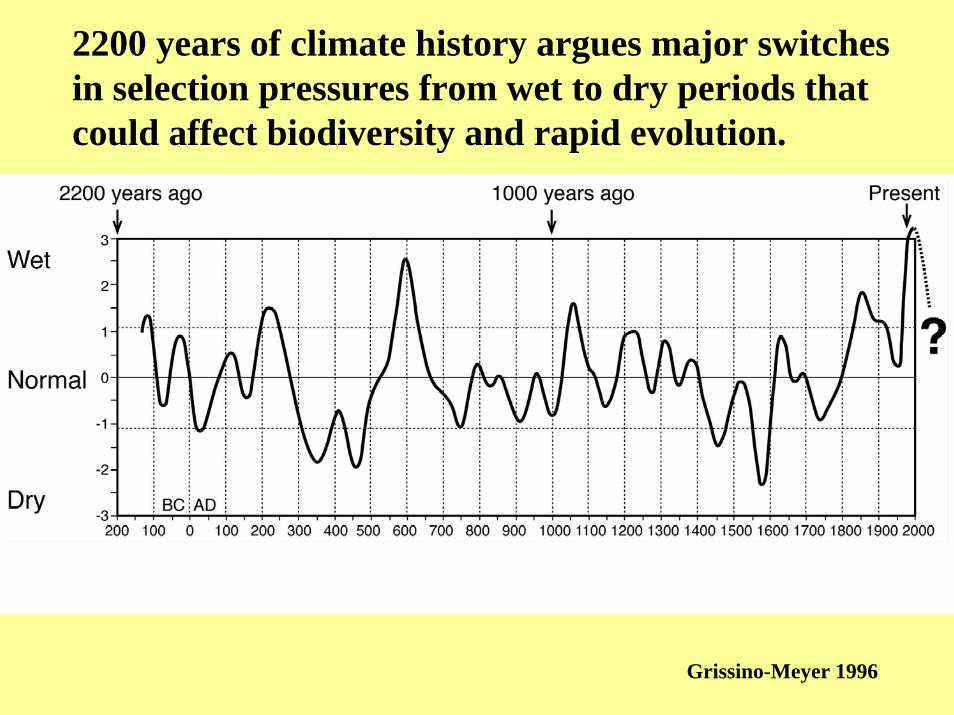
2200 years of climate history argues major switches in selection pressures from wet to dry periods thatcould affect biodiversity and rapid evolution.
Grissino-Meyer 1996

Expansion of junipers (Juniperus monosperma)into grasslands
1899 1977
Enchanted Mesa, New Mexico
Allen et al. 1998
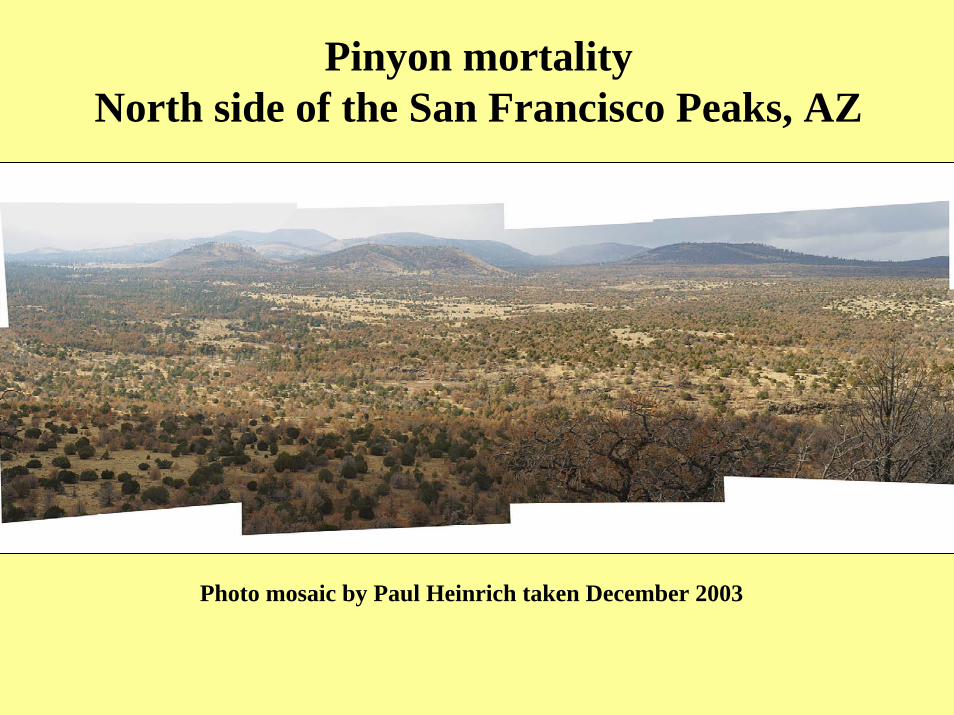
Pinyon mortalityNorth side of the San Francisco Peaks, AZ
Photo mosaic by Paul Heinrich taken December 2003

Photo by Tom WhithamSept 15, 2004 - North of San Francisco Peaks, AZ

Photo by Tom WhithamSept 15, 2004 - North of San Francisco Peaks, AZ

2003UT
CO
AZ NM
2001332 km2
200075 km2
20021,377 km2
km200310,406 km2
Total12,191 km2
Pinyon + Ponderosa Pine Mortality - Compiled by the National Forest Health Monitoring Program

Slope Function
Aspect Function
Elevation Function

= Known High Pinyon Mortality Sites
= Low Risk
= Moderate Risk
= High Risk
Model correctly intersects known high pinyon mortality sites with 75% accuracy.
~10% of error is from low resolution DEM
~15% of error is from undocumented high pinyon mortality sites + unknown error.
Trotter et al. 2005
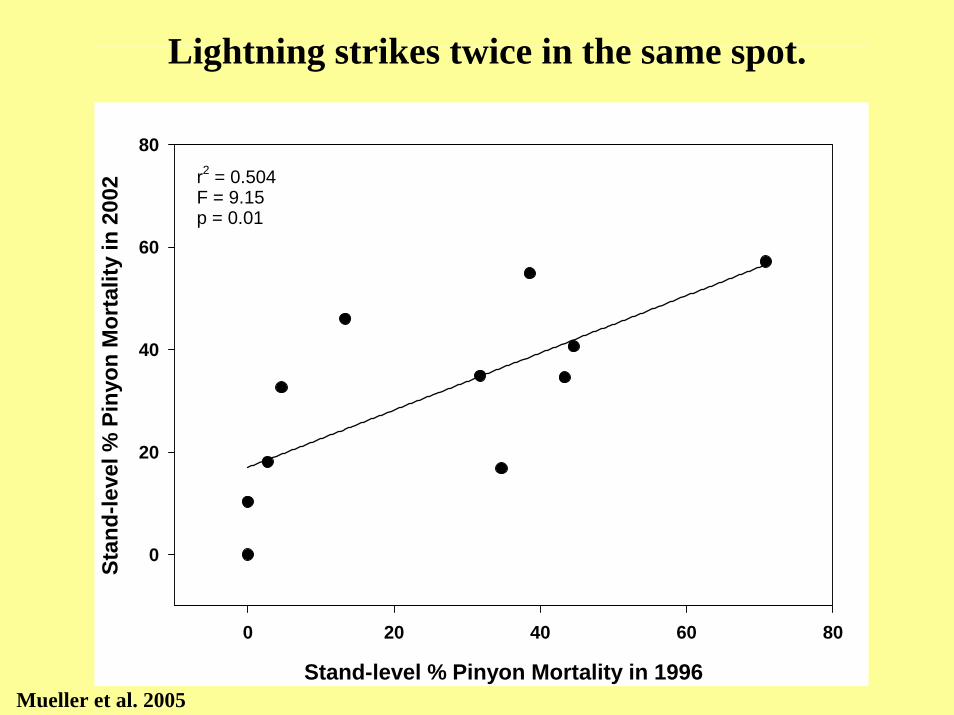
Stand-level % Pinyon Mortality in 1996
0 20 40 60 80
Stan
d-le
vel %
Pin
yon
Mor
talit
y in
200
2
0
20
40
60
80
Fig. 1
r2 = 0.504F = 9.15p = 0.01
Lightning strikes twice in the same spot.
Mueller et al. 2005
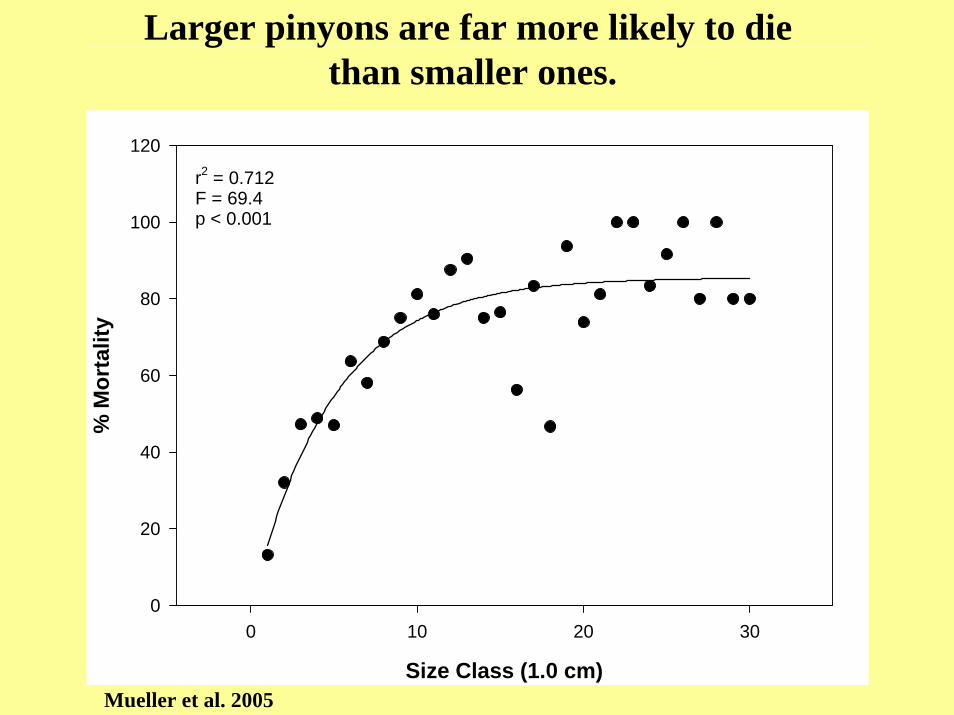
Fig. 2
Size Class (1.0 cm)
0 10 20 30
% M
orta
lity
0
20
40
60
80
100
120
r2 = 0.712F = 69.4p < 0.001
Mueller et al. 2005
Larger pinyons are far more likely to die than smaller ones.
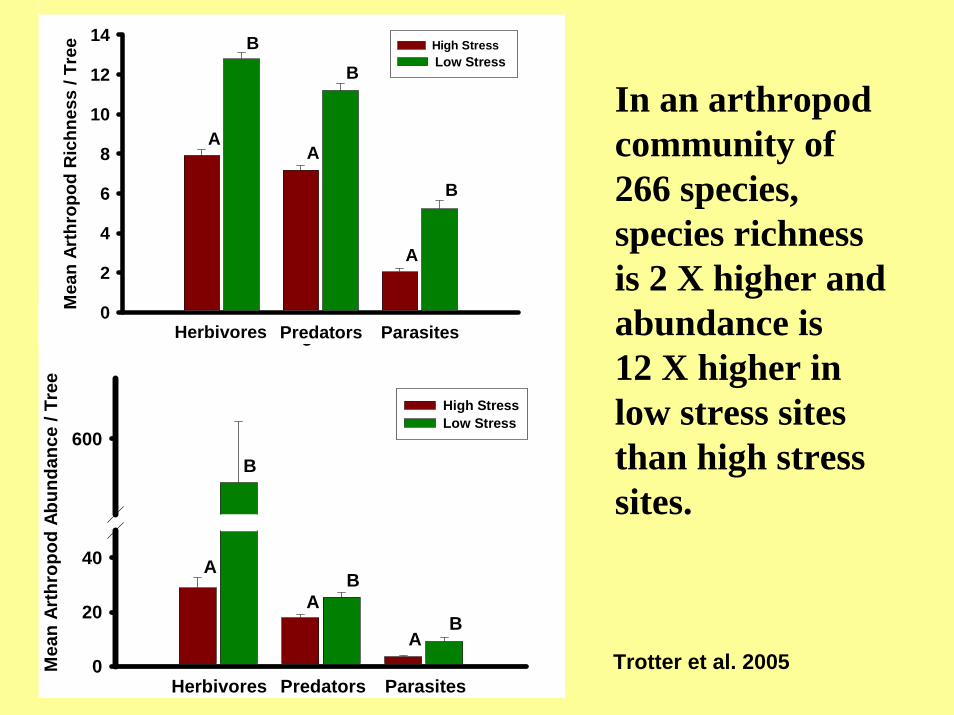
Mea
n Ar
thro
pod
Abun
danc
e / T
ree
0
20
40
600
High StressLow Stress
Herbivores Predators Parasites
A
B
A
AB
B
Figure 1B: Overall Mean Arthopod Abundance Is HighestOn Trees Growing Under Low Stress
On Trees Growing Under Low Stress
Mea
n Ar
thro
pod
Ric
hnes
s / T
ree
0
2
4
6
8
10
12
14 High Stress Low Stress
Herbivores Predators Parasites
A
B
A
A
BB
In an arthropodcommunity of266 species, species richness is 2 X higher andabundance is 12 X higher in low stress sites than high stress sites.
Trotter et al. 2005

Figure 2: Canopy Arthropod Community Composition DiffersSignificantly Between Trees Growing In High and Low
Stress Environments
X Axis-0.6 -0.4 -0.2 0.0 0.2 0.4 0.6
Y Ax
is
-0.6
-0.4
-0.2
0.0
0.2
0.4
0.6
High Stress 1High Stress 2High Stress 3Low Stress 1Low Stress 2Low Stress 3
Stress Changes Arthropod Communities
Low StressSites
High StressSites
Trotter et al. 2005

Watering experiment conducted byCrescent Scudderto test for community release.
Photo taken May 23, 2003

Mean Arthropod Richness on Non-watered vs Watered Pinyons
0
5
10
15
20
Watered PinyonsNon-watered Pinyons
Mean Athropod Abundance onNon-watered vs Watered Pinyons
0
10
20
30
40p=.028
p=.031
Watered Control
Species Richness
Watered Control
Arthropod Abundance
Supplemental watering increases arthropod abundance and species richness.
Scudder unpub. data

2003 Community Composition of Watered and Control Trees
Axis 1
Axi
s 2
Watered Control
Watered and control trees support different arthropod communities (Scudder et al. 2005).
Watered Trees
Control Trees

Ectomycorrhizae on fine root of pinyon pine

Environmental Stress Shifts Ectomycorrhizal Community
Low MortalHigh Morta
O'Neill Crater RFLPs
R = 0.652P < 0.00001
Swaty et al. 2004 Ecology
High MortalitySites
Low MortalitySites

Tree Rings Predict Arthropod Species Richness30% Richness vs. Ave 97-01
X Data
0 500 1000 1500 2000 2500 3000
Y D
ata
0
10
20
30
40
Ave 97-01 vs 30% Richness Plot 1 Regr
Average Tree Ring Width 1997-2001
SpeciesRichnessper Tree
Adrian Stone unpub. data

Moth Resistant Pinyon
These phenotypes are genetically based and have extended phenotypes that have communityconsequences.
Susceptible Pinyon
Photo by Tom Whitham
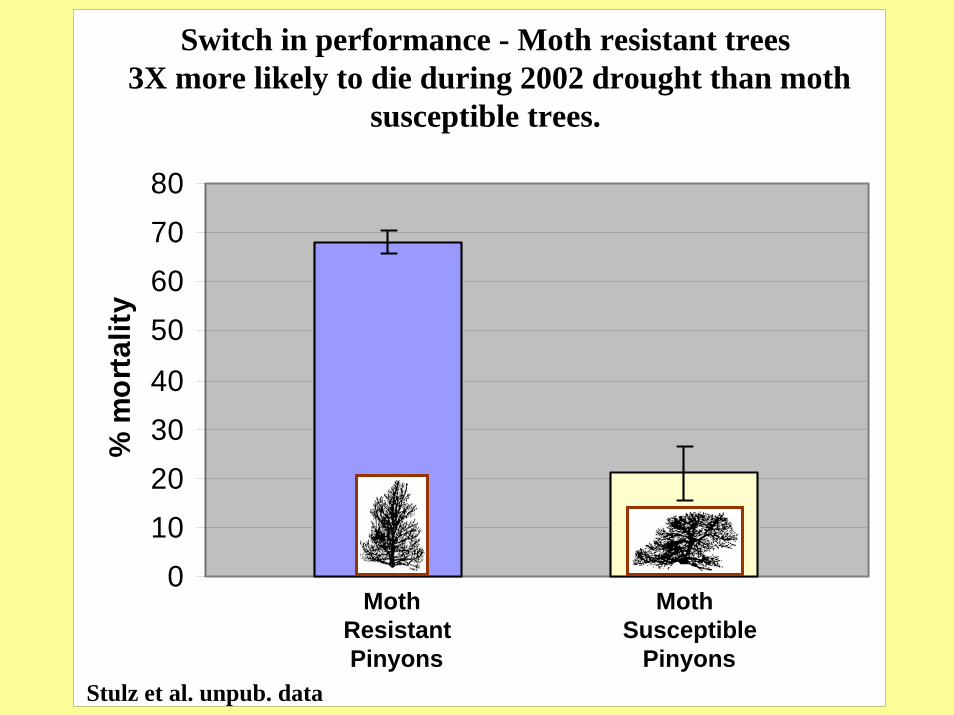
010203040
50607080
% m
orta
lity
MothResistantPinyons
MothSusceptible
Pinyons
Switch in performance - Moth resistant trees3X more likely to die during 2002 drought than moth
susceptible trees.
Stulz et al. unpub. data

Scales associated with reversals
• Number of species• Time• Spatial scales• Any mix of above

# of Statistical Factors
0 1 2 3 4
% o
f Sig
nific
ant I
nter
actio
n Te
rms
0
20
40
60
80
100
ObservedObserved Reversals
Interactions Increase With the Addition of Factors
Bailey & Whitham 2005
Total Observed Significant InteractionsObserved Reversals
Number of Statistical Factors (Species, Time, Space)

The extended phenotypes of moth resistant and susceptible trees affect a diverse community of about 1000 species.
Whitham et al. 2003 Ecology
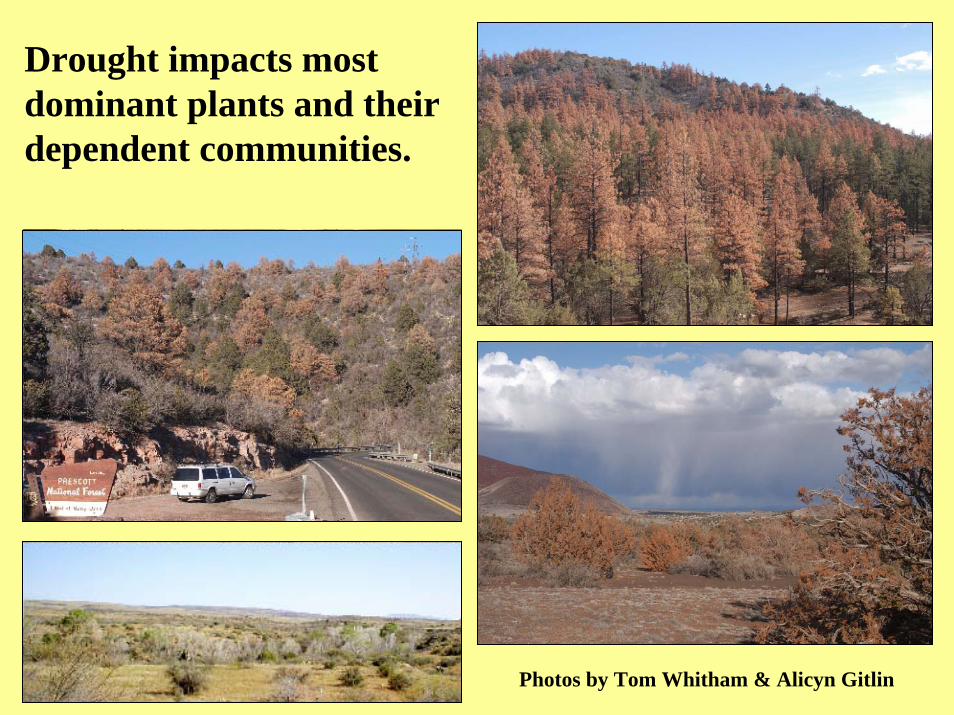
Drought impacts most dominant plants and their dependent communities.
Photos by Tom Whitham & Alicyn Gitlin

Popu
latio
n m
orta
lity
(%)
0
10
20
30
40
50
60
P < 0.0001
Land
scap
e co
vera
ge (%
)
0
10
20
30
40
50
60
Cotton.Manz.Juni. Piny.Pond.Asp.
Dominant plant species
(0.16)
a
b
b
bb b
c
Mortality of dominant plants at 20 randomlyselected sites for each species within a 80kmradius of Flagstaff.
Trees like cottonwoods should be of special concern due to low coverage.
Gitlin et al. unpub. data

Summary1. Through its effects on community drivers (e.g.,
dominant trees and keystone herbivores), drought alters community structure and negatively affects biodiversity.
2. Some dominant vegetation types are far more likely to be affected than others.
3. Switches or unexpected outcomes are likely (e.g., insect resistant trees are more likely to die, which in turn results in a major community shift).
4. Extreme drought is a bottleneck event that is also likely to be an evolutionary event.
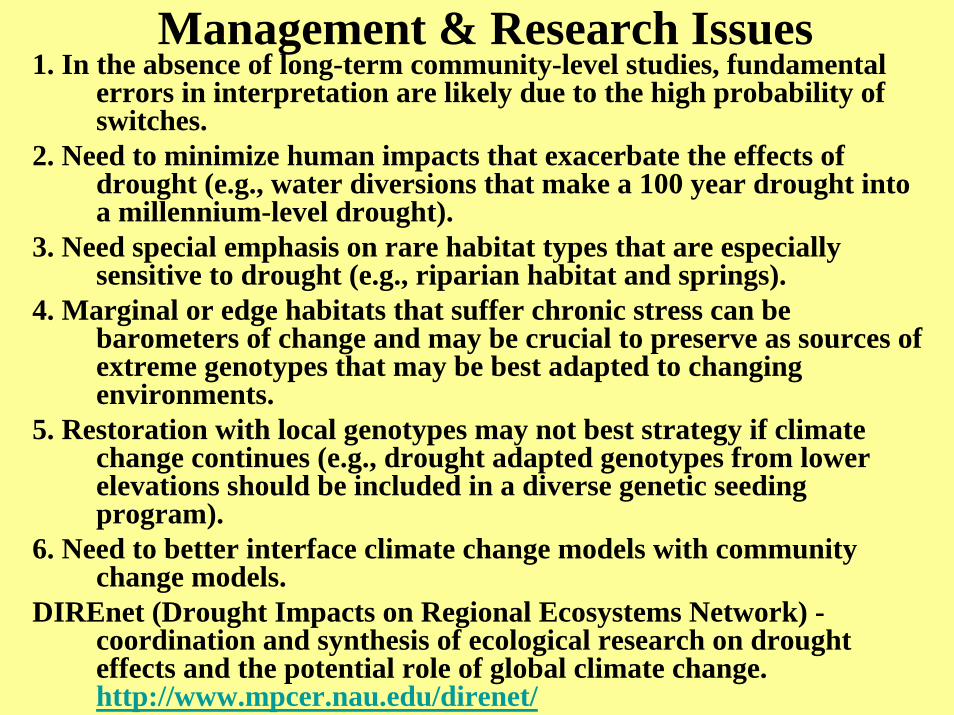
Management & Research Issues1. In the absence of long-term community-level studies, fundamental
errors in interpretation are likely due to the high probability of switches.
2. Need to minimize human impacts that exacerbate the effects ofdrought (e.g., water diversions that make a 100 year drought into a millennium-level drought).
3. Need special emphasis on rare habitat types that are especially sensitive to drought (e.g., riparian habitat and springs).
4. Marginal or edge habitats that suffer chronic stress can be barometers of change and may be crucial to preserve as sources of extreme genotypes that may be best adapted to changing environments.
5. Restoration with local genotypes may not best strategy if climate change continues (e.g., drought adapted genotypes from lower elevations should be included in a diverse genetic seeding program).
6. Need to better interface climate change models with communitychange models.
DIREnet (Drought Impacts on Regional Ecosystems Network) -coordination and synthesis of ecological research on drought effects and the potential role of global climate change.http://www.mpcer.nau.edu/direnet/