Communities of Practice€¦ · · 2015-12-30Welcome to SY 2015-16 Community of Practice Work!...
58
Communities of Practice Facilitator Training Presented by CORE September 28th
Transcript of Communities of Practice€¦ · · 2015-12-30Welcome to SY 2015-16 Community of Practice Work!...

Communities of Practice Facilitator Training
Presented by CORE September 28th

2 Welcome to SY 2015-16 Community of Practice Work!
Think of three words that you associate with the start of the school year thus far, and share with your colleagues!

3 Facilitators Participants will: Be informed of the reason that CoPs have been identified as part of the School Quality Improvement System and how our work fits within the national/local context Understand their roles and expectations as LAUSD facilitators of CoP Be (re-)introduced to the School Quality Improvement Index vis-a-vis mock reports in order to prepare to utilize Index data in the planning and implementation of Communities of Practice in SY 2015-16 Calibrate understanding of how Communities of Practice & the PDSA Cycle of Inquiry will be operationalized in the district in SY 2015-16 using LAUSD specific guidelines/procedures

4 Agenda
8:00am-‐8:20am Overview of CORE Intervention work in context 8:20am-‐8:30am Expectations of Local Districts and LAUSD facilitators (Karen) 8:30am-‐11:30am The Index and Cycles of Improvement (Noah & Jina) 11:30am-‐12:00pm Documentation for CoP in SY 2015-‐16 (Karen)

5 Who are the CORE Districts?
• CORE is a non-profit organization that includes ten California school district that work collaboratively to significantly improve student achievement
• Together CORE districts serve more than one million students and families (approximately 20% of all CA students)
• Six of the ten participating districts signed the waiver
5
Number of Students CORE Districts, SY 2011-2012
Note: Garden Grove, Sacramento, Sanger, and Clovis are not participating in the ESEA waiver application

6

7
USED offers a waiver for ESEA requirements.California is 1 of 5 states that does not have an approved ESEA Flexibility Waiver or one under review
States approved for ESEA flexibility
States with ESEA flexibility requests under review
Source: USED

8 In August 2013, the CORE districts’ waiver was approved.It allowed these districts to pursue a new holistic accountability model for schools and freed up $110 million in Title 1 “set-asides” for more effective use
Participating Districts Title 1 Set Aside $ and Number of Students Impacted

9 Three Principles of the Waiver

10 The School Quality Improvement Index all comes
with new school classifications
*Support Schools are those that did not meet the API growth or graduation target and are in the bottom 30% - <721.

11
Communities of practice provide a new model for connecting people in the spirit of learning,
knowledge sharing, and collaboration as well as individual, group, and organizational development.
Why did the CORE Districts choose Communities of Practice as an intervention strategy?
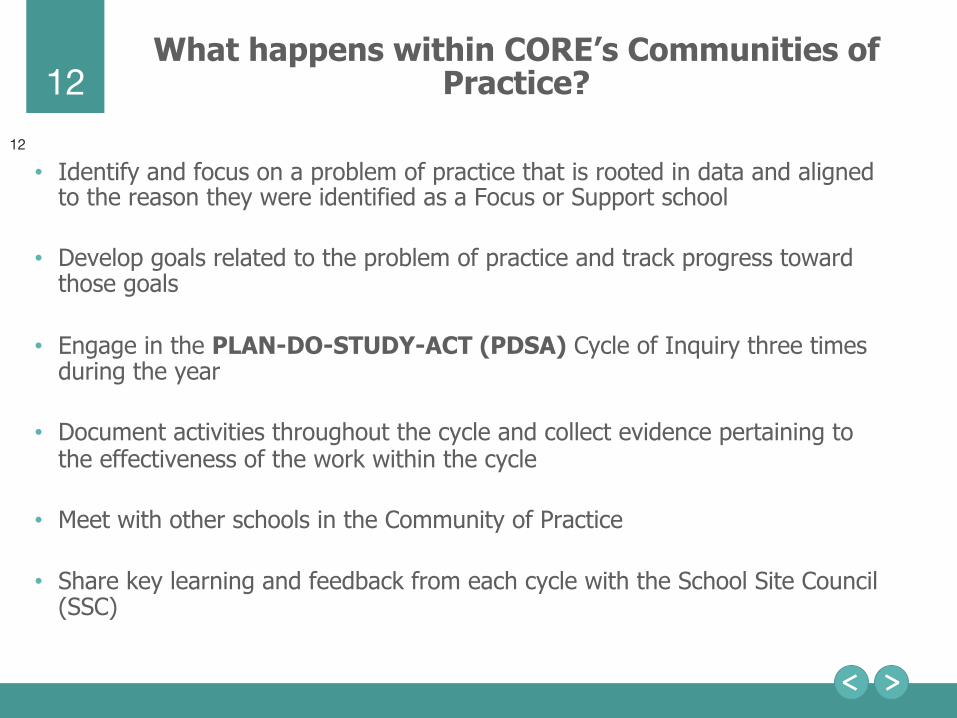
12 What happens within CORE’s Communities of
Practice?
12
• Identify and focus on a problem of practice that is rooted in data and aligned to the reason they were identified as a Focus or Support school
• Develop goals related to the problem of practice and track progress toward
those goals • Engage in the PLAN-DO-STUDY-ACT (PDSA) Cycle of Inquiry three times
during the year
• Document activities throughout the cycle and collect evidence pertaining to the effectiveness of the work within the cycle
• Meet with other schools in the Community of Practice
• Share key learning and feedback from each cycle with the School Site Council (SSC)

13 Communities of Practice were organized in a
variety of ways in SY 14-15
13
Organizing Structure
• Local District-wide
• Across Multiple Local Districts
• Instructional Director
• School Level Content
• Common Theme; Common Problem of Practice; Same Intervention
• Common Theme; Common Problem of Practice; Intervention
• Common Theme; School-Specific Problem of Practice

14 Expectations of a Local Districts and CoP Facilitators
*Refer to handout for full description of expectations of Local Districts, including facilitators, AIs and the fiscal team
School CoP Teams
CoP Facilitators
Local District Administrators of Instruction (AIs)
LAUSD Central Office (FSEP)
Funding, Tech. Assistance and
Monitoring
Coordination and Oversight
Fiscal Team
Support and Monitor Process funds

15 What does the PDSA Cycle entail?

16 Overview of CoP Calendar for 2015-2016

17 LAUSD has worked with the other CORE Districts to develop the School Quality Improvement Index.

18 Looking at the Index
• What is the School Quality Improvement System? • What is the School Quality Index? • What’s in this report?

19 This fall, the CORE Districts will be releasing the first version of the School Quality Improvement Index
([�[OL�[PTL�VM�W\ISPJH[PVU��[OL�TL[OVKZ�MVY�[OL�:JOVVS�8\HSP[`�0TWYV]LTLU[�0UKL_�HUK�[OL�ZJOVVS�PKLU[PÄJH[PVU�JYP[LYPH�KLZJYPILK�herein were under review by the US Department of Education, and these reports are therefore subject to change.2
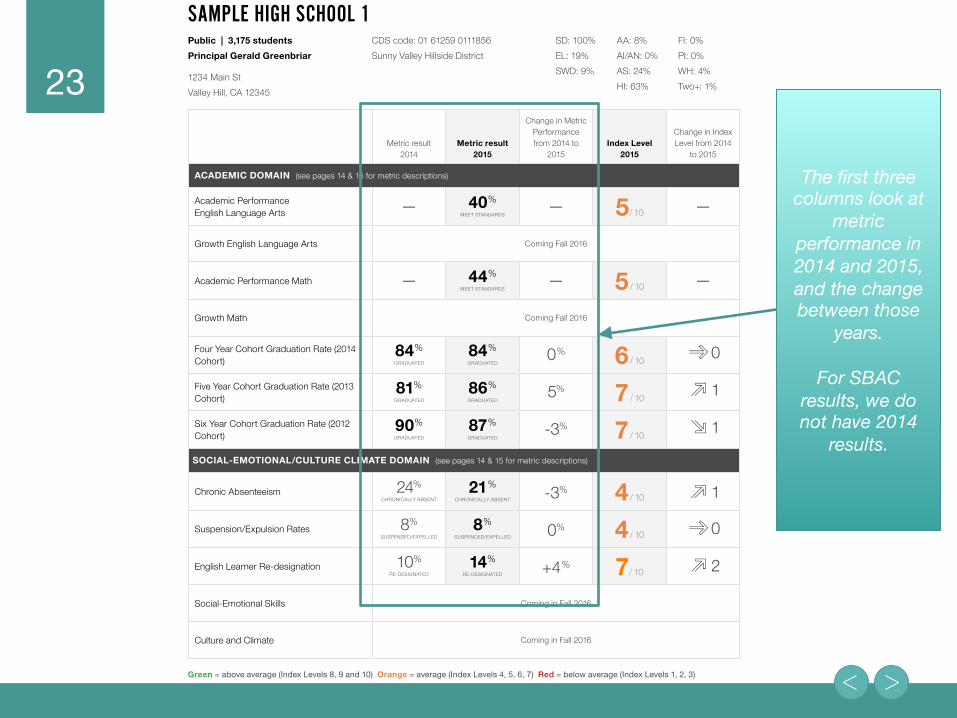
SAMPLE HIGH SCHOOL 1Public | 3,175 studentsPrincipal Gerald Greenbriar
1234 Main StValley Hill, CA 12345
CDS code: 01 61259 0111856Sunny Valley Hillside District
SD: 100%EL: 19%SWD: 9%
AA: 8%AI/AN: 0%AS: 24%HI: 63%
FI: 0%PI: 0%WH: 4%;^V�!���
Metric result 2014
Metric result 2015
Change in Metric Performance from 2014 to
2015Index Level
2015
*OHUNL�PU�0UKL_�Level from 2014
to 2015
ACADEMIC DOMAIN (see pages 14 & 15 for metric descriptions)
Academic Performance English Language Arts — 40 %
4,,;�:;(5+(9+:— 5/ 10 —
Growth English Language Arts Coming Fall 2016
Academic Performance Math — 44 %4,,;�:;(5+(9+:
— 5 / 10 —
Growth Math Coming Fall 2016
Four Year Cohort Graduation Rate (2014 Cohort)
84%.9(+<(;,+
84 %.9(+<(;,+
0 % 6 / 10 0
Five Year Cohort Graduation Rate (2013 Cohort)
81%.9(+<(;,+
86 %.9(+<(;,+
5% 7 / 10 1
:P_�@LHY�*VOVY[�.YHK\H[PVU�9H[L�������Cohort)
90%.9(+<(;,+
87 %.9(+<(;,+
��% 7 / 10 1
SOCIAL-EMOTIONAL/CULTURE CLIMATE DOMAIN (see pages 14 & 15 for metric descriptions)
Chronic Absenteeism 24%*/9650*(33@�():,5;
21 %*/9650*(33@�():,5; ��% � / 10 �
:\ZWLUZPVU�,_W\SZPVU�9H[LZ 8%SUSPENDED/EXPELLED
8 %SUSPENDED/EXPELLED 0% � / 10 0
,UNSPZO�3LHYULY�9L�KLZPNUH[PVU 10%9,�+,:0.5(;,+
14%9,�+,:0.5(;,+ �� % �/ 10 2
:VJPHS�,TV[PVUHS�:RPSSZ Coming in Fall 2016
Culture and Climate Coming in Fall 2016
Green = above average (Index Levels 8, 9 and 10) 6YHUNL = average (Index Levels 4, 5, 6, 7) Red = below average (Index Levels 1, 2, 3)

20 Our release timeline will allow school leaders to build their understanding and capacity before results become public.
July 2015 PDF Format Delivered to district leaders Mock data for at least one elementary school, middle school, and high school
Mock Reports Fall 2015 PDF Format Extended preview period of approximately six weeks for district leaders and principals starting as soon as possible Then released publicly on the CORE Website with ability for districts to report on their websites Seeking districts interested in releasing on GreatSchools profile pages *** Working to provide complimentary “detailed” and dynamic reporting on the VersiFit EdVantage system.
Final Reports Starting in January 2016 Foregrounding “built in” Index metric dashboard on profile pages District-specific phasing Opportunities for editorialized content and communications for districts
GreatSchools Phased Rollout
Dependent on how quickly data are
received from districts and CDE releases
SBAC

21
The cover page speaks to the
what and why of this work.

22
Demographics and key
information about the school are included on the page with all students results.
([�[OL�[PTL�VM�W\ISPJH[PVU��[OL�TL[OVKZ�MVY�[OL�:JOVVS�8\HSP[`�0TWYV]LTLU[�0UKL_�HUK�[OL�ZJOVVS�PKLU[PÄJH[PVU�JYP[LYPH�KLZJYPILK�herein were under review by the US Department of Education, and these reports are therefore subject to change.2
SAMPLE HIGH SCHOOL 1Public | 3,175 studentsPrincipal Gerald Greenbriar
1234 Main StValley Hill, CA 12345
CDS code: 01 61259 0111856Sunny Valley Hillside District
SD: 100%EL: 19%SWD: 9%
AA: 8%AI/AN: 0%AS: 24%HI: 63%
FI: 0%PI: 0%WH: 4%;^V�!���
Metric result 2014
Metric result 2015
Change in Metric Performance from 2014 to
2015Index Level
2015
*OHUNL�PU�0UKL_�Level from 2014
to 2015
ACADEMIC DOMAIN (see pages 14 & 15 for metric descriptions)
Academic Performance English Language Arts — 40 %
4,,;�:;(5+(9+:— 5/ 10 —
Growth English Language Arts Coming Fall 2016
Academic Performance Math — 44 %4,,;�:;(5+(9+:
— 5 / 10 —
Growth Math Coming Fall 2016
Four Year Cohort Graduation Rate (2014 Cohort)
84%.9(+<(;,+
84 %.9(+<(;,+
0 % 6 / 10 0
Five Year Cohort Graduation Rate (2013 Cohort)
81%.9(+<(;,+
86 %.9(+<(;,+
5% 7 / 10 1
:P_�@LHY�*VOVY[�.YHK\H[PVU�9H[L�������Cohort)
90%.9(+<(;,+
87 %.9(+<(;,+
��% 7 / 10 1
SOCIAL-EMOTIONAL/CULTURE CLIMATE DOMAIN (see pages 14 & 15 for metric descriptions)
Chronic Absenteeism 24%*/9650*(33@�():,5;
21 %*/9650*(33@�():,5; ��% � / 10 �
:\ZWLUZPVU�,_W\SZPVU�9H[LZ 8%SUSPENDED/EXPELLED
8 %SUSPENDED/EXPELLED 0% � / 10 0
,UNSPZO�3LHYULY�9L�KLZPNUH[PVU 10%9,�+,:0.5(;,+
14%9,�+,:0.5(;,+ �� % �/ 10 2
:VJPHS�,TV[PVUHS�:RPSSZ Coming in Fall 2016
Culture and Climate Coming in Fall 2016
Green = above average (Index Levels 8, 9 and 10) 6YHUNL = average (Index Levels 4, 5, 6, 7) Red = below average (Index Levels 1, 2, 3)
23
([�[OL�[PTL�VM�W\ISPJH[PVU��[OL�TL[OVKZ�MVY�[OL�:JOVVS�8\HSP[`�0TWYV]LTLU[�0UKL_�HUK�[OL�ZJOVVS�PKLU[PÄJH[PVU�JYP[LYPH�KLZJYPILK�herein were under review by the US Department of Education, and these reports are therefore subject to change.2
SAMPLE HIGH SCHOOL 1Public | 3,175 studentsPrincipal Gerald Greenbriar
1234 Main StValley Hill, CA 12345
CDS code: 01 61259 0111856Sunny Valley Hillside District
SD: 100%EL: 19%SWD: 9%
AA: 8%AI/AN: 0%AS: 24%HI: 63%
FI: 0%PI: 0%WH: 4%;^V�!���
Metric result 2014
Metric result 2015
Change in Metric Performance from 2014 to
2015Index Level
2015
*OHUNL�PU�0UKL_�Level from 2014
to 2015
ACADEMIC DOMAIN (see pages 14 & 15 for metric descriptions)
Academic Performance English Language Arts — 40 %
4,,;�:;(5+(9+:— 5/ 10 —
Growth English Language Arts Coming Fall 2016
Academic Performance Math — 44 %4,,;�:;(5+(9+:
— 5 / 10 —
Growth Math Coming Fall 2016
Four Year Cohort Graduation Rate (2014 Cohort)
84%.9(+<(;,+
84 %.9(+<(;,+
0 % 6 / 10 0
Five Year Cohort Graduation Rate (2013 Cohort)
81%.9(+<(;,+
86 %.9(+<(;,+
5% 7 / 10 1
:P_�@LHY�*VOVY[�.YHK\H[PVU�9H[L�������Cohort)
90%.9(+<(;,+
87 %.9(+<(;,+
��% 7 / 10 1
SOCIAL-EMOTIONAL/CULTURE CLIMATE DOMAIN (see pages 14 & 15 for metric descriptions)
Chronic Absenteeism 24%*/9650*(33@�():,5;
21 %*/9650*(33@�():,5; ��% � / 10 �
:\ZWLUZPVU�,_W\SZPVU�9H[LZ 8%SUSPENDED/EXPELLED
8 %SUSPENDED/EXPELLED 0% � / 10 0
,UNSPZO�3LHYULY�9L�KLZPNUH[PVU 10%9,�+,:0.5(;,+
14%9,�+,:0.5(;,+ �� % �/ 10 2
:VJPHS�,TV[PVUHS�:RPSSZ Coming in Fall 2016
Culture and Climate Coming in Fall 2016
Green = above average (Index Levels 8, 9 and 10) 6YHUNL = average (Index Levels 4, 5, 6, 7) Red = below average (Index Levels 1, 2, 3)
The first three columns look at
metric performance in 2014 and 2015, and the change between those
years.
For SBAC results, we do not have 2014
results.

24
([�[OL�[PTL�VM�W\ISPJH[PVU��[OL�TL[OVKZ�MVY�[OL�:JOVVS�8\HSP[`�0TWYV]LTLU[�0UKL_�HUK�[OL�ZJOVVS�PKLU[PÄJH[PVU�JYP[LYPH�KLZJYPILK�herein were under review by the US Department of Education, and these reports are therefore subject to change.2
SAMPLE HIGH SCHOOL 1Public | 3,175 studentsPrincipal Gerald Greenbriar
1234 Main StValley Hill, CA 12345
CDS code: 01 61259 0111856Sunny Valley Hillside District
SD: 100%EL: 19%SWD: 9%
AA: 8%AI/AN: 0%AS: 24%HI: 63%
FI: 0%PI: 0%WH: 4%;^V�!���
Metric result 2014
Metric result 2015
Change in Metric Performance from 2014 to
2015Index Level
2015
*OHUNL�PU�0UKL_�Level from 2014
to 2015
ACADEMIC DOMAIN (see pages 14 & 15 for metric descriptions)
Academic Performance English Language Arts — 40 %
4,,;�:;(5+(9+:— 5/ 10 —
Growth English Language Arts Coming Fall 2016
Academic Performance Math — 44 %4,,;�:;(5+(9+:
— 5 / 10 —
Growth Math Coming Fall 2016
Four Year Cohort Graduation Rate (2014 Cohort)
84%.9(+<(;,+
84 %.9(+<(;,+
0 % 6 / 10 0
Five Year Cohort Graduation Rate (2013 Cohort)
81%.9(+<(;,+
86 %.9(+<(;,+
5% 7 / 10 1
:P_�@LHY�*VOVY[�.YHK\H[PVU�9H[L�������Cohort)
90%.9(+<(;,+
87 %.9(+<(;,+
��% 7 / 10 1
SOCIAL-EMOTIONAL/CULTURE CLIMATE DOMAIN (see pages 14 & 15 for metric descriptions)
Chronic Absenteeism 24%*/9650*(33@�():,5;
21 %*/9650*(33@�():,5; ��% � / 10 �
:\ZWLUZPVU�,_W\SZPVU�9H[LZ 8%SUSPENDED/EXPELLED
8 %SUSPENDED/EXPELLED 0% � / 10 0
,UNSPZO�3LHYULY�9L�KLZPNUH[PVU 10%9,�+,:0.5(;,+
14%9,�+,:0.5(;,+ �� % �/ 10 2
:VJPHS�,TV[PVUHS�:RPSSZ Coming in Fall 2016
Culture and Climate Coming in Fall 2016
Green = above average (Index Levels 8, 9 and 10) 6YHUNL = average (Index Levels 4, 5, 6, 7) Red = below average (Index Levels 1, 2, 3)
Using baseline data, we have/
will set performance thresholds for
level 1, 2, 3…4, 5,…9, 10
performance. Levels 1, 2, 3 are
low/below average; levels 4,
5, 6 and 7 are about average; and level 8, 9
and 10 are above average/high.
We apply
weights to the Index levels to
determine Index points earned for the overall Index
score.

25
([�[OL�[PTL�VM�W\ISPJH[PVU��[OL�TL[OVKZ�MVY�[OL�:JOVVS�8\HSP[`�0TWYV]LTLU[�0UKL_�HUK�[OL�ZJOVVS�PKLU[PÄJH[PVU�JYP[LYPH�KLZJYPILK�herein were under review by the US Department of Education, and these reports are therefore subject to change.2
SAMPLE HIGH SCHOOL 1Public | 3,175 studentsPrincipal Gerald Greenbriar
1234 Main StValley Hill, CA 12345
CDS code: 01 61259 0111856Sunny Valley Hillside District
SD: 100%EL: 19%SWD: 9%
AA: 8%AI/AN: 0%AS: 24%HI: 63%
FI: 0%PI: 0%WH: 4%;^V�!���
Metric result 2014
Metric result 2015
Change in Metric Performance from 2014 to
2015Index Level
2015
*OHUNL�PU�0UKL_�Level from 2014
to 2015
ACADEMIC DOMAIN (see pages 14 & 15 for metric descriptions)
Academic Performance English Language Arts — 40 %
4,,;�:;(5+(9+:— 5/ 10 —
Growth English Language Arts Coming Fall 2016
Academic Performance Math — 44 %4,,;�:;(5+(9+:
— 5 / 10 —
Growth Math Coming Fall 2016
Four Year Cohort Graduation Rate (2014 Cohort)
84%.9(+<(;,+
84 %.9(+<(;,+
0 % 6 / 10 0
Five Year Cohort Graduation Rate (2013 Cohort)
81%.9(+<(;,+
86 %.9(+<(;,+
5% 7 / 10 1
:P_�@LHY�*VOVY[�.YHK\H[PVU�9H[L�������Cohort)
90%.9(+<(;,+
87 %.9(+<(;,+
��% 7 / 10 1
SOCIAL-EMOTIONAL/CULTURE CLIMATE DOMAIN (see pages 14 & 15 for metric descriptions)
Chronic Absenteeism 24%*/9650*(33@�():,5;
21 %*/9650*(33@�():,5; ��% � / 10 �
:\ZWLUZPVU�,_W\SZPVU�9H[LZ 8%SUSPENDED/EXPELLED
8 %SUSPENDED/EXPELLED 0% � / 10 0
,UNSPZO�3LHYULY�9L�KLZPNUH[PVU 10%9,�+,:0.5(;,+
14%9,�+,:0.5(;,+ �� % �/ 10 2
:VJPHS�,TV[PVUHS�:RPSSZ Coming in Fall 2016
Culture and Climate Coming in Fall 2016
Green = above average (Index Levels 8, 9 and 10) 6YHUNL = average (Index Levels 4, 5, 6, 7) Red = below average (Index Levels 1, 2, 3)
Using baseline data, we can also look at whether
schools are showing
improvement with respect to
Index levels.

26
The next page lets stakeholders know what kind of improvement
is needed to advance 1, 2 or 3
Index levels.
We include the 2015 Index Level and metric result
as a reminder.
([�[OL�[PTL�VM�W\ISPJH[PVU��[OL�TL[OVKZ�MVY�[OL�:JOVVS�8\HSP[`�0TWYV]LTLU[�0UKL_�HUK�[OL�ZJOVVS�PKLU[PÄJH[PVU�JYP[LYPH�KLZJYPILK�herein were under review by the US Department of Education, and these reports are therefore subject to change.
SAMPLE HIGH SCHOOL 1
3
Amount of Improvement Needed to Advance Index Levels
0UKL_�3L]LS�2015
Metric Result in 2015
Change needed to improve 1 0UKL_�3L]LS
Change needed to improve 2 0UKL_�3L]LSZ
Change needed to improve 3 0UKL_�3L]LSZ
ACADEMIC DOMAIN (see pages 14 & 15 for metric descriptions)
Academic Performance English Language Arts 5 / 10
40 %4,,;�:;(5+(9+: ��% ���% ��� %
Growth English Language Arts Coming Fall 2016
Academic Performance Math 5 / 1044 %
4,,;�:;(5+(9+: ��% �� % ��� %
Growth Math Coming Fall 2016
Four Year Cohort Graduation Rate (2014 Cohort) 6 / 10
84 %.9(+<(;,+ ��% �� % �� %
Five Year Cohort Graduation Rate (2013 Cohort) 7 / 10
86 %.9(+<(;,+ ��% �� % � %
:P_�@LHY�*VOVY[�.YHK\H[PVU�9H[L�������Cohort) 7 / 10
�� %.9(+<(;,+ ��% �� % �� %
SOCIAL-EMOTIONAL/CULTURE CLIMATE DOMAIN (see pages 14 & 15 for metric descriptions)
Chronic Absenteeism � / 1021%
*/9650*(33@�():,5; �� % ��% �� %
:\ZWLUZPVU�,_W\SZPVU�9H[LZ � / 108%
SUSPENDED/EXPELLED �� % �� % ��%
,UNSPZO�3LHYULY�9L�KLZPNUH[PVU � / 1014 %
9,�+,:0.5(;,+ �� % �� % ���
:VJPHS�,TV[PVUHS�:RPSSZ Coming in Fall 2016
Culture and Climate Coming in Fall 2016
Green = above average (Index Levels 8, 9 and 10) 6YHUNL = average (Index Levels 4, 5, 6, 7) Red = below average (Index Levels 1, 2, 3)

27
The next page provides results for each of the
subgroup categories in the Index. Note that
for the racial/ethnic subgroup
category, we look at the lowest
performing racial/ethnic subgroup.
We include the
all students result as a benchmark.
([�[OL�[PTL�VM�W\ISPJH[PVU��[OL�TL[OVKZ�MVY�[OL�:JOVVS�8\HSP[`�0TWYV]LTLU[�0UKL_�HUK�[OL�ZJOVVS�PKLU[PÄJH[PVU�JYP[LYPH�KLZJYPILK�herein were under review by the US Department of Education, and these reports are therefore subject to change.
SAMPLE HIGH SCHOOL 1
4
2015 Performance on the Index Metrics for All Students and Each :\INYV\W�*H[LNVY`6]LYHSS�0UKL_�YLZ\S[Z�HYL�NLULYHSS`�L]LUS`�^LPNO[LK�IL[^LLU�[OL�HSS�Z[\KLU[Z�NYV\W�HUK�Z\INYV\W�WLYMVYTHUJL���Subgroup performance is divided evenly into the four categories below.
All Students
Lowest Performing Racial/Ethnic
Subgroup English LearnersStudents with
Disabilities
:VJPV�Economoically Disadvantaged
Students
ACADEMIC DOMAIN (see pages 14 & 15 for metric descriptions)
Academic Performance English Language Arts
40%4,,;�:;(5+(9+:
34% (AA)4,,;�:;(5+(9+:
11%4,,;�:;(5+(9+:
10%4,,;�:;(5+(9+:
40%4,,;�:;(5+(9+:
Growth English Language Arts Coming Fall 2016
Academic Performance Math
44 %4,,;�:;(5+(9+:
29% (AA)4,,;�:;(5+(9+:
31%4,,;�:;(5+(9+:
6%4,,;�:;(5+(9+:
44%4,,;�:;(5+(9+:
Growth Math Coming Fall 2016
Four Year Cohort Graduation Rate (2014 Cohort)
84%.9(+<(;,+
83% (AA).9(+<(;,+
74%.9(+<(;,+
45%.9(+<(;,+
84%.9(+<(;,+
Five Year Cohort Graduation Rate (2013 Cohort)
86%.9(+<(;,+
86% (AA/HI).9(+<(;,+
77%.9(+<(;,+
54%.9(+<(;,+
87%.9(+<(;,+
:P_�@LHY�*VOVY[�.YHK\H[PVU�Rate (2012 Cohort)
87%.9(+<(;,+
85% (AA).9(+<(;,+
79%.9(+<(;,+
49%.9(+<(;,+
88%.9(+<(;,+
SOCIAL-EMOTIONAL/CULTURE CLIMATE DOMAIN (see pages 14 & 15 for metric descriptions)
Chronic Absenteeism 21%*/9650*(33@�():,5;
35% (WH)*/9650*(33@�():,5;
18%*/9650*(33@�():,5;
38%*/9650*(33@�():,5;
21%*/9650*(33@�():,5;
:\ZWLUZPVU�,_W\SZPVU�Rates
8%SUSPENDED/EXPELLED
14% (AA)SUSPENDED/EXPELLED
6%SUSPENDED/EXPELLED
14%SUSPENDED/EXPELLED
8%SUSPENDED/EXPELLED
English Learner 9L�KLZPNUH[PVU
14 %9,�+,:0.5(;,+
(N/A) (N/A) (N/A) (N/A)
:VJPHS�,TV[PVUHS�:RPSSZ Coming in Fall 2016
Culture and Climate Coming in Fall 2016
Green = above average (Index Levels 8, 9 and 10) 6YHUNL = average (Index Levels 4, 5, 6, 7) Red = below average (Index Levels 1, 2, 3)

28
The next page provides results for each racial/
ethnic subgroup
([�[OL�[PTL�VM�W\ISPJH[PVU��[OL�TL[OVKZ�MVY�[OL�:JOVVS�8\HSP[`�0TWYV]LTLU[�0UKL_�HUK�[OL�ZJOVVS�PKLU[PÄJH[PVU�JYP[LYPH�KLZJYPILK�herein were under review by the US Department of Education, and these reports are therefore subject to change.
SAMPLE HIGH SCHOOL 1
5
2015 Performance on the Index Metrics for Each Racial/Ethnic :\INYV\W�*H[LNVY`
(MYPJHU�American
(AA)
American Indian/Alaskan Native
(AI/AN)Asian(AS)
Hispanic/Latino(HI)
Filipino(FI)
7HJPÄJ�Islander
(PI)White(WH)
;^V�VY�4VYL�Races(Two+)
ACADEMIC DOMAIN (see pages 14 & 15 for metric descriptions)
Academic Performance English Language Arts
34%4,,;�:;(5+(9+:
41%4,,;�:;(5+(9+:
38%4,,;�:;(5+(9+:
68%4,,;�:;(5+(9+:
Growth English Language Arts Coming Fall 2016
Academic Performance Math
29%4,,;�:;(5+(9+:
59%4,,;�:;(5+(9+:
39%4,,;�:;(5+(9+:
50%4,,;�:;(5+(9+:
Growth Math Coming Fall 2016
Four Year Cohort Graduation Rate (2014 Cohort)
83%.9(+<(;,+
84%.9(+<(;,+
84%.9(+<(;,+
83%.9(+<(;,+
Five Year Cohort Graduation Rate (2013 Cohort)
86%.9(+<(;,+
87%.9(+<(;,+
86%.9(+<(;,+
:P_�@LHY�*VOVY[�Graduation Rate (2012 Cohort)
85%.9(+<(;,+
90%.9(+<(;,+
87%.9(+<(;,+
SOCIAL-EMOTIONAL/CULTURE CLIMATE DOMAIN (see pages 14 & 15 for metric descriptions)
Chronic Absenteeism30 %
CHRONICALLY ():,5;
11 %CHRONICALLY
():,5;
22 %CHRONICALLY
():,5;
35 %CHRONICALLY
():,5;
:\ZWLUZPVU�,_W\SZPVU�Rates
14%SUSPENDED/
EXPELLED
3 %SUSPENDED/
EXPELLED
8 %SUSPENDED/
EXPELLED
8 %SUSPENDED/
EXPELLED
English Learner 9L�KLZPNUH[PVU (N/A) (N/A) (N/A) (N/A) (N/A) (N/A) (N/A) (N/A)
:VJPHS�,TV[PVUHS�:RPSSZ Coming in Fall 2016
Culture and Climate Coming in Fall 2016
Green = above average (Index Levels 8, 9 and 10) 6YHUNL = average (Index Levels 4, 5, 6, 7) Red = below average (Index Levels 1, 2, 3)

29
([�[OL�[PTL�VM�W\ISPJH[PVU��[OL�TL[OVKZ�MVY�[OL�:JOVVS�8\HSP[`�0TWYV]LTLU[�0UKL_�HUK�[OL�ZJOVVS�PKLU[PÄJH[PVU�JYP[LYPH�KLZJYPILK�herein were under review by the US Department of Education, and these reports are therefore subject to change.
SAMPLE HIGH SCHOOL 1
6
Summary of School Quality Improvement Index points
��/100Overall Index rating
(3,175 Students)
— /100Elementary School Index Rating
(0 Students)
— /100Middle School Index Rating
(0 Students)
��/100High School Index Rating
(3,175 Students)
,Q�WKH�GLVSOD\�EHORZ��SRLQWV�SRVVLEOH�LV�WKH�ZHLJKW�RXW�RI������H�J���WKH�QXPEHU�WKDW�IROORZV�³RXW�RI´���DQG�SRLQWV�(DUQHG� �,QGH[�/HYHO�;�:HLJKW�;�����7R�FDOFXODWH�WKH�,QGH[�/HYHO��RXW�RI������GLYLGH�SRLQWV�HDUQHG�E\�SRLQWV�SRVVLEOH�DQG�PXOWLSOH�E\����
All Students
Lowest Performing Racial/Ethnic
Subgroup English LearnersStudents with
Disabilities
:VJPV�Economoically Disadvantaged
Students ;V[HS�7VPU[Z
ACADEMIC DOMAIN (see pages 14 & 15 for metric descriptions)
Academic Performance English Language Arts 3.75 out of 7.50 0.75 out of 1.88
(AA) 0.19 out of 1.88 0.19 out of 1.88 0.94 out of 1.88 5.82 out of 15
Growth English Language Arts Coming Fall 2016
Academic Performance Math 3.75 out of 7.50 0.38 out of 1.88
(AA) 0.56 out of 1.88 0.19 out of 1.88 0.94 out of 1.88 5.82 out of 15
Growth Math Coming Fall 2016
Four Year Cohort Graduation Rate (2014 Cohort)
6.00 out of 10 1.50 out of 2.50 (AA) 1.00 out of 2.50 0.25 out of
2.50 1.50 out of 2.50 10.25 out of 20
Five Year Cohort Graduation Rate (2013 Cohort)
1.75 out of 2.50 0.44 out of 0.63 (AA/HI) 0.32 out of 0.63 0.06 out of 0.63 0.44 out of 0.63 3.01 out of 5
:P_�@LHY�*VOVY[�Graduation Rate (2012 Cohort)
1.75 out of 2.50 0.44 out of 0.63 (AA) 0.32 out of 0.63 0.06 out of 0.63 0.50 out of 0.63 3.07 out of 5
SOCIAL-EMOTIONAL/CULTURE CLIMATE DOMAIN (see pages 14 & 15 for metric descriptions)
Chronic Absenteeism �.�� out of 6.67 0.17 out of 1.67 (WH) �.�� out of 1.67 0.17 out of 1.67 0.�� out of 1.67 �.52 out of
13.33
:\ZWLUZPVU�,_W\SZPVU�Rates ���� out of 6.67 0.17 out of 1.67
(AA) 1.�� out of 1.67 0.17 out of 1.67 �.�� out of 1.67 �.�� out of 13.33
English Learner 9L�KLZPNUH[PVU
.�� out of 13.33 (N/A) (N/A) (N/A) (N/A) .�� out of
13.33
:VJPHS�,TV[PVUHS�:RPSSZ Coming in Fall 2016
Culture and Climate Coming in Fall 2016
Green = above average (Index Levels 8, 9 and 10) 6YHUNL = average (Index Levels 4, 5, 6, 7) Red = below average (Index Levels 1, 2, 3)
This page provides Index
scores.
The “out of” amount is the
weight. For each metric half of the weight goes to the all students
group and half of the weight goes
to each subgroup category.

30
Points earned are calculated by the following formula:
Index Level
X
Weight X 10 ***
To get the Index Level for each result in this display, use
this formula:
Points earned /
Points Possible X 10
([�[OL�[PTL�VM�W\ISPJH[PVU��[OL�TL[OVKZ�MVY�[OL�:JOVVS�8\HSP[`�0TWYV]LTLU[�0UKL_�HUK�[OL�ZJOVVS�PKLU[PÄJH[PVU�JYP[LYPH�KLZJYPILK�herein were under review by the US Department of Education, and these reports are therefore subject to change.
SAMPLE HIGH SCHOOL 1
6
Summary of School Quality Improvement Index points
��/100Overall Index rating
(3,175 Students)
— /100Elementary School Index Rating
(0 Students)
— /100Middle School Index Rating
(0 Students)
��/100High School Index Rating
(3,175 Students)
,Q�WKH�GLVSOD\�EHORZ��SRLQWV�SRVVLEOH�LV�WKH�ZHLJKW�RXW�RI������H�J���WKH�QXPEHU�WKDW�IROORZV�³RXW�RI´���DQG�SRLQWV�(DUQHG� �,QGH[�/HYHO�;�:HLJKW�;�����7R�FDOFXODWH�WKH�,QGH[�/HYHO��RXW�RI������GLYLGH�SRLQWV�HDUQHG�E\�SRLQWV�SRVVLEOH�DQG�PXOWLSOH�E\����
All Students
Lowest Performing Racial/Ethnic
Subgroup English LearnersStudents with
Disabilities
:VJPV�Economoically Disadvantaged
Students ;V[HS�7VPU[Z
ACADEMIC DOMAIN (see pages 14 & 15 for metric descriptions)
Academic Performance English Language Arts 3.75 out of 7.50 0.75 out of 1.88
(AA) 0.19 out of 1.88 0.19 out of 1.88 0.94 out of 1.88 5.82 out of 15
Growth English Language Arts Coming Fall 2016
Academic Performance Math 3.75 out of 7.50 0.38 out of 1.88
(AA) 0.56 out of 1.88 0.19 out of 1.88 0.94 out of 1.88 5.82 out of 15
Growth Math Coming Fall 2016
Four Year Cohort Graduation Rate (2014 Cohort)
6.00 out of 10 1.50 out of 2.50 (AA) 1.00 out of 2.50 0.25 out of
2.50 1.50 out of 2.50 10.25 out of 20
Five Year Cohort Graduation Rate (2013 Cohort)
1.75 out of 2.50 0.44 out of 0.63 (AA/HI) 0.32 out of 0.63 0.06 out of 0.63 0.44 out of 0.63 3.01 out of 5
:P_�@LHY�*VOVY[�Graduation Rate (2012 Cohort)
1.75 out of 2.50 0.44 out of 0.63 (AA) 0.32 out of 0.63 0.06 out of 0.63 0.50 out of 0.63 3.07 out of 5
SOCIAL-EMOTIONAL/CULTURE CLIMATE DOMAIN (see pages 14 & 15 for metric descriptions)
Chronic Absenteeism �.�� out of 6.67 0.17 out of 1.67 (WH) �.�� out of 1.67 0.17 out of 1.67 0.�� out of 1.67 �.52 out of
13.33
:\ZWLUZPVU�,_W\SZPVU�Rates ���� out of 6.67 0.17 out of 1.67
(AA) 1.�� out of 1.67 0.17 out of 1.67 �.�� out of 1.67 �.�� out of 13.33
English Learner 9L�KLZPNUH[PVU
.�� out of 13.33 (N/A) (N/A) (N/A) (N/A) .�� out of
13.33
:VJPHS�,TV[PVUHS�:RPSSZ Coming in Fall 2016
Culture and Climate Coming in Fall 2016
Green = above average (Index Levels 8, 9 and 10) 6YHUNL = average (Index Levels 4, 5, 6, 7) Red = below average (Index Levels 1, 2, 3)

31
The overall Index Score is at the top
of this page.
Note that for schools that span
multiple levels, Index results will be provided by school
level, and the overall Index score is
generated using a student weighted
average of the results for each
school level.
([�[OL�[PTL�VM�W\ISPJH[PVU��[OL�TL[OVKZ�MVY�[OL�:JOVVS�8\HSP[`�0TWYV]LTLU[�0UKL_�HUK�[OL�ZJOVVS�PKLU[PÄJH[PVU�JYP[LYPH�KLZJYPILK�herein were under review by the US Department of Education, and these reports are therefore subject to change.
SAMPLE HIGH SCHOOL 1
6
Summary of School Quality Improvement Index points
��/100Overall Index rating
(3,175 Students)
— /100Elementary School Index Rating
(0 Students)
— /100Middle School Index Rating
(0 Students)
��/100High School Index Rating
(3,175 Students)
,Q�WKH�GLVSOD\�EHORZ��SRLQWV�SRVVLEOH�LV�WKH�ZHLJKW�RXW�RI������H�J���WKH�QXPEHU�WKDW�IROORZV�³RXW�RI´���DQG�SRLQWV�(DUQHG� �,QGH[�/HYHO�;�:HLJKW�;�����7R�FDOFXODWH�WKH�,QGH[�/HYHO��RXW�RI������GLYLGH�SRLQWV�HDUQHG�E\�SRLQWV�SRVVLEOH�DQG�PXOWLSOH�E\����
All Students
Lowest Performing Racial/Ethnic
Subgroup English LearnersStudents with
Disabilities
:VJPV�Economoically Disadvantaged
Students ;V[HS�7VPU[Z
ACADEMIC DOMAIN (see pages 14 & 15 for metric descriptions)
Academic Performance English Language Arts 3.75 out of 7.50 0.75 out of 1.88
(AA) 0.19 out of 1.88 0.19 out of 1.88 0.94 out of 1.88 5.82 out of 15
Growth English Language Arts Coming Fall 2016
Academic Performance Math 3.75 out of 7.50 0.38 out of 1.88
(AA) 0.56 out of 1.88 0.19 out of 1.88 0.94 out of 1.88 5.82 out of 15
Growth Math Coming Fall 2016
Four Year Cohort Graduation Rate (2014 Cohort)
6.00 out of 10 1.50 out of 2.50 (AA) 1.00 out of 2.50 0.25 out of
2.50 1.50 out of 2.50 10.25 out of 20
Five Year Cohort Graduation Rate (2013 Cohort)
1.75 out of 2.50 0.44 out of 0.63 (AA/HI) 0.32 out of 0.63 0.06 out of 0.63 0.44 out of 0.63 3.01 out of 5
:P_�@LHY�*VOVY[�Graduation Rate (2012 Cohort)
1.75 out of 2.50 0.44 out of 0.63 (AA) 0.32 out of 0.63 0.06 out of 0.63 0.50 out of 0.63 3.07 out of 5
SOCIAL-EMOTIONAL/CULTURE CLIMATE DOMAIN (see pages 14 & 15 for metric descriptions)
Chronic Absenteeism �.�� out of 6.67 0.17 out of 1.67 (WH) �.�� out of 1.67 0.17 out of 1.67 0.�� out of 1.67 �.52 out of
13.33
:\ZWLUZPVU�,_W\SZPVU�Rates ���� out of 6.67 0.17 out of 1.67
(AA) 1.�� out of 1.67 0.17 out of 1.67 �.�� out of 1.67 �.�� out of 13.33
English Learner 9L�KLZPNUH[PVU
.�� out of 13.33 (N/A) (N/A) (N/A) (N/A) .�� out of
13.33
:VJPHS�,TV[PVUHS�:RPSSZ Coming in Fall 2016
Culture and Climate Coming in Fall 2016
Green = above average (Index Levels 8, 9 and 10) 6YHUNL = average (Index Levels 4, 5, 6, 7) Red = below average (Index Levels 1, 2, 3)

32
([�[OL�[PTL�VM�W\ISPJH[PVU��[OL�TL[OVKZ�MVY�[OL�:JOVVS�8\HSP[`�0TWYV]LTLU[�0UKL_�HUK�[OL�ZJOVVS�PKLU[PÄJH[PVU�JYP[LYPH�KLZJYPILK�herein were under review by the US Department of Education, and these reports are therefore subject to change.
SAMPLE HIGH SCHOOL 1
10
*69,�(UU\HS�4LHZ\YLHISL�6IQLJ[P]L�HUK�*\YYLU[�+LZPNUH[PVU�Intervention Status;OL�*69,�(UU\HS�4LHZ\YHISL�6IQLJ[P]L��(46��HUK�KLZPNUH[PVUZ�PU[LY]LU[PVUZ�HWWS`�[V�TVZ[�;P[SL�0�ZJOVVSZ�PU�[OL�*69,�>HP]LY�+PZ[YPJ[Z��:LSLJ[�ZJOVVSZ�OH]L�ILLU�L_JS\KLK��L�N���JYLKP[�YLJV]LY`�ZJOVVSZ��PUKLWLUKLU[�JOHY[LYZ��PUKL�WLUKLU[�Z[\K`�ZJOVVSZ��ZJOVVSZ�MVY�Z[\KLU[Z�^P[O�ZL]LYL�KPZHIPSP[PLZ��ZJOVVSZ�MVY�L_WLSSLK�Z[\KLU[Z��LHYS`�JOPSKOVVK�education schools).
7LYMVYTHUJL�HNHPUZ[�[OL�(UU\HS�4LHZ\YHISL�6IQLJ[P]LAs part of our ESEA (NCLB) Waiver, the CORE Districts have set an Annual Measurable Objective (AMO) based upon [OL�OVSPZ[PJ�YLZ\S[�MYVT�[OL�:JOVVS�8\HSP[`�0TWYV]LTLU[�0UKL_��(Z�[OPZ�PZ�V\Y�IHZLSPUL�`LHY��[OL�(46�OHZ�ILLU�ZL[�PU�[LYTZ�VM�[OL�WLYJLU[PSL�YHURPUNZ�VM�ZJOVVSZ�VU�[OL�0UKL_��;OL�[VW�����VM�ZJOVVSZ�H[�[OL�LSLTLU[HY �̀�TPKKSL�HUK�OPNO�ZJOVVS�SL]LSZ��ZLWHYH[LS`�HUK�YLZWLJ[P]LS �̀�OH]L�ILLU�PKLU[PÄLK�HZ�TLL[PUN�[OL�(46��;OL�IV[[VT�����OH]L�UV[��-VY�ZJOVVSZ�^P[O�YLZ\S[Z�H[�TVYL�[OHU�VUL�ZJOVVS�SL]LS��^L�\ZL�[OL�6]LYHSS�0UKL_�9H[PUN��HUK�YHUR�ZJOVVSZ�^P[OPU�[OLPY�(70�;`WL��0U�VYKLY�[V�TLL[�[OL�(46��ZJOVVSZ�T\Z[�HSZV�OH]L�H� ���VY�OPNOLY�WHY[PJPWH[PVU�YH[L�VU�[OL�Z[H[L�HZZLZZTLU[Z�PU�ELA and math for the all students group and for each subgroup. Note that this is a baseline year, and no new schools HYL�ILPUN�YLX\PYLK�[V�LU[LY�PU[V�PU[LY]LU[PVUZ�PU�:@���������IHZLK�\WVU�[OLZL�YLZ\S[Z�
Fall 2015 AMO: Did not meet:JOVVS�;̀ WL!�/PNO�:JOVVS6]LYHSS�0UKL_�9H[PUN!���� points out of 100Percentile Ranking: 53rd Percentile;LZ[LK� ���VY�TVYL�VM�[OL�HSS�Z[\KLU[Z�NYV\W�HUK�LHJO�Z\INYV\W!�No
For SY 2016-17, the objective for all schools will be to be in the top 70% of Index results OR to improve two Index points.
:JOVVSZ�TPZZPUN�[OL�(46�PU�-HSS������HUK�-HSS������^PSS�IL�PKLU[PÄLK�MVY�Z\WWVY[�PU[LY]LU[PVU�PM�[OL`�HYL�UV[�HSYLHK`�PKLU[PÄLK�HZ�7YPVYP[`�VY�-VJ\Z�
-HSS������0UKL_�.YV^[O�;HYNL[!��� points out of 100
*\YYLU[�+LZPNUH[PVU�0U[LY]LU[PVU�:[H[\Z(Z�[OL�*69,�>HP]LY�OHZ�ILLU�ILLU�PU�LMMLJ[�MVY�[^V�ZJOVVS�`LHYZ��ZLSLJ[�ZJOVVSZ�OH]L�HSYLHK`�ILLU�PKLU[PÄLK�MVY�PU[LY�vention and support.
Current status: -VJ\Z���3V^�(JOPL]PUN�:\INYV\W���:[\KLU[Z�^P[O�+PZHIPSP[PLZ
>/@�+0+�;/,�:*/663�9,*,0=,�;/0:�+,:0.5(;065&-VY�ZJOVVSZ�PKLU[PÄLK�PU�Z\TTLY�������PUJS\KLZ�;P[SL�0�ZJOVVSZ�^P[O�Z\INYV\WZ�^P[O�SLZZ�[OHU�����H]LYHNL�WYVÄJPLUJ`�VU�4H[O�HUK�,3(�HZZLZZTLU[Z�PU������HUK�SLZZ�[OHU���WLYJLU[HNL�WVPU[Z�VM�PTWYV]LTLU[�MYVT����������"�MVY�ZJOVVSZ�PKLU[PÄLK�PU�Z\TTLY�������PUJS\KLZ�;P[SL�0�ZJOVVSZ�^P[O�Z\INYV\WZ�^P[O�SLZZ�[OHU�����H]LYHNL�WYVÄJPLUJ`�VU�4H[O�HUK�,3(�HZZLZZTLU[Z�PU������HUK�SLZZ�[OHU���WLYJLU[HNL�WVPU[Z�VM�PTWYV]LTLU[�MYVT�����������
The current AMO is based upon being in
the top 70% of Index results at the elementary, middle
and high school levels, separately and respectively.
Schools must also
test 95% of students in the all students group and each
subgroup.

33
([�[OL�[PTL�VM�W\ISPJH[PVU��[OL�TL[OVKZ�MVY�[OL�:JOVVS�8\HSP[`�0TWYV]LTLU[�0UKL_�HUK�[OL�ZJOVVS�PKLU[PÄJH[PVU�JYP[LYPH�KLZJYPILK�herein were under review by the US Department of Education, and these reports are therefore subject to change.
SAMPLE HIGH SCHOOL 1
10
*69,�(UU\HS�4LHZ\YLHISL�6IQLJ[P]L�HUK�*\YYLU[�+LZPNUH[PVU�Intervention Status;OL�*69,�(UU\HS�4LHZ\YHISL�6IQLJ[P]L��(46��HUK�KLZPNUH[PVUZ�PU[LY]LU[PVUZ�HWWS`�[V�TVZ[�;P[SL�0�ZJOVVSZ�PU�[OL�*69,�>HP]LY�+PZ[YPJ[Z��:LSLJ[�ZJOVVSZ�OH]L�ILLU�L_JS\KLK��L�N���JYLKP[�YLJV]LY`�ZJOVVSZ��PUKLWLUKLU[�JOHY[LYZ��PUKL�WLUKLU[�Z[\K`�ZJOVVSZ��ZJOVVSZ�MVY�Z[\KLU[Z�^P[O�ZL]LYL�KPZHIPSP[PLZ��ZJOVVSZ�MVY�L_WLSSLK�Z[\KLU[Z��LHYS`�JOPSKOVVK�education schools).
7LYMVYTHUJL�HNHPUZ[�[OL�(UU\HS�4LHZ\YHISL�6IQLJ[P]LAs part of our ESEA (NCLB) Waiver, the CORE Districts have set an Annual Measurable Objective (AMO) based upon [OL�OVSPZ[PJ�YLZ\S[�MYVT�[OL�:JOVVS�8\HSP[`�0TWYV]LTLU[�0UKL_��(Z�[OPZ�PZ�V\Y�IHZLSPUL�`LHY��[OL�(46�OHZ�ILLU�ZL[�PU�[LYTZ�VM�[OL�WLYJLU[PSL�YHURPUNZ�VM�ZJOVVSZ�VU�[OL�0UKL_��;OL�[VW�����VM�ZJOVVSZ�H[�[OL�LSLTLU[HY �̀�TPKKSL�HUK�OPNO�ZJOVVS�SL]LSZ��ZLWHYH[LS`�HUK�YLZWLJ[P]LS �̀�OH]L�ILLU�PKLU[PÄLK�HZ�TLL[PUN�[OL�(46��;OL�IV[[VT�����OH]L�UV[��-VY�ZJOVVSZ�^P[O�YLZ\S[Z�H[�TVYL�[OHU�VUL�ZJOVVS�SL]LS��^L�\ZL�[OL�6]LYHSS�0UKL_�9H[PUN��HUK�YHUR�ZJOVVSZ�^P[OPU�[OLPY�(70�;`WL��0U�VYKLY�[V�TLL[�[OL�(46��ZJOVVSZ�T\Z[�HSZV�OH]L�H� ���VY�OPNOLY�WHY[PJPWH[PVU�YH[L�VU�[OL�Z[H[L�HZZLZZTLU[Z�PU�ELA and math for the all students group and for each subgroup. Note that this is a baseline year, and no new schools HYL�ILPUN�YLX\PYLK�[V�LU[LY�PU[V�PU[LY]LU[PVUZ�PU�:@���������IHZLK�\WVU�[OLZL�YLZ\S[Z�
Fall 2015 AMO: Did not meet:JOVVS�;̀ WL!�/PNO�:JOVVS6]LYHSS�0UKL_�9H[PUN!���� points out of 100Percentile Ranking: 53rd Percentile;LZ[LK� ���VY�TVYL�VM�[OL�HSS�Z[\KLU[Z�NYV\W�HUK�LHJO�Z\INYV\W!�No
For SY 2016-17, the objective for all schools will be to be in the top 70% of Index results OR to improve two Index points.
:JOVVSZ�TPZZPUN�[OL�(46�PU�-HSS������HUK�-HSS������^PSS�IL�PKLU[PÄLK�MVY�Z\WWVY[�PU[LY]LU[PVU�PM�[OL`�HYL�UV[�HSYLHK`�PKLU[PÄLK�HZ�7YPVYP[`�VY�-VJ\Z�
-HSS������0UKL_�.YV^[O�;HYNL[!��� points out of 100
*\YYLU[�+LZPNUH[PVU�0U[LY]LU[PVU�:[H[\Z(Z�[OL�*69,�>HP]LY�OHZ�ILLU�ILLU�PU�LMMLJ[�MVY�[^V�ZJOVVS�`LHYZ��ZLSLJ[�ZJOVVSZ�OH]L�HSYLHK`�ILLU�PKLU[PÄLK�MVY�PU[LY�vention and support.
Current status: -VJ\Z���3V^�(JOPL]PUN�:\INYV\W���:[\KLU[Z�^P[O�+PZHIPSP[PLZ
>/@�+0+�;/,�:*/663�9,*,0=,�;/0:�+,:0.5(;065&-VY�ZJOVVSZ�PKLU[PÄLK�PU�Z\TTLY�������PUJS\KLZ�;P[SL�0�ZJOVVSZ�^P[O�Z\INYV\WZ�^P[O�SLZZ�[OHU�����H]LYHNL�WYVÄJPLUJ`�VU�4H[O�HUK�,3(�HZZLZZTLU[Z�PU������HUK�SLZZ�[OHU���WLYJLU[HNL�WVPU[Z�VM�PTWYV]LTLU[�MYVT����������"�MVY�ZJOVVSZ�PKLU[PÄLK�PU�Z\TTLY�������PUJS\KLZ�;P[SL�0�ZJOVVSZ�^P[O�Z\INYV\WZ�^P[O�SLZZ�[OHU�����H]LYHNL�WYVÄJPLUJ`�VU�4H[O�HUK�,3(�HZZLZZTLU[Z�PU������HUK�SLZZ�[OHU���WLYJLU[HNL�WVPU[Z�VM�PTWYV]LTLU[�MYVT�����������
The prospective AMO is based upon being in the top 70%
of Index results at the elementary, middle and high
school levels, separately and
respectively, OR showing a two point
improvement.
(Schools must also test 95% of students
in the all students group and each
subgroup).

34
For schools identified in prior school years, we
provide the current designation, and the
reason for that designation.
Note that our
proposal to USED is to wait until Fall 2016 to update
designations and intervention status.
([�[OL�[PTL�VM�W\ISPJH[PVU��[OL�TL[OVKZ�MVY�[OL�:JOVVS�8\HSP[`�0TWYV]LTLU[�0UKL_�HUK�[OL�ZJOVVS�PKLU[PÄJH[PVU�JYP[LYPH�KLZJYPILK�herein were under review by the US Department of Education, and these reports are therefore subject to change.
SAMPLE HIGH SCHOOL 1
10
*69,�(UU\HS�4LHZ\YLHISL�6IQLJ[P]L�HUK�*\YYLU[�+LZPNUH[PVU�Intervention Status;OL�*69,�(UU\HS�4LHZ\YHISL�6IQLJ[P]L��(46��HUK�KLZPNUH[PVUZ�PU[LY]LU[PVUZ�HWWS`�[V�TVZ[�;P[SL�0�ZJOVVSZ�PU�[OL�*69,�>HP]LY�+PZ[YPJ[Z��:LSLJ[�ZJOVVSZ�OH]L�ILLU�L_JS\KLK��L�N���JYLKP[�YLJV]LY`�ZJOVVSZ��PUKLWLUKLU[�JOHY[LYZ��PUKL�WLUKLU[�Z[\K`�ZJOVVSZ��ZJOVVSZ�MVY�Z[\KLU[Z�^P[O�ZL]LYL�KPZHIPSP[PLZ��ZJOVVSZ�MVY�L_WLSSLK�Z[\KLU[Z��LHYS`�JOPSKOVVK�education schools).
7LYMVYTHUJL�HNHPUZ[�[OL�(UU\HS�4LHZ\YHISL�6IQLJ[P]LAs part of our ESEA (NCLB) Waiver, the CORE Districts have set an Annual Measurable Objective (AMO) based upon [OL�OVSPZ[PJ�YLZ\S[�MYVT�[OL�:JOVVS�8\HSP[`�0TWYV]LTLU[�0UKL_��(Z�[OPZ�PZ�V\Y�IHZLSPUL�`LHY��[OL�(46�OHZ�ILLU�ZL[�PU�[LYTZ�VM�[OL�WLYJLU[PSL�YHURPUNZ�VM�ZJOVVSZ�VU�[OL�0UKL_��;OL�[VW�����VM�ZJOVVSZ�H[�[OL�LSLTLU[HY �̀�TPKKSL�HUK�OPNO�ZJOVVS�SL]LSZ��ZLWHYH[LS`�HUK�YLZWLJ[P]LS �̀�OH]L�ILLU�PKLU[PÄLK�HZ�TLL[PUN�[OL�(46��;OL�IV[[VT�����OH]L�UV[��-VY�ZJOVVSZ�^P[O�YLZ\S[Z�H[�TVYL�[OHU�VUL�ZJOVVS�SL]LS��^L�\ZL�[OL�6]LYHSS�0UKL_�9H[PUN��HUK�YHUR�ZJOVVSZ�^P[OPU�[OLPY�(70�;`WL��0U�VYKLY�[V�TLL[�[OL�(46��ZJOVVSZ�T\Z[�HSZV�OH]L�H� ���VY�OPNOLY�WHY[PJPWH[PVU�YH[L�VU�[OL�Z[H[L�HZZLZZTLU[Z�PU�ELA and math for the all students group and for each subgroup. Note that this is a baseline year, and no new schools HYL�ILPUN�YLX\PYLK�[V�LU[LY�PU[V�PU[LY]LU[PVUZ�PU�:@���������IHZLK�\WVU�[OLZL�YLZ\S[Z�
Fall 2015 AMO: Did not meet:JOVVS�;̀ WL!�/PNO�:JOVVS6]LYHSS�0UKL_�9H[PUN!���� points out of 100Percentile Ranking: 53rd Percentile;LZ[LK� ���VY�TVYL�VM�[OL�HSS�Z[\KLU[Z�NYV\W�HUK�LHJO�Z\INYV\W!�No
For SY 2016-17, the objective for all schools will be to be in the top 70% of Index results OR to improve two Index points.
:JOVVSZ�TPZZPUN�[OL�(46�PU�-HSS������HUK�-HSS������^PSS�IL�PKLU[PÄLK�MVY�Z\WWVY[�PU[LY]LU[PVU�PM�[OL`�HYL�UV[�HSYLHK`�PKLU[PÄLK�HZ�7YPVYP[`�VY�-VJ\Z�
-HSS������0UKL_�.YV^[O�;HYNL[!��� points out of 100
*\YYLU[�+LZPNUH[PVU�0U[LY]LU[PVU�:[H[\Z(Z�[OL�*69,�>HP]LY�OHZ�ILLU�ILLU�PU�LMMLJ[�MVY�[^V�ZJOVVS�`LHYZ��ZLSLJ[�ZJOVVSZ�OH]L�HSYLHK`�ILLU�PKLU[PÄLK�MVY�PU[LY�vention and support.
Current status: -VJ\Z���3V^�(JOPL]PUN�:\INYV\W���:[\KLU[Z�^P[O�+PZHIPSP[PLZ
>/@�+0+�;/,�:*/663�9,*,0=,�;/0:�+,:0.5(;065&-VY�ZJOVVSZ�PKLU[PÄLK�PU�Z\TTLY�������PUJS\KLZ�;P[SL�0�ZJOVVSZ�^P[O�Z\INYV\WZ�^P[O�SLZZ�[OHU�����H]LYHNL�WYVÄJPLUJ`�VU�4H[O�HUK�,3(�HZZLZZTLU[Z�PU������HUK�SLZZ�[OHU���WLYJLU[HNL�WVPU[Z�VM�PTWYV]LTLU[�MYVT����������"�MVY�ZJOVVSZ�PKLU[PÄLK�PU�Z\TTLY�������PUJS\KLZ�;P[SL�0�ZJOVVSZ�^P[O�Z\INYV\WZ�^P[O�SLZZ�[OHU�����H]LYHNL�WYVÄJPLUJ`�VU�4H[O�HUK�,3(�HZZLZZTLU[Z�PU������HUK�SLZZ�[OHU���WLYJLU[HNL�WVPU[Z�VM�PTWYV]LTLU[�MYVT�����������

35 Pages 11 to 17
• Pages 11 to 14 are designed to provide schools with their status against prospective designation criteria in Fall 2016.
• Pages 15 to 17 provide definitions, descriptions and information about performance thresholds.
• For up additional information about these pages or other methods, review our draft, living technical guide at http://bit.ly/indextechguide2015.

36 Studying the Index
• Take 10 min to study the Index report on your own for the purpose of clarity and understanding. We recommend paying particular attention to the following pages that will be most helpful in the inquiry process: – 2 to 5
• Questions and discussion for clarity

37 From the Index to the Improvement
Move to breakout group to dive into a case study
Take a 10 minute break

38 As you explore the data, we encourage you to move up the ladder of inference and to avoid jumping from looking at the data to conclusions.
Results
We start with low
inference, factual
information and move
up the ladder from
there.
Today we will use Index data in this exercise, but this type of approach is applicable to any set of data.

39 Step 1 – Select Data
Decide what data you intend to focus on for time being. What data might be most helpful to explore given current priorities and realities?
– Are you going to explore all of the data? – Do you want to focus specifically on the Academic domain, and/or
the SE/CC domain? – Do you want to focus on a particular subgroup?
– For today, we will focus on pages 2 to 5 of the mock reports. (In your actual work with schools, you may choose to focus on particular data elements).

40 Step 2 – Describe data
• Data sentences: To check for understanding, have participants
describe the data to their colleagues in the form of data sentences. These data sentences should be completely factual statements. Consider the following sample stems:
• Academic:
- [state the value] of students school-wide met standards for English Language Arts.
- The subgroup of [state subgroup] performed the lowest in English Language Arts at [state the value]
- Though All Students performed Above Average in Math, the subgroup of [state subgroup] performed Below Average at [state the value]

41 Step 3a – Consider possible inferences by noticing things in the data
Begin to move from factual statements into the beginnings of inferences by noting results that strike you for one reason or another. Be sure to highlight both apparent strengths and potential challenge areas. • “I’m surprised that…” • “I’m not surprised that…” • “I notice a potential pattern in the results for…whereby…” • “I notice that…” • “I wonder what is driving the difference in results for…” • “I wonder what might be behind…”

42 Step 3b – Consider possible inferences for areas of practice
Start hypothesizing about wonderings, patterns and items you noted in the prior step. In general, starting your responses with “I wonder if…” is a good way to stay in the realm of possible inferences before jumping to conclusions.
School or system-wide structures and systems
Instructional practices
Leadership practices
Family and community engagement practices
Relating CC and SEL
Other
How might school or system-wide structures and systems be contributing to these results (e.g., structure of the school day, rules and policies, organizational structures, standard operating procedures, the overall instructional program)?
How might instructional practices be contributing to these results (e.g., classroom management, communication of expectations, student engagement strategies, the types of instructional strategies utilized, levels of differentiation and personalization, use of assessment)?
How might leadership practices be contributing to these results (e.g., school visioning, communication systems and strategies, school planning, distributed leadership strategies and systems, structures and practices to support continuous improvement, use of professional learning time, allocation of financial and human resources)?
How might family and community engagement practices be contributing to these results (e.g., communication systems and strategies, strategies in place to engage families, training and support for staff in their work with families)?
How might culture-climate factors drive the social-emotional results and vice versa? Could strengths and challenges in culture-climate be a major factor in the development of students’ social-emotional skills? Could attention paid (or not) paid to social-emotional factors be contributing to the culture-climate results?
Other possible inferences?

43 Step 4 – Adding meaning through context
– What context and assumptions do we bring to this data that might be coloring how we view the data? How might we check these assumptions?
– What other data – both quantitative and qualitative – can help
inform our hypotheses about what is driving these results?
Refer to school description for added context OR Add your own context based on a similar school you know as you consider possible contributions to the school’s Index results

44 Step 5 – Drawing conclusions
– Strengths: What are one or two strengths in our efforts to develop academic skills, social-emotional skills and/or in our school culture-climate that we can identify from this inference making effort?
– Challenge areas: What are one or two challenge areas in our
efforts to develop academic skills, social-emotional skills and/or in our school culture-climate that we can identify from this inference making effort?

45 Transitioning to cycles of improvement
At this point, you have a sense of potential “problems of practice” Through the next steps we will identify and ultimately share out the following:
– A problem statement for this school. – A strategy that you might test in a cycle of improvement for
this problem. – Ideas for collecting evidence both in terms of progress against
the intended outcomes for students and in terms of implementation effort itself

46 Step 5 – Drawing conclusions Identify a Problem of Practice for the PDSA Cycle
What is the performance problem/challenge we’re trying to address? Based on the evidence and investigation, what is our Problem of Practice? What is our long-term student performance goal in addressing this problem? What is our short-term student performance goal for this specific cycle of inquiry?

47 Things to consider when crafting a problem of practice
A strong Problem of Practice… • Is based on data.
• Focuses on the student group the school was identified for.
• Is measurable. • Is actionable (is within the school’s/district’s control and can be
improved in real time).

48 Step 6 – Consider possible actions cont.
• Based upon your identified problem of practice, and our exploration of possible inferences and drivers, what might we want to…
Test out? Try out?
Consider the professional learning, and/or elements of the school’s key strategies for the year as a stimulus.

49 Step 7 – Select actions (and plan)
Complete your plan. In deciding what action or actions to test, consider the following:
– Size of potential impact: Which actions are most likely to have a significant impact?
– Impact on who: Which student populations will be most impacted by particular actions? Are these the populations we want to target?
– Coherence: Which actions are most coherent with our vision and key strategies?
– Feasibility: Which actions are most feasible for us to take on? Consider financial resources, human resources, policies, etc.
– Other criteria: Are there other criteria that will help us decide how to move forward? For instance, what are we most excited about and motivated to do?

50 Step 7 – Select actions (and plan) As you think about the plan:
– You now know your problem of practice – You identified something to test – Now, how might you collect evidence for this test? (From the template -
What data and how will we collect data to evaluate our predictions?) • Impact data: – Student impact: What data will tell you that you are making progress with students in the area of focus? What progress monitoring data does the district provide? What additional data do you need to collect?
– Educator impact: What about progress in adult practice?
• Implementation data: What artifacts and evidence will help you examine the extent to which you implemented your plans with fidelity?

51 Step 8 – Take Action
– Implement (DO from the template)

52 In your teams, practice the PLAN and be ready to share out in 30 min:
– A problem statement for this school. – A strategy that you might test in a cycle of improvement for
this problem. – Ideas for collecting evidence both in terms of progress against
the intended outcomes for students (e.g., interim reading assessments if the PoP is related to reading) and in terms of the implementation effort itself (e.g., fidelity to the plan)

53 Plan using the PDSA Cycle Template for CoP Schools

54 District Specific Guidelines
Communities of Practice will be supported and monitored within each Local District (LD). Administrators of Instruction (AIs) will serve as the central point of contact, and will coordinate the work across the CoP facilitators. For each cycle, the LD will submit one cover sheet along with a justification plan and budget adjustment request for each CoP. This LD regional plan will be approved on a rolling basis, and is encouraged to be submitted in advance of the deadlines below.
LD Plan due to FSEP Cycle Completion Deadline
Cycle I November 9 January 8
Cycle II December 11 March 25
Cycle III March 18 May 27

55 Things to Consider when Planning for Regional CoP Institutes
Developing a common understandings and internal agreements about implementation in SY 2015-16 • CoPs
– CoP groupings – CoP members – PDSA template or some other approach? – Timing expectations (cycle 1, cycle 2, cycle 3) – Professional Learning to support CoPs – Budgeting and resources – Expectations of facilitators (e.g., convening CoPs, checking
in, evidence of progress/impact to the district, facilitator check-ins)
• Other elements – Updating school plans – Implementing plans – Engaging School Site Councils

56 Whole Group Share Out (Just the AIs)
How will your Local District roll out the work?

57 Closing and Reflection

58
Thank you!
See you at your
CoP Institute!