
Communicator Benchmark - H1 2014
30
BENCHMARK REPORT H1 2014 HOW DO YOU BRUSH UP?
-
Upload
communicator -
Category
Documents
-
view
217 -
download
0
description
This benchmark report collates results from email marketing campaigns sent from Communicator between January - June 2014. How do you brush up against others in your industry?
Transcript of Communicator Benchmark - H1 2014
BENCHMARKREPORT H1 2014
HOW DO YOUBRUSH UP?

WHY BENCHMARK? ........................................5
WHAT’S NEW? ................................................7
EMAIL MARKETING TRENDS ............................8
ANALYSIS OF RESULTS ...................................10
THE RESULTS..................................................14
RESULTS BY SECTOR ......................................26
BUSINESS SERVICES.......................................................28
CHARITIES ........................................................................30
NOT FOR PROFIT ..............................................................32
COMMUNICATIONS, MEDIA & MARKETING .................34
CONSUMER & RETAIL .....................................................36
EDUCATION & TRAINING ................................................38
UTILITIES ...........................................................................40
FINANCIAL SERVICES ......................................................42
PUBLIC SECTOR ...............................................................44
MANUFACTURING ...........................................................46
TRAVEL & TOURISM ........................................................48
RETAIL CONVERSIONS ....................................50
MAILING LIST GROWTH ..................................52
ENGAGEMENT .................................................54
SUMMARY & FURTHER READING .....................56
CONTENTS

It’s that time again! We’ve been busy number crunching over the last few weeks to find out what’s been happening in the world of
email. This report, published every six months, details all learnings from the channel in Half 1 2014. We send billions of emails each
year and use our wealth of data to confirm trends and look to make future predictions off the back of them.
We hope you find the report informative.
WHY BENCHMARK?KEEPING ON TOP OF THE GAME
After you’ve done all the hard work planning and implementing your marketing communications, your time would be unjustified unless you took some time to assess how successful each campaign has
been. Happily, when it comes to reporting and analysing, email is a channel that can offer you a wealth of information.
It’s great to compare the results of your own communications on a campaign to campaign basis, but when planning more strategically,
it’s vital that you compare yourself against your competitors.
That’s why we publish the Communicator Email Benchmarking Report every six months, breaking down key metrics per sector. Comparing directly against your competitors will tell you one of
two things; your results are either better than you imagined or not as good as you thought. The latter’s not necessarily a bad thing
though; it means there’s plenty of opportunity to boost your results further. If that’s the case, it’s time you booked in some time with
your Account Manager; it’s what they’re there for!
5

SHARE THIS GUIDE :
7
WHAT’S NEW?WE’VE MADE A FEW IMPROVEMENTS SINCE LAST TIMEMuch like you when planning your email campaigns, we’re not ones to stand still. We’ve made a few changes since last time to help you get the information you need.
OUR DELIVERY SECTION NOW INCLUDES INBOX RATES
Previously, we’ve benchmarked delivery on the percentage of emails sent from Communicator that’ve either bounced or not bounced. Although that rate makes a good comparison, it doesn’t necessarily mean an email makes it as far as a recipient’s inbox. That’s why we’ve decided to include the inbox rate as a comparison this time too.
Check out the stats for yourself in the deliverability section on page 16.
INTRODUCING RANGE ALONGSIDE AVERAGE
Again, up until now, we’ve benchmarked on average opens, clicks, bounces, etc. Averages are a good place to start, but if you know anything about statistics, you’ll understand that an average only tells part of the story.
For that reason, we’ve put our number crunching caps on and introduced ranges and distributions into our methodology, providing you with a more realistic benchmark to use.
Check out the stats yourself in the results section on page 14.
SECTOR SHAKEUP
Due to client demand, we’ve broken down our usual ‘Charities, Trade Unions and Bodies’ sector into two different categories: ‘Charities’ and ‘Not for Profit’. Clients in these sectors can now compare their results more accurately against their competitors.
Charities and Not for Profit sections can be found in the results section on pages 30 and 32.

SHARE THIS GUIDE :
9
EMAILMARKETING TRENDS
WHAT YOU MIGHT HAVE MISSED
THE LESSONEMAIL CLIENT CHANGESALL EYES ON GMAIL
Around the same time we published our last benchmarking report, Google was rolling out a host of innovations to its popular mail client, Gmail. Separating ‘promotional’ emails from others, the new tabular layout has caused quite a stir in the email industry.
In hindsight, the new display doesn’t appear to have affected open rates much. The latest update, however, is still in beta and could have a significant impact once rolled out – one that’ll likely favour the early adopters and damage those lagging behind.
So stay on top of the game and learn how to deal with the new, more visual, Gmail inbox by reading our blog before it’s a little too late.
Still confused? Pick up the phone to your Account Manager and they’ll talk you through the change.
A ROUND UP OF EMAIL MARKETING NEWS FROM THE LAST FEW MONTHS
Out of all the digital channels, email is sometimes mistaken as one of the slower-paced in terms of change and innovation. Say what you will about the pace, but if you haven’t been keeping up with changes in the email world over the last few months, there are some things
you need to know.
Read our guide on what’s to come in the EU Data Reform so you’re aware of the changes. Update your sign up process, terms and conditions and privacy policies in line with the reform sooner, rather than later.
> check out our guide on this
Make sure you know how to make the most of Gmail’s latest change. Hint: it’s just a piece of code!
> read the litmus blog on this
1
2
CHANGES TO EU DATA PROTECTION REGULATIONSACT NOW OR YOUR ENTIRE DATABASE COULD BE USELESS IN 24 MONTHS
In March of this year, the European Commission announced there is to be a major overhaul of data protection regulations in the EU over the next 12-24 months.
That might seem like a way off but, given the changes in question, it’s better to get yourself accustomed with them sooner rather than later.
Ignoring this altogether doesn’t seem to be an option; the Information Commissioner’s Office has already advised it will introduce “mandatory fines”, potentially as high as€100 million, when the switchover happens.
WHAT YOU NEED TO KNOW
The changes are based around data collection, storage and, importantly, consent, which has huge implications on the email marketing world. We have a guide to what’s coming which details all of the key things you need to know, but in a nutshell, you need to start asking for explicit permission for things you may currently take for granted like;
• when adding customers to mailing lists and sending them any form of direct marketing
• when using your customers’ personal, behavioural, purchase and preference data to tailor the website or send them personalised and targeted emails
Updating your sign up process and privacy policies now and engaging your recipients for explicit consent will mean you won’t be at risk of non-compliance when the changes come into effect.
Read our guide to what’s coming for more information, or contact your Account Manager.
SHARE THIS GUIDE :

SHARE THIS GUIDE :
11
AUTOMATION REIGNS SUPREMEIT’S OFFICIAL: AUTOMATED CAMPAIGNS HAVE A GREATER IMPACT THAN ONE OFF CAMPAIGNS
It’s often considered that automated campaigns perform better than one off campaigns. They’re the ones that are either driven off the back of a consumer’s action (signing up or purchasing something) or are highly targeted through data-driven personalisation. When pulling this half’s stats, we thought we’d test this theory – just to make sure.
To do this, we’ve broken down the stats for unique opens and clicks by separating all automated and one off campaigns sent from Communicator. You can see for yourself in our results section (on page 22), but to save you the time, the results do confirm our suspicions: automated campaigns are far more likely to deliver a greater impact than one off campaigns.
WHAT DOES THIS MEAN FOR ME?
Quite simply, if you haven’t yet developed any automated campaigns, you should be (we’re not just talking about a simple welcome campaign). And if you have, you should be optimising them.
Automated campaigns are far more likely to give you a greater return than those arranged on an ad-hoc basis. Although more successful on the whole, we did actually find a huge range of results for automated campaigns, meaning there’s room for improvement for many.
Although clearly successful, marketers have a tendency to forget about the automated campaigns once they’re up and running. Just because you’re getting great results from them, it doesn’t mean you’ve got it right first time. So make sure you revisit your automated and triggered emails every now and then to test and optimise, getting you the best possible return on your investment.
The best thing is you can actually save your company a lot of time and money by automating your emails. If you want to know more about your options for automation, speak with your Account Manager.
ANALYSIS OF RESULTSWHAT WE’VE FOUND AND WHAT IT MEANS FOR YOU
OPENS UP, CLICKS DOWNEASIER TO EXPOSE, INCREASINGLY DIFFICULT TO ENGAGE
Our latest figures show that average unique opens have increased in all but two sectors over the last twelve months. The same can’t be said for clicks though; unique clicks have fallen in all but three sectors. Strip out any potential benefit from the increase in open rates, then look at the click to open rates and the results look even less encouraging having fallen in all of the sectors that we benchmark.
WHY IS THIS HAPPENING?
With open rates improving, there’s little doubt email is becoming a more important channel in the lives of consumers. The continuous growth of smartphones and tablet computers makes email much more accessible to consumers than it once was.
The key challenge for email marketers appears to be engagement, however. With clicks falling for all sectors, the focus should be on creating engaging content that consumers want to interact with.
WHAT YOU CAN DO ABOUT IT
Happily, there are a number of ways you can go about increasing engagement. If you’re not already an advocate of optimisation, testing your emails with multi-variant splits is a great place to start. If you’re willing to be a little cleverer in your quest for engagement, there are plenty of things you can do to improve it.
RAMPING UP YOUR PERSONALISATION
We’ve said it before and we’ll say it again; personalisation is important. Going beyond simple first name terms, marketers are getting better at making the most of the consumer data they have, using it to create personal, engaging emails.
It’s not all about the data you have in Communicator or your CRM either. You can now use real-time data techniques, like device used to open and location of the open, to deliver some truly innovative campaigns. We’ve got some great information on using real-time data to give you some ideas. Speak to your Account Manager if you’re interested.
ADDING SOME CREATIVE FLAIR
More and more opens are coming from email clients and devices which accept CSS3 and HTML5. That means marketers can let their designers add more creative flair to emails than they’ve been able to before.
You can also use HTML5 to embed videos directly into an email, including features like auto-play to get more and more recipients engaging with your content.
INTRODUCE CONTENT MARKETING
Finally, you could try taking a different approach to the way you craft your content in order to engage your customers, telling them more of what they want to hear, not what you want to tell them. Content marketing has become a popular technique in social media but is still relatively unused in the email channel. Introducing such techniques alongside sales-orientated campaigns may well have a greater impact on engagement.
SHARE THIS GUIDE :
13
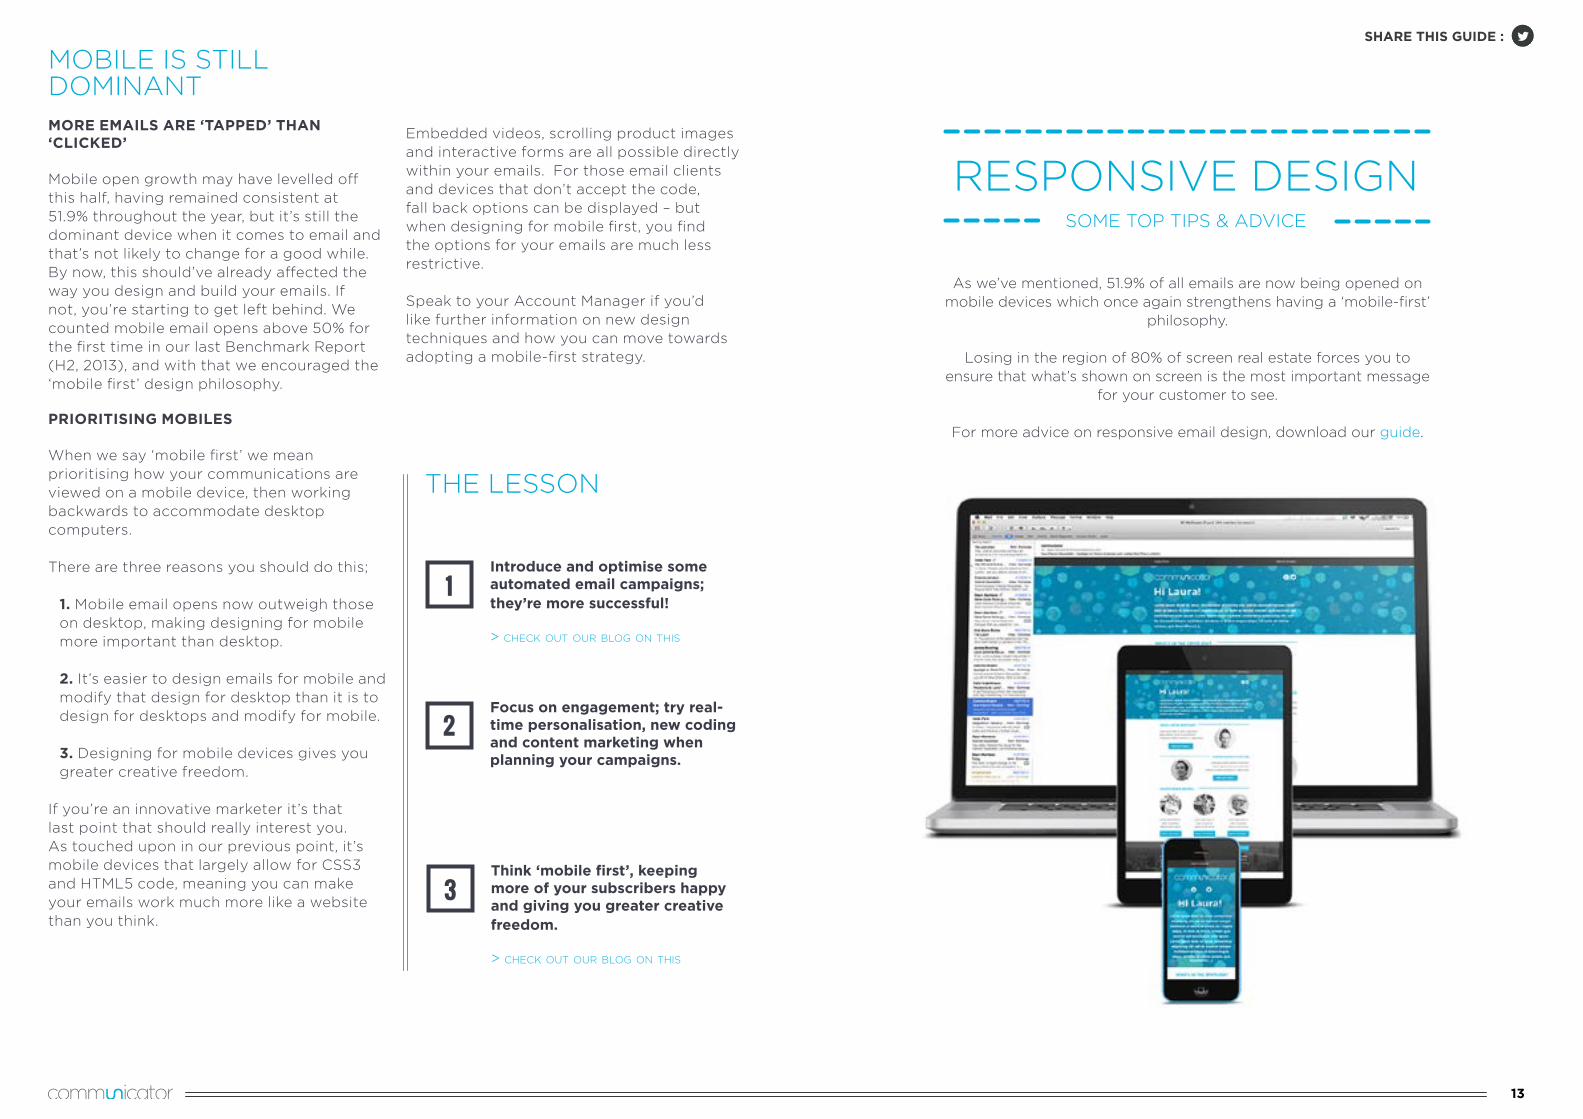
MOBILE IS STILL DOMINANTMORE EMAILS ARE ‘TAPPED’ THAN ‘CLICKED’
Mobile open growth may have levelled off this half, having remained consistent at 51.9% throughout the year, but it’s still the dominant device when it comes to email and that’s not likely to change for a good while.By now, this should’ve already affected the way you design and build your emails. If not, you’re starting to get left behind. We counted mobile email opens above 50% for the first time in our last Benchmark Report (H2, 2013), and with that we encouraged the ‘mobile first’ design philosophy.
PRIORITISING MOBILES
When we say ‘mobile first’ we mean prioritising how your communications are viewed on a mobile device, then working backwards to accommodate desktop computers.
There are three reasons you should do this;
1. Mobile email opens now outweigh those on desktop, making designing for mobile more important than desktop.
2. It’s easier to design emails for mobile and modify that design for desktop than it is to design for desktops and modify for mobile.
3. Designing for mobile devices gives you greater creative freedom.
If you’re an innovative marketer it’s that last point that should really interest you. As touched upon in our previous point, it’s mobile devices that largely allow for CSS3 and HTML5 code, meaning you can make your emails work much more like a website than you think.
Embedded videos, scrolling product images and interactive forms are all possible directly within your emails. For those email clients and devices that don’t accept the code, fall back options can be displayed – but when designing for mobile first, you find the options for your emails are much less restrictive.
Speak to your Account Manager if you’d like further information on new design techniques and how you can move towards adopting a mobile-first strategy.
THE LESSON
Introduce and optimise some automated email campaigns; they’re more successful!
> check out our blog on this
Think ‘mobile first’, keeping more of your subscribers happy and giving you greater creative freedom.
> check out our blog on this
Focus on engagement; try real-time personalisation, new coding and content marketing when planning your campaigns.
1
3
2
RESPONSIVE DESIGNSOME TOP TIPS & ADVICE
As we’ve mentioned, 51.9% of all emails are now being opened on mobile devices which once again strengthens having a ‘mobile-first’
philosophy.
Losing in the region of 80% of screen real estate forces you to ensure that what’s shown on screen is the most important message
for your customer to see.
For more advice on responsive email design, download our guide.

SHARE THIS GUIDE :
15
THE RESULTSHERE COME THE NUMBERS
15
Get ready for a number overload! The results are in and detailed in this next section. As ever, we cover delivery stats, opens and clicks across the
board, then break them down by sector.
SHARE THIS GUIDE :

SHARE THIS GUIDE :
17
.9
2013HALF 1
99%
2013HALF 2
2%
2014HALF 1
1% 98% 0.9%
99.1%
.9
2013HALF 1
99%
2013HALF 2
2%
2014HALF 1
1% 98% 0.9%
99.1%
DELIVERABILITYDO YOU KNOW WHERE YOUR EMAILS GO?It’s simple but true; your emails are useless unless they hit your subscribers’ inboxes. There’s a difference between ‘delivered’ and actually reaching an inbox too, that’s why we’ve introduced the inbox placement rate as well as the delivery averages this year.
PERCENTAGE OF DELIVERED EMAILSCommunicator takes delivery seriously and we’ve introduced a series of innovations over recent years to help your emails reach your recipients.
SUMMARY OF RESULTSGreat news! More and more of the emails sent from Communicator are reaching their intended recipients without anything getting in the way, meaning our clients are receiving a greater return on their investment. 92.2% of all emails are reaching the inbox; that’s 12% better than the industry average.
LOOKING TO IMPROVE?If you’d like to push your own delivery rates even further, there are things you can do to help. Data management can have a serious impact on your delivery rates. This isn’t something within our control but we can offer you advice and a helping hand. We’d recommend attempting to re-engage inactive subscribers with your emails and then, depending on the length of inactivity, either reduce your send volume or remove them altogether.
THE LESSON
If you’re looking to improve your inbox rates, get serious with data management.
KEY
UNDELIVERED
DELIVERED
INBOX PLACEMENT RATE HALF 1 2014
COMMUNCIATOR - 92.2%
OTHERS - 80.0%
INBOX PLACEMENT RATE
HALF 1 2014
COMMUNICATOR - 92.2%
INDUSTRY - 80%
> Read our blog on delivery vs inbox placement

SHARE THIS GUIDE :
19
MOST POPULAR
MAIL CLIENT
28.1%
2%
1.6%
17.3%
14.9%
APPLE iPHONE
OUTLOOK
GMAIL
APPLE iPAD
UNKNOWN*8.6%
5.8%
6.3%
5.8%
4.1%
2.4%
2%
HOTMAIL**
ANDROID
YAHOO!
OUTLOOK
APPLE MAIL
WINDOWS
OTHER***
GENERIC
.COM
LIVE MAIL
EMAIL CLIENT SUMMARYWHERE ARE YOUR EMAILS BEING DELIVERED TO?Who designs your emails? Make sure they see the next two pages. It’s important you make sure your emails are seen as intended on the devices and email clients they’re being viewed on. This doesn’t mean looking solely at what you view them on, like Outlook, Gmail, desktop etc.
That’s what our content checker’s there for; within seconds you can view how your email will look in all popular email clients across a host of devices.
To make it a little easier to plan and design your emails, this year we’ve also included a breakdown of mobiles versus tablet devices.
SUMMARY OF RESULTSMobile devices are still dominant; the biggest mover is the iPad, having jumped almost 2% over the last six months. iPhone remains the same but Android devices have actually dropped around 1%.
In total, mobile devices are registering at 51.8% of the total market share for email opens, up from 46.3% during the same period of 2013. Of all mobile devices, 59.4% come under mobile phones and 39.3% of these are tablet devices.
THE LESSON
Make sure you’re designing for mobile – it’s now more important than doing so for desktops.
*Unknown refers to online webmail clients, such as those used inside large companies.
**Although Hotmail is now outlook.com, @hotmail.com is still a valid address and is in use.
***Instead of including every device and client that has a small percentage of opens individually, these have been grouped together.
SHARE THIS GUIDE :
21
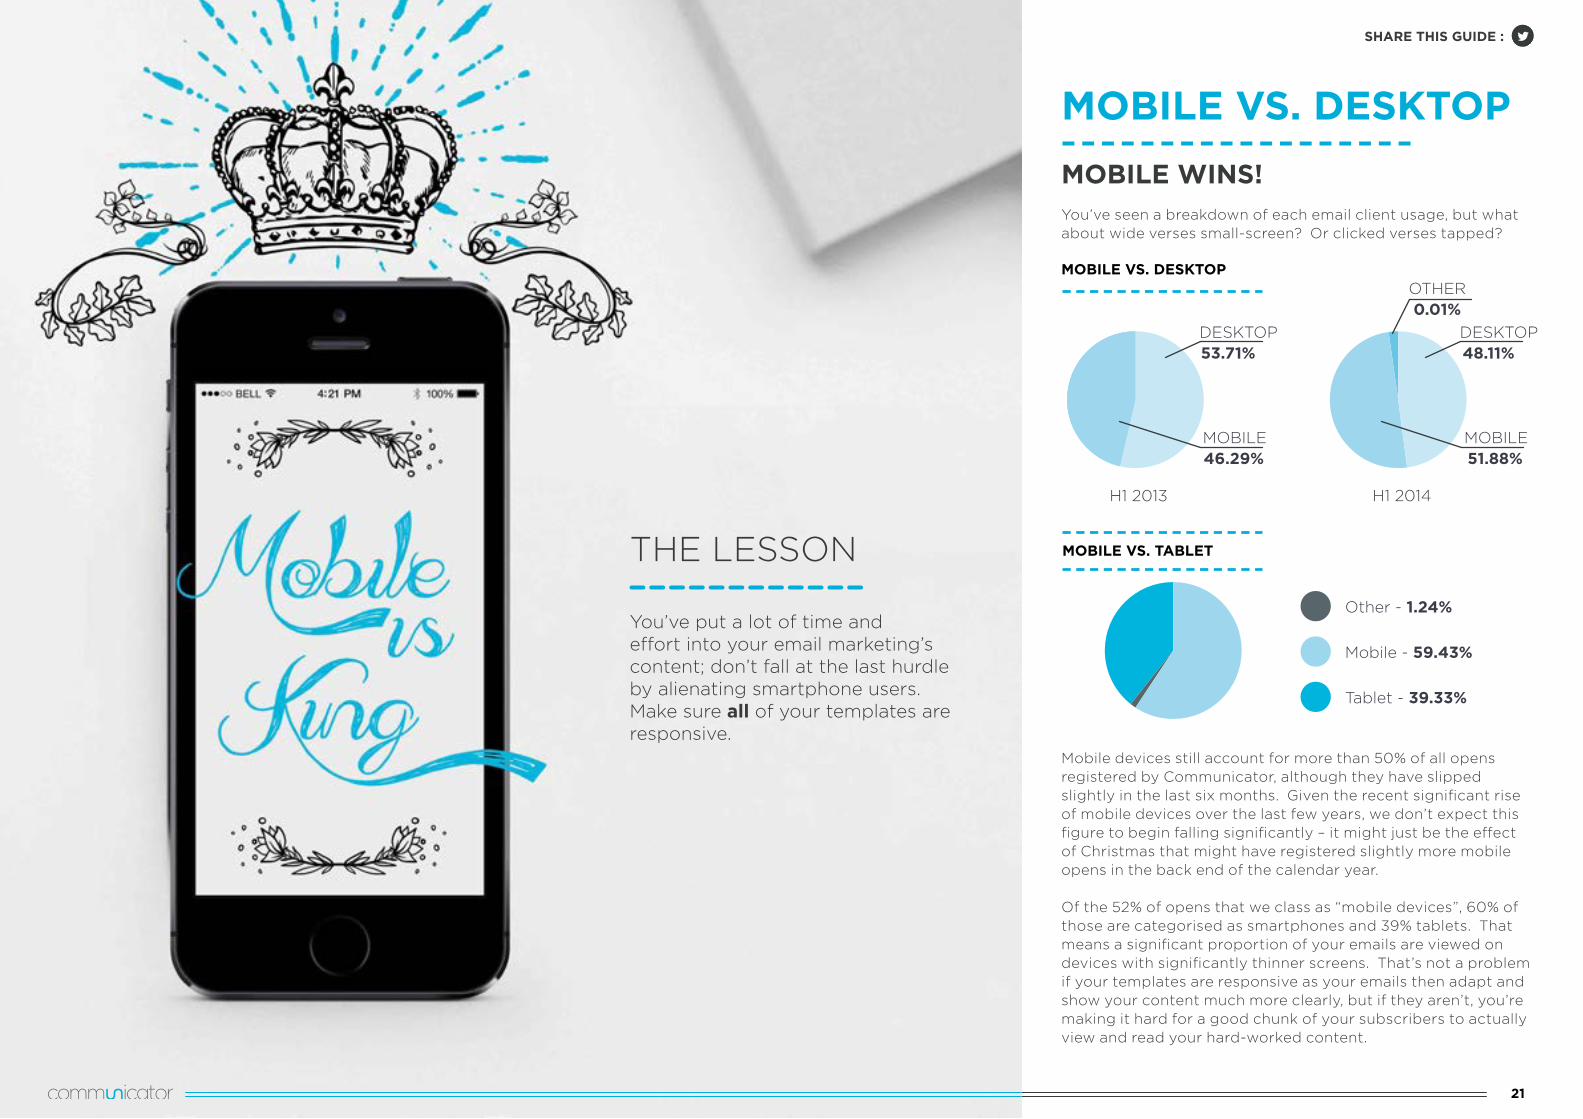
MOBILE VS. DESKTOP
MOBILE WINS!You’ve seen a breakdown of each email client usage, but what about wide verses small-screen? Or clicked verses tapped?
MOBILE VS. DESKTOP
Mobile devices still account for more than 50% of all opens registered by Communicator, although they have slipped slightly in the last six months. Given the recent significant rise of mobile devices over the last few years, we don’t expect this figure to begin falling significantly – it might just be the effect of Christmas that might have registered slightly more mobile opens in the back end of the calendar year.
Of the 52% of opens that we class as “mobile devices”, 60% of those are categorised as smartphones and 39% tablets. That means a significant proportion of your emails are viewed on devices with significantly thinner screens. That’s not a problem if your templates are responsive as your emails then adapt and show your content much more clearly, but if they aren’t, you’re making it hard for a good chunk of your subscribers to actually view and read your hard-worked content.
2013 H1 2014 H1
Other - 1.24%
Mobile - 59.43%
Tablet - 39.33%
2013 H1 2014 H12013 H1 2014 H1
H1 2013
DESKTOP DESKTOP
OTHER
MOBILE MOBILE
53.71% 48.11%
0.01%
46.29% 51.88%
H1 2014
MOBILE VS. TABLETTHE LESSON
You’ve put a lot of time and effort into your email marketing’s content; don’t fall at the last hurdle by alienating smartphone users. Make sure all of your templates are responsive.

SHARE THIS GUIDE :
23
SHARE THIS GUIDE :
23
SUMMARY OF OPENS & CLICKS RESULTS ACROSS THE BOARDWe’ve taken our statistics a little further this time around. It’s been discussed for some time now about how automated campaigns give a greater return, so we thought we’d set out to test that theory.
To achieve this, we’ve broken down our stats by separating ‘one off’ campaigns and ‘automated’ campaigns. But we haven’t stopped there. To improve the accuracy of the results we’re interpreting, we’ve examined the range of results to go alongside our usual benchmark averages.
WHY CONSIDER THE RANGE? It’s important to consider the range of opens and clicks as this shows you the variation of a set of results in comparison to the average.
If most of the results are close together, for example if most open rates are between 10% - 25%, then you can reliably use the average. If the range is larger, with results ranging from 10% - 65%, then clearly just quoting an average as a benchmark would be very misleading.
15-20
5.00
10.00
15.00
20.00
0-5 5-10 10-15
20-25
25-30
30-35
35-40
40-45
45-50
50-55
55-60
60-65
65-70
70-75
75-80
80-85
85-90
KEY
ONE OFF
AUTOMATED
OPEN RATE DISTRIBUTION
% O
F C
AM
PAIG
NS
SE
NT
FR
OM
C
OM
MU
NIC
ATO
ROPEN RATES
CLICK RATE DISTRIBUTION
% O
F C
AM
PAIG
NS
SE
NT
FR
OM
C
OM
MU
NIC
ATO
R
CLICK RATES
15-20
20.00
40.00
60.00
80.00
0-5 5-10 10-15
20-25
25-30
30-35
35-40
40-45
45-50
50-55
55-60
60-65
Average
27.4%Average
44.4%
Average
6.0%Average
11.0%

SHARE THIS GUIDE :
25
SHARE THIS GUIDE :
25
THE LESSON
1. Automation continues to deliver results.
2. Focus should be on subscriber engagement.
The range for one off campaigns is 0% - 10%The range for automated campaigns is 0% - 15%
Opens are on the up yet again. Digging a little deeper, we see average unique open rates for one-off campaigns and automated campaigns as 27.4% and 44.4% respectively – a monumental difference between the two.
For one-off campaigns most open rates are between 10% and 35%, but for automated campaigns open rates range from 15% to a massive 70%.
Perhaps a fairer way to assess the difference might be to recognise that
about 40% of all automated campaigns sent in H1 2014 achieved an open rate of 50% or higher, in comparison only about 10% of one off dispatches achieving the same results.
In other words, if you want to achieve an open rate of 50% or greater, you’re almost 4x as likely to achieve this with an automated campaign.
SUMMARY OF RESULTS – OPENS
Carrying on the theme from opens, we’ve looked at the difference between automated and one off campaigns in terms of clicks too. Similarly, we’ve also provided the range to make sure our conclusion’s more reliable.
As with opens, it’s clear to see that automated campaigns are delivering greater results than one off. 38% of automated campaigns achieved a click rate higher than 10% in comparison to just 17% of one off campaigns.
This shows that due to the nature of automated campaigns where content is highly targeted and personalised for the recipient, engagement with the brand is greater leading to the increase in clicks.
That said, it’s disappointing to see that overall, regardless of the campaign type, clicks are fairly low. Over the last few years, we’ve seen a steady increase in open rates but click rates haven’t followed this trend. But should we assume that a lack of clicks means that
your campaign hasn’t been successful? We’d recommend monitoring web traffic alongside your email metrics to identify any spikes in traffic that could be attributed to your campaign. If your focus is on increasing the number of clicks in an email for clear attribution, attention should be paid to subscriber engagement.
SUMMARY OF RESULTS – CLICKS
THE LESSON
1. Opens continue to rise.
2. Automated campaigns are far more likely to achieve a greater open rate.
The range for one off campaigns is 10% - 35%The range for automated campaigns is 15% - 70%

SHARE THIS GUIDE :
2727
You’ve seen the overall results, but how are you doing against your competitors? The next section breaks down the numbers by sector,
giving you a greater insight on where you stand.
SHARE THIS GUIDE :
RESULTS BY SECTORBREAKING DOWN THE NUMBERS

SHARE THIS GUIDE :
29
RESULTS BY SECTOR SHARE THIS GUIDE :
BUSINESS SERVICESAt almost 6%, the jump in opens for the Business Services sector is the largest across all sectors. Click to open rates have decreased, but an increase in opens means unique click rates (against sent) are actually showing as having increased.
Bounces have reduced over the last six months although they still remain higher than they were at this point twelve months ago. Unsubscribes are relatively encouraging.
BUSINESS SERVICESUNIQUE OPEN RATE UNIQUE CLICK RATE CLICKS TO OPENS CONTENT BOUNCE RATE HARD BOUNCE RATE SOFT BOUNCE RATE TOTAL BOUNCE RATE UNSUBSCRIBE COMPLAINTS
20%
15.9% 2.7%
2.5%
17.2%
12.2%
0.16%
0.19%
0.21%
0.24%
0.9%
1.2%
1.3%
1.7%
0.09%
0.04%
0.04%
0.05%
BUSINESS SERVICESUNIQUE OPEN RATE UNIQUE CLICK RATE CLICKS TO OPENS CONTENT BOUNCE RATE HARD BOUNCE RATE SOFT BOUNCE RATE TOTAL BOUNCE RATE UNSUBSCRIBE COMPLAINTS
20%
15.9% 2.7%
2.5%
17.2%
12.2%
0.16%
0.19%
0.21%
0.24%
0.9%
1.2%
1.3%
1.7%
0.09%
0.04%
0.04%
0.05%
BUSINESS SERVICESUNIQUE OPEN RATE UNIQUE CLICK RATE CLICKS TO OPENS CONTENT BOUNCE RATE HARD BOUNCE RATE SOFT BOUNCE RATE TOTAL BOUNCE RATE UNSUBSCRIBE COMPLAINTS
20%
15.9% 2.7%
2.5%
17.2%
12.2%
0.16%
0.19%
0.21%
0.24%
0.9%
1.2%
1.3%
1.7%
0.09%
0.04%
0.04%
0.05%
BUSINESS SERVICESUNIQUE OPEN RATE UNIQUE CLICK RATE CLICKS TO OPENS CONTENT BOUNCE RATE HARD BOUNCE RATE SOFT BOUNCE RATE TOTAL BOUNCE RATE UNSUBSCRIBE COMPLAINTS
20%
15.9% 2.7%
2.5%
17.2%
12.2%
0.16%
0.19%
0.21%
0.24%
0.9%
1.2%
1.3%
1.7%
0.09%
0.04%
0.04%
0.05%
BUSINESS SERVICESUNIQUE OPEN RATE UNIQUE CLICK RATE CLICKS TO OPENS CONTENT BOUNCE RATE HARD BOUNCE RATE SOFT BOUNCE RATE TOTAL BOUNCE RATE UNSUBSCRIBE COMPLAINTS
20%
15.9% 2.7%
2.5%
17.2%
12.2%
0.16%
0.19%
0.21%
0.24%
0.9%
1.2%
1.3%
1.7%
0.09%
0.04%
0.04%
0.05%
29
KEY
H1 2013
H1 2014
THE LESSONA good period for the Business Services sector but concentrating on increasing engagement to boost click rates should be the main focus over the coming months.

SHARE THIS GUIDE :
31
RESULTS BY SECTOR
CHARITIESWhere we’ve previously grouped Charities, Trade Unions and Bodies as a sector, we’ve now amended this to account for two separate sectors; Charities and Not for Profit. This has made comparing this year’s stats a little difficult.
That said, opens have increased for Charities, much like the rest of our sectors. Clicks are lower than the average and the click to open rate is the second lowest of all sectors at 9.98% – the top performing industries get between 17-20%.
Bounce rates are very encouraging as they are one of the lowest across our sectors, currently 0.65%, but unsubscribes could be lower, currently standing at 27%. The average new sign up rate for this sector over the six month period was around 10%.
THE LESSONBrands should be focusing on using email marketing to engage with their subscribers, helping to improve clicks and keeping unsubscribe rates at a minimum.
CHARITIESUNIQUE OPEN RATE UNIQUE CLICK RATE CLICKS TO OPENS CONTENT BOUNCE RATE HARD BOUNCE RATE SOFT BOUNCE RATE TOTAL BOUNCE RATE UNSUBSCRIBE COMPLAINTS
21.8% 3.3% 15% 0.44% 0.53% 0.44% 1.2% 0.19% 0.06%
0.05%0.27%0.7%0.28%0.25%0.11%10%2.4%24%
CHARITIESUNIQUE OPEN RATE UNIQUE CLICK RATE CLICKS TO OPENS CONTENT BOUNCE RATE HARD BOUNCE RATE SOFT BOUNCE RATE TOTAL BOUNCE RATE UNSUBSCRIBE COMPLAINTS
21.8% 3.3% 15% 0.44% 0.53% 0.44% 1.2% 0.19% 0.06%
0.05%0.27%0.7%0.28%0.25%0.11%10%2.4%24%
CHARITIESUNIQUE OPEN RATE UNIQUE CLICK RATE CLICKS TO OPENS CONTENT BOUNCE RATE HARD BOUNCE RATE SOFT BOUNCE RATE TOTAL BOUNCE RATE UNSUBSCRIBE COMPLAINTS
21.8% 3.3% 15% 0.44% 0.53% 0.44% 1.2% 0.19% 0.06%
0.05%0.27%0.7%0.28%0.25%0.11%10%2.4%24%
CHARITIESUNIQUE OPEN RATE UNIQUE CLICK RATE CLICKS TO OPENS CONTENT BOUNCE RATE HARD BOUNCE RATE SOFT BOUNCE RATE TOTAL BOUNCE RATE UNSUBSCRIBE COMPLAINTS
21.8% 3.3% 15% 0.44% 0.53% 0.44% 1.2% 0.19% 0.06%
0.05%0.27%0.7%0.28%0.25%0.11%10%2.4%24%
CHARITIESUNIQUE OPEN RATE UNIQUE CLICK RATE CLICKS TO OPENS CONTENT BOUNCE RATE HARD BOUNCE RATE SOFT BOUNCE RATE TOTAL BOUNCE RATE UNSUBSCRIBE COMPLAINTS
21.8% 3.3% 15% 0.44% 0.53% 0.44% 1.2% 0.19% 0.06%
0.05%0.27%0.7%0.28%0.25%0.11%10%2.4%24%
31
*This figure is the combined statistic that we published within our H1 2013 Benchmark report under the heading of Charities, Trade Unions & Bodies.
KEY
H1 2013*
H1 2014
SHARE THIS GUIDE :

SHARE THIS GUIDE :
33
RESULTS BY SECTOR SHARE THIS GUIDE :
NOT FOR PROFITAmongst Not for Profits, opens are slightly below the average, with clicks at 3.22%. Bounce rates are relatively high in comparison with most industries, which have seen rates decline over the past two years or so. Unsubscribes are relatively low in comparison to our other sectors.
The average new sign up rate for this sector during H1 was around 10%.
THE LESSONA focus on delivery and inbox placement, taking greater control over the management of data, should help improve results. Monitor inbox placement rates as a good measure for this.
NFPUNIQUE OPEN RATE UNIQUE CLICK RATE CLICKS TO OPENS CONTENT BOUNCE RATE HARD BOUNCE RATE SOFT BOUNCE RATE TOTAL BOUNCE RATE UNSUBSCRIBE COMPLAINTS
22.6%
21.8%
3.2%
3.3%
14.3%
15% 0.44%
0.26%
0.53%
0.34%
0.44%
0.36% 1%
1.2% 0.19%
0.14%
0.06%
0.02%
NFPUNIQUE OPEN RATE UNIQUE CLICK RATE CLICKS TO OPENS CONTENT BOUNCE RATE HARD BOUNCE RATE SOFT BOUNCE RATE TOTAL BOUNCE RATE UNSUBSCRIBE COMPLAINTS
22.6%
21.8%
3.2%
3.3%
14.3%
15% 0.44%
0.26%
0.53%
0.34%
0.44%
0.36% 1%
1.2% 0.19%
0.14%
0.06%
0.02%
NFPUNIQUE OPEN RATE UNIQUE CLICK RATE CLICKS TO OPENS CONTENT BOUNCE RATE HARD BOUNCE RATE SOFT BOUNCE RATE TOTAL BOUNCE RATE UNSUBSCRIBE COMPLAINTS
22.6%
21.8%
3.2%
3.3%
14.3%
15% 0.44%
0.26%
0.53%
0.34%
0.44%
0.36% 1%
1.2% 0.19%
0.14%
0.06%
0.02%
NFPUNIQUE OPEN RATE UNIQUE CLICK RATE CLICKS TO OPENS CONTENT BOUNCE RATE HARD BOUNCE RATE SOFT BOUNCE RATE TOTAL BOUNCE RATE UNSUBSCRIBE COMPLAINTS
22.6%
21.8%
3.2%
3.3%
14.3%
15% 0.44%
0.26%
0.53%
0.34%
0.44%
0.36% 1%
1.2% 0.19%
0.14%
0.06%
0.02%
NFPUNIQUE OPEN RATE UNIQUE CLICK RATE CLICKS TO OPENS CONTENT BOUNCE RATE HARD BOUNCE RATE SOFT BOUNCE RATE TOTAL BOUNCE RATE UNSUBSCRIBE COMPLAINTS
22.6%
21.8%
3.2%
3.3%
14.3%
15% 0.44%
0.26%
0.53%
0.34%
0.44%
0.36% 1%
1.2% 0.19%
0.14%
0.06%
0.02%
33
*This figure is the combined statistic that we published within our H1 2013 Benchmark report under the heading of Charities, Trade Unions & Bodies.
KEY
H1 2013*
H1 2014

SHARE THIS GUIDE :
35
RESULTS BY SECTOR SHARE THIS GUIDE :
COMMUNICATIONS, MEDIA& MARKETINGMuch like the other industries, open rates have increased for Communications, Media and Marketing during this period. However, this still remains one of the lowest performing stats of all the sectors. Both click to open rates and unique click rates have fallen, having done so consistently for the last few years. As well as a reduction in bounces, unsubscribes have decreased and are now at their most encouraging rate yet for this sector since we started benchmarking.
The average new sign-up rate for this sector over H1 was 12.6%.
THE LESSONHaving one of the lowest open rates, a focus for this sector should be getting more subscribers to open emails. Split testing subject lines every time a campaign is sent will help here, as well as remailing active non-openers.
COMMUNICATIONS, MEDIA & MARKETINGUNIQUE OPEN RATE UNIQUE CLICK RATE CLICKS TO OPENS CONTENT BOUNCE RATE HARD BOUNCE RATE SOFT BOUNCE RATE TOTAL BOUNCE RATE UNSUBSCRIBE COMPLAINTS
0%
0.03%0.19%
0.01%
2.4%
1.6%
1.6%
0.6%
0.40%
0.34%
0.44%
0.71%
14.7%
13.8%
2.7%
2.7%
18.4%
19.9%
COMMUNICATIONS, MEDIA & MARKETINGUNIQUE OPEN RATE UNIQUE CLICK RATE CLICKS TO OPENS CONTENT BOUNCE RATE HARD BOUNCE RATE SOFT BOUNCE RATE TOTAL BOUNCE RATE UNSUBSCRIBE COMPLAINTS
0%
0.03%0.19%
0.01%
2.4%
1.6%
1.6%
0.6%
0.40%
0.34%
0.44%
0.71%
14.7%
13.8%
2.7%
2.7%
18.4%
19.9%
COMMUNICATIONS, MEDIA & MARKETINGUNIQUE OPEN RATE UNIQUE CLICK RATE CLICKS TO OPENS CONTENT BOUNCE RATE HARD BOUNCE RATE SOFT BOUNCE RATE TOTAL BOUNCE RATE UNSUBSCRIBE COMPLAINTS
0%
0.03%0.19%
0.01%
2.4%
1.6%
1.6%
0.6%
0.40%
0.34%
0.44%
0.71%
14.7%
13.8%
2.7%
2.7%
18.4%
19.9%
COMMUNICATIONS, MEDIA & MARKETINGUNIQUE OPEN RATE UNIQUE CLICK RATE CLICKS TO OPENS CONTENT BOUNCE RATE HARD BOUNCE RATE SOFT BOUNCE RATE TOTAL BOUNCE RATE UNSUBSCRIBE COMPLAINTS
0%
0.03%0.19%
0.01%
2.4%
1.6%
1.6%
0.6%
0.40%
0.34%
0.44%
0.71%
14.7%
13.8%
2.7%
2.7%
18.4%
19.9%
COMMUNICATIONS, MEDIA & MARKETINGUNIQUE OPEN RATE UNIQUE CLICK RATE CLICKS TO OPENS CONTENT BOUNCE RATE HARD BOUNCE RATE SOFT BOUNCE RATE TOTAL BOUNCE RATE UNSUBSCRIBE COMPLAINTS
0%
0.03%0.19%
0.01%
2.4%
1.6%
1.6%
0.6%
0.40%
0.34%
0.44%
0.71%
14.7%
13.8%
2.7%
2.7%
18.4%
19.9%
35
KEY
H1 2013
H1 2014

SHARE THIS GUIDE :
37
RESULTS BY SECTOR SHARE THIS GUIDE :
CONSUMER & RETAILAlthough only a slight decrease, Consumer and Retail is the only sector to have seen a decline in open rates. Click rates have taken a sharp decline too, which is consistent with the rest of the industry. Bounce rates have almost halved this period and unsubscribes have remained the same. The average new sign up rate for this sector over the six month period was 11.7%.
THE LESSONOpens have fallen and clicks have taken a sharp decline – if in this sector, focus on subscriber engagement and try out some new techniques to get your customers interested in your communications again.
CONSUMER & RETAILUNIQUE OPEN RATE UNIQUE CLICK RATE CLICKS TO OPENS CONTENT BOUNCE RATE HARD BOUNCE RATE SOFT BOUNCE RATE TOTAL BOUNCE RATE UNSUBSCRIBE COMPLAINTS
23.2%
22.3% 4%
3.5%
18%
15.1%
0.15%
0.13% 0.13%
0.18% 0.7%
0.3%
1.1%
0.5%
0.13%
0.14% 0.06%
0.04%
CONSUMER & RETAILUNIQUE OPEN RATE UNIQUE CLICK RATE CLICKS TO OPENS CONTENT BOUNCE RATE HARD BOUNCE RATE SOFT BOUNCE RATE TOTAL BOUNCE RATE UNSUBSCRIBE COMPLAINTS
23.2%
22.3% 4%
3.5%
18%
15.1%
0.15%
0.13% 0.13%
0.18% 0.7%
0.3%
1.1%
0.5%
0.13%
0.14% 0.06%
0.04%
CONSUMER & RETAILUNIQUE OPEN RATE UNIQUE CLICK RATE CLICKS TO OPENS CONTENT BOUNCE RATE HARD BOUNCE RATE SOFT BOUNCE RATE TOTAL BOUNCE RATE UNSUBSCRIBE COMPLAINTS
23.2%
22.3% 4%
3.5%
18%
15.1%
0.15%
0.13% 0.13%
0.18% 0.7%
0.3%
1.1%
0.5%
0.13%
0.14% 0.06%
0.04%
CONSUMER & RETAILUNIQUE OPEN RATE UNIQUE CLICK RATE CLICKS TO OPENS CONTENT BOUNCE RATE HARD BOUNCE RATE SOFT BOUNCE RATE TOTAL BOUNCE RATE UNSUBSCRIBE COMPLAINTS
23.2%
22.3% 4%
3.5%
18%
15.1%
0.15%
0.13% 0.13%
0.18% 0.7%
0.3%
1.1%
0.5%
0.13%
0.14% 0.06%
0.04%
CONSUMER & RETAILUNIQUE OPEN RATE UNIQUE CLICK RATE CLICKS TO OPENS CONTENT BOUNCE RATE HARD BOUNCE RATE SOFT BOUNCE RATE TOTAL BOUNCE RATE UNSUBSCRIBE COMPLAINTS
23.2%
22.3% 4%
3.5%
18%
15.1%
0.15%
0.13% 0.13%
0.18% 0.7%
0.3%
1.1%
0.5%
0.13%
0.14% 0.06%
0.04%
37
KEY
H1 2013
H1 2014

SHARE THIS GUIDE :
39
RESULTS BY SECTOR SHARE THIS GUIDE :
EDUCATION & TRAININGOpens have taken an encouraging jump in the right direction but are still the second lowest performing against other sectors. Click to open rates have decreased, much like in other industries, but the boost in open rates means unique click rates (against sent) have increased.
Bounce rates have reduced and unsubscribe rates have remained consistent.
THE LESSONMuch like many other industries, a focus on subscriber engagement for Education and Training would give the greatest return on your efforts, helping to improve clicks as well as opens in the longer term.
EDUCATION & TRAININGUNIQUE OPEN RATE UNIQUE CLICK RATE CLICKS TO OPENS CONTENT BOUNCE RATE HARD BOUNCE RATE SOFT BOUNCE RATE TOTAL BOUNCE RATE UNSUBSCRIBE COMPLAINTS
0.20%
0.07%0.22%
0.20%
0.5%
0.5%
0.2%
0.1%
0.24%
0.23%
0.04%
0.08%
14.8%
13.2%
2.7%
2.6%
18.1%
19.4%
EDUCATION & TRAININGUNIQUE OPEN RATE UNIQUE CLICK RATE CLICKS TO OPENS CONTENT BOUNCE RATE HARD BOUNCE RATE SOFT BOUNCE RATE TOTAL BOUNCE RATE UNSUBSCRIBE COMPLAINTS
0.20%
0.07%0.22%
0.20%
0.5%
0.5%
0.2%
0.1%
0.24%
0.23%
0.04%
0.08%
14.8%
13.2%
2.7%
2.6%
18.1%
19.4%
EDUCATION & TRAININGUNIQUE OPEN RATE UNIQUE CLICK RATE CLICKS TO OPENS CONTENT BOUNCE RATE HARD BOUNCE RATE SOFT BOUNCE RATE TOTAL BOUNCE RATE UNSUBSCRIBE COMPLAINTS
0.20%
0.07%0.22%
0.20%
0.5%
0.5%
0.2%
0.1%
0.24%
0.23%
0.04%
0.08%
14.8%
13.2%
2.7%
2.6%
18.1%
19.4%
EDUCATION & TRAININGUNIQUE OPEN RATE UNIQUE CLICK RATE CLICKS TO OPENS CONTENT BOUNCE RATE HARD BOUNCE RATE SOFT BOUNCE RATE TOTAL BOUNCE RATE UNSUBSCRIBE COMPLAINTS
0.20%
0.07%0.22%
0.20%
0.5%
0.5%
0.2%
0.1%
0.24%
0.23%
0.04%
0.08%
14.8%
13.2%
2.7%
2.6%
18.1%
19.4%
EDUCATION & TRAININGUNIQUE OPEN RATE UNIQUE CLICK RATE CLICKS TO OPENS CONTENT BOUNCE RATE HARD BOUNCE RATE SOFT BOUNCE RATE TOTAL BOUNCE RATE UNSUBSCRIBE COMPLAINTS
0.20%
0.07%0.22%
0.20%
0.5%
0.5%
0.2%
0.1%
0.24%
0.23%
0.04%
0.08%
14.8%
13.2%
2.7%
2.6%
18.1%
19.4%
39
KEY
H1 2013
H1 2014

SHARE THIS GUIDE :
41
RESULTS BY SECTOR SHARE THIS GUIDE :
THE LESSONMuch like many other industries, a focus on subscriber engagement for Education and Training would give the greatest return on your efforts, helping to improve clicks as well as opens in the longer term.
UTILITIESOpen rates in the Utilities sector have increased over the last six months but are lower than they have been historically. Click rates have taken a sharp fall to 9.32% where historically they’ve been as high as 15.89%. Our trends section on page 11 discusses why click rates are falling and what to do about this.
Bounce rates have reduced significantly and unsubscribe rates are encouraging, at 0.07%.
UTILITIESUNIQUE OPEN RATE UNIQUE CLICK RATE CLICKS TO OPENS CONTENT BOUNCE RATE HARD BOUNCE RATE SOFT BOUNCE RATE TOTAL BOUNCE RATE UNSUBSCRIBE COMPLAINTS
45.9%
48% 12.7%
9.3% 20.3%
26.5% 0.14%
0.08%
0.74%
0.31% 0.4%
0.4% 1.3%
0.8%
0.14%
0.07%
0.06%
0.04%
UTILITIESUNIQUE OPEN RATE UNIQUE CLICK RATE CLICKS TO OPENS CONTENT BOUNCE RATE HARD BOUNCE RATE SOFT BOUNCE RATE TOTAL BOUNCE RATE UNSUBSCRIBE COMPLAINTS
45.9%
48% 12.7%
9.3% 20.3%
26.5% 0.14%
0.08%
0.74%
0.31% 0.4%
0.4% 1.3%
0.8%
0.14%
0.07%
0.06%
0.04%
UTILITIESUNIQUE OPEN RATE UNIQUE CLICK RATE CLICKS TO OPENS CONTENT BOUNCE RATE HARD BOUNCE RATE SOFT BOUNCE RATE TOTAL BOUNCE RATE UNSUBSCRIBE COMPLAINTS
45.9%
48% 12.7%
9.3% 20.3%
26.5% 0.14%
0.08%
0.74%
0.31% 0.4%
0.4% 1.3%
0.8%
0.14%
0.07%
0.06%
0.04%
UTILITIESUNIQUE OPEN RATE UNIQUE CLICK RATE CLICKS TO OPENS CONTENT BOUNCE RATE HARD BOUNCE RATE SOFT BOUNCE RATE TOTAL BOUNCE RATE UNSUBSCRIBE COMPLAINTS
45.9%
48% 12.7%
9.3% 20.3%
26.5% 0.14%
0.08%
0.74%
0.31% 0.4%
0.4% 1.3%
0.8%
0.14%
0.07%
0.06%
0.04%
UTILITIESUNIQUE OPEN RATE UNIQUE CLICK RATE CLICKS TO OPENS CONTENT BOUNCE RATE HARD BOUNCE RATE SOFT BOUNCE RATE TOTAL BOUNCE RATE UNSUBSCRIBE COMPLAINTS
45.9%
48% 12.7%
9.3% 20.3%
26.5% 0.14%
0.08%
0.74%
0.31% 0.4%
0.4% 1.3%
0.8%
0.14%
0.07%
0.06%
0.04%
41
KEY
H1 2013
H1 2014
SHARE THIS GUIDE :
43
RESULTS BY SECTOR SHARE THIS GUIDE :
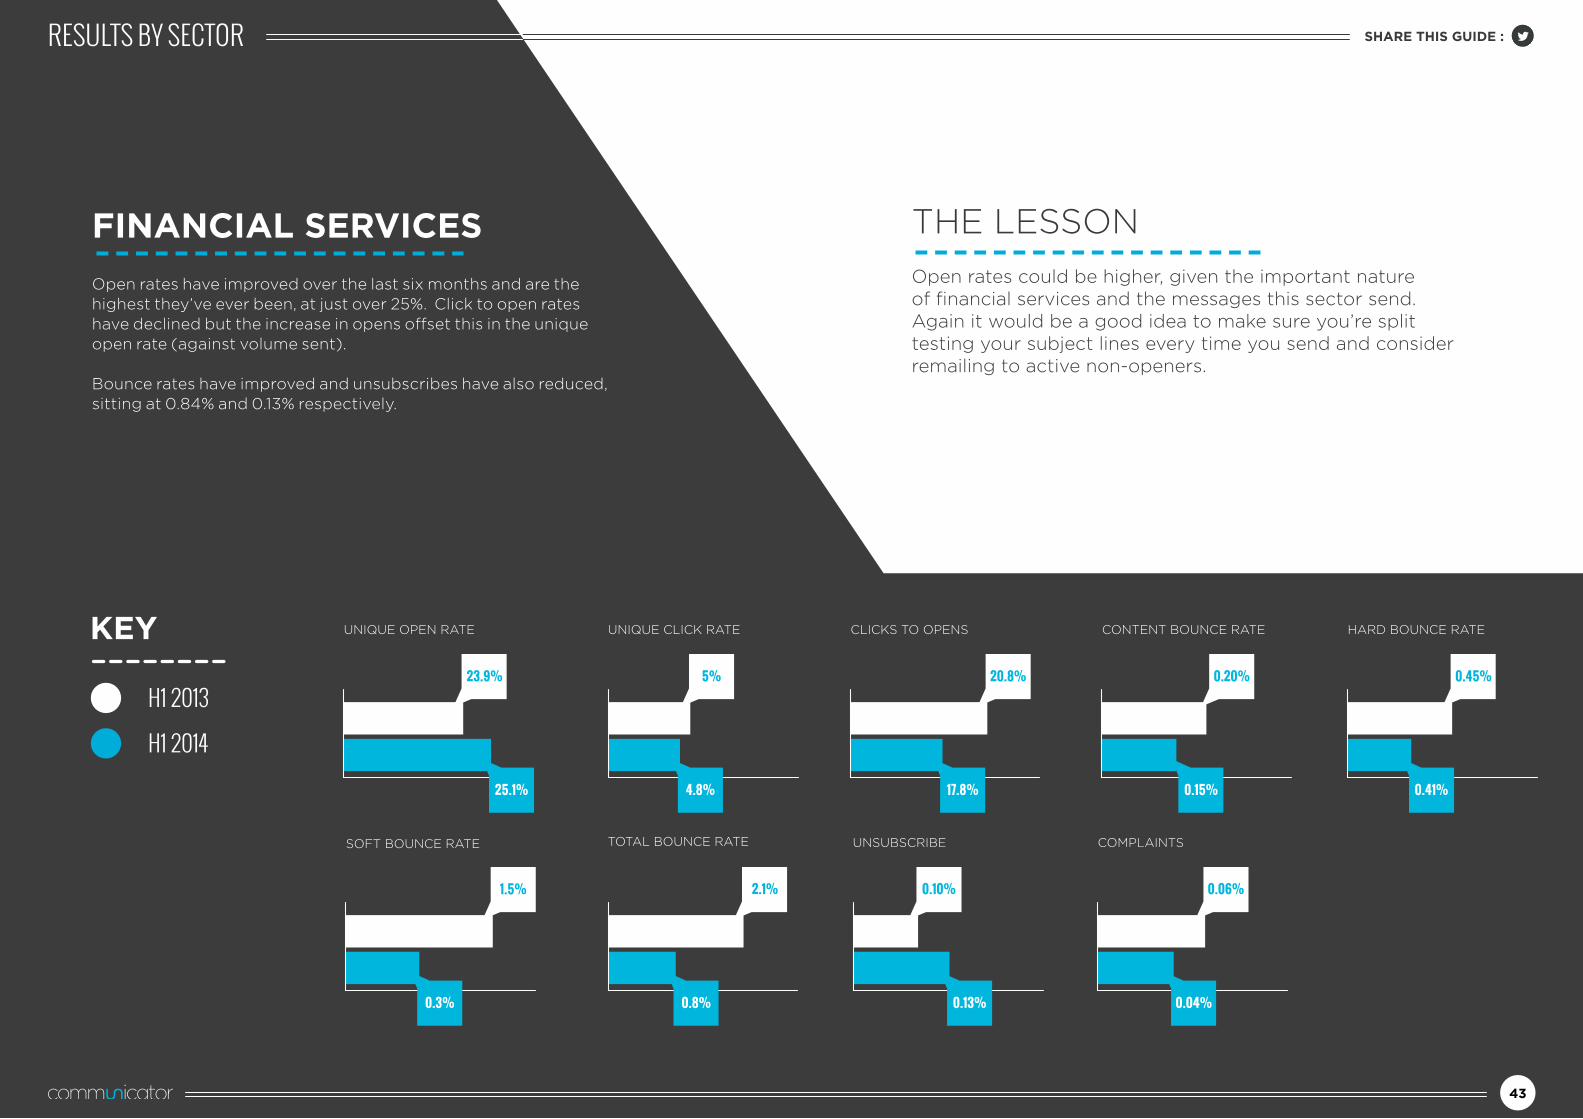
FINANCIAL SERVICESOpen rates have improved over the last six months and are the highest they’ve ever been, at just over 25%. Click to open rates have declined but the increase in opens offset this in the unique open rate (against volume sent).
Bounce rates have improved and unsubscribes have also reduced, sitting at 0.84% and 0.13% respectively.
FINANCIAL SERVICESUNIQUE OPEN RATE UNIQUE CLICK RATE CLICKS TO OPENS CONTENT BOUNCE RATE HARD BOUNCE RATE SOFT BOUNCE RATE TOTAL BOUNCE RATE UNSUBSCRIBE COMPLAINTS
0.04%
0.06%
0.13%
0.10%2.1%
0.8%0.3%
1.5%0.45%
0.41%0.15%
0.20%20.8%
17.8%
5%
4.8%25.1%
23.9%
FINANCIAL SERVICESUNIQUE OPEN RATE UNIQUE CLICK RATE CLICKS TO OPENS CONTENT BOUNCE RATE HARD BOUNCE RATE SOFT BOUNCE RATE TOTAL BOUNCE RATE UNSUBSCRIBE COMPLAINTS
0.04%
0.06%
0.13%
0.10%2.1%
0.8%0.3%
1.5%0.45%
0.41%0.15%
0.20%20.8%
17.8%
5%
4.8%25.1%
23.9%
FINANCIAL SERVICESUNIQUE OPEN RATE UNIQUE CLICK RATE CLICKS TO OPENS CONTENT BOUNCE RATE HARD BOUNCE RATE SOFT BOUNCE RATE TOTAL BOUNCE RATE UNSUBSCRIBE COMPLAINTS
0.04%
0.06%
0.13%
0.10%2.1%
0.8%0.3%
1.5%0.45%
0.41%0.15%
0.20%20.8%
17.8%
5%
4.8%25.1%
23.9%
FINANCIAL SERVICESUNIQUE OPEN RATE UNIQUE CLICK RATE CLICKS TO OPENS CONTENT BOUNCE RATE HARD BOUNCE RATE SOFT BOUNCE RATE TOTAL BOUNCE RATE UNSUBSCRIBE COMPLAINTS
0.04%
0.06%
0.13%
0.10%2.1%
0.8%0.3%
1.5%0.45%
0.41%0.15%
0.20%20.8%
17.8%
5%
4.8%25.1%
23.9%
FINANCIAL SERVICESUNIQUE OPEN RATE UNIQUE CLICK RATE CLICKS TO OPENS CONTENT BOUNCE RATE HARD BOUNCE RATE SOFT BOUNCE RATE TOTAL BOUNCE RATE UNSUBSCRIBE COMPLAINTS
0.04%
0.06%
0.13%
0.10%2.1%
0.8%0.3%
1.5%0.45%
0.41%0.15%
0.20%20.8%
17.8%
5%
4.8%25.1%
23.9%
43
KEY
H1 2013
H1 2014
THE LESSONOpen rates could be higher, given the important nature of financial services and the messages this sector send. Again it would be a good idea to make sure you’re split testing your subject lines every time you send and consider remailing to active non-openers.

SHARE THIS GUIDE :
45
RESULTS BY SECTOR SHARE THIS GUIDE :
PUBLIC SECTORThe public sector has the second best performing open rates of all sectors, having improved slightly over the last six months. Click to open rates have, however, seen a sharp decline by almost 5%. Bounce rates and unsubscribe rates have both fallen, sitting at 0.74% and 0.11%.
THE LESSONMore of a focus on increasing subscriber engagement will counteract the decline in clicks. Try out some new techniques to get your customers interested in your communications again.
PUBLIC SECTORUNIQUE OPEN RATE UNIQUE CLICK RATE CLICKS TO OPENS CONTENT BOUNCE RATE HARD BOUNCE RATE SOFT BOUNCE RATE TOTAL BOUNCE RATE UNSUBSCRIBE COMPLAINTS
28.4%
11.1% 2.1%
5% 17.7%
0.06% 0.68%
0.27% 0.2%
0.6%
0.7%
1.4%
0.11%
0.09%
0.02%
0.06%
0.23%
18.7%
PUBLIC SECTORUNIQUE OPEN RATE UNIQUE CLICK RATE CLICKS TO OPENS CONTENT BOUNCE RATE HARD BOUNCE RATE SOFT BOUNCE RATE TOTAL BOUNCE RATE UNSUBSCRIBE COMPLAINTS
28.4%
11.1% 2.1%
5% 17.7%
0.06% 0.68%
0.27% 0.2%
0.6%
0.7%
1.4%
0.11%
0.09%
0.02%
0.06%
0.23%
18.7%
PUBLIC SECTORUNIQUE OPEN RATE UNIQUE CLICK RATE CLICKS TO OPENS CONTENT BOUNCE RATE HARD BOUNCE RATE SOFT BOUNCE RATE TOTAL BOUNCE RATE UNSUBSCRIBE COMPLAINTS
28.4%
11.1% 2.1%
5% 17.7%
0.06% 0.68%
0.27% 0.2%
0.6%
0.7%
1.4%
0.11%
0.09%
0.02%
0.06%
0.23%
18.7%
PUBLIC SECTORUNIQUE OPEN RATE UNIQUE CLICK RATE CLICKS TO OPENS CONTENT BOUNCE RATE HARD BOUNCE RATE SOFT BOUNCE RATE TOTAL BOUNCE RATE UNSUBSCRIBE COMPLAINTS
28.4%
11.1% 2.1%
5% 17.7%
0.06% 0.68%
0.27% 0.2%
0.6%
0.7%
1.4%
0.11%
0.09%
0.02%
0.06%
0.23%
18.7%
PUBLIC SECTORUNIQUE OPEN RATE UNIQUE CLICK RATE CLICKS TO OPENS CONTENT BOUNCE RATE HARD BOUNCE RATE SOFT BOUNCE RATE TOTAL BOUNCE RATE UNSUBSCRIBE COMPLAINTS
28.4%
11.1% 2.1%
5% 17.7%
0.06% 0.68%
0.27% 0.2%
0.6%
0.7%
1.4%
0.11%
0.09%
0.02%
0.06%
0.23%
18.7%
45
KEY
H1 2013
H1 2014

SHARE THIS GUIDE :
47
RESULTS BY SECTOR SHARE THIS GUIDE :
MANUFACTURINGOpens have increased slightly within the manufacturing sector, but the increase is slower than average and rates are also lower than they were twelve months ago. Click to open rates have fallen from around 9% this time last year to just over 4% currently, which is by far the lowest of any industry.
Unsubscribes have been high but have reduced in this period, with bounce rates also reducing to 1.42%.
THE LESSONA strong focus on subscriber engagement should be the main focus within manufacturing to get subscribers interested in your communications to give a much greater return on your investment.
MANUFACTURINGUNIQUE OPEN RATE UNIQUE CLICK RATE CLICKS TO OPENS CONTENT BOUNCE RATE HARD BOUNCE RATE SOFT BOUNCE RATE TOTAL BOUNCE RATE UNSUBSCRIBE COMPLAINTS
0.01%
0.02%0.14%
0.14%1.4%
2.1%
0.9%
1.3%
0.21%
0.45%
0.34%
0.33%
4.3%
9%1.8%
0.8%18.9%
19.6%
MANUFACTURINGUNIQUE OPEN RATE UNIQUE CLICK RATE CLICKS TO OPENS CONTENT BOUNCE RATE HARD BOUNCE RATE SOFT BOUNCE RATE TOTAL BOUNCE RATE UNSUBSCRIBE COMPLAINTS
0.01%
0.02%0.14%
0.14%1.4%
2.1%
0.9%
1.3%
0.21%
0.45%
0.34%
0.33%
4.3%
9%1.8%
0.8%18.9%
19.6%
MANUFACTURINGUNIQUE OPEN RATE UNIQUE CLICK RATE CLICKS TO OPENS CONTENT BOUNCE RATE HARD BOUNCE RATE SOFT BOUNCE RATE TOTAL BOUNCE RATE UNSUBSCRIBE COMPLAINTS
0.01%
0.02%0.14%
0.14%1.4%
2.1%
0.9%
1.3%
0.21%
0.45%
0.34%
0.33%
4.3%
9%1.8%
0.8%18.9%
19.6%
MANUFACTURINGUNIQUE OPEN RATE UNIQUE CLICK RATE CLICKS TO OPENS CONTENT BOUNCE RATE HARD BOUNCE RATE SOFT BOUNCE RATE TOTAL BOUNCE RATE UNSUBSCRIBE COMPLAINTS
0.01%
0.02%0.14%
0.14%1.4%
2.1%
0.9%
1.3%
0.21%
0.45%
0.34%
0.33%
4.3%
9%1.8%
0.8%18.9%
19.6%
MANUFACTURINGUNIQUE OPEN RATE UNIQUE CLICK RATE CLICKS TO OPENS CONTENT BOUNCE RATE HARD BOUNCE RATE SOFT BOUNCE RATE TOTAL BOUNCE RATE UNSUBSCRIBE COMPLAINTS
0.01%
0.02%0.14%
0.14%1.4%
2.1%
0.9%
1.3%
0.21%
0.45%
0.34%
0.33%
4.3%
9%1.8%
0.8%18.9%
19.6%
47
KEY
H1 2013
H1 2014

SHARE THIS GUIDE :
49
RESULTS BY SECTOR SHARE THIS GUIDE :
TRAVEL & TOURISMWithin Travel and Tourism, open rates have increased by over 3%, with click to open rates decreasing slightly, although not as much as most other industries.
Bounce rates have reduced considerably and unsubscribes have somewhat increased to 0.17%. The average new sign up rate for this sector over the six month period was 7.25%, much lower than some industries.
THE LESSONA focus on subscriber engagement to get click-through rates as high as they’ve been historically (click to open rates have fallen 5% in two and a half years) would get the greatest return on your efforts with this sector.
TRAVEL & TOURISMUNIQUE OPEN RATE UNIQUE CLICK RATE CLICKS TO OPENS CONTENT BOUNCE RATE HARD BOUNCE RATE SOFT BOUNCE RATE TOTAL BOUNCE RATE UNSUBSCRIBE COMPLAINTS
21.9%
17.4% 2.6%
2.7% 12.5%
15.2%
0.12%
0.18%
0.35%
0.14% 0.4%
0.2% 0.6%
0.7%
0.13%
0.17%
0.80%
0.03%
TRAVEL & TOURISMUNIQUE OPEN RATE UNIQUE CLICK RATE CLICKS TO OPENS CONTENT BOUNCE RATE HARD BOUNCE RATE SOFT BOUNCE RATE TOTAL BOUNCE RATE UNSUBSCRIBE COMPLAINTS
21.9%
17.4% 2.6%
2.7% 12.5%
15.2%
0.12%
0.18%
0.35%
0.14% 0.4%
0.2% 0.6%
0.7%
0.13%
0.17%
0.80%
0.03%
TRAVEL & TOURISMUNIQUE OPEN RATE UNIQUE CLICK RATE CLICKS TO OPENS CONTENT BOUNCE RATE HARD BOUNCE RATE SOFT BOUNCE RATE TOTAL BOUNCE RATE UNSUBSCRIBE COMPLAINTS
21.9%
17.4% 2.6%
2.7% 12.5%
15.2%
0.12%
0.18%
0.35%
0.14% 0.4%
0.2% 0.6%
0.7%
0.13%
0.17%
0.80%
0.03%
TRAVEL & TOURISMUNIQUE OPEN RATE UNIQUE CLICK RATE CLICKS TO OPENS CONTENT BOUNCE RATE HARD BOUNCE RATE SOFT BOUNCE RATE TOTAL BOUNCE RATE UNSUBSCRIBE COMPLAINTS
21.9%
17.4% 2.6%
2.7% 12.5%
15.2%
0.12%
0.18%
0.35%
0.14% 0.4%
0.2% 0.6%
0.7%
0.13%
0.17%
0.80%
0.03%
TRAVEL & TOURISMUNIQUE OPEN RATE UNIQUE CLICK RATE CLICKS TO OPENS CONTENT BOUNCE RATE HARD BOUNCE RATE SOFT BOUNCE RATE TOTAL BOUNCE RATE UNSUBSCRIBE COMPLAINTS
21.9%
17.4% 2.6%
2.7% 12.5%
15.2%
0.12%
0.18%
0.35%
0.14% 0.4%
0.2% 0.6%
0.7%
0.13%
0.17%
0.80%
0.03%
49
KEY
H1 2013
H1 2014

SHARE THIS GUIDE :
51
RETAIL CONVERSIONSTHE PENNIES & POUNDSThe great thing about digital marketing is that it can easily be tracked, right down to the penny. Even better, this allows us to generate a return on investment figure for the email channel.
In H1 2014, Communicator sent over 200 million emails with conversion tracking applied, helping to generate almost £21 million worth of revenue.
From this, we’re able to work out the average revenue generated per email is 10p. That might not seem like a lot, but when you consider the costs related to these emails, the figure is much more pleasing on the eye.
Against the average cost per email on our rate card, we worked out an average ROI of 2210%* – up from 2000%* in the previous six months!
THE LESSON
Make sure you’re tracking your conversions to get those all-important ROI figures.
*Note: These figures don’t take into account any costs that may occur when building an email campaign, but give you a good idea nonetheless.
£20,007,869.37
£20,879,631.54
CONVERSIONTRACKING APPLIEDTO
TOTALCONVERSIONVALUE OFA PIGGY BANK
BREAKING
A GBP CONVERSION
EMAILS
200,886,418
RETURN ONINVESTMENT OF2210%
VALUE OF£871,762.17
A FOREIGN CONVERSIONVALUE OF
£0.10 REVENUE
ROI
GENERATED PERSINGLE EMAIL

SHARE THIS GUIDE :
53
SHARE THIS GUIDE :
53
MAILING LIST GROWTHSIZE DOES MATTER!We’ve seen a lot of different figures quoted around the value of a marketable email address; an address with permission attached so you can market to it. Although the different numbers can be confusing, one thing’s for sure; permission is invaluable to marketers.
Therefore it’s only right that you should take some time to concentrate on actively growing your mailing lists, we’ve a great guide that takes you through everything you need to know about growing your mailing list, but here’s a summary of what’s been happening over the last six months.
SUMMARY OF RESULTSThere’s a clear jump in mailing list growth over the last twelve months; the average growth in 2013 was around 6-10%, whereas in 2014 there hasn’t been a month with lower than 12% growth.
During the six months this report looks at, H1 2014, June was the best performing month for mailing list growth. However, that still doesn’t top August 2013’s huge 20%+ growth on all mailing lists.
If your mailing list isn’t growing as much as you’d like, or isn’t on track with some of the figures here, or even if it’s decreasing in size due to unsubscribes, speak to your Account Manager or download our Mailing List Growth guide.
It’s important to note at this stage that if you’re not taking the necessary steps to bring your data in line with the forthcoming EU Data Protection reform, you risk your mailing list becoming obsolete. You can read more about the changes in our trends section and you can download our guide to what’s coming to help you along.
THE LESSON
Make sure you’ve made the necessary changes so that you don’t suffer when the new EU laws come in to place. There’s time to address the changes now and it’s important for marketers not to overlook the reform and how it’ll impact them.
JANUARY
12.6% 14% 13.5% 14.9% 12.6% 15.4%
10.6%
Half 1 2014
Half 1 2013 Half 1 2013 Half 1 2013 Half 1 2013 Half 1 2013 Half 1 2013
Half 1 2014 Half 1 2014 Half 1 2014 Half 1 2014Half 1 2014
9.7% 9.7% 7.5% 7.5% 6.2%
FEBURARY MARCH APRIL MAYJUNE
KEY
H1 2013
H1 2014

SHARE THIS GUIDE :
55
SHARE THIS GUIDE :
55
ENGAGEMENTWHAT PROPORTION OF YOUR DATABASE IS ACTIVE?Measuring results on a campaign to campaign basis is one thing, but measuring the proportion of active subscribers gives you much greater insight into how interesting your overall communication strategy is.
It’s natural to have a segment of your mailing list that’s inactive – around two thirds, in fact – so make sure you monitor your mailing list activity in the Mailing List Insights section in Communicator (your Account Manager can talk you though this if it’s new to you).
SUMMARY OF RESULTSMailing list activity has noticeably increased over the past twelve months. Where the averages were between 33-35% last year, this year we’re seeing engagement figures of around 34-38%.
These results run consistent with the trend in rising open rates and do a fair bit to add weight to this trend. Marketers are getting their message out to more and more of their subscribers.
However, this does still leave just under two thirds of subscribers that are inactive. Although these figures only show a snippet for the month, you should be wary of long-term inactive subscribers and consider re-engaging and/or suppressing them to stop any potential future deliverability problems to your active subscribers.
The Communicator blog has a wealth of information on re-engagement, including the strategy behind the process and where to start when implementing your campaigns. Your Account Manager can also point you in the direction of some previous examples we’ve been involved with.
THE LESSON
Monitor your mailing list engagement rates and use this as a key area of focus to build your email efforts from.
34.5%Half 1 2014
APRILJANUARY
37.3% 37.8% 35.3% 34.5% 36.7%
35.6%
Half 1 2014
Half 1 2013 Half 1 2013 Half 1 2013 Half 1 2013 Half 1 2013 Half 1 2013
Half 1 2014Half 1 2014 Half 1 2014 Half 1 2014
34.4% 35.4% 35.4% 35% 33.2%
FEBURARYMARCH APRIL MAY
KEY
H1 2013
H1 2014
SHARE THIS GUIDE :
57
GLOSSARY OF TERMSEmail marketing can be a little bit geeky at times and there’s lots of terms flying around that confuse even the best of us. Here’s a handy list that clarifies all of the key terms used in this report...
TOTAL BOUNCEAn email that’s been returned to the sender as the client has deemed it undeliverable – made up of either Hard, Soft or Content Bounces. Often expressed as a ratio against volume sent.
CONTENT BOUNCEAn email that’s been returned to the sender as the client has deemed it to be spam-worthy – either because of the emails content or the sender’s reputation. Often expressed as a ratio against volume sent.
HARD BOUNCEAn email that’s been returned to the sender as the recipient’s mailbox is no longer valid or reachable. Communicator suppresses these records and doesn’t attempt to deliver to them again. Often expressed as a ratio against volume sent.
SOFT BOUNCEAn email that’s been returned to the sender as the recipient’s mailbox is temporarily unavailable. Communicator then intermittently resends the email over the next 48hrs until delivered. If it’s then still undeliverable, Communicator will upgrade the record to a Hard Bounce and suppress it. Often expressed as a ratio against volume sent.
DELIVERY RATEA ratio expressing the percentage of sent emails that are delivered to recipients’ mailboxes.
CLICK TO OPENA ratio expressing the unique clicks as a comparison against unique opens.
UNIQUE OPEN‘Open’ refers to the number of times Communicator counts a sent email as being opened by its recipient. When referred to as unique, the volume is counted a maximum of once per recipient. Often expressed as a percentage against volume delivered.
We learn something new every time we publish the Communicator Benchmarking Report – constant changes in trends always give marketers key takeaways.
We’d suggest that you go through the report yourself but if you’re short on time, here’s a quick summary of the key points:
• Unique opens and mailing list activity is increasing – meaning we’re getting more and more of our customers to see our messages.
• Click through rates aren’t increasing at the same rate – in fact, they’ve been decreasing for some time. Focus on delivering engaging content that leaves your subscribers wanting more.
• Automated campaigns are far more likely to give greater results; great news if you’re lazy. The campaigns you don’t have to spend as much time on work very well indeed! Make sure you jump on the automation bandwagon.
• More of your emails are being opened on touch-operated mobile devices than they are desktop computers so remember this when it comes to designing your emails and think mobile first.
UNIQUE CLICK RATEA ‘click’ refers to the number of times a link is clicked within an email sent from Communicator (with the exception of an unsubscribe click). When referred to as unique, the volume is recorded a maximum of once per recipient. Often expressed as a percentage rate against volume delivered.
UNSUBSCRIBEWhen a recipient expresses an intention to be removed from a mailing list, either through the standard Communicator link, a dedicated data capture form, a relevant recipient’s reply or when the recipient informs the email client. Often expressed as a percentage against volume sent.
COMPLAINTAlso known as Feedback Loop, referring to the number of times a recipient reports an email as ‘Spam’ or ‘Junk’ through their email client. Communicator automatically unsubscribes these records.
ENGAGEMENTThe percentage of active subscribers there are in a mailing list at any one time – a ratio which also demonstrates the volume of inactive subscribers there are in a mailing list.Active subscribers are those that have recently opened an email, whereas inactive subscribers are referred to as long-term non-openers.
MAILING LIST GROWTHA ratio expressing the rise (or fall) in a mailing lists volume of subscribers – taking into account all new subscriptions, as well as total unsubscribes, bounces and suppressions.
MAKING THE MOST OF YOUR EMAIL MARKETING
You’ve learnt the facts, now it’s time to get implementing. Communicator has a wealth of resources to help you get your email marketing to where it wants to be. Print a few out and make sure you keep them handy.
Top Tips To A Tip Top Email – 10 quick wins to give your email campaigns a boost.
Mo’ Metrics, Mo’ Problems? – Our email marketing metrics guide.
Responsive Email Design Guide – Our recommendations on how to design emails that are optimised for mobile devices.
Mailing List Growth Strategies – grow your subscriber list and increase your reach.
Birthday & Anniversary Emails – All about the most personal of automated email campaigns.
EXTERNAL RESOURCES
Econsultancy Email Marketing Best Practice Guide – A recent publication, thoroughly covering all aspects of email marketing practices.
Econsultancy Email Marketing Industry Census 2014 – Another recent publication, looking at the way that email marketing is conducted across the country.
Econsultancy Building, Monitoring and Improving Your Email Marketing Campaigns – How to get the most out of your current campaigns.
SUMMARY & FURTHER READING
ROUNDUP OF WHAT YOU NEED TO KNOW
57
SHARE THIS GUIDE :

thomson house, groat market,newcastle upon tyne, ne1 1ed
@CommCorp
Communicator.
www.communicatorcorp.com
+44 (0) 844 870 8971