Communication Satisfaction of Charismatic Leaders in ...
186
Walden University ScholarWorks Walden Dissertations and Doctoral Studies Walden Dissertations and Doctoral Studies Collection 2015 Communication Satisfaction of Charismatic Leaders in Virtual Teams Felicia Latrice Chachere Walden University Follow this and additional works at: hps://scholarworks.waldenu.edu/dissertations Part of the Business Administration, Management, and Operations Commons , and the Management Sciences and Quantitative Methods Commons is Dissertation is brought to you for free and open access by the Walden Dissertations and Doctoral Studies Collection at ScholarWorks. It has been accepted for inclusion in Walden Dissertations and Doctoral Studies by an authorized administrator of ScholarWorks. For more information, please contact [email protected].
Transcript of Communication Satisfaction of Charismatic Leaders in ...

Walden UniversityScholarWorks
Walden Dissertations and Doctoral Studies Walden Dissertations and Doctoral StudiesCollection
2015
Communication Satisfaction of CharismaticLeaders in Virtual TeamsFelicia Latrice ChachereWalden University
Follow this and additional works at: https://scholarworks.waldenu.edu/dissertations
Part of the Business Administration, Management, and Operations Commons, and theManagement Sciences and Quantitative Methods Commons
This Dissertation is brought to you for free and open access by the Walden Dissertations and Doctoral Studies Collection at ScholarWorks. It has beenaccepted for inclusion in Walden Dissertations and Doctoral Studies by an authorized administrator of ScholarWorks. For more information, pleasecontact [email protected].

Walden University
College of Management and Technology
This is to certify that the doctoral dissertation by
Felicia Chachere
has been found to be complete and satisfactory in all respects,
and that any and all revisions required by
the review committee have been made.
Review Committee
Dr. Lilburn Hoehn, Committee Chairperson, Management Faculty
Dr. Stephanie Hoon, Committee Member, Management Faculty
Dr. David Gould, University Reviewer, Management Faculty
Chief Academic Officer
Eric Riedel, Ph.D.
Walden University
2015

Abstract
Communication Satisfaction of Charismatic Leaders in Virtual Teams
by
Felicia Chachere
MPH, Armstrong Atlantic State University, 2001
BS, Savannah State University, 1999
Dissertation Submitted in Partial Fulfillment
of the Requirements for the Degree of
Doctor of Philosophy
Management
Walden University
May 2015

Abstract
Over the last 2 decades of advances in technology, organizations have used virtual teams
(VTs) as one way to expand globally. Strong leadership and communication skills with
followers are essential qualities for successful VTs. It is important to conduct research
related to charismatic leadership and communication satisfaction of team members as
many organizations now use VTs. The purpose of the survey study was to examine the
relationship of perceived charismatic leadership qualities in VT leaders and
communication satisfaction in VT members. The research questions examined the
association between charismatic leadership qualities and the subdimension of
communication satisfaction. Charismatic leadership was the theoretical framework for the
study, which posits that leadership and communication are contributing factors to
successful VTs. Data were collected from property managers of a major student housing
management company (n = 111) using convenience sampling. The Conger-Kanungo
Charismatic Leadership Questionnaire and Communication Satisfaction Survey were e-
mailed to the property managers through Survey Monkey. Multiple regression analysis
showed that a number of charismatic leadership qualities were statistically associated
with communication satisfaction. Inspiring strategic and organizational goals explained
the most variance in conflict resolution (p < 0.001). The results may contribute to the
body of knowledge on VTs, as the results suggest that a leadership-focused approach can
transform VTs into highly communicative teams. Implications for positive social change
are that management awareness of charismatic leadership qualities can have a positive
effect on the enhancement of communication satisfaction and employee productivity.

Communication Satisfaction of Charismatic Leaders in Virtual Teams
by
Felicia Chachere
MPH, Armstrong Atlantic State University, 2001
BS, Savannah State University, 1999
Dissertation Submitted in Partial Fulfillment
of the Requirements for the Degree of
Doctor of Philosophy
Management
Walden University
May 2015

Dedication
My dissertation is dedicated to my mother, Etta Billingslea. She has been very
supportive in all that my sister and I have done. As I grew up my mother always instilled
in me the importance of education. She was an educator herself. She sacrificed a lot for
the betterment and happiness for her family. It was always her dream to obtain her
doctorate degree but she made the choice to put her children first and did not chase her
dream. It is with great honor that I dedicate my dissertation to her. I love you mom and
thank you for all that you have done for us. Most importantly thank you for your love and
undying support.

Acknowledgments
I would first like to acknowledgment my Lord and Savior for without him nothing
is possible. I thank you God for guiding my thoughts and actions and allowing me to
complete my dissertation.
I would like to thank my dissertation chair, Dr. Lilburn Hoehn, committee
member Dr. Stephanie Hoon, and University Reviewer Dr. David Gould for your support
and guidance. I am so grateful for your professionalism and assistance throughout my
dissertation process. Dr. Hoehn, I am so thankful for your support and the opportunity of
having you as my chairperson. Thank you ACC for allowing me to conduct my study.
A special thank you to Dr. Debra Dwight for your support throughout my
dissertation process. I will never forget that Sunday when you shared with me the steps
you took to obtain your doctorate. THANK YOU; you not only jumped started my
writing but also prepared me for my oral defense.
To my mom, dad, brother in law, and family, I thank you for your encouraging
words and support. To my supportive sister, thank you for being there when I wanted to
give up. Thanks for being my counselor, editor, and coach. THANK YOU, my
accountability partner.
Most of all to my loving, supportive, and encouraging Husband, Chris thank you
so much for all that you do. Your encouraging words helped me make it to the finish line.
To my biggest cheerleader, my daughter, Cristiana, you are the best daughter a woman
can have and so supportive. Thank you for always checking on me and understanding
when mommy couldn’t do a lot while finishing my paper. I love you Christopher Joseph.

i
Table of Contents
List of Tables ..................................................................................................................... vi
Chapter 1: Introduction to the Study ....................................................................................1
Background of the Study ...............................................................................................2
Problem Statement .........................................................................................................4
Purpose of the Study ......................................................................................................5
Research Questions and Hypotheses .............................................................................5
Theoretical Base.............................................................................................................7
Social Control and Sensitivity to Followers’ Needs ............................................... 9
Articulation ............................................................................................................. 9
Visionary ............................................................................................................... 10
Nature of the Study ......................................................................................................11
Definition of Terms......................................................................................................12
Assumptions .................................................................................................................12
Scope and Delimitations ..............................................................................................13
Limitations ...................................................................................................................13
Significance of the Study .............................................................................................14
Summary ......................................................................................................................15
Chapter 2: Literature Review .............................................................................................17
Literature Search Strategy............................................................................................17
Virtual Teams (VT)............................................................................................... 17
Advantages and Disadvantages of VTs ................................................................ 21

ii
Theoretical Base...........................................................................................................25
Literature Review.........................................................................................................25
Charismatic Leadership ........................................................................................ 25
Socialized Charismatic Leadership ....................................................................... 27
Qualities of Charismatic Leaders .......................................................................... 31
Hypothesized Relationships Between Charismatic Leadership Qualities
and Communication Satisfaction .............................................................. 35
Communication and Satisfaction in VTs .............................................................. 36
Charismatic Leadership and Employee Engagement ........................................... 38
Summary and Conclusion ............................................................................................39
Chapter 3: Research Method ..............................................................................................41
Research Design and Rationale ...................................................................................41
Methodology ................................................................................................................44
Population ............................................................................................................. 44
Sampling Procedures ............................................................................................ 44
Procedures for Recruitment .................................................................................. 45
Data Collection ..................................................................................................... 45
Instrumentation and Materials .............................................................................. 46
Charismatic Leadership Scale ............................................................................... 46
Communication Satisfaction Scale ....................................................................... 47
Data Analysis ...............................................................................................................48
Research Question 1 ............................................................................................. 49

iii
Research Question 2 ............................................................................................. 49
Research Question 3 ............................................................................................. 50
Protection of Human Participants ................................................................................50
Threats to Validity .......................................................................................................51
Summary ......................................................................................................................52
Chapter 4: Results ..............................................................................................................53
Data Collection ............................................................................................................53
Data Results .................................................................................................................54
Research Question 1 ............................................................................................. 54
Research Question 2 ............................................................................................. 65
Research Question 3 ............................................................................................. 85
Summary ......................................................................................................................95
Chapter 5: Discussion, Conclusions, and Recommendations ............................................97
Interpretation of the Findings.......................................................................................97
Research Question 1 ............................................................................................. 97
Communication Motivates and Stimulates Followers’ to Meet Company
Goals ......................................................................................................... 99
Supervisors Offer Guidance in Solving Job-Related Problems .......................... 100
Communication Makes Employees Identify with the Organization or Feel
a Vital Part .............................................................................................. 101
Extent to Which Meetings are Well Organized .................................................. 101
Amount of Supervision Given is the Right Amount ........................................... 102

iv
Extent to Which Written Directives and Reports are Clear and Concise ........... 102
Attitudes Toward Communication in an Organization are Healthy ................... 103
Research Question 2 ........................................................................................... 105
Communicates Progress in Job ........................................................................... 106
Personal News ..................................................................................................... 107
Organizational and Departmental Policies and Goals ........................................ 107
Job Compares to Others ...................................................................................... 108
Judgment, Recognition for Efforts, and Job Requirements ................................ 108
Government Actions Affecting Organization ..................................................... 109
Changes in Organization ..................................................................................... 109
How Problems in job are Handled ...................................................................... 110
Benefits and Pay ................................................................................................. 110
Accomplishments and Failures of Organization ................................................. 110
Supervisors Know and Under Subordinates Problems ....................................... 111
Motivates and Stimulates Enthusiasm for Meeting Goals .................................. 111
Supervisor Listens and Pays Attention ............................................................... 112
Receive Timely Information Regarding Job ....................................................... 112
Proper Communication Channels for Conflict ................................................... 113
Active Grapevine Within Organization .............................................................. 113
Research Question 3 ........................................................................................... 115
Satisfaction with job. .......................................................................................... 116
Judgment, Recognition for Efforts, and job Requirements................................. 116

v
Changes in and Financial Standing of Organization........................................... 117
How Problems on the Job Are Handled .............................................................. 118
Benefits and Pay ................................................................................................. 118
Supervisors Know and Understand Problems and Offer Guidance to Solve
Problems ................................................................................................. 118
Listens and Pays Attention.................................................................................. 119
Proper Communication Channels for Conflict ................................................... 119
Limitations of the Study.............................................................................................120
Recommendations for Practice ..................................................................................121
Recommendation for Further Research .....................................................................122
Implications for Social Change ..................................................................................123
Conclusions ................................................................................................................123
References ........................................................................................................................125
Appendix A: Permission Letter .......................................................................................132
Appendix B: Survey Invitation E-mail ............................................................................134
Appendix C: Conger-Kanungo Charismatic Leadership Questionnaire ..........................135
Appendix D: Communication Satisfaction Questionnaire ...............................................137

vi
List of Tables
Table E1. Research Question 1: Comparing CSQ Scale (Question 19) to C-K Scale
(Questions 1, 4, 6, 7, 8, 9, 12, 14, 20, 25) ............................................................... 141
Table E2. Research Question 1: Measuring Constructs of Survey (Question 22) CSQ
Scale and C-K Scale (Questions: 1, 4, 6, 7, 8, 9, 12, 14, 20, 25)……………... 1411
Table E3. Research Question 1: Measuring Constructs of Survey (Question 23) CSQ
Scale and C-K Scale (Questions: 1, 4, 6, 7, 8, 9, 12, 14, 20,25) ............................. 142
Table E4. Research Question 1: Measuring Constructs of Survey (Question 33) CSQ
Scale and C-K Scale (Questions: 1, 4, 6, 7, 8, 9, 12, 14, 20, 25) .......................... 1433
Table E5. Research Question 1: Measuring Constructs of Survey (Question 34) of CSQ
Scale and C-K Scale (Questions: 1, 4, 6, 7, 8, 9, 12, 14, 20, 25) ............................ 143
Table E6. Research Question 1: Measuring Constructs of Survey (Question 35) of CSQ
Scale and C-K Scale (Questions: 1, 4, 6, 7, 8, 9, 12, 14, 20, 25) .......................... 1444
Table E7. Research Question 1: Measuring Constructs of Survey (Question 36) of CSQ
Scale and C-K Scale (Questions: 1, 4, 6, 7, 8, 9, 12, 14, 20, 25) ............................ 145
Table E8. Research Question 2 Comparing CSQ Scale (Question 4) to C-K Scale
(Questions: 2, 3, 5, 10, 11, 13, 15, 16, 17, 19, 21-24) ............................................ 146
Table E9. Research Question 2 Comparing CSQ Scale (Question 5) toC-K Scale
(Questions: 2, 3, 5, 10, 11, 13, 15, 16, 17, 19, 21-24) ............................................ 147
Table E10. Research Question 2 Comparing CSQ Scale (Question 6) to C-K Scale
(Questions: 2, 3, 5, 10, 11, 13, 15, 16, 17, 19, 21-24) ............................................ 148

vii
Table E11. Research Question 2 Comparing CSQ Scale (Question 7) toC-K Scale
(Questions: 2, 3, 5, 10, 11, 13, 15, 16, 17, 19, 21-24) ............................................ 149
Table E12.Research Question 2 Comparing CSQ Scale (Question 8) to C-K Scale
(Questions: 2, 3, 5, 10, 11, 13, 15, 16, 17, 19, 21-24) ............................................ 150
Table E13. Research Question 2 Comparing CSQ Scale (Question 9) to C-K Scale
(Questions: 2, 3, 5, 10, 11, 13, 15, 16, 17, 19, 21-24) ............................................ 151
Table E14.Research Question 2 Comparing CSQ Scale (Question 10) to C-K Scale
(Questions: 2, 3, 5, 10, 11, 13, 15, 16, 17, 19, 21-24) ............................................ 152
Table E15. Research Question 2 Comparing CSQ Scale (Question 11) to C-K Scale
(Questions: 2, 3, 5, 10, 11, 13, 15, 16, 17, 19, 21-24) ............................................ 153
Table E16. Research Question 2 Comparing CSQ Scale (Question 12) to C-K Scale
(Questions: 2, 3, 5, 10, 11, 13, 15, 16, 17, 19, 21-24) ............................................ 155
Table E17. Research Question 2 Comparing CSQ Scale (Question 13) to C-K Scale
(Questions: 2, 3, 5, 10, 11, 13, 15, 16, 17, 19, 21-24) ............................................ 156
Table E18. Research Question 2 Comparing CSQ Scale (Question 14) to C-K Scale
(Questions: 2, 3, 5, 10, 11, 13, 15, 16, 17, 19, 21-24) ............................................ 157
Table E19. Research Question 2 Comparing CSQ Scale (Question 15) to C-K Scale
(Questions: 2, 3, 5, 10, 11, 13, 15, 16, 17, 19, 21-24) ............................................ 158
Table E20. Research Question 2 Comparing CSQ Scale (Question 17) to C-K Scale
(Questions: 2, 3, 5, 10, 11, 13, 15, 16, 17, 19, 21-24) ............................................ 159
Table E21. Research Question 2 Comparing CSQ Scale (Question 18) to C-K Scale
(Questions: 2, 3, 5, 10, 11, 13, 15, 16, 17, 19, 21-24) ............................................ 160

viii
Table E22. Research Question 2 Comparing CSQ Scale (Question 19) to C-K Scale
(Questions: 2, 3, 5, 10, 11, 13, 15, 16, 17, 19, 21-24) ............................................ 161
Table E23. Research Question 2 Comparing CSQ Scale (Question 20) to C-K Scale
(Questions: 2, 3, 5, 10, 11, 13, 15, 16, 17, 19, 21-24) ............................................ 162
Table E24. Research Question 2 Comparing CSQ Scale (Question 26) toC-K Scale
(Questions: 2, 3, 5, 10, 11, 13, 15, 16, 17, 19, 21-24) ............................................ 163
Table E25. Research Question 2 Comparing CSQ Scale (Question 27) to C-K Scale
(Questions: 2, 3, 5, 10, 11, 13, 15, 16, 17, 19, 21-24) ............................................ 164
Table E26. Research Question 2 Comparing CSQ Scale (Question 28) to C-K Scale
(Questions: 2, 3, 5, 10, 11, 13, 15, 16, 17, 19, 21-24) ............................................ 165
Table E27. Research Question 3 Comparing CSQ Scale (Question 1) to C-K Scale
(Questions 5, 10, 19) ............................................................................................. 1676
Table E28. Research Question 3 Comparing CSQ Scale (Question 8) to C-K Scale
(Questions 5, 10, 19) ............................................................................................. 1676
Table E29. Research Question 3 Comparing CSQ Scale (Question 9) to C-K Scale
(Questions 5, 10, 19) ............................................................................................... 167
Table E30. Research Question 3 Comparing CSQ Scale (Question 11) to C-K Scale
(Questions 5, 10, 19) ............................................................................................... 167
Table E31. Research Question 3 Comparing CSQ Scale (Question 13) to C-K Scale
(Questions 5, 10, 19) ............................................................................................... 168
Table E32. Research Question 3 Comparing CSQ Scale (Question 14) to C-K Scale
(Questions 5, 10, 19) ............................................................................................... 168

ix
Table E33. Research Question 3 Comparing CSQ Scale (Question 15) to C-K Scale
(Questions 5, 10, 19) ............................................................................................. 1688
Table E34. Research Question 3 Comparing CSQ Scale (Question 16) to C-K Scale
(Questions 5, 10, 19) ........................................................................................... 16968
Table E35. Research Question 3 Comparing CSQ Scale (Question 18) to C-K Scale
(Questions 5, 10, 19) ............................................................................................... 169
Table E36. Research Question 3 Comparing CSQ Scale (Question 19) to C-K Scale
(Questions 5, 10, 19) ............................................................................................... 169
Table E37. Research Question 3 Comparing CSQ Scale (Question 20) to C-K Scale
(Questions 5, 10, 19) ........................................................................................... 17069
Table E38. Research Question 3 Comparing CSQ Scale (Question 22) to C-K Scale
(Questions 5, 10, 19) ............................................................................................... 170

1
Chapter 1: Introduction to the Study
The use of teams has enhanced work productivity among organizations for
decades. Teams exhibit the essence of diverse skill sets, experiences, and knowledge that
yields increased ability within organizations. Berry (2011) defined teams as “a group of
individuals who interact interdependently and who are brought together or come together
voluntarily to achieve certain outcomes or accomplish particular tasks” (p. 186). Over the
years, the structure of organizations has changed as organizations have expanded into
global entities. This expansion began the transformation of teams into virtual teams (VT).
The difference between a team and a VT is that the VT is distributed geographically
(Siebdrat, Hoegl, & Ernst, 2009). The advantage of a VT is that, if it is “designed,
managed, and implemented effectively it “can harness talent and knowledge from
anywhere in the world to solve problems and complete work tasks on a 24/7 schedule”
(Berry, 2010, p. 194).
The statistical value of how many VTs exist at any given time is not attainable.
However, Zaccaro and Bader (2003) estimated that one in five employees telework and
claimed that many teleworkers make up VTs. A special analysis run by Global
Workplace Analytics on the latest data from American Community Survey (2012)
showed that telecommuting increased by about 80% between the years 2005 and 2012
(globalworkplaceanalytics.com, 2013).
One critical way in which VTs can be successful and productive for organizations
is by focusing on leadership and communication. In order for VTs to be successful, its
leaders must be strong and communicative. From eight case studies reviewed by

2
Monalisa, Daim, Mirani, Dash, Khamis, and Bhusari (2008) in their quest to understand
management of global/VTs, leadership and communication were among the list of
challenges documented.
However, there is a lack of research on the qualities of charismatic leadership and
enhancing communication satisfaction among VTs. In this study, surveys on charismatic
leadership and communication satisfaction were used to determine whether there was a
relationship between leaders and communication satisfaction. By implementing a
leadership framework that focused on charismatic leadership qualities, leaders could be
transformed into charismatic leaders. Charismatic leaders will improve managerial
guidance to encourage information sharing and increased communication among team
members. VT lead by charismatic leaders will enhance social ties among employees and
bring about social networking and positive social change.
Background of the Study
Within organizations, teams are considered the building blocks of success they are
an important part in the performance of the organizations (Bergiel, Bergiel, & Balsmeir,
2008. Through the use of teams, organizations have the potential to be more effective in
meeting the goals of the organization because a team offers the diverse skills and
viewpoints of many individuals (Staples & Zhoa, 2006). As companies build business
relationships and expand their businesses globally, they form VTs (Siebdrat, Hoegl, &
Ernst, 2009). VTs are associated with an increased competitive edge and an increase in
global talent (Bergiel, Bergiel, & Balsmeier, 2008). The use of VTs has created the
opportunity for individuals to work across time zones through the use of technology
3
(Bergiel, Bergiel, & Balsmeier, 2008). VTs allow organizations to communicate across
distances without travel (Bergiel, Bergiel, & Balsmeier, 2008). VTs have yielded
increased organizational productivity and decreased organization expenses (Stevenson &
McGrath, 2004). A number of companies reported a substantial increase in productivity
as a result of VTs. After adopting virtual work, IBM saw productivity increase between
15% and 40% companywide and Hewlett Packard doubled their revenue from sales
(Stevenson & McGrath, 2004). This approach appears to be an ideal formula for
organizational success.
The success of VTs relies heavily on: trust, communication, leadership, goal
setting, and technology (Bergiel, Bergiel, & Balsmeier, 2008). Communication is
especially important within virtual teams. VTs do not have the luxury to conduct face-to-
face meetings on a routine basis. VTs lack the use of face-to-face interaction, which is an
important link to team success and communication.
The team leader plays a fundamental role in shaping and blending VTs. The
challenge remains how to successfully address the issue of communication among VTs.
There continues to be a substantial amount of research done on the qualities needed to be
a successful virtual leader more research is needed on how to successfully address the
flow of communication within VTs. In order for leaders to lead effectively, they must be
knowledgeable and know how to communicate with team members and encourage
effective communication among the entire team.

4
Problem Statement
While there is research that connects leadership qualities and communication
satisfaction, there is a lack of research connecting charismatic leadership with
communication satisfaction in VTs. The success of VTs correlates with effective
leadership (Derosa, 2009). OnPoint Consulting conducted a study of 48 VTs from 16
different organizations. It found that VT members and stakeholders “overwhelmingly
reported that communication is the most important competency for effective leaders of
virtual teams” (DeRosa, 2009, p. 10). VTs that lack effective leadership and lack
communication are problematic as they affect the outcomes and goals of the organization.
Successful VTs have yielded increased organizational productivity and decreased
organizational expenses (Stevenson & McGrath, 2004). According to Wakefield,
Leidner, and Garrison (2008), VTs function better with managerial guidance. In VTs,
leaders understand their roles and a take more active role.
Organizations must consciously create the conditions for effective virtual
teamwork, and the success or failure of VTs (or the organization itself) may well
be a consequence of inept leadership or management more than a consequence of
technology or other factors. (Berry, 2011, p. 195)
According to a study completed by D’Amato, Eckert, Ireland, Quinn, and Velsor’s (2010)
on leadership practices for corporate global responsibility, managing communication
throughout the organization is the responsibility of leaders.
There have been a large number of studies on VTs suggesting that the lack of
communication is a contributing factor to poor productivity among VTs. According to

5
Staples and Webster (2007), much of the existing research has been conducted on student
teams. While there is a substantial amount of research on VTs and communication, there
are many areas where additional research can be performed. There are few studies on
employees within VTs and an even fewer number within the housing industry. I studied
the association between charismatic leadership qualities and communication satisfaction
among VTs within the student housing industry.
Purpose of the Study
The purpose of this quantitative survey study was to determine the relationship
between charismatic leadership qualities, leadership effectiveness, communication, and
job satisfaction among virtual team members. Specifically the study (a) determined the
association between perceived charismatic leadership qualities and followers’ perception
of leadership effectiveness, and (b) determined the association between the perceived
subdimension of charismatic leadership qualities (sensitivity to members’ needs, strategic
vision, and articulation) of charismatic leadership qualities and communication
satisfaction. As a result of the analysis of the perceptions of VT leaders and VT members,
the study revealed the benefits of VTs that are led by charismatic leaders.
Research Questions and Hypotheses
The flow of communication is important within any team, and communication
should be the focus of leaders. According to Bergiel and Bergiel (2008), the two factors
that affect the success of VTs are communication and leadership. Problems with
communication and leadership among VTs can negatively affect work productivity

6
within organizations. According to Smith (2003), social interaction between employees,
coworkers, and expert training encourages positive engagement and support.
There is a lack of knowledge about how leadership and communication relate to
the success of VTs. The goal of this study was to identify how VT members perceive
charismatic leadership qualities and communication satisfaction among VTs and leaders.
Thus, the three research questions to measure charismatic leadership and communication
satisfaction among virtual teams members were as follows:
RQ1: Is there an association between charismatic leadership qualities and
follower perception of leadership effectiveness among virtual team members?
H0: There is not an association between perceived charismatic leadership
qualities and follower perception of leadership effectiveness among virtual
team members.
Ha: There is an association between perceived charismatic leadership qualities
and follower perception of leadership effectiveness among virtual team
members.
RQ2: Is there an association between the perceived subdimension (sensitivity to
members needs, strategic vision, and articulation) of charismatic leadership
qualities and communication satisfaction?
H0: There is not an association between perceived subdimension (sensitivity to
members needs, strategic vision, and articulation) of charismatic
leadership qualities and communication satisfaction.

7
Ha: There is an association between perceived subdimension (sensitivity to
members needs, strategic vision, and articulation) of charismatic
leadership qualities and communication satisfaction.
RQ3: Is there an association between communication satisfaction and job
satisfaction among virtual teams?
H0: There is not an association between communication satisfaction and job
satisfaction among virtual team members.
Ha: There is an association between communication satisfaction and job
satisfaction among virtual team members.
Theoretical Base
Leadership, one of the most important facets of human behavior (Shastri, Mishra,
& Sinha, 2010), means a “relationship between an individual and a group built around
some common interest wherein the group behaves in a manner directed or determined by
the leader” (Shastri, Mishra, & Sinha, 2010, p. 1946). According to early leadership
research, leaders and managers were believed to perform the same function. But in the
1970s, this concept was changed and the two functions were separated (Levine,
Muenchen, & Brooks, 2010). Two theories developed from this approach: one focused on
inspirational or transformational leadership and one focused on visionary or charismatic
leadership (Levine, Muenchen, & Brooks, 2010). According to Conger and Kanungo
(1994), the main factor that distinguished the two theories from one another was the
perspective of the leadership phenomena was viewed. Charismatic leadership has to do
with leadership behavior (Conger & Kanungo, 1994) and shared vision (Levine,

8
Muenchen, & Brooks, 2010), while transformational leadership were concerned with
follower outcomes (Conger & Kanungo, 1994).
The theoretical basis of this study was charismatic leadership; its qualities
enhance the relationships of leaders and followers. In charismatic leadership, the leader
has a vision, one that can motivate others (Hayibor, Agle, Sears, Sonnenfield, & Ward,
2011). Charismatic leadership theory is the most appropriate theory to use due to the
three constructs of (a) social control and sensitivity to others needs, (b) articulation, (c)
inspirational visionary. Charismatic leaders can generate confidence in their followers
that leads to productivity (Shastri, Mishra, & Sinha, 2010). The qualities of a charismatic
leader are expected to improve communication satisfaction within VTs .
According to Hayibor, Agle, Sears, Sonnenfeld, and Ward (2011) charismatic
leaders are known for their behavioral qualities that motivate their followers toward the
vision and goals that are presented to them. According to Conger and Kanungo (1994)
the “earlier formulations of charismatic leadership emerging from the fields of sociology
and political science were primarily concerned with what leader behaviors and contexts
induced follower responses” (p. 442). Through charismatic leadership the relationship
between leader and follower are highlighted. According to Levin, Muenchen, and Brooks
(2010) the leader and follower relationship is focused on passion and foresight and
emphasized that there were three stages of the leadership process: assessment of
environment, sensitivity to the needs of others, and strategic vision and articulation.

9
Social Control and Sensitivity to Followers’ Needs
The first component of the model is social control and sensitivity to followers’
needs. According to Grove (2010), who looked at leader’s skills and follower attributes,
social control is exhibited through charismatic leaders’ conscious effort of impression
management. Charismatic leaders are focused on “image building to express conviction,
self-confidence, and dedication to their vision” (p. 258). This construct is significant to
followers. Charismatic leaders use this ability to anticipate social expression as a measure
to be sensitive to the needs and values of their followers and in formulating and
communicating their vision (Grove, 2010). Conger, Kanungo, and Menon (2000) also
stated that one of the main attributes that separate charismatic leaders from other leaders
is a greater sensitivity to their followers’ needs. Grove (2010) By doing so charismatic
leaders are able to sense imperative cues from opponents and craft their message
appropriately. Through the use of social control charismatic leaders are able to identify
certain signals that are given by followers and adjust their actions accordingly. Leaders of
VTs must find a way to connect and stay engaged with their teams. With the skill of
social control, charismatic leaders will find a way to determine when their team members
/followers are disconnected from the team and address the issue immediately which will
be important in enhancing communication satisfaction.
Articulation
According to Riggio (1989), leaders who have social control are more
comfortable at public speaking. In order to lead successfully and bring about productive
change within an organization, a leader must be able to articulate the company’s goals

10
and vision in a manner that is understandable. Charismatic leaders are known to influence
their followers because of how they “interpret and integrate information in positive ways”
(Bono & Ilies, 2006, p. 320). According to Shastri, Mishra, and Sinha (2010), charisma is
the essence of how charismatic leaders articulate and formulate the vision of the
organization to their followers; charisma is done in an inspiring manner. The speech of
charismatic leaders has been described as energized and stimulating (Bono & Ilies, 2006).
Charismatic leaders have been described as having “high energy, high intelligence, and a
high level of interpersonal communication skills” (Levine, Muenchen, & Brooks, p. 580).
Articulation is a very important skill for a leader to have, especially one who leads
virtually.
Visionary
The last component of the leadership framework is one that brings everything
together—the ability to formulate an inspirational vision (Conger, Kanungo, & Menon,
2000). As stated by Shastri, Mishra, and Sinha (2010), charismatic leaders are known for
their ability to be a visionary and articulate it to others. According to Worden (2005)
“charisma involves the perception of ‘energy’ and ‘connection’ because it draws on a
‘large matter’, such as fundamental principles or visions touching on something felt as
real or scared” (p. 223). As charismatic leaders express their vision to their followers they
do it in a manner that places emphasis on the values that are shared by both the leader and
followers (Hayibor, Agle, Sears, Sonnenfeld, & Ward, 2011). By taking this approach,
leaders are able to engage and empower their followers because they are given a sense of
involvement.

11
Nature of the Study
The design of this study was survey research. According to Trochim (2006), the
survey research is vital in measuring phenomena in social research. Through the use of
surveys researchers are able to gather a substantial amount of data on particular
phenomena (Frankfort-Nachimias & Nachmias, 2008). According to Cengage Research
Methods Workshops (2005), a survey is the best way to gain insight on participants in the
study. Surveys yield information on participants’ emotions, beliefs, and attitudes toward
an issue.
I used the Conger-Kanungo questionnaire/survey on property managers (in the
United States and Canada) to identify the perceptions of charismatic leadership qualities
of VT leaders’ and the Communication Satisfaction questionnaire to determine the
correlation between communication satisfaction and charismatic leadership. The study
population consisted of surveying property managers from various locations within the
United States and Canada.
The use of e-mail survey research was appropriate for this study because it was
confidential and cost-effective and it produced the data needed from the participants in
the study and among other qualities it provides privacy in response. The survey was an
email survey. The survey was used to measure property manager’s perception of their
regional manager’s charismatic leadership qualities and communication satisfaction
among virtual teams.

12
Definition of Terms
Charismatic Leadership: Leadership that encompass qualities that enhance
leaders and follower relationships. Charismatic leadership is seen a leader that has a
vision, one that is able to motivate others through their actions and behaviors. (Hayibor,
Agle, Sears, Sonnenfield, & Ward, 2011).
Communication Effectiveness: The flow of communication that is perceived as a
two-way process. It is the essence of presenting information and that is understood and
received properly by others.
Communication Satisfaction: The overall contentment of an individual’s
perception of their communication environment.
Virtual Teams: A virtual team is one that includes groups of individuals within an
organization that are distributed geographically into teams to accomplish the goals of an
organization (Siebdrat, Hoegl, & Ernst, 2009).
Assumptions
This study was subject to four assumptions: I assumed that (a) each of the
participants to the online survey was indeed the property manager; (b) the responses on
the survey in regard to their perception of their virtual team leader were honest; (c) the
participants understood the concept of virtual teaming; and (d) lastly, I also assumed that
the best method to determine if there is a relationship between charismatic leadership and
communication satisfaction is through a quantitative survey.

13
Scope and Delimitations
A quantitative survey approach was used to gauge the perception of managers
about charismatic leadership qualities and knowledge management on the enhancement
of communication in virtual teaming. The intention was not to delimit the use of other
research approaches; however, the study was completed under the assumption that the
best approach for the study was a survey. The participants of the study were regional
managers and property managers of a student housing management company. Regional
managers supervise and guide property managers in a virtual environment. The regional
managers are extensions of the corporate office and are charged with ensuring that all
company policies and procedures are fully implemented. In an effort to get complete
participation in the study, all property managers were included. The online survey of 46
questions was administered to 155 property managers.
Limitations
This study was subject to the following limitations that should be considered in
regard to the study.
The participants of the study were not required to complete the survey;
their participation was solely up to them, which created a participation
issue.
The study may be limited because the measures were the perception of
situations, which was based on their personal opinions, and thoughts,
which could be inaccurate or misleading.

14
Another limitation worthy of discussing was that the results of the study
could not be generalizable beyond the participants that completed the
survey
Other limitations to the study include: small sample size, geographically
area where participants’ were drawn from, and the type of organizations
they came from as well.
Lastly, because the survey was administered via the Internet, participants
were not able to ask questions for clarity; therefore, participants possibly
responded to the survey without fully understanding the questions that
were being asked.
Significance of the Study
The goal of this study was to research whether there is a relationship between
charismatic leadership qualities and communication satisfaction among property
managers that work in a VT. If it is determined that a relationship exists, then
organization leaders could use this information to enhance their regional managers’
leadership qualities and increase organization performance. Organizations would benefit
by gaining knowledge needed to transform virtual leaders into charismatic leaders, which
has been linked to the ability to forcefully articulate and inspire vision and communicate
to followers the sense of urgency and ownership of the organization vision that requires
change. The use of VTs provides organizations the opportunity to ensure information
flows throughout the organization. There is a lack of specific knowledge with regard to
how leadership and communication satisfaction relates to the success of VTs.

15
This study has implications for social change. It was assumed that the study
enhanced awareness of charismatic leadership qualities and its potential to enhance
communication satisfaction among VT members. If so, this would enhance social ties
among employees and bring about social networking. The end result would be a stronger
bond between mangers and VT members. This, in return, would yield individuals who
could go out into the community with a different look on communication as a whole and
exercise the skills they learned within society.
Summary
In the study I analyzed whether a relationship exists between charismatic
leadership qualities and communication satisfaction among VTs. Within Chapter 1,
background information on the research direction was provided, which addressed: the
problem, the purpose, research questions, theoretical framework, and the significance of
the study. The background information demonstrated the usage of VTs; however, there
remains a gap in research that specifically provides knowledge and understanding on how
charismatic leadership qualities can be applied to reach VT satisfaction, specifically as it
pertains to communication.
Chapter 2 is a review of the literature on VTs, charismatic leadership qualities,
and communication. The literature review critically analyzes and evaluates research and
concepts presented by other researchers on charismatic leadership and communication.
Chapter 3 describes the research methodology and the instrument used for measuring the
perception of charismatic leadership qualities and communication. Chapter 3 also
includes information on the choice of population and sample procedure. The data is

16
interpreted in Chapter 4. Chapter 5 provides the conclusion, recommendations for future
studies and practice and the social significance of the research.

17
Chapter 2: Literature Review
One of the main problems with virtual teaming in organizations is
communication. The current study, based on the problem statement and research
questions, was designed to examine the perception that property managers had of
charismatic leadership qualities of regional managers and its possible relationship to
communication satisfaction among VTs. This literature review concentrated on the
following topics: VTs, and the constructs of charismatic leadership and communication.
Literature Search Strategy
The strategy used to search for resources for related information was done using
key words to search for relevant peer-reviewed articles and dissertations on charismatic
leadership qualities and communication satisfaction, the following databases were used:
ERIC, ProQuest, Sage, and Thoreau. Thoreau database provided a number of resources
such as scholarly journals and dissertations from multiple databases. While many views
of leadership and communication were relevant in the literature, the most significant area
in this study was determined to focus on charismatic leadership qualities and
communication satisfaction of virtual teams. The following keywords were used: VTs,
charismatic leadership, communication, managers, and leaders. The following sections
will provide and in-depth overview of VT, charismatic leadership, and communication.
Virtual Teams (VT)
A VT is one that includes groups of individuals in an organization that are
distributed geographically into teams to accomplish the goals of an organization
(Siebdrat, Hoegl, & Ernst, 2009). According to the VT project of Gatlin-Watts, Carson,

18
Horton, Maxwell, and Maltby (2007) a VT approach is an inexpensive means to
internationalized learning. VTs allow organizations to communicate across distances
without travel; technology is credited for such opportunities (Bergiel, Bergiel, &
Balsmeier, 2008). Businesses have moved towards VTs for efficiency reasons: reduced
real estate expense, increased productivity, higher profits, improved customer service,
access to global markets, and environmental benefits (Nydegger & Nydegger, 2010).
Bergiel, Bergiel, and Balsmeier (2008) conducted a study that was grounded by in
the literature and based on interviews with experts in the field of leadership and VTs.
Their goal was to identify and discuss the advantages and problems associated with
managing VTs (Bergiel, Bergiel, & Balsmeier ,2008). They identified five factors in the
success of VTs: trust, communication, leadership, goal setting, and technology.
A study by Lu, Wabtson-Manheim, Chudoba, and Wynn (2006) came up with
similar results of the study from Bergiel, Bergiel, and Balsmeier (2008). According to
Lu et al. (2006), four areas affect the vitality of teamwork: communication, trust, team
participation and coordination, and work outcomes. Lu et al. (2006) surveyed 1200
employees at Intel. They also conducted in-depth interviews as a measure to understand
the aspects of virtual effect on team performance (Lu et al., 2006). The study used the
following areas that were identified as areas that are affected by virtuality:
communication, coordination, trusts, and work performance. The results of the study
were that distance did not create adverse affect on teamwork. There were a number of
practices that were identified that affect and interfere with the areas identified. The use of
different information and communication technology was noted to reduce work

19
performance. The uses of multiple different ICTs created the challenge for VTs. The
switching back and forth of tools to complete tasks created the challenge. The authors
implied that serious consideration should be given to the number of members placed in
VTs and evaluation of the ICT tools that will be used.
Communication is important within VTs. Largely due to the fact, VTs do not have
the opportunity to conduct face-to-face meetings therefore it is vital for other provisions
to be done to ensure a productive means to communicate. According to Bergiel et al.
(2008) technical tactics such as telephone, teleconference, videoconference, team chat
rooms, voice-mail, e-mail, faxes and computer-mediated conferencing (CMC) are great
mechanisms to use to create positive environment for communication. In the research of
Nydegger and Nydegger (2010) they discussed similar findings; in their article they
stated that: “conference calls, teleconferencing, and telecommuting as ways of helping
people do their jobs more effectively, efficiently, and conveniently” (p. 69).
Nydegger and Nydegger (2010) reviewed research conducted by experts in the
field and presented similar findings as discussed previously by the works of Bergiel et al.
(2008) and Lu et al. (2006). Communication and mechanisms of communicating between
VTs is an important factor to consider in the success of VTs (Nydegger & Nydegger,
2010). The authors concluded in their paper that in order for team leaders, supervisors,
and managers to be successful in a virtual environment, they must design a culture that
fosters an open line of communication and trust and respect are key components in
building that foundation (Nydegger & Nydegger, 2010). Prachyl, Quintanilla, and
Gutierrez (2011) discussed VTs from an education standpoint; they identified two

20
schools that developed a collaborative course as a measure to increase international
experiences. The two schools were Instituto Tecnologico y de Estudios Superiores de
Monterrey (ITESM) and Texas Wesleyan University (TWU) (Prachyl, Quintanilla, &
Gutierrez, 2011). The study was to provide a business course to observe international
experiences for prospective students. The two schools were similar in size and goals. The
business course was designed in a manner, which required students from both cultures to
work in collaboration together in the course. The students were to collaborate with one
another through various communication mechanisms. Similar to the communication
mechanism used by Bergiel, Bergiel, and Balsmeier (2008), Lu et al. (2006), and
Nydegger and Nydegger (2010), Prachyl, Quintanilla, and Gutierrez’s (2011) study used:
chat rooms and threaded discussions/e-mails. They also used a couple of different
mechanism that was not discussed in Bergiel, Bergiel, and Balsmeier (2008), Lu et al.
(2006), and Nydegger and Nydegger (2010) study and it was the use of file sharing and
scheduling/calendar (Prachyl, Quintanilla, & Gutierrez, 2011). They also used WebCT, a
course delivery system.
According to Hajro and Pudelko’s (2010) study on the important skills needed for
leaders that manage multinational teams (MNTs), virtually the transfer of knowledge and
communication is a vital skill required of leaders. Hajro and Pudelko (2010) defined
MNTs as working groups that include three or more individuals from two or more
different countries that have been tasked with fulfilling an organization’s task. According
to Hajro and Pudelko (2010) there are a number of research project that have shed a
negative tone on MNTs and their quest in their study was to present and explain the

21
factors that enable effective working MNTs which address through equipping leaders
with the competencies needed to successfully lead MNTs.
Through a series of problem-centered interviews data was collected from 38
MNTs leaders and 32 MNT members from five countries. The results of the interviews
yielded a number of competencies that leaders should possess; however, there were two
that appeared most frequently during the interviews and they were: knowledge
management and transfer. In order for leaders to lead effectively, they must be
knowledgeable and know how to communicate between team members.
The team leader plays a fundamental role in shaping and blending VTs. They
must be able to handle and dissolve conflict fairly, objectively assess how well the team
is functioning, and have the ability to set and measure goals. The role of the team leader
is also to keep the team on track towards reaching the organization’s goal (Bergiel, et al.,
2008). According to Lu et al. (2006) the role of the team leader is also to organize and
synchronize the workflow and activities of the team members. Effective and satisfactory
communication enables management task to be accomplished and will be discussed in
great depth within this chapter.
Advantages and Disadvantages of VTs
There are a number of advantages that should be highlighted as one seeks to gain
an in-depth understanding of VTs. According to Drouin, Bourgault, and Gervais (2010),
the use of VTs allows organizations to have the ability to have team members working
around the clock because of different time zones, which may increase their competitive
edge. Drouin et al., 2010) conducted the study to gain a deeper understanding of the
22
systems that are used to assist VTs in the effort to accomplish their goal. They reported
findings of an empirical case study on two Canadian-based high-tech companies. The
data was collected and gathered through the use of interviews. The participants of the
study were managers who had worked in a VT environment. A call was made to
reorganize and rethink the organizational structure of the internal system as a measure to
provide consistency and effective support for VTs. The fact that VTs include changes in
processes such as hierarchy changes, changes of resources allocations and the
transformation of how processes are done such as minimum supervision, establishment of
how the flow of information is disseminated required a method to provide the support
needed to serve these types of programs (Drouin et al., 2010).
Drouin, et al. (2010) conducted the study over the time span of 6 months. Data
were collected through in-depth interviews and archival research. The approach of the
case study included the review of identified structural factors and processes that we
presented in the literature reviews that Drouin et al. (2010) conducted. The structural
factors that shaped VT operations were: individuals (core element), technology
(facilitates team collaboration), and operational context (which can be broken out into
two categories distribution and nature task). As it relates to distribution, researchers
questioned if location of team managers and relationships with members had an affect on
learning and management. The nature of tasks relates to the functionality of the teams.
From a process standpoint, the study focused on all of the interactions that happen within
VTs. The factors considered in the study were: communicational (interaction through the
exchange of ideas), relational (socioemotional interaction), and functional (adaption to

23
methods to ensure functionality). While considering and adapting the structural factors
and process components of VTs; the authors highlighted the importance of having
support systems. The functionality and success of VTs is accomplished through
organizational support systems.
The support systems identified in the case study both directly and indirectly
influenced the communicational, relational, and functional processes of the VTs. The
case study used the components of VTs and the support systems to build their interview
questions. Over the course of 6 months, nine managers were interviewed with a focus on
relational, communicational, and functional and structural factors. The authors concluded
that there existed a strong influence between organizational support and functionality
processes. The results were that processes have more bearing than structural factors.
Bergiel et al. (2008) identified the following advantages in addition to those
presented by Drouin et al. (2010): (a) reduction in travel time and cost, (b) increased
talented recruited employees, (c) engender originality among team members, and (d)
promotion of equality and equity. According to Nydegger and Nydegger (2010), VTs
presented a form of intimacy among members that could be linked to the comfortable and
convenient environmental setting that is provided through teams. VT members are often
given the freedom to work where they feel they can be the most productive. Some VT
members usually conduct work in the comfort of their own home. VTs are able to choose
when, where, and how they would like to work. All of the above provides and
opportunity for VTs members to perform in an environment where they are the most
comfortable.

24
While there are many significant advantages to VTs there remain some
disadvantages as well. The lack of being technology knowledgeable could have a
drawback for some VT members (Bergiel et al., 2008). A virtual structure may not be the
right operational environment and may be viewed as inappropriate psychologically
working space (Bergiel et al., 2008). Some studies have identified another measure of
cost as a drawback for VTs. According to Nydegger and Nydegger (2010) the cost to
setting up some of the technological programs and maintaining them can be expensive,
the lack of personal interaction, and the absence of nonverbal cues have also been
identified as disadvantages.
There are a number of factors to be considered in order to successfully implement
and manage VTs. Team leaders must be equipped with the skill to overcome cultural
differences, they should strategically and carefully reflect on technology use and choose
the most appropriate measure for their team and provide support, take the lead and
coordinate team activities, and they must engage team members and encourage trust
throughout the assigned project. In order to manage such teams efficiently and effectively
leaders must realize the importance of their role. Daily interaction and communication
from the team leader and the team members will hold the VTs together. Making social
connection with team members is vital in VTs. They must be able to articulate the
company’s vision efficiently while at the same time motivating and gaining the buy-in of
those that they are leading. The challenge of leadership and communication within VTs
can be answered with charismatic leaders and a focus on communication satisfaction.

25
Theoretical Base
The literature was synthesized on the theoretical framework of charismatic
leadership. The literature review presents an overview of the use of VTs. There are three
key constructs of charismatic leadership that the literature review focused on: social
control and sensitivity to followers’ need, ability to articulate, and the skill of being a
visionary. Through the use of social control and sensitivity to followers’ need charismatic
leaders will be able to connect and identify various signals that maybe exemplified by
their followers. In doing so, charismatic leaders are able to take the cues that are given
and make adjustments in their behavior as a measure to increase communication
satisfaction and overall satisfaction of leadership.
The next construct that is linked to the literature review is the skill of articulation.
One of the main arguments within the virtual workforce is the issue with communication.
It is imperative that leaders are able to communicate at an effective rate. Charismatic
leaders are known to have a positive influence on their followers because of their method
of articulation and being able to energize and stimulate their followers (Bono & Illies,
2006). The skill of articulation is identified in the realm of the literature review. Similarly
to the construct of articulation, the literature review also encompasses the skill of being a
visionary.
Literature Review
Charismatic Leadership
Across the discipline of leadership, research has shown that charismatic
leadership can have a profound and positive influence on employees and the success of

26
an organization. Lapierre, Bremner, and McMullan (2012) added that not only do
charismatic leaders have an influence on followers within organizations and the
organization itself; they could potentially have a positive affect on society. The
phenomena of charismatic leadership is one that is known to positively influence
followers and inspire followers to accept the mission and vision that is being presented to
them (Lapierre et al., 2012). Through charismatic leadership, followers are stimulated
and are inclined to go above and beyond what is expected of them (Lapierre et al., 2012).
There are a number of tools available to measure for charismatic leadership; however, I
focus on the use of the Conger-Kanungo Charismatic Leadership Questionnaire. Conger
and Kanungo (1994) developed a model as a means to measure perceived charismatic
behavior of leaders. There was a set of behavioral characteristics that were identified and
used as part of the scale that Conger and Kanungo (1994) were introducing. “According
to the model, charismatic leadership is an attribution based on followers’ perceptions of
their leader’s behavior” (Conger & Kanungo, 1994, p. 442). The model was broken into
three stages of leadership process that included marked behavioral components:
environmental assessment, vision formulation, and implantation stage.
After review of a number of studies and literature reviews Conger and Kanungo
(1994) identified 49 constructs that they believed described various behaviors of
managers that were identified by those they lead as charismatic. Conger and Kanungo
(1994) sampled 120 subordinate managers and surveyed them for their views on the 49
constructs of charismatic leader and as a result 24 constructs were eliminated, leaving 25
constructs to be tested for reliability and validity. A questionnaire was designed from the

27
25 constructs. Data were collected from 488 managers that worked at four organizations
within the United States and Canada. The results from the study indicated that there were
concrete psychometric properties of the survey and that it passed the test of reliability and
validity.
Socialized Charismatic Leadership
The first construct of the proposed leadership framework that was used was
charismatic leadership. The pioneer of charismatic leadership was the German socialist
Max Weber (Conger & Kanungo, 1994). His quest was to “explain the forces of
individual creativity and responsibility under the term ‘charisma’” (Conger & Kanungo,
1994, p. 440). Weber’s idea was that leaders possessed extraordinary qualities. Brown
and Trevino (2006) defined charisma as the essence of providing “followers with a clear
sense of purpose that is energizing; a role model for ethical conduct which builds
identification with the leader and his or her articulated vision” (p. 955). A key aspect
discussed by Brown and Trevino (2006) as it related to the importance of leaders
possessing the qualities of charisma is that of the ethical values that are replicated by
socialized charismatic leaders “and shared by work group members are the standards
used to guide employees to engage in normatively appropriate conduct and refrain from
normatively inappropriate conduct” (p. 956). Brown and Trevino (2006) were interested
in determining the effect that socialized charismatic leadership would have on workplace
deviance. Lapierre et al. (2012) defined socialized charismatic leadership as “leadership
that is based on egalitarian behavior, serves collective interests, and develops and
empowers others” (p. 252). Brown and Trevino (2006) hypothesized that socialized

28
charismatic leadership would be negatively associated with deviant behavior in the
leaders’ work group. The study was administered by distributing survey packets via
company internal mail. They received a response rate of over 75.6%. Socialized
charismatic leadership was measured with a 12-item charisma dimension. The results of
the study demonstrated that the study was the first study to demonstrate a relationship
between socialized charismatic leadership and reduced deviance in work groups. The
effect of socialized charismatic leadership upon employees is exactly the behavior needed
to promote corporate social responsible businesses. According to Grove (2005)
charismatic leadership can be directly linked to the followers’ performance and attitudes
toward organizational change. Grove’s (2005) study was developed to evaluate how
charismatic leaders play a role in followers’ perception and adaption to organizational
change. The study evaluated the effect that the following variables on organizational
change: social control, emotional expression, emotional control skills, and charismatic
leadership (Grove, 2005). Grove conducted the study on 108 senior organizational
leaders and 325 direct followers from 64 organizations. There were a number of different
scales used in the study to measure leadership social and emotional skills, charismatic
leadership behavior, organizational-change, openness to organizational change, and
leadership effectiveness. The study suggested that there were two key components to
organizational change (a) leadership behavior, and (b) followers openness. Through a
leader’s behavior they must be capable of resistance to change by encouraging followers
to feel the need for change (Grove, 2005). They have to have the ability to forcefully
articulate and inspire vision and communicate to followers the sense of urgency and

29
ownership of the vision that requires change (Grove, 2005). Finally the study suggested
that leaders must be skilled in social situations and adjust their behavior to changing
dynamics of their work group (Grove, 2005).
Brown and Trevino’s (2006) study yielded results that supported the claim that
socialized charismatic leaders led teams that had reduced work deviance. Another
positive relationship between charismatic leaders and socialization was social control
skills, which was discussed in Grove’s (2005) study. An individual with social control
skills are those that are “tactful, socially adept, self-confident, and excel in social role-
playing abilities” (Groves, 2005, p. 258). According to Groves (2005) the use of social
control skills when exemplified within charismatic leaders yielded leaders that are able to
influence supporters and critics in regard to their vision and its appropriateness for the
organization. Groves (2005) also suggested that it is imperative that charismatic leaders
must be “adept in social situations and adjust their behavior to the changing dynamics of
their work group” (p. 273). Charismatic leaders that exhibit social control also place an
emphasis on the needs of their followers. The results of Levine, Muenchen, and Brooks
(2010) study concluded that charisma “is the ability to listen, empathize with and
understand others” (p. 584). Charismatic leaders are known to be genuine and are
attentive listeners; they are slow to speak and know when it is appropriate to speak. The
social aspect of charismatic leadership is an important construct in the enhancement of
VT leaders and the improvement of communication.
Similarly, to the result of Grove’s (2005) study, Lapierre et al. (2012) study
focused on the importance of leaders being conscious of the social aspect of leadership

30
and its affect on behavior. Lapierres’ et al. (2012) study approached the study of
charismatic leadership from a different angle. Lapierre et al. (2012) presented six
propositions in their theoretical paper on employees’ passive and proactive followership
behavior and its influence on their manager’s display of socialized or personalized
charismatic leadership. Charismatic leadership has been known for the positive affect that
it has in organizations, however; there is another side of charismatic leadership that is
discussed by Lapierre et al. (2012). Socialized charismatic leadership (SCL) is known as
the positive expression of the charisma in leaders whereas; personalized charismatic
leadership (PCL) is the negative manifestation of charisma (Lapierre et al., 2012). The
main objective and goal of SCL is to work in collaboration with followers to ensure that
their needs and concerns are heard and that the vision signifies a joint and shared interest
(Lapierre et al., 2012). Personalized charismatic leaders are those concerned primarily
with personal motives (Lapierre et al., 2012).
According to Lapierre et al. (2012), social interaction plays an important role in
the influence that followers have on the constraint or enablement of charismatic
leadership within managers. In Lapierre et al. (2012) quest to understand the followers
influence on charismatic leadership behavior they looked at proactive and passive
followership behaviors of employees and the influence of followership on manager’s
positive affect and psychological empowerment. They concluded, “managers will more
strongly display the form of charismatic leadership that they have the greatest
predisposition for (personalized or socialized) when their group of employees

31
predominately displays the type of followership that is most consistent with their
charismatic inclination” (Lapierre et al., 2012, p. 258).
Qualities of Charismatic Leaders
An important quality of charismatic leaders is the qualities they possessed that
have been shown to be influential in their satisfaction as a leader. Charismatic leaders’
possessed qualities that are able to transform the mindset of those they lead from their
present state of mind to an improved future state (Groves, 2005). It is this ability that is
important to transforming corporations into successful virtual entities. A corporation that
is being led by a charismatic leader will be more equipped to transform corporations. The
belief is that social change will occur because the charismatic leader’s display of
“sensitivity to member’s needs, environmental sensitivity, vision, and articulation,
personal risk, and unconventional behavior” (Groves, 2005, p. 256). In order to
implement change, leaders must be sensitive to followers needs, they must have social
control, which allows them the ability to communicate their vision and recognize when
there is a need to refine their message (Groves, 2005). According to Senge (2006),
charismatic leaders are recognized by their ability to exhibit clarity and the persuasive
manner in which they present their ideas as well as their level of commitment to learning
more. In Senge’s (2006) chapter on the development of leaders, he applauded the concept
of leaders and charisma. He stated that leaders that possess charismatic leadership
qualities are able to encourage confidence in their followers. Similar to the constructs
discussed by Groves (2005) and Senge (2006) charismatic leaders are also known for
their “high energy, high intelligence, and a high level of interpersonal communication
32
skills” (Levine, Muenshen, & Brooks, 2010, p. 580). Levine et al. (2010) conducted a
study to evaluate various scales and their use in measuring charismatic communication.
Their study consisted of surveying 422 undergraduate and graduate students that attended
a large Southeastern University (Levine et al., 2010). The questionnaire consisted of
questions from the following scales that are well known in the research world of
charismatic: Multidimensional Leadership scale, Conger and Kanungo Charismatic Scale,
and Romance Scale. The results from the survey provided a very thorough understanding
of charismatic leadership however; it fell short of measuring charismatic leadership
(Levine et al., 2010).
As researchers studied charismatic leadership qualities they each built their study
around the three stages of leadership processes, which are behavior charismatic qualities
pioneered by Conger and Kanungo (2000). The first stage was environmental assessment
which during this stage the leaders assessed the environment for potential growth for
organization (Shastri, Mishra, & Sinha, 2010). During this stage is also where Conger
and Kanungo (2000) pointed out the perception of charismatic leaders and their desire to
change the status quo. Shastri et al. (2010) study consisted of randomly surveying 147
employees from an eastern and northern India organization. The purpose of the study was
to evaluate the relationship between charismatic leadership and organization
commitment. The instruments used in the study were Conger and Kanungo Charismatic
Scale, Organization Commitment Scale, and Job Satisfaction. Shastri et al. (2010)
concluded from their study that there was a positive correlation between charismatic
leadership and organization commitment.

33
The second stage has been commonly referred to as the vision formulation stage.
During this stage is also where the vision of the leader is strategically and carefully posed
and is done in an inspirational manner (Shastri et al., 2010). The final stage, the
implementation stage is known as the stage where charismatic leaders engage in personal
risk. During this stage is where leaders “present self confidence, demonstrating belief in
the potential outcome of the vision” (Shastri et al., 2000, p. 1947). Subordinates of such
leaders see this as an act of self-sacrifice. The final phase is also where subordinates are
empowered by the sacrifices of their leaders. The behaviors and stages discussed are
believed to yield follower support and commitment. According to Bono and Illies (2006)
positive emotions of charismatic leaders can also have a positive influence on their
followers, as positive emotion is believed to be transferred to them.
Bono and Ilies (2006) conducted a series of studies on emotions in charismatic
leadership process. Positive emotions in leaders were linked to positive mood by
followers. In their first study, 326 community leadership participants in Pennsylvania,
Texas, California, and British Columbia received a survey packet (Bono & Ilies, 2006).
The survey packets included a survey to be completed by both the leader and the
follower. The leader’s survey asked questions regarding their vision whereas the
followers’ survey was asked questions to measure charisma qualities of the leader (Bono
& Ilies, 2006). There were 103 leaders and 319 followers that responded to the survey.
The Multifactor Leadership Questionnaire was used to measure charismatic leadership
and each leader was asked to provide their vision for the group that they supervised and
their responses were transcribed to a Word document. After the leaders gave their

34
responses the authors used Linguistic Inquiry Word Count that was used to measure the
extent to which the leaders articulated positive emotions in the vision (Bono & Ilies,
2006). Results of the study were that there was an association between followers’ reports
of charisma of the leaders and the use of positive emotions words in their vision (Bono &
Ilies, 2006).
In Study 2, Bono and Ilies (2006) used student participant’s that were enrolled in
a masters level Leadership and Personal Development course at Midwestern University.
Survey packets were mailed to the 71 students before the start of class (Bono & Ilies,
2006). The participants were asked to contact six individuals that observed them in a
leadership role and have them rate their leadership behavior. During the first day of class
the participants were asked to present a 3-5 minute presentation that was geared toward
persuading their peers and potential employees that they were the best person for the
leadership position (Bono & Ilies, 2006). Each speech was videotaped and coded for
expression of positive emotions, effectiveness, and attraction to the leader. Results of
Study 2 were that there was positive association between participants’ charisma and their
expressions of positive emotions that was conveyed through the videotaped speech and
there was also linkage to positive emotions, ratings of effectiveness and ratings of
attractiveness. The results of Study 1 and Study 2 denoted that those individuals found to
have high charisma also expressed via writing and speeches positive emotions. There
were four studies discussed by Bono and Ilies (2006) and the consensus of all of the
studies was that the positive behavior through positive emotions yielded positive
emotions for followers. When followers are happy and working in a positive atmosphere

35
they are more inclined to work harder or at their best. Charismatic leaders enable this
type of environment when the lead through positive emotions, which in the end suggest
increased organizational success (Bono & Ilies, 2006).
Hypothesized Relationships Between Charismatic Leadership Qualities and
Communication Satisfaction
According to Conger, Kanungo, and Menon (2000) when an employee (property
manager) perceives that their leader (regional manager) exhibits charismatic leadership
qualities per the constructs of Conger-Kanungo model “they will not only attribute
charisma to him or her (follower attribution effect) but also change their attitudes, values,
and behavior consistent with what the manager wants from them” (p. 749). Charismatic
leaders have been linked to producing high performing employees, which include
employees that are motivated and satisfied with their job (Conger et al., 2000). This will
lead one to believe this will enhance the effect of communication satisfaction and
employee engagement among VTs. The review of the study discussed by Conger et al.
(2000) revealed that charismatic leadership qualities had been strongly linked to the
positively correlation between the employees’ performance and job satisfaction.
Conger et al. (2000) conducted a study to test the hypothesis that followers would
be able to be characterized by how they exhibit certain qualities of their leader, which
was reverence, trust, and satisfaction. The population studied was managers from a large
diverse company. The managers that participated in the study were attending a training
session in which 252 managers completed the questionnaire that measured charismatic
leadership and follower effect. The results of the study concluded that the reverence that

36
is developed for a leader was based on the perception that their leaders were sensitive to
the environment (Conger et al., 2000). The authors also concluded that leaders’ ability to
be sensitive to the needs of their followers was important and played a role in the
follower effect of reverence as well as the leaders ability to articulate their inspiring
vision (Conger et al., 2000).
Communication and Satisfaction in VTs
According to Nydegger and Nydegger (2010), communication and mechanisms of
communicating between VTs is an important factor to consider in the success of VTs.
Team leaders, supervisors, leaders, managers are encouraged by Nydegger and Nydegger
(2010) to develop the required culture that fosters an open communication among VTs. I
believe that VTs that are led by charismatic leaders is one way to ensure the development
of the culture of satisfactory communication.
Within the study Levine, Muenshen, and Brooks (2010) looked at
transformational and charismatic theories of leadership and the importance of
communication. In the content of communication, charisma was denoted by emphasizing
the significance of projects, by sharing their vision and by enhancing the confidence of
those they lead and emphasizing the common goal (Levine et al., 2010). When the aspect
of communication was studied within the Levine et al. (2010) study they were able to
find a connection between charismatic leadership and communication. In Levine et al.
(2010) review of communication behaviors among charismatic leaders that the leaders
were:

37
A good speaker, persuasive, interesting, effecting and entertaining able to
conclude from their study that. . . . they are effective while speaking to a group of
people, appeal to a group of people, understand what people want and need and
present ideas with confidence. (p. 585)
It is these qualities that are discussed and highlighted in Levine et al. (2010) study that
strongly suggested that VTs that are led by charismatic leaders would enhance the
satisfaction of communication among VTs. Charismatic leaders are good speakers,
motivational, stronger leaders, deliberate in goal setting and achieving goals, and they are
task oriented and open to group ideas (Levine et al., 2010).
Communication satisfaction has been linked to effective leadership (Neufeld,
Wan, & Fang, 2010). Neufeld et al. (2010) surveyed 179 executive MBA alumni that had
graduated from a Canadian business school, of the 179. The study consisted of two
groups, leaders and followers. There were 138 followers and 41 leaders that completed
the survey. The primary focus of the study was on the information gathered from the
follower survey. The study measured the following constructs: transformational
leadership, transactional contingent reward, leader performance, communication
effectiveness, and physical distance. Through effective communication, leaders are able
to help followers visualize and understand the why and how of company projects
(Neufeld et al., 2010). An effective leader is one that is able to motivate their followers
by including them in his vision (Shastri, Mishra, & Sinha, 2010). “Leadership is not
about enforcing the leader’s dream; it is about developing a shared sense of destiny”
(Shastri et al., 2010, p. 1948). Communication satisfaction is achieved through clear

38
understanding of ones responsibilities, vision and goals of the organization. According to
Conger, Kanungo, and Menon (2000):
Charismatic leaders differ from leaders by their ability to formulate and articulate
an inspirational vision and by behaviors and actions that foster an impression that
they are and their mission are extraordinary. As such, individuals choose to follow
such leaders in management settings not simply because of the leader’s’ formal
authority but out of perceptions of their leader’s extraordinary character. (p. 748)
Effective communication is largely related to shared understanding. Effective charismatic
leaders often communicate their message in a manner that is easily understandable to
followers; they also allow opportunity for shared ideas and opinions. Charismatic leaders
are attentive and concerned in what others think and feel which appeals to followers and
yields the opportunity for trust and commitment (Levine et al., 2005). It is believed that
through the studies that have been discussed on communication and communication
satisfaction the enhancement of communication among VTs that are being lead by
charismatic leaders will improve.
Charismatic Leadership and Employee Engagement
Sosik, Juzbasich, and Uk Chun (2011), approached the topic of charismatic
leadership from the standpoint of it being a principle component of transformational
leadership. Sosik et al. (2011) collected information from 377 managers regarding their
association with charismatic leadership as they investigated whether there is difference in
upper or lower management positions on moral reasoning as it is perceived by the 1731
subordinates that they supervised. Manager’s moral reasoning was measured by the

39
completion of the Defining Issues Test and charismatic leadership was measured through
administering the Multifactor Leadership Questionnaire (Sosik et al., 2011). According to
Babcock-Roberson and Strickland (2010) “the charisma component of transformational
leadership consists of providing followers with a role model for ethical conduct and a
clear sense of purpose that is energizing, and building identification with the leader and
his or her articulated vision” (p. 314). According to Babcock-Roberson and Strickland
(2010) the terms transformation leadership and charismatic leadership have often been
used interchangeable due to their theoretical overlap within research.
Babcock-Roberson and Strickland (2010) study revealed that there was a positive
relationship between charismatic leadership and work engagement. This was determined
through the administration of questionnaire packets that measured charismatic leadership
and work engagement. According to Sosik et al. (2011), charismatic leadership is defined
as the “ability to inspire enthusiasm and action in followers via personal attributes,
behaviors, and exemplary qualities of the leader, especially in situations ripe for change”
(p. 436).
Summary and Conclusion
The most effective method to improve businesses is through leadership. The
leadership framework when used will enhance communication among VTs. The literature
review contains the groundwork for the study and includes a number of concepts that
have been reviewed in the field of research. Through the framework presented in this
paper, managers will gain a new insight of knowledge on the positive effect that
charismatic leadership qualities have on communication satisfaction. It will enhance

40
manager’s knowledge level on the skills needed to transform VTs into social networking
entities, which will yield open communication that will ultimately yield an increase in VT
performance. I present the research design and rationale, setting and sample,
instrumentation and materials, data collection, and data analysis in details in Chapter 3.

41
Chapter 3: Research Method
The intent of the study was to explore the perception of charismatic leadership
qualities of VT leaders and its effect on communication among VT members within a
student housing company in the United States. In this chapter, I address, in-depth, the
research design, target population, the sample, sample procedures, instrumentation, data
collection, data analysis, and the threats to validity. The Statistical Package for the Social
Sciences was used to ascertain relationships that may exist. The relationships were
analyzed by using item descriptive analysis and inferential statistics.
Research Design and Rationale
I used a survey research design in this study. Data were collected with a web-
based self-administered electronic survey. According to Singleton and Straits (2010),
surveys provide an effective means to reveal social data, such as characteristics, opinions,
attitudes, or behaviors of a population under study. Survey research is inexpensive and
allows data to be gathered over a broad range of research topics. This study used an e-
mail survey, which ties directly into the use of Internet research. According to Suarez-
Balcazar, Balcazar, and Taylor-Ritzler (2009), there are four different ways to use the
Internet as a research tool and one was used to collect research data from participants.
The use of Internet research covers an array of areas including the use of web-based
survey designs; it is an easy way to get information and resources for both the researcher
and the participant.
A quantitative method was used to determine the perception of charismatic
leadership qualities of virtual leaders as well as the relationship of communication

42
satisfaction among VTs. It was chosen because of its ability to evaluate the relationship
between variables (Creswell, 2009). The analysis of the descriptive quantitative data
explored the relationship between the variables, charismatic leadership and
communication satisfaction. Data were gathered on job satisfaction, organizational
support, and leadership effectiveness. The variables discussed were believed to have a
positive or negative influence on the concept of communication satisfaction within VTs.
The study method was based on the research questions and applied instrumentation to
yield valid and reliable data that will be appropriate for application to the population.
Two other research methods were considered for the study: qualitative and mixed
methods. Qualitative research is an approach that asks questions, including open-ended
survey questions. This method allows the participants to answer, any way they like. They
are not limited to preset answers choices. Usually the questions are asked through
interviews and/or observations. Through a qualitative approach, researchers are able to
gain more in-depth responses regarding a phenomenon, largely due to the fact that they
not only obtain the answers to their questions but also can ask questions why (Creswell,
2009). But this type of approach can be time consuming. The researcher has to schedule
interviews and after conducting the interviews, transcribe the recordings or notes and
analyze and summarize them. A qualitative approach was not chosen because the
population was anticipated to be large. A qualitative approach is typically used for a
small population (Creswell, 2009).
The mixed-methods approach to research encompasses both qualitative and
quantitative approaches. The qualitative component allows the researcher to collect and
43
evaluate in-depth responses from the participants. The quantitative component to mixed
methods allows the researcher to collect numerical data such as asking the respondents to
rate their responses by categories. In order to take the research a step further the
researcher could ask the participants to explain why they chose the perspective rating.
Mixed-methods approach was not chosen because I was primarily interested in
determining if a relationship existed between the variables and access to the population
would not have been feasible for a qualitative approach.
The choice of using quantitative research approach as the most appropriate
method for the study was because I was interested determining if a relationship exist
between the variables of charismatic leadership qualities and communication satisfaction.
Quantitative research is an efficient method to obtain data expeditiously and if you need
to obtain data from a large group of participants. Quantitative data uses an instrument to
measure the potential relationship that may exist between variables. This approach is the
best cost efficient and is easy for participants to use.
A survey design was chosen because I want to evaluate the opinions of property
managers and their thoughts on the leadership qualities of their managers as well as their
opinion on communication. According the Creswell (2009), a survey design is used to
present quantitative data on the opinions, trends, and attitudes of a specific population of
interest. It is for this reason; I chose to use a survey design. Experimental design would
not have been useful in the study because the interest does not have to do with presenting
an intervention, which is the purpose of an experimental design (Creswell, 2009). The
study does not require the use of two groups, a control group or experimental group and

44
there will not be an invention or treatment of the groups therefore a quasi-experimental
design was not appropriate for the study either (Creswell, 2009).
Methodology
Population
The target population was property managers of a student housing management
company. The management company is one of the largest developer, owner, and manager
of student housing communities. The management company employs over 500 people.
The diverse staff ranges from higher executives to line staff. The total managed portfolio
at the time of the study consists of 187 properties with approximately 121,300 beds. The
properties are located in 32 states within the United States and two provinces in Canada.
Property managers from the 187 properties will be the target population for this study.
The property managers are led by virtual regional managers.
Sampling Procedures
I used a nonprobability (convenience) sample of property managers. According to
Frankfort-Nachmias and Nachmias (2008) convenience sampling is used when sampling
units are easy to obtain or can be obtained conveniently. I used convenience sampling
because through approval, I had access to the company’s e-mail list of student housing
property managers, which is the target population. The recruiting process consisted of a
survey invitation letter that will describe the study and was sent to 187- property
managers target population. The survey invitation and survey was sent through e-mail .
The survey was administered through surveymonkey.com.

45
Procedures for Recruitment
I obtained a list of 155-property managers from the company’s e-mail list. The list
of property managers excluding the property managers that I directly supervise was
representative across a number of regions within the management company. A sample
size calculator from Creative Research Systems (2012) recommends a sample size from a
population of 155 to be 111, which includes a 95% confidence level. While the sample
size recommended for the study is 111, I sent an invitation to the entire 155 groups of
property managers.
Data Collection
An online questionnaire consisting of 68 questions taken from the C-K scale
survey and the CSQ was used to collect data using surveymonkey.com an online survey
tool. A survey link was provided in the survey invitation letter that was sent through e-
mail. A sample invitation letter is provided in the appendix. Participants were asked to
complete the survey within 14 days of receiving the survey invitation. After 1 week, a
reminder e-mail was sent to all participants. After the 2 weeks, a final reminder was sent
and the invitation link remained live for an additional 14 days. The completion and return
of the survey indicated their consent to participate in the study.
The survey was limited to only property managers of the company that are
supervised by regional managers virtually. The SPSS integration package was purchased
as a measure to easily integrate data results from survey monkey for statistically analysis.
The link to the data from survey monkey was limited access only. Reminder e-mails were
sent on a bi-weekly basis for 4 weeks.

46
Instrumentation and Materials
In order to determine the strength that variables may have, Singleton and Straits
(2010) discussed a common research method, quantitative. Through the implementation
of a quantitative study, I was able to analyze the strength of the relationship between
charismatic leadership and communication satisfaction. According to Singleton and
Straits (2010), a quantitative study enables a researcher to study the relationship between
two or more variables as well as the strength of the relationship. Within the study the
participants completed the Conger-Kanungo Charismatic Leadership Scale (C-K) and the
Communication Satisfaction Scale (CSQ). The study variables were assessed in the
questionnaires that were administered to participants individually through e-mail . The
questionnaire was administered to the participants and it included an introductory letter in
which the purpose of the study was explained and anonymity was guaranteed.
Charismatic Leadership Scale
Using the 25-item C-K scale, I assessed the perception of virtual leader’s
charismatic leadership qualities. The participants indicated the extent that each statement
was characteristic of their virtual leader (supervisor) by using a 6-point Likert scale
ranging from 1 (very uncharacteristic) to 6 (very characteristic). The C-K scale has been
tested and retested for reliability and validity coefficients and the results of a number of
studies indicate that the scale has sound psychometric properties for adequate usage
(Conger, Kanungo, & Menon, 2000). Conger and Kanungo (1998) reported reliability
coefficients of 0.88 for the entire 25-item scale. The six subscales were tested for
reliability and the results yielded ranges of 0.62 to 0.84 alpha coefficients. The alpha

47
coefficients were obtained through the administration of the survey to 113 participants
twice within the 2-week interval.
Conger, Kanungo, Menon, and Mater (1997) tested for convergent and
discriminant validity by taking the scale scores of the C-K scale and correlating with the
scale scores of four other instruments. The two scales listed were the Bass Charisma
Scale and the Task Leadership Scale; the other instruments used were not listed in the
study. The relationship of the instruments looked at the correlation of the following
subscales of the C-K scale: vision and articulation, environmental sensitivity, and
sensitivity to member needs. There was not a scale to test unconventional behavior. The
results of the test showed that in the case where the subscales of the instruments were
comparable, correlations were high and in the instances where the subscales varied,
correlations were low which indicated a high degree of convergent and discriminant
validity for the subscales tested of the C-K instrument. As a result of the validity study
the 6th
subscale (does not maintain status quo) was removed because of lower reliability
and there was not an instrument to evaluate validity. They also reduced the instrument to
20 items as a result of eliminating the 6th
subscale, status quo.
Communication Satisfaction Scale
Communication satisfaction was assessed through the use of Downs and Hazen
43-item CSQ (1977). The scale was used to measure the overall degree of satisfaction
that the VT members perceive in this communication environment. The questionnaire is
clustered around eight factors that affect the level of satisfaction with communication
information, relationships, channels, and climates. The participants indicated the extent

48
that each statement is characteristic of their communication environment by using a 7-
point Likert scale ranging from 1 (very dissatisfied) to 7 (very satisfied).
In Downs and Hazen (1977) application of the survey instrument during a 2-week
interval reported a coefficient alpha reliability of 0.94. Downs and Hazen’s (1977)
communication satisfaction validity was tested by Crino and White (1981), who
determined validity through administering the survey to 137 supervisors that worked at
five different textile mills. Thorough factor analysis Crino and White found the eight
factors of Downs and Hazen’s (1977) communication satisfaction survey. A close
adherence to Downs and Hazen’s (1977) methodology reduces the need to produce new
evidence for validity and reliability.
Data Analysis
The survey data were analyzed and categorized by using quantitative descriptive
statistics. According to Field (2009), the analytic tool to use when evaluating the
relationship between more than one independent variable and one dependent variable, is
multiple linear regression. I used multiple linear regression to analyze the relationship
linking the independent variables charismatic leadership (CL) and its sub-dimensions:
sensitivity to members needs (SMN), strategic vision (SV), and articulation (ART); and
the dependent variable, communication satisfaction (CS).
The data taken from Survey Monkey were imported to the SPSS software where
the statistical analysis was performed. The first step was data cleaning. According to
Singleton and Straits (2010) data cleaning is a very important step before running
analysis on the data. Descriptive statistics included measures for mean, standard

49
deviation, minimum and maximum values. Through the use of multiple linear regression,
I was able to access whether there is a linear relationship between charismatic leadership
qualities and communication satisfaction. An alpha level of 0.05 was set to determine the
level of statistical significance. The general formula for the multiple linear regression is
used for this study.
Research Question 1
Is there an association between charismatic leadership qualities and follower
perception of leadership effectiveness among VTs? This question was measured using
items 1, 4, 6, 7, 8, 9, 12, 14, 20, and 25 of the C-K scale, which measured the levels of
charismatic leadership and follower perception of effective leadership. The following
questions on the CSQ scale were used to measure communication satisfaction: 19, 22, 23,
33, 34, 35, and 36. Multiple linear regression was used to determine the association
between charismatic leadership and follower perception of effective leadership and
communication satisfaction.
Research Question 2
Is there an association between the perceived subdimension (sensitivity to
members needs, strategic vision, and articulation) of charismatic leadership qualities and
communication satisfaction? This research question was measured by using the following
questions of the C-K Scale: 2, 3, 5, 10, 11, 13, 15, 16, 17, 19, and 21-24. The question
also measured by using the CSQ scale through items: 4-15, 17-20, and 26-28. A multiple
linear regression was used to determine the association between three subdimensions of
charismatic leadership and communication satisfaction.

50
Research Question 3
Is there an association between communication satisfaction and job satisfaction
among VTs? This research question was measured by using the following questions of
the C-K Scale: 5, 10, and 19. The question also measured by using the CSQ scale through
items: 1, 8, 9, 11, 13-16, 18-20, and 27. A multiple linear regression was used to examine
the association between communication satisfaction and job satisfaction.
Interval data was obtained from the completed surveys of the participants.
According to Cengage Research Methods (2005), linear regression is among the test
choices when the following assumptions are met: when scale of measurement is interval
or ratio and in the case of the study the data is interval. I chose regression because
according to Field (2009) regression is a statistical tool that is used to predict the value of
the independent variable from a dependent variable. According to Frankfort-Nachmias
and Nachmias (2008) statistical significance accounts for the association that occurs due
to an intervention rather than chance.
Protection of Human Participants
The responses captured from each participant were kept confidential. Participation
in the study was strictly voluntary. The web survey did not record the participants’ name,
address, or phone number in order to ensure privacy. The data was stored on a jump drive
that was kept in a locked filing cabinet at all times. The filing cabinet is only accessible to
me. The completion and return of the survey indicated participants’ acknowledgement of
consent. The Walden University Institutional Review Board reviewed and approved the
research (Approval # 02-26-14-0080635). Data will be maintained for 5 years. On April

51
1, 2019, the flash drive that contains the data will be broken in half as a means to destroy
the data.
Threats to Validity
The convenience sampling of participants was a potential threat to external
validity; the sample was not a fair representative sample of all property managers of VTs
in the United States. The study was the experiences taken from the population of a
student housing management company. Therefore, the results cannot be generalized to all
property managers. In order to improve the threat to external validity, it is recommended
to conduct the study in a variety of places, with different people and at different times
(Babbie, 2011). Property managers with a well-known student housing management
company were recruited from 187 property community locations across North America in
an effort to address the threat to external validity. A potential threat to internal validity
for this study was researcher bias since the researcher was a regional manager and well
aware of the study and potential outcomes. I controlled this threat by strictly reporting
only the results of the study according to the data analysis.
The study was conducted in an approved ethical manner. No data was gathered
prior to the approval from Walden University’s Institutional Review Board (IRB)
(approval number given in previous section). The participants’ names were not tracked
along with their responses as a measure to protect their rights. There was no personal
information gathered on the participants of the study and the participants were informed
the voluntary nature of the study. All data that was gathered is stored in a locked filing
cabinet and will be destroyed in 5 years.

52
Summary
I used a web survey to anonymously gather data on the perceptions of charismatic
leadership qualities of virtual leaders (regional managers) and communication
satisfaction. The property managers came from a number of different properties within
the United States and Canada. The survey questions were based upon C-K scale and
Downs and Hazen’s CSQ scale by using a 6- and 7-point Likert scale. In the next
chapter, the results of the data analysis are presented.

53
Chapter 4: Results
The purpose of the study was to determine the relationship of perceived
charismatic leadership qualities in VT leaders and communication satisfaction in VT
members. In this chapter, I provide the results from the C-K and CSQ scales. The data
collection process is discussed and the results are analyzed. The data presentation
included how multivariate linear regression was used to answer the research questions: Is
there an association between charismatic leadership qualities and follower perception of
leadership effectiveness among VTs? Is there an association between the perceived sub
dimension (sensitivity to member’s needs, strategic vision, and articulation) of
charismatic leadership qualities and communication satisfaction? Is there an association
between communication satisfaction and job satisfaction among VTs? Chapter 4
concludes with a summary of the findings.
Data Collection
Participants were property managers for a student housing company in the United
States and Canada were managed virtually. The sole requirement was that they had to be
supervised by a regional manager who did not work in the same office. Over 6 weeks,
four survey e-mail invitations went out to 155 property managers. The original number
was 187, but by the time the survey was administered, staff turnover had decreased the
number of staff property managers. Of the 155 managers who received the invitation, 28
completed the survey. Of the 28, one was incomplete, leaving 27 completed surveys or a
return rate of 17.4%. The sample size of 27 did not meet the proposed sample size of 111,
based on the Creative Research Systems (2012) sample size calculator.

54
Data Results
The results are built around the study’s three research questions.
Research Question 1
Is there an association between charismatic leadership qualities and follower
perception of leadership effectiveness among VTs?
H0: There is not an association between perceived charismatic leadership qualities
and follower perception of leadership effectiveness among VTs.
Ha: There is an association between perceived charismatic leadership qualities and
follower perception of leadership effectiveness among VTs.
This question was designed to gather information from VT members about their
perceptions of their regional managers’ charismatic leadership qualities, including
effectiveness. In addressing Research Question 1, multivariate linear regression was
performed by comparing each of the following questions from the CSQ Scale—19, 22,
23, 33, 34, 35, and 36 to each of the questions from the C-K Scale—1, 4, 6, 7, 8, 9, 12,
14, 20, and 25. Survey Question 19 of the CSQ Scale, which was analyzed in comparison
to the C-K Scale’s 10 survey questions. The analysis consisted of the perception of
communication satisfaction qualities regarding organizational communication and
whether those qualities motivated property managers to meet their goals showed the
following satisfaction levels:
Very Satisfied__________ 33.33%
Satisfied_______________33.33%
Somewhat Satisfied______14.81%

55
Indifferent_____________ 3.70%
Somewhat Dissatisfied___ 11.11%
Simply Dissatisfied_______3.70%
These results were compared against the perception of the charismatic leadership
qualities in measuring Survey Question 1 of C-K scale. The following results when
measuring their regional managers’ effect of influencing others by developing mutual
liking and respect:
Very Characteristic___________42.86%
Characteristic_______________ 35.71%
Slightly Characteristic________ 17.86%
Slightly Uncharacteristic_______ 3.57%
Uncharacteristic______________ 0.00%
Very Uncharacteristic_________ 0.00%
The significance level of 0.05 was established at the onset of the study. The
statistical analysis level was 0.863. Thus, the association between the survey questions is
statistically not significant. As discussed, Question 19 of the CSQ scale was run against
the remaining nine-survey questions. Survey Question 4 of C-K scale was analyzed next.
The following table gives the results for Question 4 regarding the perception of regional
managers’ entrepreneurial persona and their perception about whether they seized new
opportunities to achieve their goals:
Very Characteristic___________37.04%
Characteristic_______________22.22%

56
Slightly Characteristic________29.63%
Slightly Uncharacteristic_______7.41%
Uncharacteristic______________3.70%
Very Uncharacteristic_________ 0.00%
Multivariate linear regression test was calculated to compare the sets of survey
questions and the computed significance level was 0.238 and the association between the
sets of survey questions was not statistically significant. Survey Question 6 of the C-K
Scale used to measure the perception of regional managers’ use of nontraditional means
to achieve organizational goals was analyzed next and the results yielded:
Very Characteristic___________11.11%
Characteristic_______________ 11.11%
Slightly Characteristic_________33.33%
Slightly Uncharacteristic_______33.33%
Uncharacteristic______________11.11%
Very Uncharacteristic__________0.00%
Multivariate linear regression test was calculated to compare the sets of survey
questions and the computed significance level was 0.526. Thus, the association between
the sets of survey questions was not statistically significant.
Survey Question 7 of C-K Scale, used to measure the perception that regional
managers were engaged in activities involving considerable self-sacrifice in pursuing
organizational objectives, yielded the following characteristic results:
Very Characteristic__________25.93%

57
Characteristic______________ 29.93%
Slightly Characteristic_______ 33.33%
Slightly Uncharacteristic_____ 11.11%
Uncharacteristic_____________ 0.00%
Very Uncharacteristic_________0.00%
The statistical analysis level was 0.532 between the sets of survey questions.
Thus, the association between the sets of survey questions was not statistically
significant.
Survey Question 8 of the C-K Scale, used to survey the perception of regional
managers’ recognition of constraints in the physical environment that may stand in the
way of achieving organizational objectives showed the following characteristic
percentages:
Very Characteristic__________ 18.52%
Characteristic_______________51.85%
Slightly Characteristic________18.52%
Slightly Uncharacteristic______11.11%
Uncharacteristic______________0.00%
Very Uncharacteristic_________ 0.00%
The computed multivariate regression significance level was 0.646 between the
sets of survey questions. Thus, the association between the sets of survey questions was
not statistically significant.

58
Survey Question 9 of the C-K Scale surveyed the perception of regional manager
as advocates that follow nonrisky, well-established course of action to achieve
organizational goals. The characteristic results were:
Very Characteristic___________14.81%
Characteristic_______________ 44.44%
Slightly Characteristic________ 29.63%
Slightly Uncharacteristic_______ 7.41%
Uncharacteristic______________ 3.70%
Very Uncharacteristic__________0.00%
The result from the multivariate linear regression was a significance level of
0.488.
Thus, the association between the sets of survey questions was not statistically
significant. Survey Question 12 of C-K Scale was used to measure the perception that
regional managers took high personal risks for the sake of the organization. The
characteristic results were:
Very Characteristic___________11.11%
Characteristic_______________ 25.93%
Slightly Characteristic________ 29.63%
Slightly Uncharacteristic______ 25.93%
Uncharacteristic______________7.41%
Very Uncharacteristic_________ 0.00%

59
The significance level of 0.957 between the sets of CSQ and C-K Scale survey
questions was not statistically significant.
Survey Question 14, designed to check the perception of regional managers’
consistency to generate new ideas for the future of the organization, had the following
characteristic results:
Very Characteristic___________14.81%
Characteristic_______________ 44.44%
Slightly Characteristic_________29.63%
Slightly Uncharacteristic________7.41%
Uncharacteristic_______________3.70%
Very Uncharacteristic__________ 0.00%
The results of computed multivariate linear regression was 0.173 and, was not
statistically significant.
Survey Question 20 of the C-K was used to measure the perception that the
regional managers incur high personal costs for the good of the organization and the
characteristic results were:
Very Characteristic____________7.41%
Characteristic_______________ 29.63%
Slightly Characteristic_________33.33%
Slightly Uncharacteristic_______18.52%
Uncharacteristic_____________ 11.11%
Very Uncharacteristic__________0.00%

60
The significance level of 0.419 among the sets of survey questions was not
statistically significant.
Survey Question 25 of C-K Scale was used to determine the perception that
regional managers engage in activities involving considerable person risk in pursuing
organizational objectives. The characteristic results were:
Very Characteristic___________ 0.00%
Characteristic_______________22.22%
Slightly Characteristic________18.52%
Slightly Uncharacteristic______37.04%
Uncharacteristic_____________11.11%
Very Uncharacteristic________ 11.11%
The computed multivariate linear regression significance level was 0.029. Based
on the preset significance level of 0.05 the association between survey Question 25 of C-
K scale and the survey question of CSQ scale are statistically significant. As presented in
Table 1 of Appendix E, based on the preset significance level of 0.05 the association
among the sets show only one variable that is statistically significant, which is Survey
Question 25.
The next communication satisfaction construct used to test against the same set of
charismatic leadership constructs was survey Question 22 of the CSQ scale used to
measure the extent to which the property managers’ regional managers offered guidance
as their supervisor for solving job related problems. For Question 22, the results were:
Very Satisfied________________40.74%
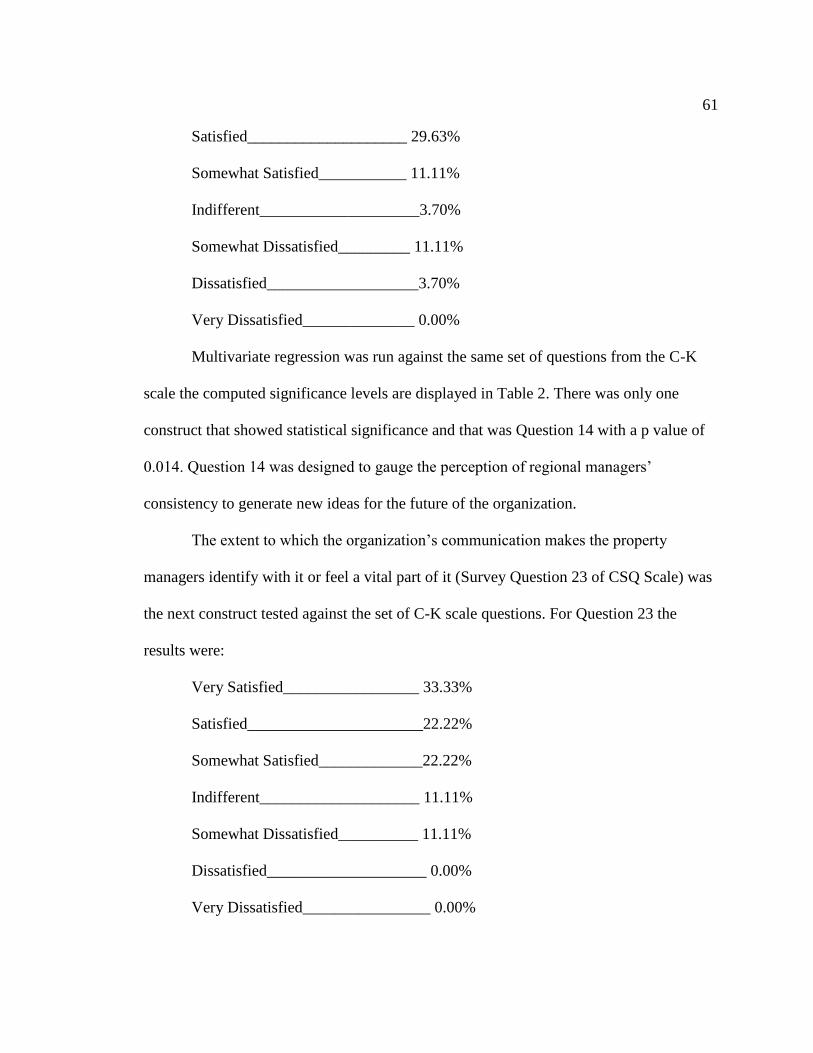
61
Satisfied____________________ 29.63%
Somewhat Satisfied___________ 11.11%
Indifferent____________________3.70%
Somewhat Dissatisfied_________ 11.11%
Dissatisfied___________________3.70%
Very Dissatisfied______________ 0.00%
Multivariate regression was run against the same set of questions from the C-K
scale the computed significance levels are displayed in Table 2. There was only one
construct that showed statistical significance and that was Question 14 with a p value of
0.014. Question 14 was designed to gauge the perception of regional managers’
consistency to generate new ideas for the future of the organization.
The extent to which the organization’s communication makes the property
managers identify with it or feel a vital part of it (Survey Question 23 of CSQ Scale) was
the next construct tested against the set of C-K scale questions. For Question 23 the
results were:
Very Satisfied_________________ 33.33%
Satisfied______________________22.22%
Somewhat Satisfied_____________22.22%
Indifferent____________________ 11.11%
Somewhat Dissatisfied__________ 11.11%
Dissatisfied____________________ 0.00%
Very Dissatisfied________________ 0.00%

62
Multivariate regression was calculated against the same set of questions from the
C-K scale the computed significance levels are displayed in Table E3 of Appendix E.
Given the preset significance level of 0.05 the results were not statistically significant.
The following communication satisfaction question was also used in the analysis: the
extent to which meetings are well organized (CSQ Survey Question 33). The results from
survey Question 33 were:
Very Satisfied________________22.22%
Satisfied____________________ 55.55%
Somewhat Satisfied___________ 22.22%
Indifferent____________________0.00%
Dissatisfied___________________ 0.00%
Very Dissatisfied_______________0.00%
Multivariate regression was run against the same set of questions from the C-K
scale the computed significance levels are displayed in Table E4 in Appendix E. There
were two constructs that showed statistical significance and those were Question 14 (p
value of 0.013) and Question 25 (p value of 0.017). There was also one construct that was
going in the right direction; however, it did not meet the preset significance level and that
was question 9 (p value of 0.094). Given the preset significance level of 0.05 the
remaining constructs were not statistically significant.
The next communication satisfaction construct used to test against the same set of
charismatic leadership constructs was Survey Question 34 of the CSQ scale, the extent to

63
which the amount of supervision given to the property managers was about right. The
results showed the following satisfaction levels:
Very Satisfied________________48.15%
Satisfied____________________ 29.63%
Somewhat Satisfied___________ 22.22%
Indifferent____________________0.00%
Dissatisfied___________________ 0.00%
Very Dissatisfied_______________0.00%
Multivariate regression was calculated against the same set of questions from the
C-K scale the computed significance levels are displayed in Table E5 of Appendix E.
Given the preset significance level of 0.05 the constructs were not statistically significant.
The extent to which written directives and reports are clear and concise (Survey
Question 35 of CSQ Scale), was the next construct tested against the set of C-K scale
questions. The satisfaction results were:
Very Satisfied________________29.63%
Satisfied____________________ 51.85%
Somewhat Satisfied___________ 11.11%
Indifferent____________________3.70%
Somewhat Dissatisfied__________ 3.70%
Dissatisfied___________________0.00%
Very Dissatisfied______________ 0.00%
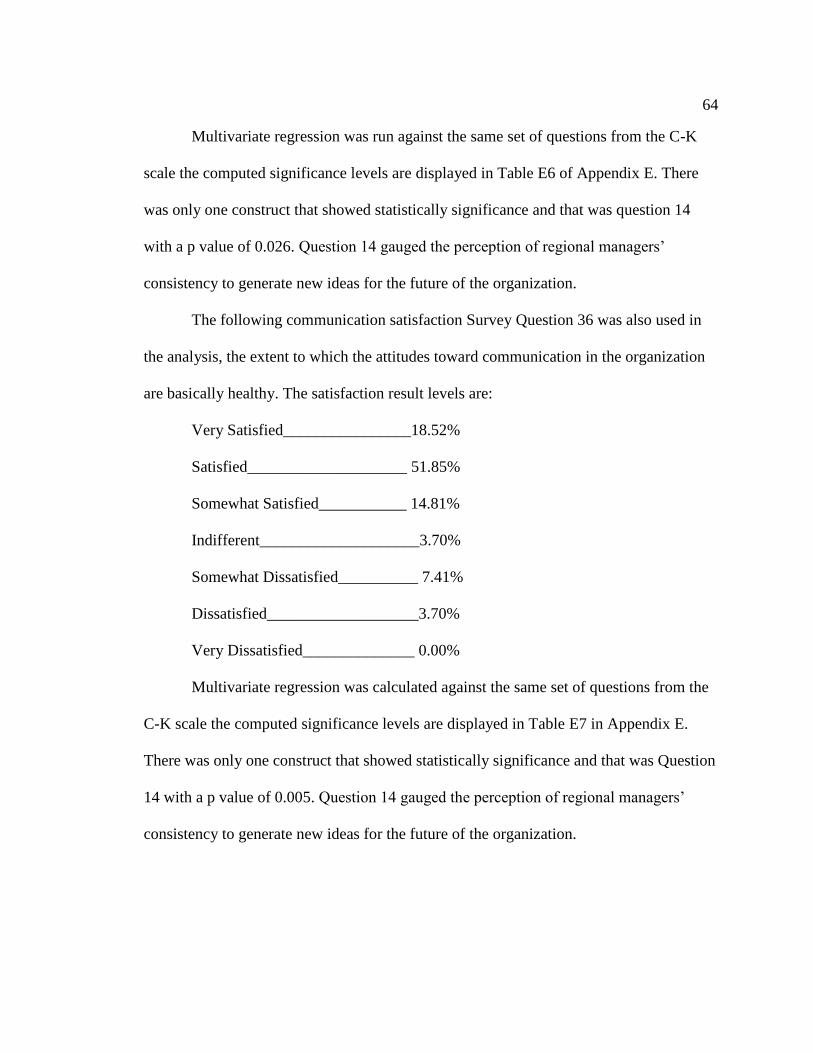
64
Multivariate regression was run against the same set of questions from the C-K
scale the computed significance levels are displayed in Table E6 of Appendix E. There
was only one construct that showed statistically significance and that was question 14
with a p value of 0.026. Question 14 gauged the perception of regional managers’
consistency to generate new ideas for the future of the organization.
The following communication satisfaction Survey Question 36 was also used in
the analysis, the extent to which the attitudes toward communication in the organization
are basically healthy. The satisfaction result levels are:
Very Satisfied________________18.52%
Satisfied____________________ 51.85%
Somewhat Satisfied___________ 14.81%
Indifferent____________________3.70%
Somewhat Dissatisfied__________ 7.41%
Dissatisfied___________________3.70%
Very Dissatisfied______________ 0.00%
Multivariate regression was calculated against the same set of questions from the
C-K scale the computed significance levels are displayed in Table E7 in Appendix E.
There was only one construct that showed statistically significance and that was Question
14 with a p value of 0.005. Question 14 gauged the perception of regional managers’
consistency to generate new ideas for the future of the organization.

65
Research Question 2
Is there an association between the perceived subdimension (sensitivity to
member’s needs, strategic vision, and articulation) of charismatic leadership qualities and
communication satisfaction?
H0: There is not an association between perceived subdimension (sensitivity to
member’s needs, strategic vision, and articulation) of charismatic leadership
qualities and communication satisfaction.
Ha: There is an association between perceived subdimension (sensitivity to
member’s needs, strategic vision, and articulation) of charismatic leadership
qualities and communication satisfaction.
In addressing Research Question 2 the multivariate linear regression was
performed by comparing questions numbers 4-15, 17-20, and questions 26-28 from the
CSQ Scale and questions 2, 3, 5, 10, 11, 13, 15, 16, 17, 19, 21-24 from the C-K Scale.
The first survey question analyzed from the CSQ Scale was Question 4 and pertained to
the level of satisfaction, which information regarding their progress within their job was
communicated to them by their regional manager. This question was analyzed against the
14 survey Questions of the C-K scale. The satisfaction level results were:
Very Satisfied________________14.81%
Satisfied____________________ 33.33%
Somewhat Satisfied___________ 18.52%
Indifferent___________________ 3.70%
Somewhat Dissatisfied_________18.52%

66
Dissatisfied__________________11.11%
Very Dissatisfied______________ 0.00%
These results from the CSQ Survey Question 4 were run against the perception of
the charismatic leadership qualities, specifically as related to their regional managers’
ability to recognize barriers/forces within the organization that may block or hinder
achievement of their goal, which yielded the following characteristic results:
Very Characteristic__________33.33%
Characteristic______________ 44.44%
Slightly Characteristic_______ 18.52%
Slightly Uncharacteristic______ 0.00%
Uncharacteristic_____________ 3.70%
Very Uncharacteristic_________0.00%
The significance level of 0.05 was established at the onset of the study. The
significance level of 0.870 was not statistically significant.
As discussed above, Survey Question 4 was run against the remaining 13 survey
questions of the C-K scale as shown above. The results for Survey Question 3, which
were used to determine the perception of regional managers’ engagement in
unconventional behavior in order to achieve organizational goals showed the following
characteristic levels:
Very Characteristic___________12.00%
Characteristic_______________ 20.00%
Slightly Characteristic________ 16.03%

67
Slightly Uncharacteristic______ 20.00%
Uncharacteristic_____________ 24.00%
Very Uncharacteristic__________8.00%
Multivariate linear regression test was calculated to compare the sets of survey
questions the test computed a significance level of 0.577. Thus, the association between
the sets of survey questions is not statistically significant.
Survey Question 5 of the C-K Scale, used to measure the perception that their
regional manager showed sensitivity for the needs and feelings of the other members in
the organization yielded the following characteristic results:
Very Characteristic__________18.52%
Characteristic______________ 40.74%
Slightly Characteristic_______ 29.63%
Slightly Uncharacteristic______ 7.41%
Uncharacteristic_____________ 3.70%
Very Uncharacteristic_________0.00%
The result from the multivariate linear regression was a significance level of
0.759. Thus, the association between the sets of survey questions is not statistically
significant.
Survey Question 10 of C-K Scale, which was used to determine the perception
that regional managers provide inspiring strategic and organizational goals, showed the
following characteristic levels:
Very Characteristic___________22.22%

68
Characteristic_______________ 44.44%
Slightly Characteristic________ 18.52%
Slightly Uncharacteristic______ 11.11%
Uncharacteristic______________ 3.70%
Very Uncharacteristic__________0.00%
The result of computing the multivariate linear regression test was 0.167, which is
not significant.
Survey Question 11 of C-K Scale was used to measure the perception of how
quickly regional managers’ recognize constraints in the organizations’ social and cultural
environment (cultural norms and lack of grassroots) that may stand in the way of
achieving organizational objectives. The characteristic results were:
Very Characteristic__________14.81%
Characteristic_____________ 40.74%
Slightly Characteristic_______ 29.63%
Slightly Uncharacteristic_____ 14.81%
Uncharacteristic_____________ 0.00%
Very Uncharacteristic_________0.00%
The computed multivariate linear regression significance level was 0.610 between
the sets of CSQ scale and C-K scale survey questions; thus, the association between the
sets of survey questions is not statistically significant.
Continuing with the same communication satisfaction construct the statistical
analysis was run against Survey Question 13 of the CSQ scale, perception of regional

69
manager as being inspirational and able to motivate by articulating effectively the
importance of what organizational members are doing. The characteristic levels were:
Very Characteristic___________37.04%
Characteristic_______________ 22.22%
Slightly Characteristic________ 25.93%
Slightly Uncharacteristic______ 11.11%
Uncharacteristic______________ 3.70%
Very Uncharacteristic_________ 0.00%
The significance level of 0.704 was not statistically significant.
Survey Question 15 of the C-K Scale was used to determine the perception that
regional managers were exciting public speakers and the characteristic results were:
Very Characteristic___________22.22%
Characteristic_______________ 29.63%
Slightly Characteristic________ 22.22%
Slightly Uncharacteristic______ 18.52%
Uncharacteristic______________ 7.41%
Very Uncharacteristic__________0.00%
The computed multivariate linear regression significance level was 0.194 between
the sets of CSQ scale and C-K scale survey questions; thus, the association between the
sets of survey questions was not statistically significant.

70
Survey Question 16 of C-K scale was used to determine the perception of regional
managers’ behavior of expressing personal concern for the needs and feelings of other
members of the organization. The characteristic results were:
Very Characteristic___________29.63%
Characteristic_______________ 22.22%
Slightly Characteristic________ 22.22%
Slightly Uncharacteristic______ 18.52%
Uncharacteristic______________ 7.41%
Very Uncharacteristic__________0.00%
The significance level of 0.093 was not statistically significant.
Survey Question 17 of C-K Scale was used to measure the perception of regional
managers’ attempt to maintain status quo or the normal way of doing things. The
characteristic levels were:
Very Characteristic__________11.11%
Characteristic______________ 40.74%
Slightly Characteristic_______ 14.81%
Slightly Uncharacteristic_____ 18.52%
Uncharacteristic____________ 14.81%
Very Uncharacteristic_________0.00%
The result of the multivariate linear regression test was a significance level of
0.947 and was not statistically significant.
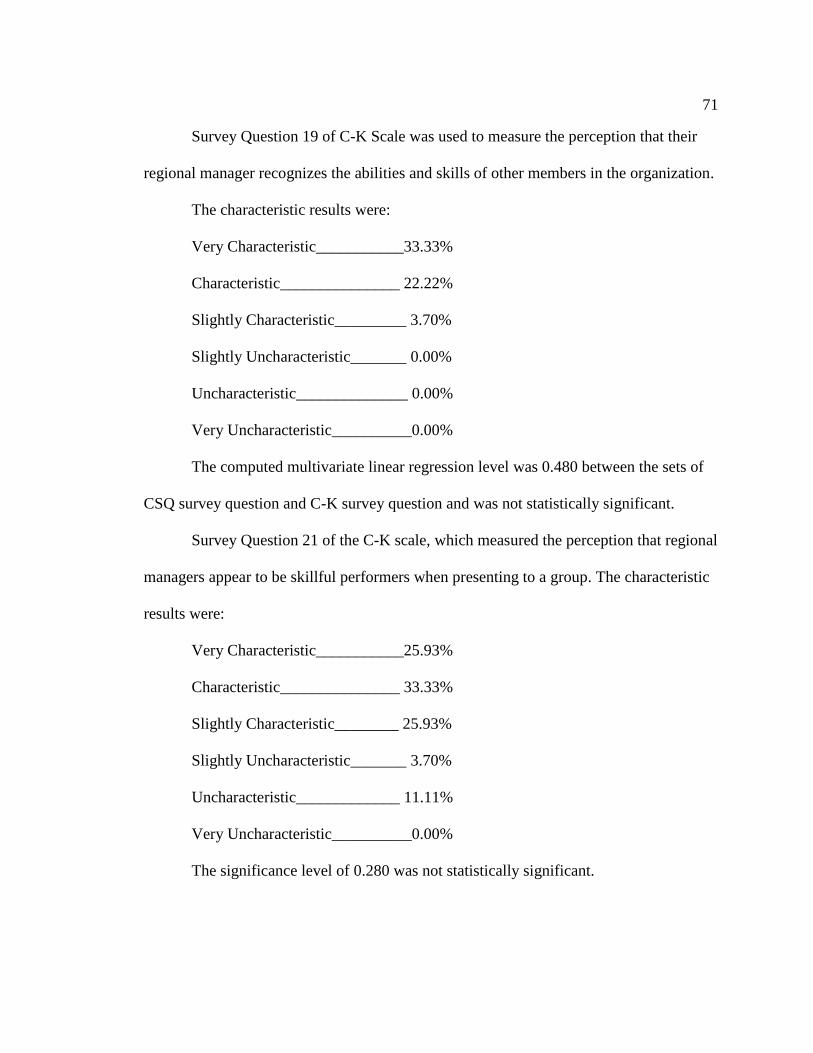
71
Survey Question 19 of C-K Scale was used to measure the perception that their
regional manager recognizes the abilities and skills of other members in the organization.
The characteristic results were:
Very Characteristic___________33.33%
Characteristic_______________ 22.22%
Slightly Characteristic_________ 3.70%
Slightly Uncharacteristic_______ 0.00%
Uncharacteristic______________ 0.00%
Very Uncharacteristic__________0.00%
The computed multivariate linear regression level was 0.480 between the sets of
CSQ survey question and C-K survey question and was not statistically significant.
Survey Question 21 of the C-K scale, which measured the perception that regional
managers appear to be skillful performers when presenting to a group. The characteristic
results were:
Very Characteristic___________25.93%
Characteristic_______________ 33.33%
Slightly Characteristic________ 25.93%
Slightly Uncharacteristic_______ 3.70%
Uncharacteristic_____________ 11.11%
Very Uncharacteristic__________0.00%
The significance level of 0.280 was not statistically significant.

72
Survey Question 22 of C-K Scale was used to measure the perception that
regional managers were visionaries, and often brought up ideas about possibilities for the
future. The characteristics results were:
Very Characteristic___________29.63%
Characteristic_______________ 44.44%
Slightly Characteristic_________ 7.41%
Slightly Uncharacteristic______ 18.52%
Uncharacteristic______________ 0.00%
Very Uncharacteristic__________0.00%
The computed multivariate linear regression significance level was 0.203 between
the CSQ scale question and the C-K scale question. Thus, the association between the
survey questions was found not to be statistically significant.
Survey Question 23 of the C-K scale, used to determine the perception of regional
managers’ readiness to recognize new environmental opportunities that may facilitate
achievement of organizational objectives, showed the following characteristic results:
Very Characteristic____________18.52%
Characteristic________________ 51.85%
Slightly Characteristic_________ 25.93%
Slightly Uncharacteristic________ 3.70%
Uncharacteristic_______________ 0.00%
Very Uncharacteristic___________0.00%
Significance level of 0.934 was not statistically significant.

73
Survey Question 24 of C-K scale used to measure the perception that the regional
manager recognized the limitations of other members of the organization had the
following characteristic results:
Very Characteristic___________14.81%
Characteristic_______________ 59.26%
Slightly Characteristic________ 22.22%
Slightly Uncharacteristic_______ 3.70%
Uncharacteristic______________ 0.00%
Very Uncharacteristic__________0.00%
The significance level of 0.348 was not statistically significant.
The extent to which the regional manager communicated regarding personal,
news, Question 5 of the CSQ scale was the next construct tested against the set of C-K
scale questions. For Question 5, the satisfaction results were:
Very Satisfied________________ 7.41%
Satisfied_____________________40.74%
Somewhat Satisfied____________25.93%
Indifferent___________________25.93%
Somewhat Dissatisfied__________ 0.00%
Dissatisfied___________________ 0.00%
Very Dissatisfied_______________0.00%
Multivariate regression analysis was calculated against the same set of questions
from the C-K scale and the computed significance levels are contained in Table E9 of

74
Appendix E. Given the preset significance level of 0.05, the significant levels were not
statistically significant.
The next communication satisfaction construct used to test against the same set of
charismatic leadership constructs was 6, extent to which regional managers communicate
information about organizational policies and goals to property managers. The
satisfaction survey results were:
Very Satisfied________________ 14.81%
Satisfied_____________________59.26%
Somewhat Satisfied____________22.22%
Indifferent____________________0.00%
Somewhat Dissatisfied__________ 3.70%
Dissatisfied___________________ 0.00%
Very Dissatisfied_______________0.00%
Multivariate regression was run against the same set of questions from the C-K
scale and the computed significance levels are displayed in Table E10 in Appendix E.
Given the preset significance level of 0.05 none of the below significant levels were
statistically significant.
The following communication satisfaction Survey Question 7 was also used in the
analysis: the property managers provided their perception on satisfaction level of
information about how their job compared with others. The satisfaction level results
were:
Very Satisfied________________ 14.81%

75
Satisfied_____________________25.93%
Somewhat Satisfied____________29.63%
Indifferent___________________11.11%
Somewhat Dissatisfied_________ 11.11%
Dissatisfied___________________ 3.70%
Very Dissatisfied______________ 3.70%
Multivariate regression analysis was run against the C-K scale questions. The
computed significance levels are displayed in Table E11 in Appendix E. There was only
one construct that came close to being statistically significant which was Question 16 (p
value of 0.059) the remaining constructs were not statistically significant.
Property managers were also surveyed according to their perception of and
satisfaction level of their regional manager communicating information about how they
were being judged (Survey Question 8 of CSQ Scale). The satisfaction results were:
Very Satisfied__________________7.41%
Satisfied_____________________ 29.63%
Somewhat Satisfied____________ 29.63%
Indifferent_____________________7.41%
Somewhat Dissatisfied__________ 18.52%
Dissatisfied____________________7.41%
Very Dissatisfied_______________ 0.00%
Multivariate regression analysis was run against the same set of C-K scale
questions. The computed significance levels are displayed in Table E12 in Appendix E.

76
Given the preset significance level of 0.05 none of the below levels are statistically
significant.
The extent to which the regional manager communicated regarding recognition of
property managers’ efforts (Survey Question 9) was the next construct tested against the
set of C-K scale questions. The satisfaction results were:
Very Satisfied________________ 18.52%
Satisfied_____________________22.22%
Somewhat Satisfied____________29.63%
Indifferent___________________11.11%
Somewhat Dissatisfied_________ 14.81%
Dissatisfied___________________ 3.70%
Very Dissatisfied______________ 0.00%
The multivariate regression analysis was run against the same set of questions
from the C-K scale and the computed significance levels are displayed in Table E13 of
Appendix E. There was only one construct that came close to being statistically
significant which was Question 15 p value of 0.056. The remaining constructs were not
statistically significant.
The next communication satisfaction construct used to test against the same set of
charismatic leadership constructs was Survey Question 10, used to measure the extent to
which communication level is satisfactory regarding information about department
policies. The satisfaction survey results were:
Very Satisfied________________ 18.52%

77
Satisfied_____________________ 33.33%
Somewhat Satisfied_____________ 40.74%
Indifferent_____________________ 0.00%
Somewhat Dissatisfied____________ 3.70%
Dissatisfied_____________________ 3.70%
Very Dissatisfied_________________0.00%
The statistical analysis was run against the same set of questions from the C-K
scale and the computed significance levels are displayed in Table E14 of Appendix E.
Given the preset significance level of 0.05 none of the significance levels was statistically
significant.
Communication satisfaction Survey Question 11 was also used in the analysis:
information about the requirement of my job. The satisfaction results were:
Very Satisfied________________ 22.22%
Satisfied_____________________48.15%
Somewhat Satisfied____________25.93%
Indifferent____________________0.00%
Somewhat Dissatisfied__________ 3.70%
Dissatisfied___________________ 0.00%
Very Dissatisfied______________ 0.00%
Multivariate regression analysis was run against the same set of questions from
the C-K scale and the computed significance levels are displayed in Table E15 in

78
Appendix E. Given the preset significance level of 0.05 none of the significance levels
was statistically significant.
Communication satisfaction of information about government action affecting the
organization was the next construct of the CSQ scale, Survey Question 12 that was run
against the C-K scale. The satisfaction result levels were:
Very Satisfied_______________11.11%
Satisfied___________________ 33.33%
Somewhat Satisfied__________ 18.52%
Indifferent__________________29.63%
Somewhat Dissatisfied_________0.00%
Dissatisfied__________________7.41%
Very Dissatisfied_____________ 0.00%
Multivariate regression analysis was run against the C-K scale. The computed
significance levels are displayed Table E16 in Appendix E. Given the preset significance
level of 0.05 none of the levels was statistically significant.
The extent to which the regional manager communicated information regarding
changes in our organization, Survey Question 13 of CSQ Scale was the next construct
tested against the set of C-K scale questions. The satisfaction result levels were:
Very Satisfied________________15.38%
Satisfied____________________ 50.00%
Somewhat Satisfied___________ 23.08%
Indifferent____________________0.00%
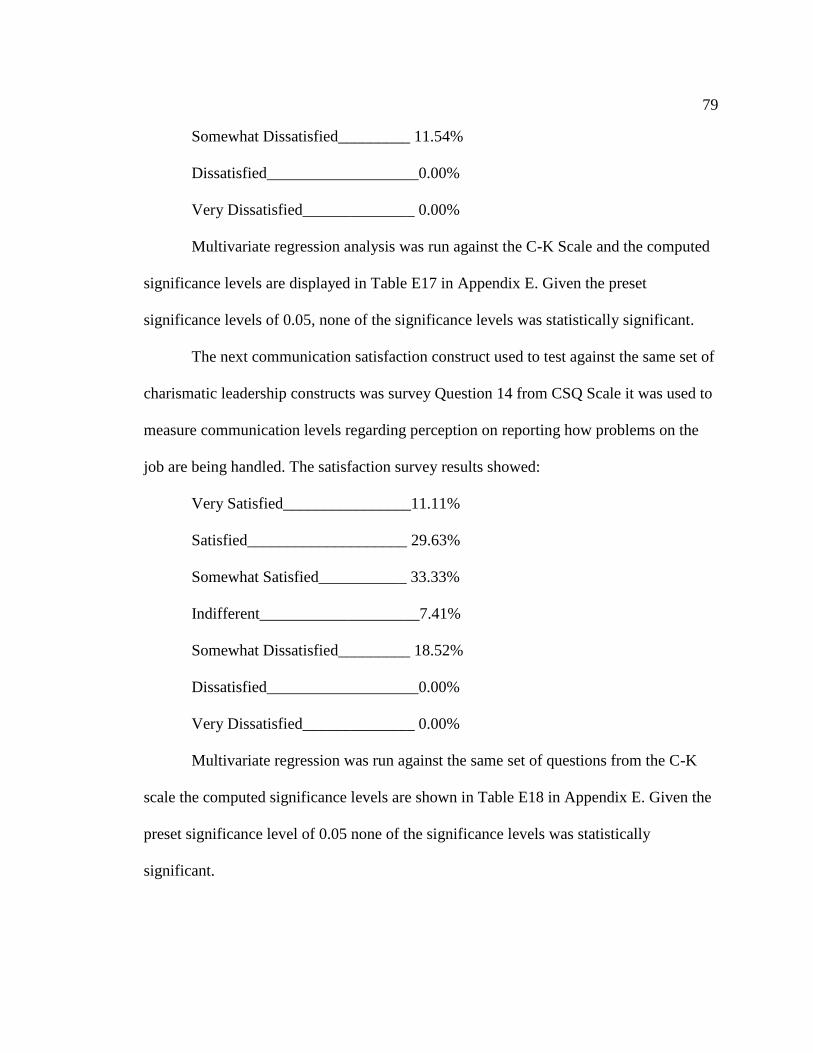
79
Somewhat Dissatisfied_________ 11.54%
Dissatisfied___________________0.00%
Very Dissatisfied______________ 0.00%
Multivariate regression analysis was run against the C-K Scale and the computed
significance levels are displayed in Table E17 in Appendix E. Given the preset
significance levels of 0.05, none of the significance levels was statistically significant.
The next communication satisfaction construct used to test against the same set of
charismatic leadership constructs was survey Question 14 from CSQ Scale it was used to
measure communication levels regarding perception on reporting how problems on the
job are being handled. The satisfaction survey results showed:
Very Satisfied________________11.11%
Satisfied____________________ 29.63%
Somewhat Satisfied___________ 33.33%
Indifferent____________________7.41%
Somewhat Dissatisfied_________ 18.52%
Dissatisfied___________________0.00%
Very Dissatisfied______________ 0.00%
Multivariate regression was run against the same set of questions from the C-K
scale the computed significance levels are shown in Table E18 in Appendix E. Given the
preset significance level of 0.05 none of the significance levels was statistically
significant.

80
The extent to which the regional manager communicated information about
benefits and pay, Survey Question 15 of CSQ Scale was the next construct tested against
the set of C-K scale questions. The satisfaction result levels were:
Very Satisfied________________22.22%
Satisfied____________________ 44.44%
Somewhat Satisfied___________ 14.81%
Indifferent__________________ 11.11%
Somewhat Dissatisfied__________0.00%
Dissatisfied___________________0.00%
Very Dissatisfied______________ 0.00%
Multivariate regression was calculated against the same set of survey questions of
the C-K scale and the computed significance levels are displayed in Table E19 in
Appendix E. Given the preset significance level of 0.05 none of the significance levels
was statistically significant.
The next communication satisfaction construct used to test against the same set of
charismatic leadership constructs was survey Question 17 of CSQ Scale which was used
to determine the perception that regional managers communicate information about
accomplishments and/or failures of the organization. The satisfaction survey results
showed:
Very Satisfied________________25.93%
Satisfied____________________ 55.56%
Somewhat Satisfied___________ 14.81%

81
Indifferent___________________ 0.00%
Somewhat Dissatisfied__________0.00%
Dissatisfied___________________0.00%
Very Dissatisfied______________ 0.00%
Multivariate regression was run against the C-K scale and the computed
significance levels are displayed in Table E20 in Appendix E. Given the preset
significance level of 0.05 none of the significance levels was statistically significant.
Communication satisfaction Survey Question 18 was also used in the analysis: the
extent to which regional managers know and understand the problems faced by
subordinates. The satisfaction result levels were:
Very Satisfied________________25.93%
Satisfied____________________ 25.93%
Somewhat Satisfied___________ 29.63%
Indifferent____________________0.00%
Somewhat Dissatisfied__________0.00%
Dissatisfied___________________0.00%
Very Dissatisfied______________ 0.00%
Multivariate regression was calculated against the C-K scale questions and the
computed significance levels are shown below in Table E21 in Appendix E. Given the
preset significance level of 0.05 none of the significance levels was statistically
significant.

82
Communication satisfaction of the extent to which the organization’s
communication motivates and stimulates an enthusiasm for meeting its goals, Survey
Question 19 was the next construct of the CSQ scale that was run against the C-K scale
questions. The satisfaction result levels were:
Very Satisfied________________7.41%
Satisfied___________________ 51.85%
Somewhat Satisfied__________14.81%
Indifferent__________________ 0.00%
Somewhat Dissatisfied_______ 11.11%
Dissatisfied_________________ 0.00%
Very Dissatisfied_____________0.00%
Multivariate regression analysis was run against the same set of questions from
the C-K Scale and the computed significance levels are displayed in Table E22 in
Appendix E. Given the preset significance level of 0.05 none of the significance levels
was statistically significant.
The extent to which the regional manager listens and pays attention to property
managers’ Question 20 was the next construct tested against the set of C-K scale
questions. The satisfaction result levels were:
Very Satisfied________________33.33%
Satisfied____________________ 33.33%
Somewhat Satisfied___________ 14.81%
Indifferent____________________3.70%

83
Somewhat Dissatisfied__________ 0.00%
Dissatisfied___________________0.00%
Very Dissatisfied______________ 0.00%
The multivariate regression analysis was run against the same set of survey
questions from the C-K Scale and the computed significance levels are displayed in Table
E23 in Appendix E. There was only one construct that showed statistically significance
and that was Question 15 with p value of 0.0494. Question 15 gauged the perception of
communication about benefits and pay. The remaining constructs were not statistically
significant.
The next communication satisfaction construct used to test against the same set of
charismatic leadership constructs was survey Question 26 of CSQ which measured the
extent to which the property manager receive in time the information needed to do their
job. The satisfaction survey results were:
Very Satisfied________________22.22%
Satisfied____________________ 44.44%
Somewhat Satisfied___________ 18.52%
Indifferent____________________0.00%
Somewhat Dissatisfied__________0.00%
Dissatisfied___________________0.00%
Very Dissatisfied______________ 0.00%
Multivariate regression was run against the C-K scale and the computed
significance levels are displayed in Table E24 in Appendix E. There were two constructs
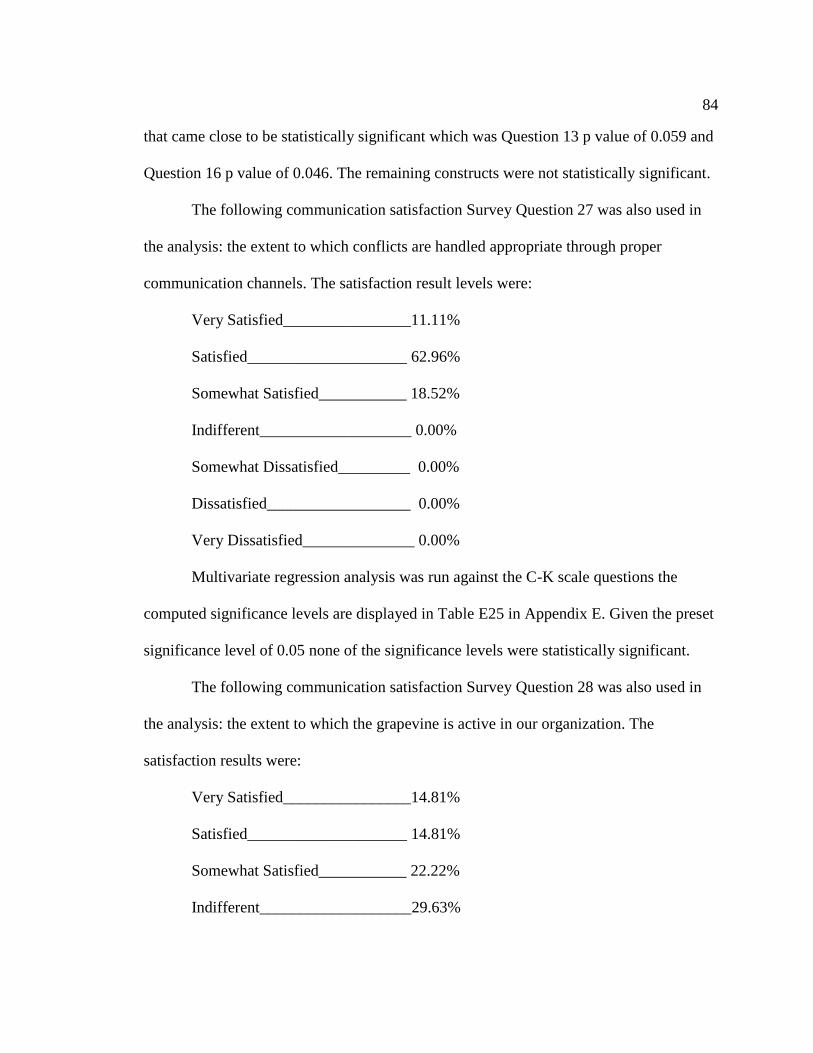
84
that came close to be statistically significant which was Question 13 p value of 0.059 and
Question 16 p value of 0.046. The remaining constructs were not statistically significant.
The following communication satisfaction Survey Question 27 was also used in
the analysis: the extent to which conflicts are handled appropriate through proper
communication channels. The satisfaction result levels were:
Very Satisfied________________11.11%
Satisfied____________________ 62.96%
Somewhat Satisfied___________ 18.52%
Indifferent___________________ 0.00%
Somewhat Dissatisfied_________ 0.00%
Dissatisfied__________________ 0.00%
Very Dissatisfied______________ 0.00%
Multivariate regression analysis was run against the C-K scale questions the
computed significance levels are displayed in Table E25 in Appendix E. Given the preset
significance level of 0.05 none of the significance levels were statistically significant.
The following communication satisfaction Survey Question 28 was also used in
the analysis: the extent to which the grapevine is active in our organization. The
satisfaction results were:
Very Satisfied________________14.81%
Satisfied____________________ 14.81%
Somewhat Satisfied___________ 22.22%
Indifferent___________________29.63%
85
Somewhat Dissatisfied_________ 14.81%
Dissatisfied___________________0.00%
Very Dissatisfied______________ 0.00%
Multivariate regression analysis was run against the C-K scale questions the
computed significance levels are displayed in Table E26 in Appendix E. There was only
one construct that came close to being statistically significant which was question 5 with
p-value of 0.048 the remaining constructs were not statistically significant
Research Question 3
Is there an association between communication satisfaction and job satisfaction
among VTs?
H0: There is not an association between communication satisfaction and job
satisfaction among VTs.
Ha: There is an association between communication satisfaction and job
satisfaction among VTs.
A multivariate linear regression was performed on the outcome measures for
research Question 3 by comparing questions 1, 8, 9, 11, 13, 14, 15, 16, 18, 19, 20, 22, and
27 from the CSQ Scale and questions 5, 10, and 19 from the C-K Scale. The first survey
question of the CSQ scale to be analyzed against the 3 survey Questions of the C-K scale
was used to gauge the perception of communication satisfaction with their jobs (survey
question #1 of CSQ scale). The satisfaction levels were:
Very Satisfied________________37.04%
Satisfied____________________ 33.33%

86
Somewhat Satisfied___________ 22.22%
Indifferent___________________ 3.70%
Somewhat Dissatisfied__________0.00%
Dissatisfied___________________0.00%
Very Dissatisfied______________ 0.00%
These results were run against the perception of the charismatic leadership
qualities in measuring survey Question 5 of the C-K scale, which yielded the following
results when gauging their regional managers’ readiness in showing sensitivity for the
needs and feelings of the other members in the organization:
Very Characteristic___________18.52%
Characteristic_______________ 40.74%
Slightly Characteristic________ 29.63%
Slightly Uncharacteristic_______ 7.41%
Uncharacteristic______________ 3.70%
Very Uncharacteristic_________ 0.00%
The significance level of 0.05 was established at the onset of the study. The
computed multivariate linear regression significance level was 0.903, thus, it was not
statistically significant.
As discussed Survey Question 1 of the CSQ scale was run against the remaining
two C-K scales. The results for survey Question 10 regarding regional managers
providing inspiring strategic and organizational goals were:
Very Characteristic___________22.22%

87
Characteristic_______________ 44.44%
Slightly Characteristic________ 18.52%
Slightly Uncharacteristic______ 11.11%
Uncharacteristic_____________ 3.70%
Very Uncharacteristic_________ 0.00%
Multivariate linear regression test was calculated to compare the survey questions,
which yielded a significance level of 0.483, and, the association between the sets of
survey questions is not statistically significant.
Survey Question 19 of C-K Scale, which measured the perception that the
regional manager recognized the abilities and skills of other members, yielded the
following characteristic results:
Very Characteristic___________33.33%
Characteristic_______________ 40.74%
Slightly Characteristic________ 22.22%
Slightly Uncharacteristic_______ 3.70%
Uncharacteristic______________ 0.00%
Very Uncharacteristic__________0.00%
The significance level of 0.372 was not statistically significant.
As discussed in Table E27 in Appendix E, based on preset significance level of
0.05 the association among the sets is not significant.
The next communication satisfaction construct that was analyzed in addressing
the third research question was measuring the property managers’ level of satisfaction of

88
their regional managers’ communication about how they were being judged, Question 8.
The satisfaction levels were:
Very Satisfied_________________7.41%
Satisfied____________________ 29.63%
Somewhat Satisfied___________ 29.63%
Indifferent___________________ 7.41%
Somewhat Dissatisfied_________18.52%
Dissatisfied__________________ 7.41%
Very Dissatisfied______________ 0.00%
Multivariate regression was run against the same three sets of questions from the
C-K scale the following significance levels are displayed in Table E28 in Appendix E.
There was only one construct that showed statistically significance and that was Question
10 with a p value of 0.024. Question 10 gauged the perception that regional managers
provided inspiring and strategic and organization goals.
Satisfaction level of recognition of efforts was the next CSQ construct observed in
Question 9. The satisfaction results were:
Very Satisfied_______________18.52%
Satisfied___________________ 22.22%
Somewhat Satisfied__________ 29.63%
Indifferent__________________11.11%
Somewhat Dissatisfied________ 14.81%
Dissatisfied__________________3.70%

89
Very Dissatisfied_____________ 0.00%
Multivariate linear regression analysis was run against the same set of questions
from the C-K scale the significance levels and is in Table E29 in Appendix E. None of
the significance levels was statistically significant.
Communication satisfaction of job requirements was the next construct of the
CSQ scale survey Question 11. The satisfaction levels results were:
Very Satisfied________________18.52%
Satisfied____________________ 33.33%
Somewhat Satisfied___________ 40.74%
Indifferent___________________ 0.00%
Somewhat Dissatisfied__________0.00%
Dissatisfied___________________3.70%
Very Dissatisfied______________ 0.00%
Multivariate regression analysis was run. The computed the significance levels for
the same set of C-K are in Table E30 in Appendix E. None was significant.
Communication satisfaction regarding information on job changes were also
analyzed using Survey Question 13 of CSQ scale. The satisfaction levels were:
Very Satisfied_______________15.38%
Satisfied___________________ 50.00%
Somewhat Satisfied__________ 23.04%
Indifferent___________________0.00%
Somewhat Dissatisfied________ 11.54%

90
Dissatisfied__________________0.00%
Very Dissatisfied_____________ 0.00%
Multivariate regression was run and the significance levels are in Table E31 in
Appendix E. None of the below significance levels was statistically significant at the .05
level.
The next communication satisfaction construct that was Question 3 was to
measure satisfaction on how problems in their jobs were being handled by their regional
manager survey Question 14 of CSQ scale. The satisfaction results were:
Very Satisfied________________11.11%
Satisfied____________________ 29.63%
Somewhat Satisfied___________ 33.33%
Indifferent____________________7.41%
Somewhat Dissatisfied_________ 18.50%
Dissatisfied___________________0.00%
Very Dissatisfied______________ 0.00%
Multivariate linear regression test was calculated against the research question
from the C-K scale the computed significance levels are shown in Table E32 in Appendix
E. There was only one construct that showed statistically significance and that was
Question 10. Question 10 gauged the perception that regional manager provided inspiring
strategic and organizational goals. The remaining constructs were not statistically
significant.

91
Survey Question 15 of the CSQ scale was the next construct analyzed it dealt with
communication satisfaction levels on information regarding pay and benefits. The
satisfaction results were:
Very Satisfied________________22.22%
Satisfied___________________ 44.44%
Somewhat Satisfied___________ 14.81%
Indifferent__________________ 11.11%
Somewhat Dissatisfied__________3.70%
Dissatisfied___________________3.70%
Very Dissatisfied______________ 0.00%
The multivariate linear regression was run against the charismatic leadership
constructs and the computed significance levels are displayed in Table E33 in Appendix
E. Given the preset significance level of 0.05 the constructs were not statistically
significant.
Satisfaction levels regarding the financial standing of the organization were also
analyzed Survey Question 16 of CSQ scale against the set of C-K scale questions. The
satisfaction results were:
Very Satisfied________________37.04%
Satisfied____________________ 51.85%
Somewhat Satisfied___________ 11.11%
Indifferent___________________ 0.00%
Somewhat Dissatisfied_________ 0.00%

92
Dissatisfied__________________ 0.00%
Very Dissatisfied______________ 0.00%
Multivariate linear regression was run against the same previous set of
charismatic constructs the significance levels. The computed significance levels are listed
in Table E34 in Appendix E. Given the preset significance level of 0.05 the remaining
constructs were not found to be statistically significant.
An important aspect of communication for most property managers was that of
the extent to which the regional managers know and understand the issues and problems
that are faced by their subordinates, which is the next Survey Question 18 of the CSQ
scale that was analyzed against the C-K scale. The satisfaction levels were:
Very Satisfied_______________25.93%
Satisfied___________________ 25.90%
Somewhat Satisfied__________ 29.63%
Indifferent___________________3.70%
Somewhat Dissatisfied________14.81%
Dissatisfied__________________0.00%
Very Dissatisfied_____________ 0.00%
The multivariate regression was run against this construct and the same set of
charismatic leadership constructs and the computed significance levels are shown in
Table E35 in Appendix E. Given the preset significance level of 0.05 the none of the
levels was statistical significant.

93
The extent to which the property managers’ regional managers listen and paid
attention to them was the next Survey Question 19 from the CSQ scale that was surveyed.
The satisfaction levels were:
Very Satisfied___________________3.33%
Satisfied______________________ 33.33%
Somewhat Satisfied_____________ 14.81%
Indifferent______________________3.70%
Somewhat Dissatisfied___________11.11%
Dissatisfied_____________________3.70%
Very Dissatisfied________________ 0.00%
The multivariate regression test was run against this charismatic leadership
constructs and the computed significance levels are shown in Table E36 in Appendix E.
There was only one construct that was statistically significance and that was Question 10.
Question 10 gauged the perception that regional manager provided inspiring strategic and
organizational goals. The remaining constructs were not statistically significant.
The communication satisfaction levels on the extent to which regional managers
offered guidance for solving job related problems was the next Survey Question 20 from
the CSQ scale that was analyzed. The satisfaction levels were:
Very Satisfied__________________22.22%
Satisfied______________________ 40.74%
Somewhat Satisfied_____________ 22.22%
Indifferent_____________________ 3.70%

94
Somewhat Dissatisfied___________11.11%
Dissatisfied_____________________0.00%
Very Dissatisfied________________ 0.00%
The multivariate linear regression was run against the charismatic leadership
constructs and the significance levels are displayed in Table E37 in Appendix E. There
was only one construct that showed statistical significance and that was Question 10.
Question 10 gauged the perception that regional manager provided inspiring strategic and
organizational goals. The remaining constructs were not statistically significant.
Survey Question 22 gauged the satisfaction levels regarding the extent to which
regional managers handle conflict appropriately and through proper communication
channels. The satisfaction levels were:
Very Satisfied_________________22.22%
Satisfied_____________________ 44.44%
Somewhat Satisfied____________ 18.52%
Indifferent_____________________0.00%
Somewhat Dissatisfied__________11.11%
Dissatisfied____________________0.00%
Very Dissatisfied_______________ 3.70%
Multivariate linear regression was run against charismatic constructs and the
computed significance levels are shown in Table E38 in Appendix E. There was only one
construct that was statistically significance and that was Question 10. Question 10 gauged

95
the perception that regional manager provided inspiring strategic and organizational
goals. The remaining constructs were not statistically significant.
Summary
Of the 155 property managers, only 27 property managers chose to participate by
completing the survey. After analyzing the data taken from the two sets of survey
questions, the majority of the property managers surveyed perceived that their regional
manager encompassed various characteristics of charismatic leadership. The survey
results also yielded data that demonstrated that the majority of the property managers
were satisfied with various areas of communication. Each of the variables reviewed
demonstrated the existence of a relationship between some of the constructs, but not all.
The relationship between the charismatic leadership quality of generating new
ideas for the future of the organization showed a statistically significant relationship
between (a) the extent to which supervisor offers guidance for solving job related
problems, (b) the extent to which supervisor (regional manager) trust property managers,
(c) the extent to which written directives and reports are clear and concise as written by
regional managers, and (d) the extent to which the attitudes toward communication in the
organization are basically healthy. There were also significant positive relationship
demonstrated between pursuing organizational objectives, engagement in activities
involving considerable personal risk and the communication satisfaction construct of
which the organization’s communication motivates and stimulates an enthusiasm for
meeting company goals.
96
There were also significant positive relationships evaluated between perception
that regional manages possessed charismatic quality of being an exciting public speaker
and satisfaction with the extent to which the regional manager listens and pays attention
to them. The most common statistical significant positive relationship I evaluated was the
perception that the regional managers provided inspiring strategic and organizational
goals which showed a relationship with the following communication satisfaction factors
(a) aspect of their regional manager communicating about how the property managers
were being judged, (b) how well they listened and paid attention to the property
managers, (c) the extent of how well they provided guidance for solving job related
problems, and (d) how well conflicts were handled appropriately through proper
communication channels. There were a large number of areas surveyed as it related to the
various charismatic leadership qualities and communication satisfaction factors; however,
those mentioned above were the only ones that showed significant positive relationships.
The relationship between the leadership framework of charismatic leadership
qualities and communication satisfaction was determined through the use of the research
questions. The overall results show that the most positive results were related to Research
Questions 1 and 3.
Chapter 5 is the concluding chapter of the study on the perception of charismatic
leadership and communication satisfaction. The chapter will contain interpretation of the
findings, recommendations for practice and future research, implications, and lastly
conclusion.

97
Chapter 5: Discussion, Conclusions, and Recommendations
I conducted this study (a) to determine the association between perceived
charismatic leadership qualities and follower perception of leadership effectiveness, and
(b) to determine the association between the perceived subdimensions of charismatic
leadership qualities (sensitivity to member’s needs, strategic vision, and articulation) and
communication satisfaction. That determination was expected to equip VT leaders with
tools to enhance and improve VTs’ communication. Property managers (managed
virtually) at a student housing company were invited to complete an online survey. Over
the course of 6 weeks, four survey e-mail invitations were sent to 155 property managers.
Multivariate multiple regression analysis (MMRA) was used to determine the linear
association between charismatic leadership qualities as evaluated by the C-K scale and
the communication satisfaction as evaluated by the CSQ scale. MMRA was used because
it was more appropriate in evaluating relationships between two data sets. I found a
significant relationship for some variables for each of the three research questions.
Interpretation of the Findings
Research Question 1
Is there an association between charismatic leadership qualities and follower
perception of leadership effectiveness among VTs? In evaluating question one there
were a number of constructs used in measuring the perception charismatic leadership and
perception that VT members had regarding leadership effectiveness of their virtual
leaders. In evaluating the relationship of charismatic leadership qualities and follower
perception of leadership effectiveness, I compared seven items of the CSQ scale with 10

98
items from the C-K scale. I addressed each construct used in this evaluation briefly in the
interpretation of the study findings. Each of the seven items of the CSQ scale were
compared to the following C-K Leadership scale, the leader:
1. Influence others by developing mutual liking and respect
2. Seizes new opportunities in order to achieve goals
3. Uses nontraditional means to achieve organizational goals
4. In pursuing organization engages in activities involving self-sacrifice
5. Recognizes constraints in the organization’s physical environment (technical
limitations, lack of resources, etc.) that may stand in the way of achieving
organizational objectives
6. Advocates following nonrisky, well-established courses of action to achieve
organizational goals
7. Takes high personal risks for the sake of the organization
8. Consistently generates new ideas for the future of the organization
9. Often incurs high personal cost for the good of the organization
10. In pursuing organizational objectives, engages in activities involving
considerable personal risk
The average of those that perceived that their regional manager possessed the above
charismatic leadership qualities, 50% stated that they perceived their regional manager
possessed the charismatic leadership qualities.

99
Communication Motivates and Stimulates Followers’ to Meet Company Goals
There are a number of important factors that are detrimental in the success of VTs
and communication is one of those factors. According to Hajro and Pudelko (2010) the
ability for leaders to transfer knowledge and communication are vital skills required of
virtual leaders. Team leaders play a fundamental role in shaping and blending VTs. Team
leaders should be able to communicate and motivate their VT members toward meeting
organization goals. According to Hayibor, Agle, Sears, Sonnenfield, and Ward (2011)
charismatic leaders encompass qualities that enhance leader and follower relationships.
The charismatic quality of a leader is a form of leadership that portrays leaders as
visionaries, one that is able to motivate others through their actions and behaviors
(Hayibor et al., 2011).
The findings suggest that 66% of property managers were satisfied with level of
communication as it related to motivating and stimulating them within their VTs. Further,
when I compared communication and motivation to the 10 C-K constructs, the results
were that a significant positive relationship existed between communication motivation
and stimulation and the perception that their leader possess charismatic leadership quality
of pursuing organizational objectives and their ability to engage in activities involving
considerable personal risk for the betterment of the VT and organization.
Based on the results certain levels of charismatic leadership qualities do have a
positive relationship regarding follower perception of leadership effectiveness
specifically as it relates to the regional manager taking personal risk for the betterment of
the property managers and the organization, which yielded significance level of 0.029.

100
These results are consistent with the findings of Lapierre, Bremner, and McMullan
(2012), who stated that charismatic leadership is one that is known to positively influence
followers and inspire the followers to buy into the mission and vision that is being
presented. The positive influence that charismatic leader have on their followers
stimulates and motivates followers to go above and beyond what is expected (Lapierre et
al., 2012). The level of personal risk has a positive influence on the property managers as
it shows them that their regional manager is willing to go above and beyond. If
companies wish to improve communication satisfaction within their VTs it is
demonstrated through this data that teams that are lead by charismatic leaders have a
significant positive relationship by focusing on fostering charismatic leadership qualities
and more specifically as it pertains to personal buy in from leaders.
Supervisors Offer Guidance in Solving Job-Related Problems
Property managers that are managed virtually do not have the luxury of having
their regional manager onsite or in person to assist with property issues as they arise;
therefore, it is very important that the appropriate level of guidance is given. Based on the
results of this study, 70.37% of property managers were satisfied with the level of
communication regarding their regional managers offering guidance in solving job
related problems. As I compared the results to the C-K scale constructs discussed above,
a significant positive relationship existed between perception that regional manager
possess qualities of charismatic leader by consistently generating new ideas for the future
of the organization that yielded 0.014 significance level. These findings are consistent
with the findings discussed in the Levine, Muenchen, and Brooks (2010) study that

101
concluded that charisma was the ability for leaders to listen, commiserate with, and
understand others. They are leaders that are genuine and attentive listeners. They are
leaders that recognize the need to solve issues and be proactive by planning for the future.
Communication Makes Employees Identify with the Organization or Feel a Vital
Part
In evaluating if employees are happy and working in a positive atmosphere they
are more inclined to work harder or at their best, which leads one to believe, they feel
invested in the organization. According to Bono and Ilies (2006), charismatic leaders
enable this type of environment when they lead through positive emotions and open
communication, which ultimately will lead to increased organizational success. From the
results of this study, 55.55% of property managers were satisfied with the level of
communication and felt they were a vital part of the organization. I did not find a
significant positive relationship between level of communication and any of the C-K
scale constructs.
Extent to Which Meetings are Well Organized
VTs have very limited amount of opportunities for face-to-face meetings therefore
it is very important that when there are opportunities to meet, provisions are made to
ensure a productive means of communication. Bergiel, Bergiel, and Balsmeier (2008)
mentioned a number of mechanisms to ensure organized and productive meetings such as
the use of teleconference, videoconference, team chat rooms, and computer-mediated
conferencing (CMC). Those researchers indicated that each mechanism is an instrument
to create positive environment for communication. With 77.77% of property managers

102
stating that they were satisfied with the level of communication regarding well organized
meetings when compared to the C-K scale, a significant positive relationship existed
between the communication satisfaction level and two of the C-K scale constructs. A
significance level of 0.013 was determined between communication satisfaction and the
charismatic leadership quality that regional manager generates new ideas for the future of
the company. Participants felt that regional managers took personal risk for the
betterment of the property managers and the organization, which was significance at the
0.017 level. These findings support the literature of Nydegger and Nydegger (2010),
Bergiel, Bergiel, and Balsmeier (2008), and Lu, Watson-Manheim, Chudoba, and Wynn
(2006) that communication and mechanisms used in organizing communication is an
important factor in considering the success of VTs.
Amount of Supervision Given is the Right Amount
Within the literature review researchers addressed the important role that leaders
play in the success of VTs. VTs work better with managerial guidance (Wakefield,
Leidner, & Garrison, 2008). According to Berry (2011) the success and failure of VTs
lies heavily on leadership or management. In this study 77.78% of the property managers
were satisfied with the level of communication as it pertained to the right amount of
supervision of their regional manager. When compared to the C-K scale constructs, there
was not a significant relationship.
Extent to Which Written Directives and Reports are Clear and Concise
Based on the results of Chapter 4, 81.48% of the property managers were satisfied
with the level of communication as it pertained to written reports being clear and concise.

103
When the comparison was made to determine if there was a relationship between level of
satisfaction of written reports being clear and concise and the 10 C-K constructs, a
positive significant level of 0.026 was found when property managers perceived their
regional managers as charismatic leaders that generate new ideas for the future of the
organization.
Attitudes Toward Communication in an Organization are Healthy
Based on the results from Chapter 4 70.37% of the property managers were
satisfied with the level of communication and felt that the level of communication was
healthy. When results were compared to the C-K scale a positive significant relationship
was found between healthy communication and charismatic quality that regional manager
consistently generated new ideas for the future of the organization. Charisma has been
noted by emphasizing the significance of projects, by leaders sharing their vision and by
enhancing the confidence of those they lead and emphasizing the common goal (Levine,
Muenchen, & Brooks, 2010). Levine et al. (2010) in their review of communication
behavior of charismatic leaders indicated that it is the persuasiveness in their speech, their
ability to articulate in a manner that is easily understandable, and effectiveness as a
speaker that strongly suggest that VTs led by charismatic leaders would enhance the
satisfaction of communication among VTs.
According to the findings of this study regarding research question one, a positive
significant relationships was found to exist between the various communication and
charismatic leadership qualities. When property managers perceives that their leader, the
regional manager, exhibits charismatic leadership qualities per the constructs of Conger-

104
Kanugo model, that does not only contribute to the charisma of the leaders, but it also
will present a change in the attitudes, values and behavior that is consistent with what the
manager expects (Conger, Kanungo, & Menon, 2000). According to the Conger et al.,
(2000), study, charismatic leadership qualities were linked to positive correlation between
an employee’s performance and job satisfaction which leads me to believe that property
managers find their regional managers’ leadership as effective which can be attributed to
the charismatic leadership qualities that have been identified in answering research
questions one.
For Research Question 1, I found some significant levels between some of the
constructs, which might lead one to believe that there is some form of positive
association between various charismatic leadership qualities and follower perception of
leadership effectiveness among VTs. There were two charismatic leadership constructs
that were found to have a positive relationship with five of the communication
satisfaction constructs. The perception that regional manager in pursing organizational
objectives, engaged in activities involving personal risk was found to have a positive
correlation with the following communication satisfaction constructs: extent to which the
organization’s communication motivates and stimulates an enthusiasm for meeting its
goals and extent to which meetings are well organized. The other charismatic leadership
quality that had a positive relationship on communication satisfaction was consistently
generating new ideas for the future of the organization. This particular construct was
positively correlated with the following communication constructs: (a) extent to which
supervisor offers guidance for solving job related problems, (b) meetings are well

105
organized (c) extent to which written directives and reports are clear and concise, and (d)
extent to which the attitudes toward communication in the organization are basically
healthy. The results support the literature by Lapierre, Bremner, and Mcullan (2012),
which stated that charismatic leaders have positive influence on their followers and they
also inspire them to buy into the vision and mission that is presented to them.
Research Question 2
Is there an association between the perceived subdimension (sensitivity to
member’s needs, strategic vision, and articulation) of charismatic leadership qualities and
communication satisfaction? As I evaluated the constructs of Research Question 2, I
compared a number of items from the CSQ scale with the C-K scale. There were 19 items
used in the comparison from the CSQ scale and 14 items from the C-K scale. The
following 14 items from the C-K scale were compared to the CSQ scale, the leader:
1. Readily recognizes barriers/forces within the organization that may block or
hinder achievement of his/hers goal
2. Engages in unconventional behavior in order to achieve organizational goals
3. Shows sensitivity for the needs and feelings of the other members in the
organization
4. Provides inspiring strategic and organizational goals
5. Readily recognizes constraints in the organization’s social and cultural
environment (cultural norms, lack of grassroots, etc.) that may stand in the
way of achieving organizational objectives

106
6. Inspirational; able to motivate by articulating effectively the importance of
what organizational members are doing
7. Exciting public speaker
8. Often expresses personal concern for the needs and feelings of other member
of the organization
9. Tries to maintain the status quo or the normal way of doing things
10. Recognizes the abilities and skills of other members in the organization
11. Appears to be skillful performer when presenting to a group
12. Has a vision; often brings up ideas about possibilities for the future
13. Readily recognizes new environmental opportunities (favorable physical and
social conditions) that may facilitate achievement of organizational objectives
14. Recognizes the limitations of other members in the organization
Communicates Progress in Job
In order for employees to improve at their jobs it is important to know how well
they are doing at performing the task they are responsible for. Lack of communication
has been linked to poor work productivity (Staples & Webster, 2007). As I reported in
Chapter 4, 48.14% of property managers were satisfied with the level of communication
regarding job progress. The comparison of the C-K constructs discussed above did not
show a significant positive relationship between any of the C-K constructs and the level
of communication.

107
Personal News
Social interaction between others has been linked to positive engagement.
According to Smith (2003), social interaction is encouraged among employees,
coworkers, and even expert training as it encourages positive engagement and support.
The results of the study showed that 48.15% property managers were satisfied with the
level of communication as it pertained to personal news. The results of Grove’s (2005)
study and Lapierre et al. (2012) focused on the importance of leaders being conscious of
the social aspect of leadership and its effect on behavior. The social aspect of leadership
is important in the enhancement of VT leaders and the improvement of communication.
On the contrary, I did not find a significant positive relationship between level of
communication and any of the C-K scale constructs.
Organizational and Departmental Policies and Goals
Within organizations’ it is imperative that leaders are able to communicate and
encourage adherence to policies and goals. According to the literature charismatic leaders
are able to inspire their followers to buy into the mission and vision to those that they
lead. The results of the study showed that 74.07% of property managers were satisfied
with the level of communication regarding organizational polices and procedures. In
regard to the communication satisfaction levels of departmental policies and goals
51.85% property managers were satisfied. On the contrary there was not a significant
positive relationship between communication satisfaction levels of neither organizational
nor departmental policies and goals and the constructs of C-K scale. The results conclude

108
that there is not a correlation between communication satisfaction and charismatic
leadership.
Job Compares to Others
My results in Chapter 4 showed that 40.74% of property managers were satisfied
with the level of communication as it pertained to how their job compares to others.
When I compared the construct to the C-K constructs, a significant positive level of 0.059
was found. Property managers perceived their regional managers expressed personal
concern of others. There appears to be a relationship between the satisfaction levels that
property managers have regarding communication on how their jobs compare to others
and their perception that their regional manager expressed concerns for others. The
results supports the statement that charismatic leaders use their skill of social control to
foresee social cues as a measure to be attentive and sensitive to the needs and values of
their followers (Grove, 2010).
Judgment, Recognition for Efforts, and Job Requirements
As addressed in the literature review, Bono and Ilies (2006) stated that
charismatic leaders are known to influence their followers because of the manner they
interpret and integrate information to their followers. In order for work productivity to
improve employees must be informed of areas where improvement is needed and
informed of areas they are being judged as well as must be encouraged through job
recognition. I found that 37.04% were satisfied with level of communication regarding
how they are being judged while 40.74% were satisfied with the communication level of
recognition of their efforts. I also found that 70.37% of property managers were satisfied

109
with communication levels as it pertained to the requirements of their job. I did not find a
significant positive relationship between the levels of communication regarding how
employees were being judged nor job requirements and the C-K scale, however; a
correlation was found between satisfaction levels of recognition of efforts and the C-K
scale construct, exciting speaker with a significance level of 0.056.
My findings support the study that was conducted by Bono and Ilies (2006),
which found that individuals with high charisma expressed via writing and speeches
positive emotions, which in return yielded positive emotions for followers. Charismatic
leaders enable this type of environment when the lead through positive emotions, which
in the end suggest increased organizational success (Bono & Ilies, 2006).
Government Actions Affecting Organization
Organizations are known to undergo certain changes in regards to polices and
procedures as required or mandated by government action. It is at the discretion of top
executives on whether such information is disseminated down the line. From the results
of this study 44.44% were satisfied with the level of communication given to them
regarding government action affecting their organization. When compared to the C-K
scale constructs, there was not a significant relationship.
Changes in Organization
Based on the results from Chapter 4, 65.38% of property managers were satisfied
with the level of communication as it pertained to information about changes in their
organization. According to the literature, in order to implement change, leaders must be
sensitive to followers needs, they must have social control, which allows them the ability

110
to communicate their vision and recognize when there is a need to refine their message
(Groves, 2005). However, when a comparison was made to determine if there was a
relationship between level of satisfaction of changes in organization and the C-K scale
constructs, no significant relationship was found.
How Problems in job are Handled
One of the most important aspects of doing a job is to know when a problem
arises how it will be handled. Working virtually this task can be difficult. In evaluating
whether the property managers are satisfied with the level of communication on how
problems are being handled, 40.74% were satisfied. The comparison of the satisfaction
level of how problems are being handled and the constructs of the C-K scale did not have
a significant positive relationship.
Benefits and Pay
Benefits and pay are very important aspects of a job. In evaluating the satisfaction
levels of property managers with communication levels as it pertained to information
regarding benefits and pay, 66.66% were satisfied. When the comparison was made to
determine if there was a relationship between level of satisfaction of benefits and pay and
the C-K scale constructs, there was not a significant relationship found. Charismatic
leadership quality does not have a relationship with communication satisfaction in this
case.
Accomplishments and Failures of Organization
Through effective communication leaders are able to help followers visualize and
understand the why and how of company projects (Neufeld et al., 2010). In the study,

111
81.49% of property managers stated that they were satisfied with the level of
communication regarding the accomplishments and failures of their organization. When
the comparison was made to determine whether a relationship exist between
communication level on accomplishments and failures and the C-K scale constructs I did
not find a significant positive relationship. Therefore, charismatic leadership quality does
not have a relationship with communication satisfaction in this case.
Supervisors Know and Under Subordinates Problems
Effective communication is largely related to shared understanding. The results of
the study show that 51.86% of property managers are satisfied with supervisors
knowledge and understanding of the problems they face. When compared to the C-K
scale constructs, there was not a significant relationship. In this case charismatic
leadership does not correlate with communication satisfaction when it comes to
supervisors knowledge and understanding problems of subordinates.
Motivates and Stimulates Enthusiasm for Meeting Goals
“Leadership is not about enforcing the leader’s dream; it is about developing a
shared sense of destiny” (Shastri et al. 2010, p. 1948). As leaders lead their teams,
motivation is an important piece to increasing work productivity. In the study 59.26%
were satisfied with the amount of communication that they receive in regards to their
regional manager and them motivating and stimulating enthusiasm for meeting company
goals. When the comparison was made with the C-K scale constructs, there was not a
significant relationship.

112
Supervisor Listens and Pays Attention
Conger, Kanungo, and Menon (2000) also stated that one of the main attributes
that separate charismatic leaders from other leaders is that charismatic leaders have an
intensified sensitivity of their followers’ needs. The results of the study support this
statement. In the study 66.66% of property managers were satisfied with their regional
managers level of communication when it came to supervisor listens and pays attention.
When the comparison was made to determine if there was a relationship between level of
satisfaction and the C-K scale constructs, exciting speaker, a positive significant level of
0.049 was found. The results show that there is a correlation between communication and
charismatic leaders quality, exciting speaker. According to Shastri, Mishra, and Sinha
(2010) it is the essence of how charismatic leaders articulate and formulate the vision of
the organization to their followers; it’s done in an inspiring manner. The speech of
charismatic leaders has been described as one that is energized and stimulating (Bono &
Ilies, 2006). The results of the study support the findings of Levine, Muenchen, and
Brooks (2010) study that concluded that charisma “the ability to listen, empathize with
and understand others” (p. 584). Charismatic leaders are known to be genuine and are
attentive listeners; they are slow to speak and know when it is appropriate to speak.
Receive Timely Information Regarding Job
In evaluating the satisfaction level of communication as it pertained to the
timeliness of information 66.66% of property managers were satisfied with the level of
communication that they are given. When compared to the C-K scale constructs there
were two constructs where the results proved to show a relationship existed. A

113
significance level of 0.059 was determined between communication satisfaction and the
charismatic leadership quality that regional manager was perceived as inspirational and
able to motivate by articulating effectively the importance of what organizational
members are doing. There was also a positive significance level found with the
charismatic leadership quality, often expresses personal concern for the needs and
feelings of other members of the organization. The significance level was 0.046.
According to the literature, charismatic leaders use their skill of social control to foresee
social cues as a measure to be attentive and sensitive to the needs and values of their
followers and in formulating and communicating their vision (Grove, 2010).
Proper Communication Channels for Conflict
Communication and mechanisms of communicating between VTs is an important
factor to consider in the success of VTs (Nydegger & Nydegger, 2010). The results of the
study show that 74.07% were satisfied with proper communication channels for conflict.
When comparing this construct to the C-K scale constructs no positive significant
relationship existed. While the construct, inspiring strategic organization goals was close
it did not meet the established significance level of 0.05. According to these results there
is not a relationship between charismatic leadership qualities and the satisfaction levels of
proper communication channels for conflict.
Active Grapevine Within Organization
The results of the study showed that only 29.62% of property mangers were
satisfied with the level of communication regarding an active grapevine within their
organization. According to the literature, team leaders, supervisors, leaders, managers are

114
encouraged by Nydegger and Nydegger (2010) to develop the required culture that
fosters an open communication among VTs. Through the use of social control and
sensitivity to followers’ need charismatic leaders will be able to connect and identify
various signals that maybe exemplified by their followers. In doing so, charismatic
leaders are able to take the cues that are given and make adjustments in their behavior as
a measure to increase communication satisfaction and overall satisfaction of leadership.
As I compared the results to the C-K scale constructs a significant positive relationship
existed between perception that regional managers possess qualities of charismatic leader
by showing sensitivity for the needs and feelings of other members in the organization.
For Research Question 2, I found significant levels between some of the
constructs, which could lead one to believe that there is some form of positive association
between the perceived subdimension (sensitivity to member’s needs, strategic vision, and
articulation) of charismatic leadership qualities and communication satisfaction. Within
research question two there were five charismatic leadership qualities that were found to
have a positive significant relationship with the identified communication satisfaction
constructs. The perception that the regional manager expressed personal concern for the
needs and feelings of other members of the organization showed significant positive
relationships with two of the communication constructs. The positive relationship that
was found to exist between the charismatic qualities and communication satisfaction can
be used to enhance the leadership skills of virtual leaders. A positive significant
relationship was also found between two of the communication satisfaction constructs,
recognition of efforts and supervisor listens and pays attention to me and the charismatic

115
leadership quality, exciting speaker. This relationship confirms the findings of the study
conducted by Bono and Ilies (2006) that it is the speech of charismatic leaders that
energizes and stimulates those they lead. Charismatic leaders embrace the skill of
articulation. It is this skill that is imperative for regional managers as they lead their
property mangers. The perception that regional managers were inspirational and able to
motivate by articulating effectively the importance of what organizational members are
doing was found to have significant relationship with the communication satisfaction
level of receiving in time the information needed to perform job. This finding supports
the literature regarding the need to embrace the skill of articulation (Bono & Ilies, 2006).
The next charismatic leadership quality that was found to have a significant positive
relationship was perception that regional manager showed sensitivity for the needs and
feelings of the other members in the organization. By connecting with property managers
on a personal level though recognizing the needs of followers, researchers have found
that charismatic leaders are able to implement change and gain support (Groves, 2005).
The final charismatic leadership quality to be found to have relationship was inspiring
strategic organizational goals.
Research Question 3
Is there an association between communication satisfaction and job satisfaction
among VTs? The evaluation of research question three consisted of comparing 13 items
from the CSQ scale and three items from the C-K scale. The following three items from
the C-K scale were compared to the CSQ scale, the leader:

116
1. Shows sensitivity for the needs and feelings of the other members in the
organization
2. Provides inspiring strategic and organizational goals
3. Recognizes the abilities and skills of other members in the organization
Satisfaction with job.
Conger, Kanungo, and Menon (2000) revealed in their study that charismatic
leaders were linked to positive correlation between employees’ job performance and job
satisfaction. The results of the study showed that 70.37% of property managers were
satisfied with their jobs. On the contrary, when a comparison was made between job
satisfaction and the three constructs from the C-K scale, there was not a relationship. In
this case charismatic leadership qualities was not found to have a relationship with
communication satisfaction regarding job satisfaction.
Judgment, Recognition for Efforts, and job Requirements
Job performance and requirements are essential qualities in order for leaders to
keep subordinates informed in all areas. According to Lu, Watson-Manheim, Chudoba,
and Wynn (2006) the role of the team leader is to organize and synchronize the workflow
and activities of the team members, in other words outline job requirement. The one
aspect that enables all of the functions to be accomplished is effective and satisfactory
communication. When the property managers were surveyed to gauge their perception
communication levels regarding how they were being judged, 37.04% were satisfied with
the level communication they are being given. When it comes to their level of satisfaction
regarding communication on recognition for efforts, 40.74% of the property managers

117
were satisfied with their regional manager’s level of communication. In regards to being
informed of job requirements, 51.85% of property managers were satisfied.
Charismatic leaders are known for their high level of interpersonal
communication skills (Levine, Muenchen, & Brooks, 2010). When the comparison was
made between the above three charismatic leadership qualities and that of the
communication satisfaction constructs the there was only one positive significant
relationship reveal and that was between information communicated about how being
judged and the charismatic quality of inspiring strategic and organizational goals with a
positive significance level of 0.024.
Changes in and Financial Standing of Organization
One of roles of a team leader is to keep the team on track towards reaching the
organization’s goal (Bergiel, Bergiel, & Balsmeier, 2008). Charismatic leaders have been
known to encourage change among those that they lead due to their sensitivity to their
followers’ needs and their skill in articulation. When the property managers of the study
were surveyed about the level of communication satisfaction regarding changes in their
organization, 65.38% were satisfied with the level of communication on changes and
88.89% were satisfied with communication levels regarding the financial standing of
their organization. On the contrary, when the comparison was made with both
communication satisfaction constructs and the C-K scale constructs neither
communication constructs showed a positive significant relationship.
118
How Problems on the Job Are Handled
The communication satisfaction level of the property managers regarding how
their regional manager handles problems was 40.74%. As I compared the results to the C-
K scale constructs a significant positive relationship existed between perceptions that
regional manager provides inspiring strategic and organizational goals that yielded
0.022% significance level. This quality of charismatic leadership would enhance VTs and
their communication levels.
Benefits and Pay
Based on the results of Chapter 4, 66.66% of the property managers were satisfied
with the level of communication as it pertained to communication on benefits and pay.
When the comparison was made to determine if there was relationship between level of
satisfaction of benefits and pay and the C-K scale constructs, there was not a positive
significant relationship found.
Supervisors Know and Understand Problems and Offer Guidance to Solve
Problems
It is the art of articulation that assists charismatic leaders in understanding the
issues of subordinates. Charismatic leaders are able to sense imperative cues and craft
their message appropriately. The use of social control allows charismatic leaders the
ability to identify certain signals that are given off by followers and adjust their actions
accordingly. Leaders of VTs must find a way to connect and stay engaged with their
teams. The results show that 51.83% property managers are satisfied with the level of
communication regarding their regional manager knowing and understanding their
119
problems and 62.96% were satisfied with the level of communication regarding offering
of guidance to solve problems. When the comparison was made between charismatic
leadership qualities and that of the communication satisfaction constructs a positive
significant relationship reveals that there is a relationship between guidance for solving
problems and inspiring organizational goals with a positive significance level of 0.001.
Listens and Pays Attention
Based on the results of Chapter 4, 66.66% of property managers are satisfied with
the level of communication regarding listening and paying attention to them. When
compared to the C-K scale constructs a positive significant relationship existed between
inspiring organizational goals with a positive significance level of 0.001. The results
support the study by Levine, Muenchen, and Brooks (2010) where they found that
charisma in leaders yields leaders with the skill to listen and empathize.
Proper Communication Channels for Conflict
The satisfaction level among the property managers regarding communication and
property channels for conflict yielded 66.66%. When the construct was compared to the
C-K scale constructs, inspiring strategic organizational goals, a positive significance level
of 0.001 was found.
For Research Question 3, I found some significant levels between some of the
constructs that were reviewed, which also might lead one to believe that there is some
form of positive association between communication satisfaction and job satisfaction
among VTs. The C-K scale construct, inspiring strategic organizational goals was found
to have positive significant relationship with five of the communication satisfaction

120
constructs: (a) how being judged, (b) how problems being handled, (c) supervisor listens
and pays attention to me, (d) extent which the supervisor offers guidance for solving
problems, and (e) extent to which conflicts are handled through proper communication
channels. Some believe that teams that are lead by individuals that encompass at least
some of the behavioral qualities of a charismatic leader will be able to conjure confidence
in their followers and support which will lead to organization productivity (Shastri,
Mishra, & Sinha, 2010). While a positive significance relationship was not found
between all of the charismatic leadership qualities the results of the study suggest that
there are a number of qualities that have a positive significant relationship.
Limitations of the Study
There were a number of limitations noted in this study that affected the findings
and the ability to generalize the results to all VTs. The first limitation is that the data that
I collected was self-reported through the use of two surveys that were completed online,
which present difficulties in the accuracy of response and recall, which could limit data
analyses and interpretation. Second, the use of convenience sampling caused limited
generalizability of the study results because the participants were not required to
complete the survey, which resulted in underrepresentation of the population. The results
are not representative of all virtual organizations. The use of convenience sampling
increases the probability of bias within the study population. There are a number of other
limitations that are caused by convenience sampling such as; it is unknown why some
managers decided to complete the surveys while others did not. Potential reasons for
those who did not complete the survey could have to do with trust and the intentions of

121
the survey or simply too busy to complete the survey. The third limitation is the small
sample size and low response rate. Fourth is the results were the personal opinion and
thoughts of the property managers and their perception of their regional manager. Lastly,
due to the fact the survey was administered via the Internet, participants were not able to
ask questions for clarity, which would have an effect on understanding.
Recommendations for Practice
This study should provide a resource of material for further leadership research
and will be valuable to current and future leadership scholars, researchers, company
trainers, and educators. The primary purpose of this study was to add to the body of
research regarding charismatic leadership and communication satisfaction within VTs.
Virtual organizations are encouraged to implement staff development and training
opportunities for virtual leaders with a focus on charismatic qualities such as sensitivity
to followers’ needs, articulation, exciting speaking, and inspiration. The research
highlights the positive ways that some charismatic leadership qualities can have on
improving and enhancing communication among VTs. I recommend the following
actions to be taken within the organization in efforts to transform leaders into charismatic
leaders to improve communication satisfaction: (a) implement monthly charismatic
leadership development training programs, (b) bi-weekly charismatic leadership qualities
check-up report (this report will require regional managers to self-evaluate the qualities
they feel they used within those two weeks that exemplified charisma), and (c) yearly
satisfaction questionnaires to be completed by property managers, the questionnaire will
include questions regarding charisma and communication. It is also suggested that

122
leadership development programs all over utilize the findings in the study and similar
studies for the purpose of educating and training existing and emerging leaders in the
spirit displayed by charismatic leadership. These recommendations are based on the
findings in the present study, and the goal of the recommendations is to equip VT leaders
with charismatic skills that have been proven to improve communication.
Recommendation for Further Research
In order to confirm or dispute the findings presented here, additional research is
needed. More specifically, I recommend that a study be done with a VT from a different
industry to see if there will be similar findings. The findings of the study indicated a
relationship between charismatic leadership qualities and communication satisfaction
does exist however; future study would benefit by isolating a smaller number of
charismatic leadership qualities and or smaller number of communication satisfaction
constructs. Each of the variables had a large number of constructs that were analyzed and
this made reporting the study findings a little challenging possibly confusing for the
reader. The study design and analysis performed does not tell us the extent of the
relationship but does set up the groundwork for future studies. The study included a small
population size, which makes it difficult to guarantee general conclusions regarding the
nature of outstanding charismatic leadership; therefore, I recommend that further work be
done for a larger sample size. Another recommendation would to include demographic
information and compare the gender findings against one another to determine if there is
a relationship between gender and charisma. Lastly, it would also benefit the body of

123
research to conduct a study on comparing the constructs used in the study between a
traditional organization (one that does not use VTs) to one that does.
Implications for Social Change
The purpose of the study was to examine the relationship of perceived charismatic
leadership qualities in VT leaders and communication satisfaction in VT members. The
findings provide a platform for future research studies to use that can impact how virtual
organizations can improve managerial guidance, through increasing communication
among team members and thus social ties among VT members will improve and bring
about social change. By using the results from this study with regard to encouraging
virtual leaders (a) to engage in activities that consistently generate ideas; (b) to pursue
organizational objectives, engage in activities involving considerable personal risk; (c) to
express personal concern for the needs and feelings of other members of the organization
(d) exciting speaker: (e) to inspire, motivate by articulating effectively the importance of
what organizational members are doing: and (f) to show sensitivity for the needs and
feelings of other members in the organization virtual leaders can be transformed into
leaders with charisma which has been linked to improved communication. The
implications for social change are that organization manager’s awareness of charismatic
leadership qualities and its positive effect on the enhancement of communication
satisfaction.
Conclusions
VTs have increased work productivity while simultaneously decreasing
organizational expenses (Stevenson & McGrath, 2004). The success of VTs relies heavily

124
on leadership and communication. The results of the study demonstrate that VT members
who are lead by leaders who possess some of the qualities of a charismatic leader have
higher levels of communication satisfaction among those they lead. Charismatic
leadership qualities are those that encompass qualities that enhance leaders and follower
relationships. Charismatic leaders are able to motivate others through their actions and
behaviors (Hayibor, Agle, Sears, Sonnenfield, & Ward, 2011).
According to Nydegger and Nydegger (2010), team leaders, supervisors, and
managers are encouraged to develop the required culture that fosters an open
communication among VTs. Based on the findings of this study, as a measure to enhance
communication satisfaction leaders should engage in activities that will allow them to
develop and improve their leadership skills by focusing on the following areas: skill of
generating ideas, consistently pursue organization objectives and goals, and at times
engage in activities that will involve somewhat of considerable personal risk. It is also
encouraged that leaders show sensitivity to the needs and feelings of those they lead,
develop skills to be an exciting speaker, and also develop skills that will motivate others
through articulating effectively the importance of what organizational member are doing.
By focusing on fostering charismatic leadership qualities, which were found to have a
positive and significant relationship among VT leaders, organizations will be enhancing
the flow of communication and thus improving productivity within the organization.

125
References
Babbie, E. (2011). The practice of social research (13th ed.). Belmont, CA: Wadsworth
Cengage Learning.
Babcock-Roberson, M., & Strickland, O. (2010). The relationship between charismatic
leadership, work engagement, and organizational citizenship behaviors. The
Journal of Psychology, 144(3). 313-326. doi:10.1080/00223981003648336
Bergiel, B. J., Bergiel, E. B., & Balsmeier, P. W. (2008). Nature of virtual teams: A
summary of their advantages and disadvantages. Management Research
News, 31(2), 99–110. doi:10.1108/01409170810846821
Berry, G. (2010). Enhancing the effectiveness of virtual teams. Journal of Business
Communication, 48(2), 186-206. doi:10.1177/0021943610397270
Bono, J., & Ilies, R. (2006). Charisma, positive emotions and mood contagion. The
Leadership Quarterly, 17(4), 317-334. doi:10.1016/j.leaqua.2006.04.008
Brown, M., & Trevino, L. (2006). Socialized charismatic leadership, values, congruence,
and deviance in work groups. Journal of Applied Psychology, 91(4), 654-962.
doi:10.1037/0021-9010.91.4.954
Cengage Research Methods Workshops (2005). Surveys research methods workshop.
Retrieved from
http://www.wadsworth.com/psychology_d/templates/student_resources/workshop
s/resch_wrk.html
Creative Research System. (2012). Sample Size Calculator. Retrieved from
http://www.surveysystem.com/sscalc.htm

126
Conger, J., & Kanungo, R. (1994). Charismatic leadership in organizations: Perceived
behaviorial attributes and their measurements. Journal of Organizational
Behavior, 15, 439-452. doi:10.1002/job.4030150508
Conger, J., Kanungo, R., Menon, T., & Mathur, P. (1997). Measuring charisma:
Dimensionality and validity of the conger-kanungo scale of charismatic
leadership, 14, 290-302. doi:10.1111/j.1936-4490.1997.tb00136.x
Conger, J., Kanungo, R., & Menon, S. (2000). Charismatic leadership and follower
effects. Journal of Organizational Behavior, 21, 747-767. doi:10.1002/1099-
1379(200011)21:7<747::AID-JOB46>3.0CO;2-J
Crino, M. D., & White, M. C. (1981). Satisfaction in communication: An examination of
the Downs-Hazen measure. Psychological Reports, 49, 831-838.
doi:10.2466/pr0.1981.49.3.831
Creswell, J. W. (2009). Research design qualitative, quantitative, and mixed methods
approaches (3rd ed.). Thousand Oaks, CA: Sage.
D’Amato, A., Eckert, R., Ireland, J., Quinn, L., & Van Velsor, E. (2010). Leadership
practices for corporate global responsibility. Journal of Global Responsibility,
1(2), 225-249. doi:10.1108/20412561011079371
Derosa, D. (2009). Virtual success the keys to satisfaction in leading from a distance.
Leadership in Action, 28(6), 9-11. doi:10.1002/lia.1269
Downs, C. W., & Hazen, M. (1977). A factor analytic study of communication
satisfaction. Journal of Business Communication, 14(3), 63-73.
doi:10.1177/002194367701400306

127
Drouin, Z. N., Bourgault, M., & Gervais, C. (2010). Effects of organizational support on
components of virtual project teams. International Journal of Managing Projects
in Business, 3 (4), 625 – 641. doi:10.1108/17538371011076082
Field, A. (2009). Discovering statistics using SPSS (3rd ed.). London: Sage.
Frankfort-Nachmias, C., & Nachmias, D. (2008). Research methods in the social sciences
(7th ed.). New York, NY: Worth.
Gatlin-Watts, R., Carson, M., Horton, J., Maxwell, L., & Maltby, N. (2007). A guide to
global virtual teaming. Team Performance Management, 13(1/2), 47–52.
doi:10.1108/13527590710736725
Gera, S. (2013). Vitural teams versus face to face teams: A review of literature. Journal
of Business and Management, 11(2), 1-4. Retrieved from
http://www.iosrjournals.org/iosr-jbm/papers/Vol11-issue2/A01120104.pdf
Globalworkplaceanalytics.com. (2013). The latest telecommuniting statistics. Retrieved
from http://www.globalworkplaceanalytics.com/telecommuting-statistics.
Groves, K. (2005). Linking leaders skills, followers attitudes, and contextual variables via
an integrated model of charismatic leadership. Journal of Management, 31(2),
255-277. doi:10.1177/0149206304271765
Hajro, A., & Pudelko, M. (2010). An analysis of core-competences of successful
multinational team leaders. International Journal of Cross Cultural Management,
10(2), 175-194. doi:10.1177/1470595810370910
Hayibor, S., Agle, B., Sears, G., Sonnenfeld, J., & Ward, A. (2011). Value congruence
and charismatic leadership in CEO –top manager relationships: An empirical

128
investigation. Journal of Business Ethics, 102, 237-254. doi:10.1007/s10551-011-
0808-y
Lapierre, L., Bremner, N., & McMullan, A. (2012). Strength in numbers how employees’
acts of followership can influence their manager’s charismatic leadership
behavior. Journal of Psychology, 220(4): 251-261. doi:10.1027/2151-
2604/a000119
Levine, K., Muenchen, R. A., & Brooks, A. (2010). Measuring transformational and
charismatic leadership: Why isn’t charisma measured. Communication
Monographs, 77(4), 576-591. doi:10.1080/03637751.2010.499368
Lu, M., Watson-Manheim, M. B., Chudoba, K. M., & Wynn, E. (2006). Virtuality and
team performance: Understanding the impact of variety of practices. Journal of
Global Information Technology Management, 9(1), 4–23. doi:10.1111/j.1365-
2575.2005.00200.x
Mohamed, M. (2007). The triad of paradigms in globalization, ICT, and knowledge
management interplay. VINE, 37(2), 100. doi:10.1108/03055720710759892
Monalisa, M., Daim, T., Mirani, F., Dash, P., Khamis, R., & Bhusari, V. (2008).
Managing global design teams. Research Technology Management, 51(4), 48-59.
doi: 0.1109/PICMET.2007.4349458
Neufeld, D., Wan, Z., & Fang, Y. (2010). Remote leadership, communication satisfaction
and leader performance. Group Decision Negotiation, 19, 227-246,
doi:10.1007/s10726-008-9142-x

129
Nydegger, R., & Nydegger, L. (2010). Challenges in managing virtual teams. Journal of
Business & Economics Research, 8(3), 69-82. Retrieved from
http://www.journals.cluteonline.com/index.php/JBER/article/viewFile/690/676
Prachyl, C., Quintanilla, H., & Gutiérrez, L. (2011). Managing international consulting
projects and international business courses using virtual teams. Journal of
Instructional Pedagogies, 5, 1-9. Retrieved from
https://aabri.com/manuscripts/10646.pdf
Riggio, R. E. (1989). Social Skills Inventory manual. Palo Alto, CA: Consulting
Psychologist Press.
Senge, P. (2006). The fifth discipline: The art & practice of the learning organization.
New York, NY: Doubleday.
Shastri, R. K., Mishra, S., & Shinha, A. (2010). Charismatic leadership and
organizational commitment: An Indian perspective. African Journal of Business
Management, 4(10), 1946-1953 Retrieved from
http://academicjournals.org/article/article1380791513_Shastri%20et%20al.pdf
Siebdrat, F., Hoegl, M., & Ernst, H. (2009). How to manage virtual teams. MIT Sloan
Management Review, 50(4), 63–68. Retrieved from
http://sloanreview.mit.edu/files/2009/06/8412f42034.pdf
Singleton, R., & Straits, B. (2010). Approaches to social research (5th ed.). New York,
NY: Oxford University.
Smith, P. (2003). Workplace learning and flexible delivery. Review of Educational
Research, 73, 53-88. doi:10.3102/00346543073001053

130
Sosik, J., Juzbasich, J., & Uk Chun, J. (2011). Effects of moral reasoning and
management level on ratings of charismatic leadership, in-role and extra-role
performance of managers: A multi-source examination. The Leadership
Quarterly, 22, 434-450. doi:10.1016/j.leaqua.2011.02.015
Staples, D. S., & Zhao, L. (2006). The effects of cultural diversity in virtual teams versus
face-to-face teams. Group Decision and Negotiation, 15(4), 389–406.
doi:10.1007/s10726-006-9042-x
Staples, S., & Webster, J. (2007). Exploring traditional and virtual team members’ “best
practices”: A social cognitive theory perspective. Small Group Research, 38(1),
60-67. doi:10.1177/1046496406296961
Stevenson, W., & McGrath, E. (2004). Differences between on-site and off-site teams:
Manager perceptions. Team Performance Management, 10(5/6), 127-132.
doi:10.1108/13527590410556854
Suarez-Balcazar, Y., Balcazar, F., & Taylor-Ritzler, T. (2009). Using the internet to
conduct research with culturally diverse populations: Challenges and
opportunities. American Psychological Association, 15(1), 96-104.
doi:10.1037/a0013179
Trochim, W., & Donnelly, J. (2008). Research methods knowledge base (3rd ed.).
Mason, OH: Cengage Learning.
Wakefield, R., Leidner, D., & Garrison, G. (2008). A model of conflict, leadership, and
performance in virtual teams. Information Systems Research, 19(4), 434-455.
doi:10.1287/isre.1070.0149

131
Worden, S. (2005). Religion in strategic leadership: A positivistic, normative/theological,
and strategic analysis. Journal of Business Ethics, 57, 221-239.
doi:10.1007/s10551-004-6943-y
Zaccaro, S. J., & Bader, P. (2003). E-leadership and the challenges of leading e-teams.
Organizational Dynamics, 31(4), 77-87. doi:10.1016/S0090-2616(02)00129-8

132
Appendix A: Permission Letter
From: "Binur, Michelle" <[email protected]>
Subject: RE: Permission to use Conger-Kanungo Charismatic Leadership Survey Date: February 19, 2013 2:50:30 PM EST
To: "[email protected]" <[email protected]>
Dear Felicia,
Thank you for your request. Please consider this e-mail as permission to reprint the
material as detailed below in your upcoming dissertation. Please note that this permission
does not cover any 3rd party material that may be found within the work. We do ask that
you credit the original source, SAGE Publications. Please contact us for any further
usage.
Good luck with your dissertation,
Michelle Binur
-----Original Message-----
From: WEB-ORDER
Sent: Tuesday, February 12, 2013 9:49 AM
To: permissions (US)
Subject: FW: Permission to use Conger-Kanungo Charismatic Leadership Survey
From: [email protected]
Subject: Re: Permission to use Conger-Kanungo Charismatic Leadership Survey Date: February 12, 2013 10:29:47 AM EST
To: Felicia Chachere <[email protected]>
Dear Felicia,
You have my permission to use the Conger-Kanungo Charismatic Leadership
Questionnaire for your dissertation work with appropriate citation.
Rabindra N Kanungo.
-----Original Message----- From: Felicia Chachere
Sent: Tuesday, February 12, 2013 2:37 AM
To: [email protected] ; [email protected] ; [email protected]
Subject: Permission to use Conger-Kanungo Charismatic Leadership Survey
Hello,
My name is Felicia Chachere and I am a Walden PhD student working on my dissertation
and my focus is on improving communication in virtual teams from a charismatic

133
leadership approach. I would like to use the Conger-Kanungo Charismatic Leadership
survey. I've read a number journal articles regarding your work on charismatic leadership
and would very much like to gain permission to use the survey in my dissertation.
I appreciate any help you could offer on this.
Thank you so much in advance for your help,
Felicia Chachere
PhD Candidate
Walden University

134
Appendix B: Survey Invitation E-mail
My name is Felicia Chachere. I am a Ph.D. in Management student at Walden University.
I am emailing you to ask for your participation in my research study. The purpose of my
study is to evaluate the relationship between charismatic leadership qualities and
communication satisfaction in virtual teams.
Participation is strictly voluntary. Your participation would assist me in my research. The
survey is administered through Survey Monkey. It consists of two surveys with a total of
68 questions and should take less than 35 minutes to complete. Please read carefully all
the questions and give your best response.
All of your responses will be kept confidential. The researcher will not use your
information for any purposes outside of this research project, Also, the researcher will not
include your name or anything else that could identify you in any reports of the study.
Please be advised that by completing the survey questions, you are consenting to have
your confidential responses published.
Instructions for participation:
1. Click on the survey monkey link below.
2. Follow the instructions, answer each question carefully.
3. Click submit at the end of the survey when you are finished.
Eligible Criteria:
Must be a property manager
Survey Link:
Questions and concerns:
If you have any questions about the study please contact me.
Researcher-Felicia Chachere,
Thank you for taking the time to assist me in this research. I greatly appreciate your
feedback in this endeavor.

135
Appendix C: Conger-Kanungo Charismatic Leadership Questionnaire
In your organizational experience as a General Manager of student housing
industry, you are supervised by a Regional Manager or Regional Vice President
virtually (your supervise directs from another office) which makes you apart of a
virtual team. A virtual team is one whose members work for the same company but in
different geographic locations and primary communication is through electronic
communication (emails, conference calling, webinars, etc.). In this environment you
have the opportunity to observe your supervisor’s leadership abilities. Please assess
him/her on the basis of the statements in this questionnaire. Indicate the extent to
which each of the following items is characteristic of your Regional Manager/Regional
Vice President by citing the appropriate category next to the item.
The response categories are numbers 6 to 1 represent the categories in the following way:
6 = Very Characteristics 3 = Slightly Uncharacteristic
5 = Characteristic 2 = Uncharacteristic
4 = Slightly Characteristic 1 = Very Uncharacteristic
15. Influences others by developing mutual liking and respect 6 5 4 3 2 1
16. Readily recognizes barriers/forces within the organization that may block or
hinder achievement of his/hers goal 6 5 4 3 2 1
17. Engages in unconventional behavior in order to achieve organizational goals
6 5 4 3 2 1
18. Entrepreneurial; seizes new opportunities in order to achieve goals 6 5 4 3 2 1
19. Shows sensitivity for the needs and feelings of the other members in the
organization 6 5 4 3 2 1
20. Uses nontraditional mans to achieve organizational goals 6 5 4 3 2 1
21. In pursuing organizational objectives, engages in activities involving considerable
self-sacrifice 6 5 4 3 2 1
22. Readily recognizes constraints in the physical environment (technological
limitations, lack of resources, etc.) that may stand in the way of achieving
organizational objectives 6 5 4 3 2 1
23. Advocates following non-risky, well-established course of action to achieve
organizational goals 6 5 4 3 2 1
24. Provides inspiring strategic and organizational goals 6 5 4 3 2 1

136
25. Readily recognizes constraints in the organization’s social and cultural
environment (cultural norms, lack of grassroots, etc.) that may stand in the way of
achieving organizational objectives 6 5 4 3 2 1
26. Takes high personal risks for the sake of the organization 6 5 4 3 2 1
27. Inspirational; able to motivate by articulating effectively the importance of what
organizational members are doing 6 5 4 3 2 1
28. Consistently generates new ideas for the future of the organization 6 5 4 3 2 1
29. Exciting public speaker 6 5 4 3 2 1
30. Often expresses personal concern for the needs and feelings of other member of
the organization 6 5 4 3 2 1
31. Tries to maintain the status quo or the normal way of doing things
6 5 4 3 2 1
32. Often exhibits very unique behavior that surprises other members of the
organization 6 5 4 3 2 1
33. Recognizes the abilities and skills of other members in the organization
6 5 4 3 2 1
34. Often incurs high personal costs for the good of the organization
6 5 4 3 2 1
35. Appears to be skillful performer when presenting to a group
6 5 4 3 2 1
36. Has a vision; often brings up ideas about possibilities for the future
6 5 4 3 2 1
37. Readily recognizes new environmental opportunities (favorable physical and
social conditions) that may facilitate achievement of organizational objectives
6 5 4 3 2 1
38. Recognizes the limitations of other members in the organization
6 5 4 3 2 1
39. In pursuing organizational objectives, engages in activities involving considerable
person risk
6 5 4 3 2 1

137
Appendix D: Communication Satisfaction Questionnaire
Introduction: Most of us assume that the quality and amount of communication in our
jobs contribute to both our job satisfaction and our productivity/ through this study we
hope to find out how satisfactory communication practices are and if there is any
relationship to the level of satisfaction and your perception of charismatic leadership
qualities of your supervisor. I appreciate you taking time to complete the questionnaire.
1. How satisfied are you with your job?
____ 1. Very Satisfied
____ 2. Satisfied ____ 3. Somewhat Satisfied
____4. Indifferent
____ 5. Somewhat dissatisfied
____ 6. Dissatisfied ____ 7. Very dissatisfied
2. In the past 6 months, what has happened to your level of satisfaction? (check 1)
____1. Gone up ____2. Stayed the same ____3. Gone down
3. If the communication associated with you job could be changed in any way to make
you more satisfied, please indicate how:
A. Listed below are several kinds of information often associated with a person’s job.
Please indicate how satisfied you are with the amount and/or quality of each kind of
information by circling the appropriate number at the right.
Very Very Dissatisfied Satisfied
1 2 3 4 5 6 7
(Participants use the above scale to respond to all items)
4. Information about my progress in my job. ---1---2---3---4---5---6---7---
5. Personal news ---1---2---3---4---5---6---7---

138
6. Information about organizational policies and goals ---1---2---3---4---5---6---7---
7. Information about how my job compares with others ---1---2---3---4---5---6---7---
8. Information about how I am being judged ---1---2---3---4---5---6---7---
9. Recognition of my efforts ---1---2---3---4---5---6---7---
10. Information about departmental policies and goals ---1---2---3---4---5---6---7---
11. Information about the requirements of my job ---1---2---3---4---5---6---7---
12. Information about government action affecting my organization
---1---2---3---4---5---6---7---
13. Information about changes in our organization ---1---2---3---4---5---6---7---
14. Reports on how problems in my job are being handled ---1---2---3---4---5---6---7---
15. Information about benefits and pay ---1---2---3---4---5---6---7---
16. Information about our organization’s financial standing ---1---2---3---4---5---6---7---
17. Information about accomplishments and/or failures of the organization
---1---2---3---4---5---6---7---
B. Please indicate how satisfied you are with the following (write the appropriate number
at right).
18. Extent to which my superiors know and understand the problems faced by
subordinates
---1---2---3---4---5---6---7---
19. Extent to which the organization’s communication motivates and stimulates an
enthusiasm for meeting its goals ---1---2---3---4---5---6---7---
20. Extent to which my supervisor listens and pays attention to me
---1---2---3---4---5---6---7---
21. Extent to which the people in my organization have great ability as communicators

139
---1---2---3---4---5---6---7---
22. Extent to which my supervisor offers guidance for solving job related problems
---1---2---3---4---5---6---7---
23. Extent to which the organization’s communication makes me identify with it or feel a
vital part of it ---1---2---3---4---5---6---7---
24. Extent to which the organization’s communications are interesting and helpful
---1---2---3---4---5---6---7---
25. Extent to which my supervisor trusts me ---1---2---3---4---5---6---7---
26. Extent to which I receive in time the information needed to do my job
---1---2---3---4---5---6---7---
27. Extent to which conflicts are handled appropriately through proper communication
channels
---1---2---3---4---5---6---7---
28. Extent to which the grapevine is active in our organization---1---2---3---4---5---6---7-
29. Extent to which my supervisor is open to ideas ---1---2---3---4---5---6---7---
30. Extent to which horizontal communication with other organizational members is
accurate and free flowing
---1---2---3---4---5---6---7---
31. Extent to which communication practices are adaptable to emergencies
---1---2---3---4---5---6---7---
32. Extent to which my work group is compatible ---1---2---3---4---5---6---7---
33. Extent to which our meetings are well organized ---1---2---3---4---5---6---7---
34. Extent to which the amount of supervision given me is about right
---1---2---3---4---5---6---7---
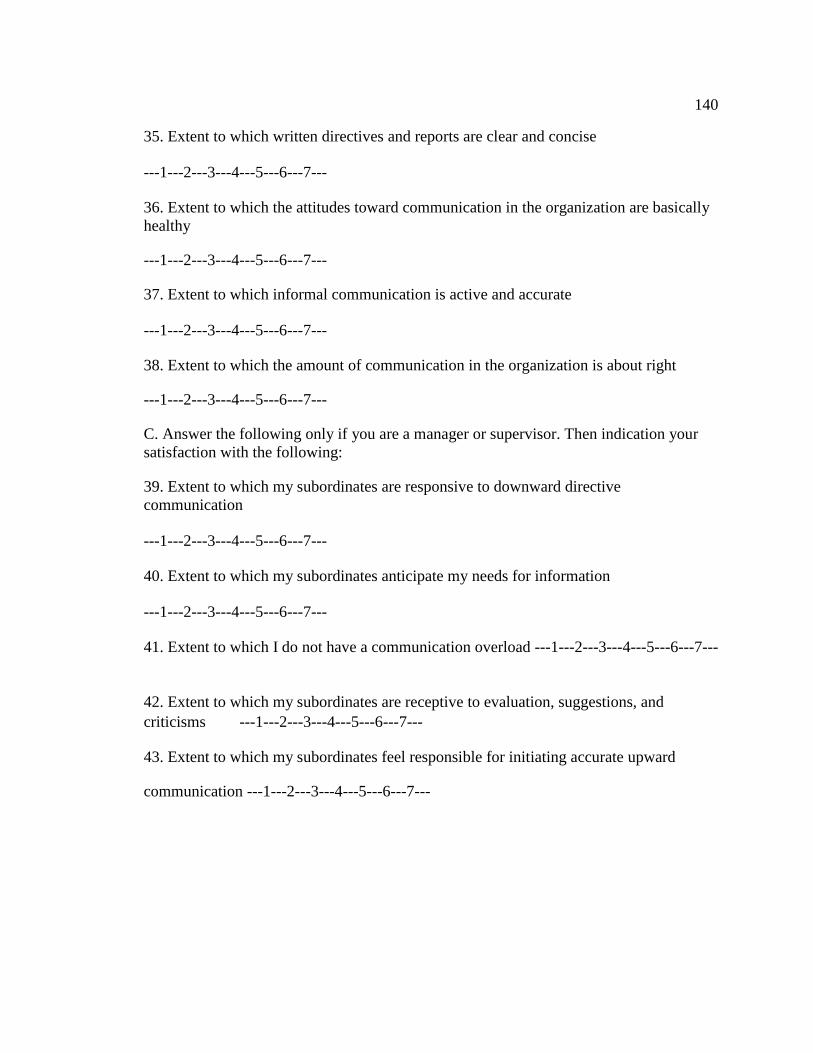
140
35. Extent to which written directives and reports are clear and concise
---1---2---3---4---5---6---7---
36. Extent to which the attitudes toward communication in the organization are basically
healthy
---1---2---3---4---5---6---7---
37. Extent to which informal communication is active and accurate
---1---2---3---4---5---6---7---
38. Extent to which the amount of communication in the organization is about right
---1---2---3---4---5---6---7---
C. Answer the following only if you are a manager or supervisor. Then indication your
satisfaction with the following:
39. Extent to which my subordinates are responsive to downward directive
communication
---1---2---3---4---5---6---7---
40. Extent to which my subordinates anticipate my needs for information
---1---2---3---4---5---6---7---
41. Extent to which I do not have a communication overload ---1---2---3---4---5---6---7---
42. Extent to which my subordinates are receptive to evaluation, suggestions, and
criticisms ---1---2---3---4---5---6---7---
43. Extent to which my subordinates feel responsible for initiating accurate upward
communication ---1---2---3---4---5---6---7---

141
Appendix E: Regression Results Tables
Table E1
Regression Results for Research Question 1: Comparing CSQ Scale (Question 19) to C-K
Scale (Questions 1, 4, 6, 7, 8, 9, 12, 14, 20, 25)
Dependent Variable Independent Variable B Std. Error T Sig.
Extent to which the organization’s communication motivates and stimulates an enthusiasm for meeting its goals
Influences others -.079
.448 -.176 .863
seizes new opportunities goals
-.432
.352 -
1.230 .238
Nontraditional means to achieve goals
.226 .348 .650 .526
Engages activities self-sacrifice
-.191
.299 -.639 .532
Recognizes constraints .231 .492 .469 .646 Non-risky well established course action achieve goal
-.196
.276 -.711 .488
High personal risk sake of org.
.021 .379 .055 .957
Consistently generates ideas future of org.
.543 .380 1.430 .173
Incurs personal costs good org.
-.217
.261 -.832 .419
Pursuing org. obje. Engages activities considerable person risk
-.535
.222 -
2.414 .029*
Table E2
Regression Results for Research Question 1: Measuring Constructs of Survey Question
(#22) CSQ Scale and C-K Scale (Questions: 1, 4, 6, 7, 8, 9, 12, 14, 20, 25)
Dependent Variable
Independent Variable B Std. Error t Sig
Extent to which my supervisor offers guidance for solving job related problems
Influences others .095 .540 .177 .862
Seizes new opportunities goals
-.424
.424 -1.001 .333
Nontraditional means to achieve goals
.033 .420 .079 .938
Engages activity self-sacrifice
.241 .361 .667 .515
Recognizes constraints -.138
.593 -.232 .820

142
Non-risky well established course action achieve goal
-.374
.332 -1.126 .278
High personal risk sake of org
.037 .457 .082 .936
Consistently generates ideas future of org
1.281
.458 2.798 .014*
Incurs personal costs good org
.280 .315 .890 .388
Pursuing org obj engages activities risk
-.327
.267 -1.225 .239
Table E3
Regression Results for Research Question 1: Measuring Constructs of (Survey Question
#23) CSQ Scale and C-K Scale (Questions: 1, 4, 6, 7, 8, 9, 12, 14, 20,25)
Dependent
Variable Independent Variable B
Std.
Error t Sig.
Extent to which the
organization’s
communication
makes me identify
with it or feel a vital
part of it
Influences others -.356 .616 -.579 .572
Seizes new opportunities goals -.268 .483 -.555 .587
Non-traditional means to achieve
goals .480 .479 1.003 .332
Engages activities self-sacrifice .061 .412 .149 .884
Recognizes constraints .510 .677 .753 .463
Non-risky well established course
action achieve goal .106 .379 .279 .784
High personal risk sake of org -.622 .521 -1.194 .251
Consistently generates ideas
future of org .548 .522 1.050 .311
Incurs personal costs good org .019 .359 .053 .959
Pursuing org obj engages activities
risk -.418 .305 -1.371 .191

143
Table E4
Regression Results for Research Question 1: Measuring Constructs of Survey (Question
#33) CSQ Scale and C-K Scale (Questions: 1, 4, 6, 7, 8, 9, 12, 14, 20, 25)
Dependent Variable Independent Variable B
Std.
Error t Sig.
Extent to which our meetings are well
organized
Influences others .037 .207 .176 .862
Seizes new opportunities
goals -.183 .163
-
1.123 .279
Non-traditional means to
achieve goals .222 .161 1.375 .189
Engages activities self-
sacrifice .128 .139 .921 .371
Recognizes constraints -.005 .228 -.023 .982
Non risky well established
course action achieve goal -.228 .128
-
1.786 .094
High personal risk sake of
org -.171 .176 -.972 .347
consistently generates ideas
future of org .493 .176 2.801 .013*
Incurs personal costs good
org -.057 .121 -.473 .643
Pursuing org obj engages
activities risk -.274 .103
-
2.669 .017*
Table E5
Regression Results for Research Question 1: Measuring Constructs of Survey (Question
34) of CSQ Scale and C-K Scale (Questions: 1, 4, 6, 7, 8, 9, 12, 14, 20, 25)

144
Dependent Variable Independent Variable B Std. Error t Sig
Extent to which the amount of
supervision given me is about
right
Influences others .255 .330 .773 .451
Seizes new opportunities
goals -.115 .259 -.443 .664
Non-traditional means to
achieve goals .125 .257 .486 .634
Engages activities self-
sacrifice -.064 .221 -.291 .775
Recognizes constraints .159 .363 .439 .667
Non risky well established
course action achieve goal -.154 .203 -.756 .461
High personal risk sake of
org -.216 .279 -.773 .451
consistently generates
ideas future of org .408 .280 1.456 .166
Incurs personal costs good
org .017 .192 .090 .929
Pursuing org obj engages
activities risk -.070 .163 -.431 .672
Table E6
Regression Results for Research Question 1: Measuring Constructs of Survey (Question
35) of CSQ Scale and C-K Scale (Questions: 1, 4, 6, 7, 8, 9, 12, 14, 20, 25)
Dependent Variable Independent Variable
B Std. Error T Sig
Extent to which
written directives and
reports are clear and
concise Influences others
.367 .383 .958 .353

145
Table E7
Regression Results for Research Question 1: Measuring Constructs of Survey (Question
36) of CSQ Scale and C-K Scale (Questions: 1, 4, 6, 7, 8, 9, 12, 14, 20, 25)
Seizes new opportunities
goals -.475 .301 -1.581 .135
Non-traditional means to
achieve goals -.179 .298 -.602 .556
Engages activities self-
sacrifice .387 .256 1.511 .151
Recognizes constraints
-.109 .421 -.260 .798
Non risky well established
course action achieve
goal -.135 .236 -.574 .575
High personal risk sake of
org -.014 .324 -.044 .966
Consistently generates
ideas future of org .800 .325 2.463 .026*
Incurs personal costs
good org .045 .223 .203 .842
Pursuing org obj engages
activities risk -.109 .190 -.576 .573

146
Dependent Variable Independent Variable B Std. Error t Sig.
Extent to
which the
attitudes
toward
communicati
on in the
organization
are basically
healthy
Influences others .160 .486 .330 .746
Seizes new opportunities goals -.227 .382 -.595 .561
Non-traditional means to achieve
goals -.407 .378 -1.077 .298
Engages activities self-sacrifice .413 .325 1.272 .223
Recognizes constraints -.791 .534 -1.481 .159
Non risky well established course
action achieve goal -.017 .299 -.056 .956
High personal risk sake of org .077 .411 .187 .854
consistently generates ideas
future of org 1.356 .412 3.289 .005*
Incurs personal costs good org -.145 .283 -.510 .618
Pursuing org obj engages
activities risk -.357 .241 -1.483 .159
Table E8
Regression Results for Research Question 2 Comparing CSQ Scale (Question )4 to C-K
Scale (Questions: 2, 3, 5, 10, 11, 13, 15, 16, 17, 19, 21-24)
Dependent Variable Independent Variable B
Std.
Error t Sig.
Information about my
progress in my job recognizes barriers -.128 .759 -.169 .870
Engages in unconventional behavior .174 .299 .581 .577
Sensitivity to needs of others -.251 .792 -.317 .759
Inspiring strategic organizational goals 1.440 .946 1.522 .167
Recognizes constraints org social culture
environ .397 .747 .531 .610

147
Inspirational motivate articulating effectively .327 .829 .395 .704
Exciting speaker -1.358 .957 -1.419 .194
Express personal concern of others 1.577 .826 1.908 .093
Maintain status quo normal way -.027 .396 -.069 .947
Recognizes ability and skills others -.589 .796 -.740 .480
Appears to be skillful presenting .787 .679 1.158 .280
Vision brings ideals for future -1.605 1.158 -1.386 .203
Recognizes new environment .087 1.025 .085 .934
recognizes limitations members .798 .800 .998 .348
Table E9
Regression Results for Research Question 2 Comparing CSQ Scale (Question 5) toC-K
Scale (Questions: 2, 3, 5, 10, 11, 13, 15, 16, 17, 19, 21-24)
Dependent
Variable Independent Variable B
Std.
Error t Sig.
Personal
news recognizes barriers .004 .481 .009 .993
Engages in unconventional behavior -.039 .190 -.204 .843
Sensitivity to needs of others -.205 .502 -.408 .694
Inspiring strategic organizational goals -.593 .600 -.989 .352
Recognizes constraints org social
culture environ .250 .474 .529 .611

148
Inspirational motivate articulating
effectively .547 .525 1.041 .328
Exciting speaker -.676 .607 -1.114 .297
Express personal concern of others .100 .524 .190 .854
Maintain status quo normal way .263 .251 1.049 .325
Recognizes ability and skills others -.293 .505 -.581 .577
Appears to be skillful presenting .117 .431 .272 .792
Vision brings ideals for future .667 .734 .909 .390
Recognizes new environment .984 .650 1.515 .168
recognizes limitations members -.145 .507 -.285 .783
Table E10
Regression Results for Research Question 2 Comparing CSQ Scale (Question 6) to C-K
Scale (Questions: 2, 3, 5, 10, 11, 13, 15, 16, 17, 19, 21-24)
Dependent Variable Independent Variable B
Std.
Error t Sig.
Information about
organizational policies
and goals recognizes barriers -.115 .450 -.257 .804
Engages in unconventional behavior -.048 .177 -.271 .794
Sensitivity to needs of others .319 .469 .680 .515
Inspiring strategic organizational goals .459 .561 .819 .437
Recognizes constraints org social
culture environ -.169 .442 -.382 .712

149
Inspirational motivate articulating
effectively .064 .491 .130 .900
Exciting speaker -.581 .567 -1.025 .335
Express personal concern of others -.499 .489 -1.021 .337
Maintain status quo normal way .151 .235 .643 .538
Recognizes ability and skills others -.386 .471 -.819 .437
Appears to be skillful presenting .361 .402 .898 .395
Vision brings ideals for future .576 .686 .840 .425
Recognizes new environment .871 .607 1.436 .189
recognizes limitations members -.048 .474 -.101 .922
Table E11
Regression Results for Research Question 2 Comparing CSQ Scale (Question 7) toC-K
Scale (Questions: 2, 3, 5, 10, 11, 13, 15, 16, 17, 19, 21-24)
Dependent Variable Independent Variable B
Std.
Error t Sig.
Information about how my job
compares with others recognizes barriers .194 .766 .253 .806
Engages in unconventional behavior .061 .302 .202 .845
Sensitivity to needs of others -.465 .799 -.581 .577
Inspiring strategic organizational goals .932 .955 .976 .358
Recognizes constraints org social
culture environ .620 .754 .823 .434

150
Inspirational motivate articulating
effectively -1.269 .836
-
1.518 .168
Exciting speaker -1.641 .966
-
1.699 .128
Express personal concern of others 1.830 .834 2.195 .059*
Maintain status quo normal way -.328 .400 -.820 .436
Recognizes ability and skills others .802 .803 .999 .347
Appears to be skillful presenting 1.047 .685 1.527 .165
Vision brings ideals for future -.988 1.169 -.845 .422
Recognizes new environment .474 1.034 .459 .659
recognizes limitations members .340 .807 .421 .685
Table E12
Regression Results for Research Question 2 Comparing CSQ Scale (Question 8) to to
what C-K Scale (Questions: 2, 3, 5, 10, 11, 13, 15, 16, 17, 19, 21-24)
Dependent Variable Independent Variable B
Std.
Error t Sig.
Information about how I am
being judged Recognizes barriers -.160 .649 -.247 .811
Engages in unconventional behavior .191 .256 .746 .477
Sensitivity to needs of others -.027 .677 -.040 .969
Inspiring strategic organizational goals 1.046 .809 1.293 .232

151
Recognizes constraints org social
culture environ .045 .639 .070 .946
Inspirational motivate articulating
effectively -.224 .709 -.316 .760
Exciting speaker -1.318 .818 -1.611 .146
Express personal concern of others 1.302 .706 1.843 .103
Maintain status quo normal way -.131 .339 -.386 .709
Recognizes ability and skills others -.193 .680 -.284 .784
Appears to be skillful presenting .436 .581 .752 .474
Vision brings ideals for future -.719 .990 -.726 .488
Recognizes new environment .841 .876 .960 .365
recognizes limitations members .582 .684 .851 .419
Table E13
Regression Results for Research Question 2 Comparing CSQ Scale (Question 9) to C-K
Scale (Questions: 2, 3, 5, 10, 11, 13, 15, 16, 17, 19, 21-24)
Dependent
Variable Independent Variable B Std. Error t Sig.
Recognition of my
efforts Recognizes barriers .256 .600 .426 .681
Engages in unconventional behavior -.271 .236 -1.146 .285
Sensitivity to needs of others -.010 .626 -.017 .987

152
Inspiring strategic organizational goals .921 .747 1.232 .253
Recognizes constraints org social culture environ .567 .590 .961 .364
Inspirational motivate articulating effectively -.799 .655 -1.221 .257
Exciting speaker -1.688 .756 -2.233 .056
Express personal concern of others 1.060 .653 1.625 .143
Maintain status quo normal way -.171 .313 -.546 .600
Recognizes ability and skills others .304 .629 .483 .642
Appears to be skillful presenting .967 .536 1.803 .109
Vision brings ideals for future -.467 .915 -.511 .623
Recognizes new environment .992 .809 1.225 .255
Recognizes limitations members .129 .632 .205 .843
Table E14
Regression Results for Research Question 2 Comparing CSQ Scale (Question 10) to C-K
Scale (Questions: 2, 3, 5, 10, 11, 13, 15, 16, 17, 19, 21-24)
Dependent Variable Independent Variable B
Std.
Error t Sig.
Information about
departmental policies
and goals Recognizes barriers -.004 .589 -.007 .995
Engages in unconventional behavior -.239 .232 -1.030 .333
Sensitivity to needs of others .665 .615 1.081 .311

153
Inspiring strategic organizational goals 1.298 .735 1.767 .115
Recognizes constraints org social culture
environ -.215 .580 -.372 .720
Inspirational motivate articulating effectively -.318 .643 -.494 .634
Exciting speaker -.950 .743 -1.279 .237
Express personal concern of others .135 .641 .211 .838
Maintain status quo normal way .038 .307 .125 .904
Recognizes ability and skills others .319 .618 .517 .619
Appears to be skillful presenting .823 .527 1.562 .157
Vision brings ideals for future -.775 .899 -.862 .414
Recognizes new environment .761 .795 .957 .367
Recognizes limitations members -.146 .621 -.235 .820
Table E15
Regression Results for Research Question 2 Comparing CSQ Scale (Question 11) to C-K
Scale (Questions: 2, 3, 5, 10, 11, 13, 15, 16, 17, 19, 21-24)
Dependent
Variable Independent Variable B Std. Error t Sig.
Information
about the
requirements
of my job
Recognizes barriers -.084 .411 -.204 .844

154
Engages in unconventional
behavior -.069 .162 -.428 .680
Sensitivity to needs of
others .257 .429 .600 .565
Inspiring strategic
organizational goals -.306 .512 -.597 .567
Recognizes constraints org
social culture environ -.293 .404 -.724 .490
Inspirational motivate
articulating effectively .139 .449 .310 .765
Exciting speaker -.180 .518 -.347 .737
Express personal concern
of others -.137 .447 -.306 .767
Maintain status quo normal
way .046 .214 .217 .834
Recognizes ability and skills
others .047 .431 .109 .916
Appears to be skillful
presenting .112 .368 .304 .769
Vision brings ideals for
future .376 .627 .599 .565
Recognizes new
environment .853 .555 1.537 .163
Recognizes limitations
members -.051 .433 -.119 .908

155
Table E16
Regression Results for Research Question 2 Comparing CSQ Scale (Question 12) to C-K
Scale (Questions: 2, 3, 5, 10, 11, 13, 15, 16, 17, 19, 21-24)
Dependent Variable Independent Variable B
Std.
Error t Sig.
Information about government
action affecting my organization Recognizes barriers -.871 .509 -1.710 .126
Engages in unconventional behavior .165 .200 .824 .434
Sensitivity to needs of others .731 .531 1.376 .206
Inspiring strategic organizational goals .819 .635 1.291 .233
Recognizes constraints org social
culture environ .358 .501 .715 .495
Inspirational motivate articulating
effectively .304 .556 .548 .599
Exciting speaker -.265 .642 -.414 .690
Express personal concern of others -.014 .554 -.025 .981
Maintain status quo normal way -.308 .265 -1.161 .279
Recognizes ability and skills others .427 .534 .800 .447
Appears to be skillful presenting .020 .455 .043 .967
Vision brings ideals for future -1.204 .777 -1.551 .160
Recognizes new environment .277 .687 .404 .697
Recognizes limitations members .060 .536 .112 .913

156
Table E17
Regression Results for Research Question 2 Comparing CSQ Scale (Question 13) to C-K
Scale (Questions: 2, 3, 5, 10, 11, 13, 15, 16, 17, 19, 21-24)
Dependent Variable Independent Variable B
Std.
Error t Sig.
Information about
changes in our
organization Recognizes barriers .302 .471 .641 .539
Engages in unconventional behavior -.317 .185 -1.712 .125
Sensitivity to needs of others -.668 .491 -1.359 .211
Inspiring strategic organizational goals .006 .587 .010 .992
Recognizes constraints org social culture
environ .639 .463 1.379 .205
Inspirational motivate articulating
effectively -.883 .514 -1.717 .124
Exciting speaker -.951 .593 -1.603 .148
Express personal concern of others .144 .512 .281 .786
Maintain status quo normal way .259 .246 1.056 .322
Recognizes ability and skills others .254 .494 .516 .620
Appears to be skillful presenting .735 .421 1.746 .119
Vision brings ideals for future 1.274 .718 1.773 .114
Recognizes new environment .999 .635 1.571 .155
Recognizes limitations members -.437 .496 -.880 .404

157
Table E18
Regression Results for Research Question 2 Comparing CSQ Scale (Question 14) to C-K
Scale (Questions: 2, 3, 5, 10, 11, 13, 15, 16, 17, 19, 21-24)
Dependent Variable Independent Variable B
Std.
Erro
r t Sig.
Reports on how problems in
my job are being handled Recognizes barriers -.010 .604 -.017 .987
Engages in unconventional behavior -.041 .238 -.173 .867
Sensitivity to needs of others -.263 .630 -.417 .688
Inspiring strategic organizational goals .694 .753 .923 .383
Recognizes constraints org social
culture environ .427 .594 .719 .493
Inspirational motivate articulating
effectively -.235 .659 -.357 .730
Exciting speaker -.734 .761 -.964 .363
Express personal concern of others .137 .657 .208 .840
Maintain status quo normal way -.107 .315 -.340 .742
Recognizes ability and skills others .414 .633 .654 .531
Appears to be skillful presenting .549 .540 1.017 .339
Vision brings ideals for future .170 .921 .184 .859
Recognizes new environment .278 .815 .342 .741
Recognizes limitations members -.185 .636 -.290 .779
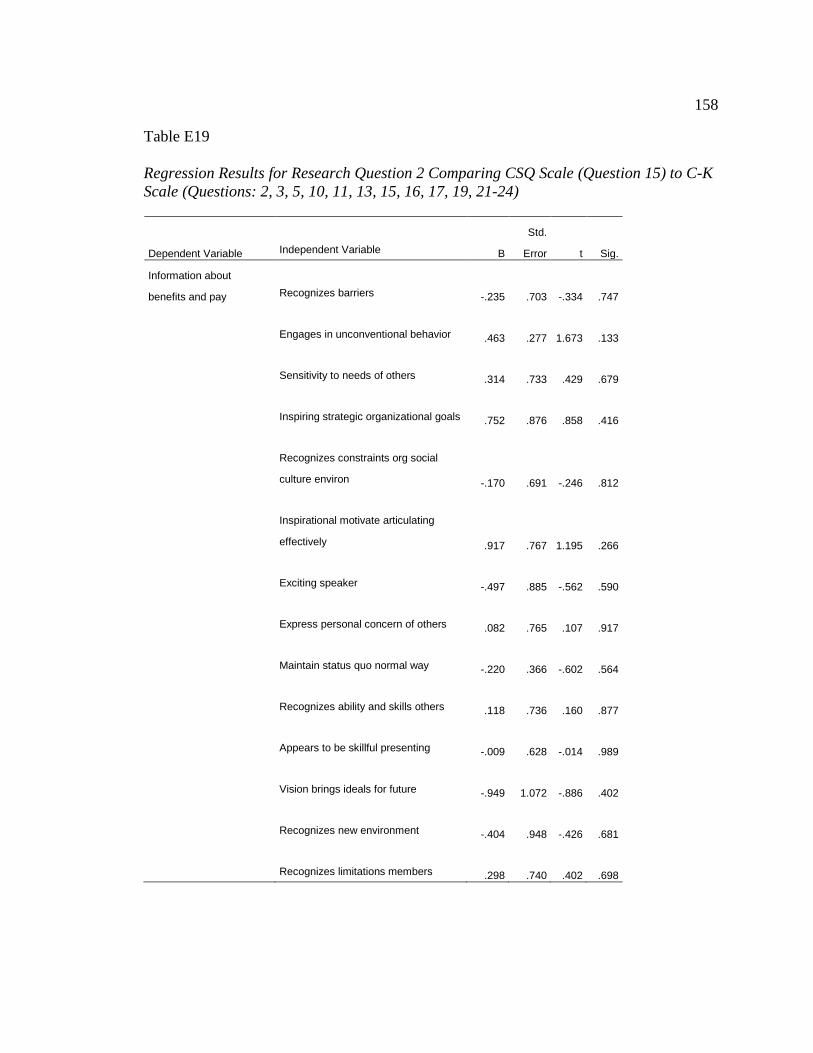
158
Table E19
Regression Results for Research Question 2 Comparing CSQ Scale (Question 15) to C-K
Scale (Questions: 2, 3, 5, 10, 11, 13, 15, 16, 17, 19, 21-24)
Dependent Variable Independent Variable B
Std.
Error t Sig.
Information about
benefits and pay Recognizes barriers -.235 .703 -.334 .747
Engages in unconventional behavior .463 .277 1.673 .133
Sensitivity to needs of others .314 .733 .429 .679
Inspiring strategic organizational goals .752 .876 .858 .416
Recognizes constraints org social
culture environ -.170 .691 -.246 .812
Inspirational motivate articulating
effectively .917 .767 1.195 .266
Exciting speaker -.497 .885 -.562 .590
Express personal concern of others .082 .765 .107 .917
Maintain status quo normal way -.220 .366 -.602 .564
Recognizes ability and skills others .118 .736 .160 .877
Appears to be skillful presenting -.009 .628 -.014 .989
Vision brings ideals for future -.949 1.072 -.886 .402
Recognizes new environment -.404 .948 -.426 .681
Recognizes limitations members .298 .740 .402 .698

159
Table E20
Regression Results for Research Question 2 Comparing CSQ Scale (Question 17) to C-K
Scale (Questions: 2, 3, 5, 10, 11, 13, 15, 16, 17, 19, 21-24)
Dependent Variable Independent Variable B Std. Error t Sig.
Information about
accomplishments and/or
failures of the organization Recognizes barriers -.881 .400 -2.204 .059*
Engages in unconventional behavior .003 .157 .020 .985
Sensitivity to needs of others .081 .417 .196 .850
Inspiring strategic organizational goals -.198 .498 -.397 .701
Recognizes constraints org social
culture environ .094 .393 .240 .816
Inspirational motivate articulating
effectively .546 .436 1.253 .246
Exciting speaker -.223 .503 -.442 .670
Express personal concern of others .024 .435 .056 .957
Maintain status quo normal way .154 .208 .740 .480
Recognizes ability and skills others -.518 .419 -1.236 .251
Appears to be skillful presenting -.057 .357 -.160 .877
Vision brings ideals for future .288 .609 .473 .649
Recognizes new environment 1.067 .539 1.979 .083
Recognizes limitations members -.272 .421 -.647 .535

160
Table E21
Regression Results for Research Question 2 Comparing CSQ Scale (Question 18) to C-K
Scale (Questions: 2, 3, 5, 10, 11, 13, 15, 16, 17, 19, 21-24)
Dependent
Variable Independent Variable B Std. Error t Sig.
Extent to
which my
superiors
know and
understand
the problems
faced by
subordinates
Recognizes barriers .128 .736 .174 .866
Engages in unconventional behavior -.458 .290 -1.582 .152
Sensitivity to needs of others .261 .768 .340 .742
Inspiring strategic organizational goals .358 .917 .390 .706
Recognizes constraints org social culture
environ -.243 .724 -.335 .746
Inspirational motivate articulating
effectively -.355 .803 -.442 .670
Exciting speaker -.281 .927 -.304 .769
Express personal concern of others -.202 .801 -.252 .807
Maintain status quo normal way -.166 .384 -.434 .676
Recognizes ability and skills others .678 .771 .878 .405
Appears to be skillful presenting .540 .658 .820 .436
Vision brings ideals for future .351 1.122 .313 .763
Recognizes new environment .708 .993 .713 .496
Recognizes limitations members -.273 .775 -.352 .734

161
Table E22:
Regression Results for Research Question 2 Comparing CSQ Scale (Question 19) to C-K
Scale (Questions: 2, 3, 5, 10, 11, 13, 15, 16, 17, 19, 21-24)
Dependent Variable Independent Variable B
Std.
Error t Sig.
Extent to which the
organization’s communication
motivates and stimulates an
enthusiasm for meeting its goals Recognizes barriers .125 .498 .250 .809
Engages in unconventional behavior -.347 .196 -1.768 .115
Sensitivity to needs of others -.346 .520 -.665 .525
Inspiring strategic organizational goals -.529 .621 -.852 .419
Recognizes constraints org social culture
environ .147 .490 .300 .772
Inspirational motivate articulating effectively -.687 .544 -1.264 .242
Exciting speaker -.399 .628 -.635 .543
Express personal concern of others -.316 .542 -.582 .576
Maintain status quo normal way .119 .260 .456 .660
Recognizes ability and skills others .538 .522 1.030 .333
Appears to be skillful presenting .368 .446 .826 .433
Vision brings ideals for future 1.303 .760 1.714 .125
Recognizes new environment .827 .672 1.230 .254
Recognizes limitations members .193 .525 .367 .723

162
Table E23
Regression Results for Research Question 2 Comparing CSQ Scale (Question 20) to C-K
Scale (Questions: 2, 3, 5, 10, 11, 13, 15, 16, 17, 19, 21-24)
Dependent Variable Independent Variable B Std. Error t Sig.
Extent to which my
supervisor listens and
pays attention to me Recognizes barriers .741 .399 1.855 .101
Engages in unconventional behavior -.059 .157 -.375 .717
Sensitivity to needs of others -.366 .417 -.879 .405
Inspiring strategic organizational goals .790 .498 1.587 .151
Recognizes constraints org social culture
environ .282 .393 .717 .494
Inspirational motivate articulating effectively -.227 .436 -.520 .617
Exciting speaker -1.171 .503
-
2.326 .049*
Express personal concern of others .798 .435 1.836 .104
Maintain status quo normal way -.036 .208 -.173 .867
Recognizes ability and skills others .190 .419 .453 .663
Appears to be skillful presenting .643 .357 1.799 .110
Vision brings ideals for future -.376 .609 -.617 .554
Recognizes new environment .392 .539 .726 .488
Recognizes limitations members .062 .421 .146 .887

163
Table E24
Regression Results for Research Question 2 Comparing CSQ Scale (Question 26) toC-K
Scale (Questions: 2, 3, 5, 10, 11, 13, 15, 16, 17, 19, 21-24)
Dependent Variable Independent Variable B Std. Error t Sig.
Extent to which I
receive in time the
information needed to
do my job Recognizes barriers .233 .512 .456 .660
Engages in unconventional behavior -.023 .201 -.116 .910
Sensitivity to needs of others -.712 .534 -1.335 .219
Inspiring strategic organizational goals .696 .638 1.092 .307
Recognizes constraints org social culture environ .570 .503 1.133 .290
Inspirational motivate articulating effectively -1.230 .558 -2.203 .059*
Exciting speaker -1.390 .645 -2.157 .063
Express personal concern of others 1.315 .557 2.362 .046*
Maintain status quo normal way -.048 .267 -.181 .861
Recognizes ability and skills others -.008 .536 -.015 .989
Appears to be skillful presenting .858 .458 1.874 .098
Vision brings ideals for future .022 .780 .029 .978
Recognizes new environment .776 .690 1.124 .294
Recognizes limitations members .328 .539 .608 .560

164
Table E25
Regression Results for Research Question 2 Comparing CSQ Scale (Question 27) to C-K
Scale (Questions: 2, 3, 5, 10, 11, 13, 15, 16, 17, 19, 21-24)
Dependent Variable Independent Variable B Std. Error t Sig.
Extent to which conflicts
are handled appropriately
through proper
communication channels Recognizes barriers .322 .225 1.428 .191
Engages in unconventional behavior -.073 .089 -.820 .436
Sensitivity to needs of others -.033 .235 -.141 .891
Inspiring strategic organizational goals .574 .281 2.046 .075
Recognizes constraints org social culture
environ .053 .222 .239 .817
Inspirational motivate articulating effectively -.383 .246
-
1.557 .158
Exciting speaker -.373 .284
-
1.316 .225
Express personal concern of others .372 .245 1.518 .167
Maintain status quo normal way -.004 .117 -.034 .974
Recognizes ability and skills others -.153 .236 -.647 .536
Appears to be skillful presenting .288 .201 1.432 .190
Vision brings ideals for future -.173 .344 -.503 .629
Recognizes new environment .419 .304 1.378 .206
Recognizes limitations members .221 .237 .934 .378

165
Table E26
Regression Results for Research Question 2 Comparing CSQ Scale (Question 28) to C-K
Scale (Questions: 2, 3, 5, 10, 11, 13, 15, 16, 17, 19, 21-24)
Dependent Variable Independent Variable B
Std.
Error t Sig.
Extent to which the
grapevine is active in
our organization Recognizes barriers .622 .651 .956 .367
Engages in unconventional behavior -.407 .256 -1.586 .151
Sensitivity to needs of others -1.580 .679 -2.327 .048*
Inspiring strategic organizational goals -.169 .811 -.208 .840
Recognizes constraints org social culture
environ .776 .640 1.212 .260
Inspirational motivate articulating effectively -.443 .711 -.623 .551
Exciting speaker -.166 .820 -.202 .845
Express personal concern of others 1.289 .708 1.819 .106
Maintain status quo normal way .634 .339 1.868 .099
Recognizes ability and skills others -.092 .682 -.134 .896
Appears to be skillful presenting 1.030 .582 1.770 .115
Vision brings ideals for future -.717 .993 -.722 .491
Recognizes new environment .244 .879 .278 .788
Recognizes limitations members -.654 .686 -.953 .368

166
Table E27
Regression Results for Research Question 3 Comparing CSQ Scale (Question 1) to C-K
Scale (Questions 5, 10, 19)
Dependent
Variable
Independent
Variable B Std. Error T Sig.
How satisfied
are you with
your job?
Sensitivity to
needs of
others
-.024 .195 -.123 .903
Inspiring
strategic
organizationa
l goals
.177 .248 .714 .483
Recognizes
ability and
skills others
.289 .317 .912 .372
Table E28
Regression Results for Research Question 3 Comparing CSQ Scale (Question 8) to C-K
Scale (Questions 5, 10, 19)
Dependent
Variable Independent Variable B Std. Error t Sig
Information
about how I
am being
judged
Sensitivity to needs of others .305 .232 1.314 .203
Inspiring strategic organizational
goals .721 .295 2.441 .024*
Recognizes ability and skills others .245 .378 .648 .524

167
Table E29:
Regression Results for Research Question 3 Comparing CSQ Scale (Question )9 to C-K
Scale (Questions 5, 10, 19)
Dependent
Variable Independent Variable B
Std.
Error t Sig
Recognition
of my efforts
Sensitivity to needs of others .238 .271 .878 .390
Inspiring strategic organizational goals .548 .345 1.587 .128
Recognizes ability and skills others .146 .442 .331 .744
Table E30:
Regression Results for Research Question 3 Comparing CSQ Scale (Question 11) to C-K
Scale (Questions 5, 10, 19)
Dependent
Variable Independent Variable B
Std.
Error t Sig
Information
about the
requirements
of my job
Sensitivity to needs of others -.135 .149 -.907 .375
Inspiring strategic organizational goals .039 .190 .207 .838
Recognizes ability and skills others .383 .243 1.578 .130
Table E31
Regression Results for Research Question 3 Comparing CSQ Scale (Question 13) to C-K
Scale (Questions 5, 10, 19)
Dependent
Variable Independent Variable B
Std.
Error t Sig
Information
about changes in
our organization
Sensitivity to needs of others -.056 .226 1.417 .808
Inspiring strategic organizational goals .407 .287 .094 .171
Recognizes ability and skills others .034 .367 .926

168
Table E32
Regression Results for Research Question 3 Comparing CSQ Scale (Question 14) to C-K
Scale (Questions 5, 10, 19)
Dependent
Variable Independent Variable B
Std.
Error t Sig
Reports on how
problems in my
job are being
handled
Sensitivity to needs of others -.087 .192 -.450 .657
Inspiring strategic organizational goals .605 .245 2.469 .022*
Recognizes ability and skills others .308 .313 .983 .337
Table E33
Regression Results for Research Question 3 Comparing CSQ Scale (Question 15) to C-K
Scale (Questions 5, 10, 19)
Dependent
Variable Independent Variable B
Std.
Error t Sig
Information about
benefits and pay
Sensitivity to needs of others -.217 .255 -.853 .403
Inspiring strategic organizational goals -.050 .324 -.154 .879
Recognizes ability and skills others .677 .414 1.632 .118
Table E34
Regression Results for Research Question 3 Comparing CSQ Scale (Question 16) to C-K
Scale (Questions 5, 10, 19)
Dependent
Variable Independent Variable B
Std.
Error t Sig
Information about
our organization’s
financial standing
Sensitivity to needs of others .061 .133 .463 .648
Inspiring strategic organizational goals -.071 .169 -.422 .677
Recognizes ability and skills others .073 .216 .339 .738

169
Table E35
Regression Results for Research Question 3 Comparing CSQ Scale (Question 18) to C-K
Scale (Questions 5, 10, 19)
Dependent
Variable Independent Variable B
Std.
Error t Sig
Extent to which
my superiors
know and
understand the
problems faced by
subordinates
Sensitivity to needs of others .040 .238 .168 .868
Inspiring strategic organizational goals .535 .303 1.766 .092
Recognizes ability and skills others .268 .387 .691 .497
Table E36
Regression Results for Research Question 3 Comparing CSQ Scale (Question 19) to C-K
Scale (Questions 5, 10, 19)
Dependent
Variable Independent Variable B
Std.
Error t Sig
Extent to which
my supervisor
listens and pays
attention to me
Sensitivity to needs of others -.035 .174 -.198 .845
Inspiring strategic organizational goals .782 .222 3.523 .002*
Recognizes ability and skills others .303 .284 1.069 .297
Table E37
Regression Results for Research Question 3 Comparing CSQ Scale (Question 20) to C-K
Scale (Questions 5, 10, 19)
Dependent Variable Independent Variable B Std. Error t Sig
Extent to which my
supervisor offers
guidance for solving
job related problems
Sensitivity to needs of others -.119 .215 -.553 .586
Inspiring strategic organizational goals 1.043 .274 3.805 .001*
Recognizes ability and skills others .088 .350 .251 .804

170
Table E38
Regression Results for Research Question 3 Comparing CSQ Scale (Question 22) to C-K
Scale (Questions 5, 10, 19)
Dependent Variable Independent Variable B Std. Error t Sig
Extent to which conflicts are
handled appropriately through
proper communication
channels
Sensitivity to needs of others .021 .125 .171 .866
Inspiring strategic
organizational goals .641 .158 4.045 .001*
Recognizes ability and skills
others -.087 .203 -.428 .673