Communicating Relative Risk Changes with Baseline Risk...
13
Communicating Relative Risk Changes with Baseline Risk: Presentation Format and Numeracy Matter Nicolai Bodemer, PhD, Bjo ¨rn Meder, PhD, and Gerd Gigerenzer, PhD Background. Treatment benefits and harms are often communicated as relative risk reductions and increases, which are frequently misunderstood by doctors and patients. One suggestion for improving understanding of such risk information is to also communicate the baseline risk. We investigated 1) whether the presentation format of the base- line risk influences understanding of relative risk changes and 2) the mediating role of people’s numeracy skills. Method. We presented laypeople (N = 1234) with a hypothet- ical scenario about a treatment that decreased (Experiments 1a, 2a) or increased (Experiments 1b, 2b) the risk of heart disease. Baseline risk was provided as a percentage or a fre- quency. In a forced-choice paradigm, the participants’ task was to judge the risk in the treatment group given the rela- tive risk reduction (or increase) and the baseline risk. Numeracy was assessed using the Lipkus 11-item scale. Re- sults. Communicating baseline risk in a frequency format facilitated correct understanding of a treatment’s benefits and harms, whereas a percentage format often impeded understanding. For example, many participants misinter- preted a relative risk reduction as referring to an absolute risk reduction. Participants with higher numeracy generally performed better than those with lower numeracy, but all participants benefitted from a frequency format. Limitations are that we used a hypothetical medical scenario and a non- representative sample. Conclusions. Presenting baseline risk in a frequency format improves understanding of relative risk information, whereas a percentage format is likely to lead to misunderstandings. People’s numeracy skills play an important role in correctly understanding medical infor- mation. Overall, communicating treatment benefits and harms in the form of relative risk changes remains problem- atic, even when the baseline risk is explicitly provided. Key words: relative risk; absolute risk; risk communication; numeracy; presentation format; baseline risk. (Med Decis Making 2014;34:615–626) T ransparent and intuitive communication of health information is a major challenge in ensuring informed consent and shared decision making. For instance, the benefit of mammography screening for women aged 50 and older can be communicated as a risk reduction of 20% in mortal- ity due to breast cancer. 1 But what does that num- ber actually mean? The epidemiological data on which this benefit is based show that about 5 in every 1000 women without screening die from breast cancer within 10 years, as opposed to 4 in 1000 with screening—a relative risk reduction of 20%. Another way of conveying the same informa- tion is to say that participating in screening reduces breast cancer mortality by 0.1% (1 in 1000), namely, from 0.5% (5 in 1000) to 0.4% (4 in 1000). As this example illustrates, different formats exist for expressing treatment benefits. A relative Received 25 December 2012 from Max Planck Institute for Human Development, Harding Center for Risk Literacy, Berlin, Germany (NB, GG); and Max Planck Institute for Human Development, Center for Adaptive Behavior and Cognition (ABC), Berlin, Germany (NB, BM, GG). This research was supported by the joint program ‘‘Acciones Inte- gradas Hispano-Alemanas’’ from the Deutscher Akademischer Aus- tauschdienst (DAAD) and the Ministerio de Ciencia y Tecnologı ´a. BM was supported by Grant ME 3717/2 from the Deutsche Forschungsge- meinschaft (DFG) as part of the priority program ‘‘New Frameworks of Rationality’’ (SPP 1516). Revision accepted for publication 8 February 2014. Ó The Author(s) 2014 Reprints and permission: http://www.sagepub.com/journalsPermissions.nav DOI: 10.1177/0272989X14526305 Supplementary material for this article is available on the Medical Decision Making Web site at http://mdm.sagepub.com/supplemental. Address correspondence to Nicolai Bodemer, Harding Center for Risk Literacy, Max Planck Institute for Human Development, Lentzeallee 94, 14195 Berlin, Germany; e-mail: [email protected]. MEDICAL DECISION MAKING/JULY 2014 615 ORIGINAL ARTICLE at Max Planck Institut on June 13, 2014 mdm.sagepub.com Downloaded from
Transcript of Communicating Relative Risk Changes with Baseline Risk...

Communicating Relative Risk Changes withBaseline Risk: Presentation Format and
Numeracy Matter
Nicolai Bodemer, PhD, Bjorn Meder, PhD, and Gerd Gigerenzer, PhD
Background. Treatment benefits and harms are oftencommunicated as relative risk reductions and increases,which are frequently misunderstood by doctors and patients.One suggestion for improving understanding of such riskinformation is to also communicate the baseline risk. Weinvestigated 1) whether the presentation format of the base-line risk influences understanding of relative risk changesand 2) the mediating role of people’s numeracy skills.Method. We presented laypeople (N = 1234) with a hypothet-ical scenario about a treatment that decreased (Experiments1a, 2a) or increased (Experiments 1b, 2b) the risk of heartdisease. Baseline risk was provided as a percentage or a fre-quency. In a forced-choice paradigm, the participants’ taskwas to judge the risk in the treatment group given the rela-tive risk reduction (or increase) and the baseline risk.Numeracy was assessed using the Lipkus 11-item scale. Re-sults. Communicating baseline risk in a frequency formatfacilitated correct understanding of a treatment’s benefits
and harms, whereas a percentage format often impededunderstanding. For example, many participants misinter-preted a relative risk reduction as referring to an absoluterisk reduction. Participants with higher numeracy generallyperformed better than those with lower numeracy, but allparticipants benefitted from a frequency format. Limitationsare that we used a hypothetical medical scenario and a non-representative sample. Conclusions. Presenting baseline riskin a frequency format improves understanding of relativerisk information, whereas a percentage format is likely tolead to misunderstandings. People’s numeracy skills playan important role in correctly understanding medical infor-mation. Overall, communicating treatment benefits andharms in the form of relative risk changes remains problem-atic, even when the baseline risk is explicitly provided. Keywords: relative risk; absolute risk; risk communication;numeracy; presentation format; baseline risk. (Med DecisMaking 2014;34:615–626)
Transparent and intuitive communication ofhealth information is a major challenge in
ensuring informed consent and shared decisionmaking. For instance, the benefit of mammographyscreening for women aged 50 and older can be
communicated as a risk reduction of 20% in mortal-ity due to breast cancer.1 But what does that num-ber actually mean? The epidemiological data onwhich this benefit is based show that about 5 inevery 1000 women without screening die frombreast cancer within 10 years, as opposed to 4 in1000 with screening—a relative risk reduction of20%. Another way of conveying the same informa-tion is to say that participating in screening reducesbreast cancer mortality by 0.1% (1 in 1000),namely, from 0.5% (5 in 1000) to 0.4% (4 in1000). As this example illustrates, different formatsexist for expressing treatment benefits. A relative
Received 25 December 2012 from Max Planck Institute for HumanDevelopment, Harding Center for Risk Literacy, Berlin, Germany (NB,GG); and Max Planck Institute for Human Development, Center forAdaptive Behavior and Cognition (ABC), Berlin, Germany (NB, BM,GG). This research was supported by the joint program ‘‘Acciones Inte-gradas Hispano-Alemanas’’ from the Deutscher Akademischer Aus-tauschdienst (DAAD) and the Ministerio de Ciencia y Tecnologıa. BMwas supported by Grant ME 3717/2 from the Deutsche Forschungsge-meinschaft (DFG) as part of the priority program ‘‘New Frameworks ofRationality’’ (SPP 1516). Revision accepted for publication 8 February2014.
! The Author(s) 2014Reprints and permission:http://www.sagepub.com/journalsPermissions.navDOI: 10.1177/0272989X14526305
Supplementary material for this article is available on the MedicalDecision Making Web site at http://mdm.sagepub.com/supplemental.
Address correspondence to Nicolai Bodemer, Harding Center for RiskLiteracy, Max Planck Institute for Human Development, Lentzeallee94, 14195 Berlin, Germany; e-mail: [email protected].
MEDICAL DECISION MAKING/JULY 2014 615
ORIGINAL ARTICLE
at Max Planck Institut on June 13, 2014mdm.sagepub.comDownloaded from

risk reduction (RRR) is defined as the differencebetween event rates (risk) in the control and treat-ment groups, normalized by the event rate in thecontrol group (the baseline risk). An absolute riskreduction (ARR), by contrast, is defined as the dif-ference between the risk in the control group andthe risk in the treatment group (Table 1).
The same holds true for communicating potentialharms of treatments. The relative risk increase (RRI)and the absolute risk increase (ARI) are defined anal-ogously to risk reductions (Table 1). For instance, in1995 the UK Committee on Safety for Medicineused the RRI format in its statement that the third gen-eration of the contraceptive pill increased the risk oflife-threatening blood clots twofold, that is, by100%, compared with the second-generation pill.2,3
This RRI corresponded to an ARI of 0.014% (increasefrom 1 in 7000 to 2 in 7000).
Whereas relative and absolute risk formats arederived from the very same data (event rates in thecontrol and treatment groups), they are often notpsychologically equivalent. For instance, laypeopleas well as health professionals evaluate treatment ben-efits more favorably when they are presented as an RRRrather than an ARR.4–8 Nonetheless, RRR remains thedominant format for communicating treatment benefitsin direct-to-consumer advertisements, in patient deci-sion aids, and within the medical community.9–14
One suggestion for improving understanding of rela-tive reductions (or increases) is to also communicatethe baseline risk.15
However, several important questions remain,given that neither the role of the presentationformat of the baseline risk nor the influence ofpeople’s numeracy in interpreting relative riskchanges with baseline risk have been systematicallyinvestigated.
Relative Risk Reduction and Baseline Risk
Schwartz and others16 found that providing thebaseline risk improved accuracy in estimating breastcancer mortality when presenting women with a treat-ment’s benefit as an RRR or an ARR. Even when pro-vided with the baseline risk, however, about two-thirds of the participants still gave incorrect mortalityrate estimates. Similarly, most participants in Sheri-dan and colleagues’17 study were unable to calculatethe effect on a given baseline risk when presentedwith an RRR or an ARR; only about one-fifth of partic-ipants correctly estimated the effect in the treatmentgroup based on the given information. Natter andBerry15 showed that omitting the baseline risk led toan overestimation of both the baseline risk and therisk for the treatment group, whereas providing thebaseline risk led to more accurate estimates overall.
The Role of Numeracy in Understanding RelativeRisk Reduction With Baseline Risk
Both Schwartz and Sheridan and their col-leagues16,17 also investigated numeracy—the ability tocomprehend and use numerical information18—asa moderating variable in people’s understanding ofRRR with baseline risk. They found that participantswith lower numeracy particularly had difficulties solv-ing the tasks. For instance, in one study, the proportionof correct answers ranged from 5.8% for those with thelowest numeracy score to 40% for those with the high-est score.16 Similarly, in another study, only 5% of par-ticipants with lower numeracy calculated the event ratein the treatment group correctly, whereas up to 50% ofthose with higher numeracy did.17 These findings areconsistent with related research showing that people’s
Table 1 Relative and Absolute Risk Changes
Type of Change Risk Reduction (RR) Risk Increase (RI)
Relative (R) RRR 5 ERControl!ERTreatmentERControl
Example:
RRR 5 0:5%!0:4%0:5% 5 20%
RRI 5 ERTreatment!ERControlERControl
Example:
RRI 5 0:028%!0:014%0:014% 5 100%
Absolute (A) ARR 5 ERControl ! ERTreatment
Example:
ARR 5 0:5%!0:4% 5 0:1%
ARI 5 ERTreatment ! ERControl
Example:
ARI 5 0:028%!0:014% 5 0:014%
Note: The risk reductions are based on the mammography example (breast cancer mortality reduction from 5 in 1000 to 4 in 1000 when participating inscreening). The example for the risk increase measures is based on the ‘‘pill scare’’ (increase of thrombosis from 1 in 7000 to 2 in 7000 when taking thethird-generation contraceptive pill). ERControl = event rate in the control group (baseline risk); ERTreatment = event rate in the treatment group.
BODEMER AND OTHERS
616 " MEDICAL DECISION MAKING/JULY 2014
at Max Planck Institut on June 13, 2014mdm.sagepub.comDownloaded from

numeracy mediates their understanding of statisticalinformation, risk perception, and decision making.18–25
The Role of Presentation Format in CommunicatingBaseline Risk
What format should be used to communicate base-line risk? Whereas previous studies often used fre-quency formats, percentages are also frequentlyused. This holds both for scientific articles andwhen reporting results to the public. Examplesinclude statements like ‘‘In the United Kingdom,35% of deaths are due to cardiovascular causes, com-pared with about 60% in those with type 2 diabetesand 67% of type 1 diabetic patients over 40 yearsold.’’26(p874) or ‘‘In 2004, heart disease was noted on68% of diabetes-related death certificates among peo-ple aged 65 years and older.’’27(p8) Here, the baselinerisk is expressed as a percentage.
But what happens when information on the base-line risk is combined with RRR statements, such as‘‘Heart failure was reduced by 56%, strokes by 44%,and combined myocardial infarction, sudden death,stroke, and peripheral vascular disease by34%.’’26(p874) or ‘‘Reducing diastolic blood pressurefrom 90 mmHg to 80 mmHg in people with diabetesreduces the risk of major cardiovascular events by50%’’?27(p10)
One important question is whether the 2 pieces ofinformation refer to the same reference class (e.g., agegroup, gender, type of diabetes, etc.). But even whenthey do, another difficulty lies in the potential ambi-guity of the words ‘‘reduced by.’’ Assume a random-ized control study shows that 68% of people withdiabetes have heart disease, and that a new drugreduces the risk of heart disease by 50%. The 50%risk decrease refers to an RRR, suggesting that theevent rate is reduced from 68% to 34%. A conceptualmisunderstanding would be to interpret the decreaseas referring to an ARR. The risk reduction would thenbe misunderstood as referring to a decrease in per-centage points, meaning in this case that the risk ofcardiovascular events decreases by 50 percentagepoints from 68% to 18% when blood pressure isreduced.
Misinterpreting a relative difference as an absolutedifference (i.e., difference in percentage points)might be especially likely when the baseline risk isexpressed as a percentage. When the baseline risk isinstead presented as a frequency (e.g., 680 of 1000instead of 68%) in order to estimate how many peopleare at risk in the treatment group, it is necessary toconvert the RRR into the same ‘‘currency’’ (number
of people at risk), thus helping to clarify the meaningof an RRR.
Berry and others28 provided participants with riskincrease information, either in a relative or an abso-lute format or as number needed to treat. When nobaseline risk was provided, participants stronglyoverestimated the side effect, particularly in the RRIcondition. Provision of baseline risk improved esti-mates, and no differences between the 3 formatswere found. Yet even with baseline risk information,the risk increase was overestimated. Because, how-ever, participants received the baseline risk in botha percentage and a frequency format, the study doesnot allow for assessing potential differences betweendifferent baseline risk formats. The influence of pre-sentation format was demonstrated in a study byCovey,29 who examined the effects of baseline riskpresentation (frequency v. percentage) on partici-pants’ understanding of RRR and ARR. Participantshad to choose between 2 treatments where eitherboth treatments were equally effective or 1 treatmentwas more effective than the other. When treatmentsdiffered in effectiveness, participants identified thebetter treatment only when the baseline risk was pro-vided in a frequency format, regardless of whether anRRR or an ARR was used. However, the study did notinvestigate how participants interpret RRR whengiven baseline risk, under what conditions misinter-pretations are more likely, or what possible misinter-pretations occurred.
RESEARCH QUESTIONS
We report the findings of 2 experiments that exam-ined laypeople’s understanding of relative riskchanges when the baseline risk is provided. Partici-pants chose between different estimates for the eventrate in the treatment group after being given informa-tion on the baseline risk (event rate in the controlgroup) and the RRR (Experiments 1a and 2a) or theRRI (Experiments 1b and 2b). To pinpoint partici-pants’ understanding of relative risk changes, theavailable estimates corresponded to alternative inter-pretations of the relative risk change, such as a rela-tive or absolute reduction (or increase) of the eventrate in the treatment group.
Three questions were the focus: Does the presenta-tion format of the baseline risk matter for correctlyunderstanding treatment benefits and harms? To whatextent is the correct understanding of relative risksmediated by people’s numeracy skills? If relative risksare misunderstood, how are they actually interpreted?
BASELINE RISK AND RELATIVE RISK INFORMATION
ORIGINAL ARTICLE 617
at Max Planck Institut on June 13, 2014mdm.sagepub.comDownloaded from

EXPERIMENT 1
We investigated whether and under what condi-tions a relative risk change is erroneously inter-preted as an absolute risk change. In Experiment1a, participants had to evaluate an RRR; in Experi-ment 1b, participants were provided with an RRI.We hypothesized that misunderstandings are morelikely when the baseline risk is presented as a per-centage and for people with lower numeracy. Bycontrast, presenting the baseline risk in a frequencyformat should help people (with lower and highernumeracy) correctly understand a relative riskchange.
Participants
For all experiments reported in this paper, partici-pants were recruited through the online platformAmazon MTurk (AMT). AMT enables access to a largeand diverse subject pool, often more representative ofthe US population than are in-person conveniencesamples.30 Research suggests that findings withAMT are similar in quality and reliability to thosefrom laboratory samples.31–33 Participants had to beUS residents and at least 18 years old.
Experiment 1a had 203 participants (55% male; !xage = 33 years, SD = 20); Experiment 1b had 182 par-ticipants (52% male; !x age = 33 years, SD = 12).
Figure 1 Hypothetical medical scenario and answers used in Experiments 1 and 2. Participants were randomly assigned to either the base-line percentage or baseline frequency condition and provided with a relative risk reduction (RRR) or relative risk increase (RRI). Words andnumbers in square brackets refer to risk increase scenarios (Experiments 1b and 2b). The 5 choices correspond to the following answers (indescending order): relative reduction [increase] correctly understood, relative reduction [increase] mistaken as absolute reduction[increase]; relative reduction [increase] mistaken as event rate; Calculation Error I; Calculation Error II. See text for details.
BODEMER AND OTHERS
618 " MEDICAL DECISION MAKING/JULY 2014
at Max Planck Institut on June 13, 2014mdm.sagepub.comDownloaded from

Participants had various occupations and educationalbackgrounds. Remuneration was $0.75. In each exper-iment participants were randomly assigned to 1 of 2baseline risk formats (percentage v. frequency).
Materials and Procedure
In Experiment 1a, participants received a hypothet-ical scenario about a drug that reduces the risk of heartdisease for patients with diabetes by 20% (Figure 1).Their task was to judge the event rate in the treatmentgroup, given the baseline risk and the RRR.
All participants received the same RRR information:‘‘The study showed that the new drug reduced the riskof heart disease by 20%.’’ Baseline risk was providedas either a percentage or a frequency. In the percentagecondition, baseline risk was presented as 30%. Theanswer options were 24% of 1000 (RRR interpretation)and 10% of 1000 (ARR interpretation). In the frequencycondition, baseline risk was presented as 300 of 1000.Possible answers were 240 of 1000 (RRR interpretation)and 100 of 1000 (ARR interpretation). Participants inExperiment 1b received the same scenario, exceptthat the drug increased the risk by 20%. Here, possi-ble answers were 36% (RRI interpretation) and 50%(ARI interpretation) in the percentage condition and360 of 1000 (RRI interpretation) and 500 of 1000 (ARIinterpretation) in the frequency condition. In allstudies, the order of the answers was randomized.
We assessed participants’ numeracy using Lipkusand others’23 11-item numeracy scale, with the itemspresented in random order. Numeracy is defined as‘‘the degree to which individuals have the capacityto access, process, interpret, communicate, and acton numerical, quantitative, graphical, biostatistical,and probabilistic health information needed to makeeffective health decisions.’’34(p375) Items of the scalerequire participants, for instance, to transform per-centages into frequencies or vice versa, or to identifythe highest risk of a given set of risks (e.g., What isthe highest risk of getting a disease? 1 in 10, 1 in100, 1 in 1000). An individual’s numeracy score isthe total number of correct items (maximum value11). This scale has been used in a wide range of stud-ies, showing that people with lower numeracy havemore difficulties understanding risks, are moreprone to framing effects, and are more easily misledby nontransparent formats such as RRRs.18–25
Results
Figure 2 (left) shows that people better understoodthe RRR when the baseline risk was presented as
a frequency rather than a percentage. In the percent-age condition, 54% of participants correctly judgedthe event rate in the treatment group, as opposed to85% in the frequency condition (x2 = 23.8, df = 1,P = 0.001). Baseline risk format was also relevant forunderstanding a treatment’s harms (Figure 2, right):62% of participants in the percentage condition but77% of participants in the frequency condition cor-rectly interpreted the RRI (x2 = 4.6, df = 1, P = 0.02).
Influence of numeracy. Aggregated across the 2experiments, numeracy scores ranged from 4 to 11,with a median of 10 (!x = 9.5, skewness = 21.22). Asin previous studies,21,25 we observed a highly skeweddistribution of numeracy scores. To investigate theinfluence of numeracy, we therefore performeda median split to divide the sample into lower (#9items correct) and higher (.9 items correct) numeracygroups and then examined the influence of format sep-arately for each group using x2 tests.* The median splitfacilitates interpretation and visualization of theresults and enables better comparability of our find-ings with previous studies using the same method.21,25
The median split (Figure 2) shows that partici-pants with higher numeracy generally performedbetter but that both lower and higher numeracy par-ticipants chose a greater number of correct answerswhen baseline risk was presented as a frequency(lower numeracy: x2 = 17.6, df = 1, P = 0.001; highernumeracy: x2 = 10.6, df = 1, P = 0.001).
Results for the RRI scenario (Experiment 1b) weresimilar. Participants with both lower (x2 = 3.6, df =1, P = 0.049) and higher (x2 = 2.5, df = 1, P = 0.08)numeracy were more likely to correctly understandthe RRI when baseline risk was presented as a fre-quency, although the difference was smaller than inthe RRR scenario (Figure 2, right).
Discussion
The majority of participants correctly judged thebenefit or harm of a treatment when the baseline riskwaspresented ina frequency format,whereasapercent-age format led many participants to interpret the rela-tive risk change as an absolute one. Lower numeracy
*We also conducted logistic regressions with format (categorical:percentage v. frequency) and numeracy (continuous) as predictorsand the interpretation (RRR v. ARR) as dependent variable, separatelyfor the risk reduction (Experiment 1a) and risk increase (Experiment 1b)scenario. In both experiments, format and numeracy were significantpredictors for a correct understanding of a relative risk change (seeweb-only appendix for details). Given that regression models makestronger assumptions about the normality of the data, we here focuson the less demanding x2 tests. However, both types of analysis leadto the same conclusions.
BASELINE RISK AND RELATIVE RISK INFORMATION
ORIGINAL ARTICLE 619
at Max Planck Institut on June 13, 2014mdm.sagepub.comDownloaded from

participants more frequently interpreted the relativerisk information erroneously as an absolute risk change.Yet participants with both lower and higher numeracybenefited from a frequency format.
EXPERIMENT 2
Experiment 1 showed that people often errone-ously interpret a relative risk change as an absolutechange. However, further misinterpretations are pos-sible. Sheridan and colleagues17 noted that about20% of their participants interpreted an RRR asdirectly referring to the event rate in the treatmentgroup. One explanation is that people who are unfa-miliar with the basic design of randomized controlledtrials might ignore the information about the baselinerisk and assume instead that the reduction directlyrefers to the event rate in the treatment group (hence-forth denoted as the ER interpretation). For instance,when the RRR in the heart disease scenario is 20%,people may mistakenly believe that 20% of all peoplewho are treated have heart disease.
We consider these 3 interpretations (RRR, ARR,and ER) as conceptual interpretations of an RRR,which should be distinguished from mere calculationerrors. For instance, many people have difficultiesconverting percentages into frequencies and viceversa.16,18 In our example, 20% of 1000 corresponds
to 200 in 1000. A false conversion could result inthe answer 20 of 1000. Along with an ARR interpreta-tion, this may lead participants to interpret the 20%risk reduction as 300 – 20 = 280 of 1000 in the fre-quency condition (Calculation Error I). People fol-lowing an ER interpretation may erroneouslyestimate the risk in the treatment group and comeup with 20 of 1000, or 2% (Calculation Error II). InExperiment 2 we therefore provided participantswith 5 answer options (i.e., RRR, ARR, ER, Calcula-tion Error I, Calculation Error II) for judging the eventrate in the treatment group when given the baselinerisk and an RRR or RRI (Figure 1, bottom).
A second goal was to examine participants’ choiceswhen the relative risk change cannot be meaningfullyinterpreted as an absolute risk change. For instance,given a baseline risk of 30% and an RRR of 40%, misun-derstanding the reduction as a change in percentagepoints yields a negative number (i.e., 30% 2 40% =210%), which renders the ARR interpretation implau-sible. Similarly, given an RRI of 80% and a baseline riskof 30%, an ARI interpretation yields an event rate largerthan 100% (i.e., 30% 1 80% = 110%). Because theinfluence of baseline risk format should predominantlydepend on whether an ARR or ARI is meaningful, wehypothesized that participants’ performance in thehigh-benefit and high-harm condition should be influ-enced mainly by their numeracy skills and not by pre-sentation format.
Figure 2 Proportion of participants correctly understanding the meaning of an RRR (Experiment 1a) and an RRI (Experiment 1b). Correctchoices are influenced by the baseline risk presentation format (percentage or frequency) and participants’ numeracy. (a) Results of Exper-iment 1a. ‘‘Total’’ includes all participants in the percentage (n = 100) and frequency (n = 103) condition. (b) Results of Experiment 1b.‘‘Total’’ includes all participants in the percentage (n = 100) and frequency (n = 82) condition. Numeracy was assessed using Lipkusand others’23 scale; participants were categorized into lower and higher numeracy groups based on a median split. Three participantsin Experiment 1a and 4 participants in Experiment 1b did not provide numeracy answers and were excluded from these analyses.
BODEMER AND OTHERS
620 " MEDICAL DECISION MAKING/JULY 2014
at Max Planck Institut on June 13, 2014mdm.sagepub.comDownloaded from

Participants and Design
Recruitment of participants and remuneration wasidentical to Experiment 1. Experiment 2a (RRR) had443 participants (54% male, !x age = 33 years, SD =11.3); Experiment 2b (RRI) had 406 participants(51% male, !x age = 30 years, SD = 9.6).
Participants in Experiment 2a were randomlyassigned to 1 of 4 conditions: Format of BaselineRisk (percentage v. frequency) 3 Level of RiskReduction (low benefit: 20% v. high benefit: 40%).The high-benefit condition ruled out a meaningfulARR interpretation. In Experiment 2b, the samedesign was used for an RRI: Baseline Risk (percentagev. frequency) 3 Level of Risk Increase (low harm:20% v. high harm: 80%); here the high-harm condi-tion ruled out a meaningful ARI interpretation. Base-line risk was 30% (300 of 1000) in all conditions.
Materials and Procedure
The materials and procedure were identical toExperiments 1a and 1b, except that 5 answer optionswere provided: RRR interpretation (correct answer),ARR interpretation, ER interpretation, CalculationError I, and Calculation Error II. Figure 1 illustratesthe corresponding numerical values exemplarily forthe low-benefit (20%) RRR condition; correspondingnumbers can be computed for the high-benefit (40%)RRR and the 2 RRI conditions (20% v. 80%). For the40% RRR condition, the ARR interpretation was setto 0%; in the 80% RRI condition, the ARI answerwas set to 100%.
Results and Discussion
Figure 3 (top row) shows the results for the 2 RRRscenarios. In the low-benefit condition, participants’judgments varied depending on baseline risk format(x2 = 27.5, df = 4, P = 0.001) but not in the high-benefitcondition (P = 0.41). When RRR = 20% and baselinerisk was presented as a percentage, only 40% of par-ticipants interpreted the statement correctly as a rela-tive reduction (RRR interpretation), while 40%erroneously interpreted it as an absolute difference(ARR interpretation). When baseline risk was pre-sented as a frequency, 63% of participants gave thecorrect answer; only 10% erroneously interpretedthe information as an ARR. Regardless of format,a substantial proportion of participants made an erro-neous ER interpretation (12% and 17%, respectively)by assuming the risk reduction to refer directly to theevent rate in the treatment group. Calculation Errors Iand II occurred rarely.
In the high-benefit condition (RRR = 40%), inwhich the ARR interpretation is rendered implausi-ble, most participants interpreted the relative riskstatement correctly regardless of baseline format(65% v. 68%). Very few ARR interpretations wereobtained, but a substantial proportion of participantseither followed an ER interpretation or committedCalculation Error I.
Figure 4 (top row) shows participants’ judgmentsin the 2 risk increase scenarios. In the low-harmcondition, participants’ judgments differed dep-ending on the baseline risk format (x2 = 15.9, df = 4,P = 0.003), whereas in the high-harm condition judg-ments were similar in pattern in both conditions (P =0.61). When RRI = 20% and baseline risk was pre-sented as a percentage, only 33% of participants cor-rectly judged the risk in the treatment group, and 39%incorrectly interpreted the information as referring toan ARI. Performance was better when baseline riskwas presented in a frequency format; 57% of partici-pants gave the correct answer, and only 19% inter-preted the risk reduction as an absolute increase.Analogous to the risk reduction scenario, a substan-tial proportion of participants (22% and 18%, respec-tively) interpreted the risk reduction in both formatsas referring directly to the event rate in the treatmentgroup (ER interpretation); Calculation Errors I and IIwere rare.
In the high-harm condition, 56% and 61% of par-ticipants in the percentage and frequency conditioncorrectly interpreted the risk statement; almostnone made an ARI interpretation (2%). Irrespectiveof format, about one-quarter of participants made anER interpretation, and between 12% in the percent-age condition and 6% in the frequency conditionmade Calculation Error I.
Influence of numeracy. Aggregated across the 2experiments, numeracy scores ranged from 3 to11, with median = 10, !x = 9.4 (SD = 1.7), and skew-ness = 21.4. Using a median split, we compared theinfluence of baseline risk format separately for par-ticipants with lower and higher numeracy.y
yWe also conducted logistic regressions with format (categorical:percentage v. frequency) and numeracy (continuous) as predictorsand the interpretation (correct v. incorrect) as dependent variable.The regression analyses test for the influence of format and numeracyon interpreting the risk information correctly, independent of the spe-cific misinterpretations. Consistent with the analyses based on themedian split, we found that both format and numeracy were significantpredictors in the low-benefit and low-harm condition; no effect of for-mat but one of numeracy was obtained in the high-benefit and high-harm condition (see web-only appendix for details).
BASELINE RISK AND RELATIVE RISK INFORMATION
ORIGINAL ARTICLE 621
at Max Planck Institut on June 13, 2014mdm.sagepub.comDownloaded from

Figure 3 Results of Experiment 2a (N = 443). The interpretation of an RRR depends on the presentation format and participants’ numer-acy. Even when a meaningful ARR interpretation is ruled out, conceptual misunderstandings remain. The baseline risk was set to 30%(percentage condition) or 300 of 1000 (frequency condition). The left column shows the results for the condition in which the RRR was20% (n = 224); the right column shows the results for an RRR of 40% (n = 219). The top row shows participants’ answers as a functionof baseline risk presentation format (percentage v. frequency). The middle and bottom rows show participants’ responses separately forlower and higher numeracy participants. Six participants did not complete the numeracy questionnaire and were excluded from theseanalyses. ARR = absolute risk reduction interpretation; ER = event rate interpretation; Error I = Calculation Error I; Error II = CalculationError II; RRR = relative risk reduction interpretation. See text for details.
BODEMER AND OTHERS
622 " MEDICAL DECISION MAKING/JULY 2014
at Max Planck Institut on June 13, 2014mdm.sagepub.comDownloaded from

Figure 3 (middle and bottom row) shows partici-pants’ judgments in the RRR scenarios separatelyfor lower and higher numerates based on a mediansplit. For participants with lower numeracy, formatmattered in the low-benefit condition (x2 = 24.8, df= 4, P = 0.001) but not in the high-benefit condition(P = 0.73). For participants with higher numeracy,similar results were obtained with judgments varyingfor the different formats in the low-benefit condition(x2 = 8.7, df = 4, P = 0.067) but not in the high-benefitcondition (P = 0.67). When a meaningful ARR inter-pretation was ruled out (high-benefit condition), par-ticipants more often interpreted the statementcorrectly. However, a substantial proportion ofthem—particularly of those with lower numeracy—misunderstood the information and based theirresponse on an erroneous ER interpretation or Calcu-lation Error I (Figure 3).
Analyzing lower and higher numeracy partici-pants in the RRI scenarios separately (Figure 4, mid-dle and bottom rows) showed that lower numeracyparticipants’ judgments varied somewhat in boththe low-harm (x2 = 8.9, df = 4, P = 0.067) and high-harm (x2 = 7.8, df = 4, P = 0.095) conditions. Judg-ments of participants with higher numeracy skillsvaried in the low-harm condition (x2 = 9.2, df = 4,P = 0.057) but not in the high-harm condition (P = 0.52).
In sum, as in Experiment 1, more participants cor-rectly understood relative risk changes when baserate information was presented in frequencies asopposed to percentages. In addition to confusing rel-ative risks with absolute risks, mistaking them forevent rates was a second kind of misunderstanding.Both misinterpretations tended to be more frequentamong participants with lower numeracy than withhigher numeracy. However, even when providedwith the frequency format, many participants fol-lowed an ARI or ER interpretation in the low-harmcondition or an ER interpretation along with Calcula-tion Error I in the high-harm condition (Figure 4).
GENERAL DISCUSSION
Treatment benefits and harms are often communi-cated by RRRs and RRIs. One suggestion for improv-ing the understanding of such health statistics is toinclude information on baseline risk. Previous stud-ies found that inclusion of this information improvedthe understanding of RRRs, although many partici-pants still gave incorrect estimates of treatmentimplications.15–17 Our study extends this researchby providing a more fine-grained analysis of what
misinterpretations and calculation errors can occurwhen using relative risk changes for communicatingtreatments’ benefits and harms.
Our findings emphasize the importance of choos-ing the right presentation format to communicatethe baseline risk and the influence of people’s numer-acy skills on the perceived meaning of relative riskinformation. Experiment 1 showed that many partic-ipants erroneously interpreted an RRR (RRI) as refer-ring to an absolute decrease (or increase) in risk,particularly when baseline risk was communicatedas a percentage. Presenting baseline risk instead ina frequency format improved understanding. Expe-riment 2 demonstrated not only that peopleconfuse relative with absolute changes but also thata substantial proportion of participants misinter-preted a relative change as referring directly to theevent rate in the treatment group. Further problemsin correctly understanding treatments’ benefits andharms resulted from calculation errors. Notably,many participants misunderstood relative riskformats even in situations in which the numericalvalues of the baseline risk and the decrease (orincrease) precluded misinterpreting a relative changeas an absolute one.
Our studies also highlight the role of numeracy asa mediating factor in understanding relative risks.Participants with higher numeracy were more likelyto judge the risk in the treatment group correctly,but they too made more accurate inferences when thebaseline risk was presented in a frequency format.When an absolute risk interpretation was ruled out(high-benefit and high-harm condition, respectively, inExperiments 2a and 2b), those with lower numeracy stillhad more difficulties in correctly interpreting the state-ment than did those with higher numeracy, evenwhen the baseline risk was provided in a frequency for-mat. Given that they frequently opted for the ER inter-pretation, one possibility is that people with lowernumeracy skills also tend to lack the conceptual under-standing that risk changes always refer to a control groupand therefore misunderstood the information as directlyreferring to the event rate in the treatment group.
Two important insights into people’s understand-ing of relative risk changes stem from the presentfindings. First, these results may explain why peopleoften overestimate treatment benefits when they arecommunicated as RRRs: Interpreting a relative reduc-tion as an absolute reduction results in an overestima-tion of a treatment’s effectiveness. Consider thescenarios in which the baseline risk was 30% and theRRR was 20%. This implies that the event rate in thetreatment group is 24%, but misinterpreting the
BASELINE RISK AND RELATIVE RISK INFORMATION
ORIGINAL ARTICLE 623
at Max Planck Institut on June 13, 2014mdm.sagepub.comDownloaded from

Figure 4 Results of Experiment 2b (N = 406). The interpretation of RRI depends on the presentation format and participants’ numeracy.Even when a meaningful ARI interpretation is ruled out, conceptual misunderstandings remain. The baseline risk was set to 30% (percent-age condition) or 300 of 1000 (frequency condition). The left column shows the results for the condition in which the RRI was 20%; the rightcolumn shows the results for an RRI of 80%. The top row shows participants’ answers as a function of the baseline risk presentation format(percentage v. frequency). The middle and bottom row show participants’ responses separately for lower v. higher numeracy participants.Thirteen participants did not complete the numeracy questionnaire and were excluded from these analyses. RRI = relative risk increaseinterpretation; ARI = absolute risk increase interpretation; ER = event rate interpretation; Error I = Calculation Error I; Error II = CalculationError II. See text for details.
BODEMER AND OTHERS
624 " MEDICAL DECISION MAKING/JULY 2014
at Max Planck Institut on June 13, 2014mdm.sagepub.comDownloaded from

information as an absolute decrease reduces the num-ber to 10%. Second, the finding that a substantial pro-portion of participants interpreted the RRR (RRI) asdirectly referring to the event rate in the treatmentgroup points to another problem that impedes under-standing of health information: Using information onthe baseline risk is beneficial only when people under-stand that benefits and harms of treatments are evalu-ated based on a comparison between a control anda treatment group. If people lack this conceptual under-standing, they may simply ignore the provided baselinerisk and incorrectly assume that the risk informationrefers directly to the event rate in the treatment group.
Given the current results and other findings fromthe literature,4,15–17 we believe that the most helpfulway to communicate treatment benefits and harmsis to provide information on the event rate in the con-trol group and in the treatment group—the veryempirical evidence from which any measure can bederived. So-called fact boxes35,36 aim to implementthis idea. Figure 5 shows a fact box on mammographyscreening that provides the relevant information ina frequency format. It defines the reference class(women from the population aged 50 years and
older), provides information on breast cancer mortal-ity (5 in 1000 without screening v. 4 in 1000 withscreening), compares the overall cancer mortality(21 in 1000 with and without screening), and commu-nicates harms such as overdiagnosis (100 of 1000 ofthose with screening) and overtreatment (5 out of1000 of those with screening). Thus, a fact box pro-vides patients, doctors, and policy makers with a con-cise overview of the best evidence currently available(e.g., based on the Cochrane Collaboration’s system-atic reviews) in a transparent and intuitive manner.
Limitations and Future Research
For the experiments, we used a convenience sam-ple with limited variability in age and educationallevel. Using more representative samples or specificsamples (e.g., patients, doctors) might help identifyfurther moderating variables, such as education,age, or socioeconomic status, to account for a broaderrange of individual differences in the interpretationof relative risk statements. We also used a forced-choice format derived from a priori specified hypoth-eses about alternative understandings of relative riskinformation. Future research should investigate howaccurate people’s estimates of treatment benefits andharms are when they have to perform the calculationthemselves. Finally, future research should examinepeople’s judgments across a broader range of scenar-ios, with varying baseline risks and treatment bene-fits and harms.
ACKNOWLEDGMENTS
We thank Anita Todd, Rona Unrau, and Tarlise Townsendfor editing the manuscript.
REFERENCES
1. Gigerenzer G. Risk Savvy: How to Make Good Decisions. NewYork (NY): Viking; 2014.
2. Gigerenzer G, Gray JAM. Launching the century of the patient.In: Gigerenzer G, Gray JAM, eds. Better Doctors, Better Patients,Better Decisions: Envisioning Health Care 2020. Cambridge(MA): MIT Press; 2011. p 3–28.
3. Williams D, Kelly A, Carvalho M, Feely J. Effect of the Britishwarning on contraceptive use in the General Medical Service in Ire-land. Ir Med J. 1998;91(6):202–3.
4. Akl EA, Oxman AD, Herrin J, et al. Using alternative statisticalformats for presenting risks and risk reductions. Cochrane Data-base Syst Rev. 2011;(3):CD006776.
Figure 5 Example of a fact box summarizing evidence on benefitsand harms of mammography screening. The fact box presents infor-mation on the event rates in the control and treatment groups interms of frequencies and renounces any measures of relative riskreduction.36 The authors of the Cochrane systematic review37 distin-guished between higher and lower quality studies, based on method-ological criteria such as a sound randomization procedure. Acrossall studies, the authors estimated an absolute risk reduction of 0.5in 1000. The fact box reports a rounded estimate of 1 in 1000. Inany case, these numbers should not be interpreted as definitivebut as approximate estimates of possible benefits and harms. Formore details, see Gigerenzer1 and Harding Center for Risk Literacy.36
BASELINE RISK AND RELATIVE RISK INFORMATION
ORIGINAL ARTICLE 625
at Max Planck Institut on June 13, 2014mdm.sagepub.comDownloaded from

5. Covey J. A meta-analysis of the effects of presenting treatmentbenefits in different formats. Med Decis Making. 2007;27(5):638–54.
6. Edwards A, Elwyn G, Covey J, Matthews E, Pill R. Presentingrisk information—a review of the effects of ‘‘framing’’ and othermanipulations on patient outcomes. J Health Commun. 2001;6(1):61–82.
7. Forrow L, Taylor WC, Arnold RM. Absolutely relative: howresearch results are summarized can affect treatment decisions.Am J Med. 1992;92(2):121–4.
8. Muhlhauser I, Kasper J, Meyer G, Federation of EuropeanNurses in Diabetes. Understanding of diabetes prevention studies:questionnaire survey of professionals in diabetes care. Diabetolo-gia. 2006;49(8):1742–6.
9. Jorgensen KJ, Gøtzsche PC. Presentation on websites of possiblebenefits and harms from screening for breast cancer: cross sectionalstudy. BMJ. 2004;328(7432):148.
10. Moynihan R, Bero L, Ross-Degnan D, et al. Coverage by thenews media of the benefits and risks of medications. N Engl JMed. 2000;342(22):1645–50.
11. Slater MD, Long M, Bettinghaus EP, Reineke JB. News coverageof cancer in the United States: a national sample of newspapers, tele-vision, and magazines. J Health Commun. 2008;13(6):523–37.
12. Gigerenzer G, Wegwarth O, Feufel M. Misleading communica-tion of risk. BMJ. 2010;341:c4830.
13. Schwartz LM, Woloshin S, Dvorin EL, Welch HG. Ratio meas-ures in leading medical journals: structured review of accessibilityof underlying absolute risks. BMJ. 2006;333(7581):1248.
14. Sedrakyan A, Shih C. Improving depiction of benefits andharms: analyses of studies of well-known therapeutics and reviewof high-impact medical journals. Med Care. 2007;45(10 Suppl 2):S23–8.
15. Natter HM, Berry DC. Effects of presenting the baseline riskwhen communicating absolute and relative risk reductions. Psy-chol Health Med. 2005;10(4):326–34.
16. Schwartz LM, Woloshin S, Black WC, Welch HG. The role ofnumeracy in understanding the benefit of screening mammogra-phy. Ann Intern Med 1997;127(11):966–72.
17. Sheridan SL, Pignone MP, Lewis CL. A randomized compari-son of patients’ understanding of number needed to treat and othercommon risk reduction formats. J Gen Intern Med. 2003;18(11):884–92.
18. Reyna VF, Nelson WL, Han PK, Dieckmann NF. How numer-acy influences risk comprehension and medical decision making.Psychol Bull. 2009;135(6):943–73.
19. Galesic M, Garcia-Retamero R. Statistical numeracy for health:a cross-cultural comparison with probabilistic national samples.Arch Intern Med. 2010;170(5):462–8.
20. Galesic M, Garcia-Retamero R, Gigerenzer G. Using icon arraysto communicate medical risks: overcoming low numeracy. HealthPsychol. 2009;28(2):210–6.
21. Garcia-Retamero R, Galesic M. Who profits from visual aids:overcoming challenges in people’s understanding of risks [cor-rected]. Soc Sci Med. 2010;70(7):1019–25.
22. Gigerenzer G, Gaissmaier W, Kurz-Milcke E, Schwartz LM,Woloshin S. Helping doctors and patients make sense of health sta-tistics. Psychol Sci Public Interest. 2007;8:53–96.
23. Lipkus IM, Samsa G, Rimer BK. General performance ona numeracy scale among highly educated samples. Med Decis Mak-ing. 2001;21:37–44.
24. Lipkus IM, Peters E. Understanding the role of numeracy inhealth: proposed theoretical framework and practical insights.Health Educ Behav. 2009;36(6):1065–81.
25. Peters E, Vastfjall D, Slovic P, Mertz CK, Mazzocco K, DickertS. Numeracy and decision making. Psychol Sci. 2006;17:407–13.
26. Watkins PJ. Cardiovascular disease, hypertension, and lipids.BMJ. 2003;326:874–6.
27. Centers for Disease Control and Prevention. Age-adjusted per-centage of persons with diabetes aged 35 years and older reportingany cardiovascular disease condition, by sex, United States,1997–2009. Available at: URL: http://www.cdc.gov/diabetes/statistics/cvd/fig5.htm
28. Berry DC, Knapp P, Raynor T. Expressing medicine sideeffects: assessing the effectiveness of absolute risk, relative risk,and number needed to harm, and the provision of baseline riskinformation. Patient Educ Couns. 2006;63(1–2):89–96.
29. Covey J. The effects of absolute risks, relative risks, frequen-cies, and probabilities on decision quality. J Health Commun.2011;16(7):788–801.
30. Berinsky AJ, Huber GA, Lenz GS. Evaluating online labor mar-kets for experimental research: Amazon.com’s Mechanical Turk.Polit Anal. 2012;20(3):351–68.
31. Buhrmester M, Kwang T, Gosling SD. Amazon’s MechanicalTurk: a new source of inexpensive, yet high-quality, data? PerspectPsychol Sci. 2011;6(1):3–5.
32. Paolacci G, Chandler J, Ipeirotis PG. Running experiments onAmazon Mechanical Turk. Judgm Decis Making. 2010;5:411–9.
33. Sprouse J. A validation of Amazon Mechanical Turk for thecollection of acceptability judgments in linguistic theory. BehavRes Methods. 2010;43(1):155–67.
34. Goldbeck AL, Ahlers-Schmidt CR, Paschal AM, Dismuke S. Adefinition and operational framework for health numeracy. Am JPrev Med. 2005;29:375–6.
35. Schwartz LM, Woloshin S, Welch HG. Using a drug facts box tocommunicate drug benefits and harms: two randomized trials. AnnIntern Med. 2009;150(8):516–27.
36. Harding Center for Risk Literacy. Risks and benefits ofmammography screening. Available from: URL: http://harding-center.de/index.php/en/what-you-should-know/facts-boxes/mammography
37. Gøtzsche PC, Nielsen M. Screening for breast cancer withmammography. Cochrane Database Syst Rev. 2011;(1):CD001877.
BODEMER AND OTHERS
626 " MEDICAL DECISION MAKING/JULY 2014
at Max Planck Institut on June 13, 2014mdm.sagepub.comDownloaded from
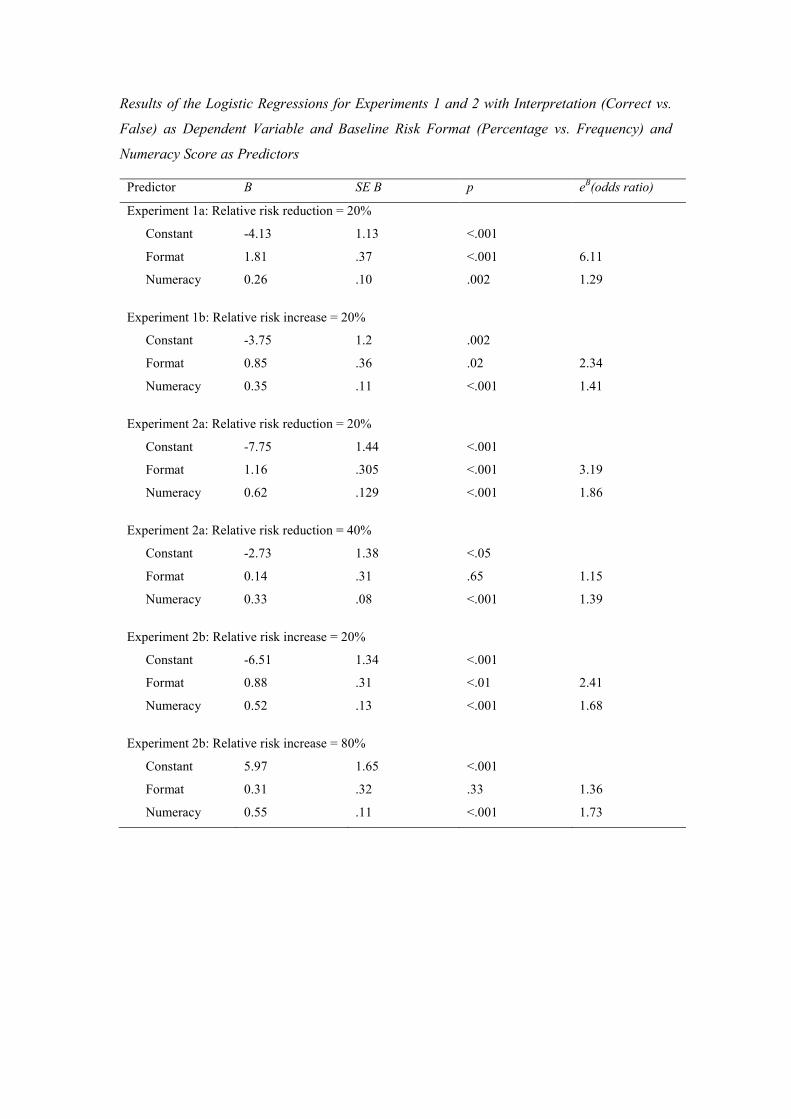
Results of the Logistic Regressions for Experiments 1 and 2 with Interpretation (Correct vs.
False) as Dependent Variable and Baseline Risk Format (Percentage vs. Frequency) and
Numeracy Score as Predictors
Predictor B SE B p eB(odds ratio)
Experiment 1a: Relative risk reduction = 20%
Constant -4.13 1.13 <.001
Format 1.81 .37 <.001 6.11
Numeracy 0.26 .10 .002 1.29
Experiment 1b: Relative risk increase = 20%
Constant -3.75 1.2 .002
Format 0.85 .36 .02 2.34
Numeracy 0.35 .11 <.001 1.41
Experiment 2a: Relative risk reduction = 20%
Constant -7.75 1.44 <.001
Format 1.16 .305 <.001 3.19
Numeracy 0.62 .129 <.001 1.86
Experiment 2a: Relative risk reduction = 40%
Constant -2.73 1.38 <.05
Format 0.14 .31 .65 1.15
Numeracy 0.33 .08 <.001 1.39
Experiment 2b: Relative risk increase = 20%
Constant -6.51 1.34 <.001
Format 0.88 .31 <.01 2.41
Numeracy 0.52 .13 <.001 1.68
Experiment 2b: Relative risk increase = 80%
Constant 5.97 1.65 <.001
Format 0.31 .32 .33 1.36
Numeracy 0.55 .11 <.001 1.73