Communicating Diagnostic and Therapeutic Information to Patients Accounting for Lower Health...
55
Communicating Diagnostic and Therapeutic Information to Patients Accounting for Lower Health Numeracy Christopher R. Carpenter, MD, MSc, Richard T. Griffey, MD, MPH, Dan Theodoro MD, June 2011 Journal Club Division of Emergency Medicine
-
Upload
alaina-walters -
Category
Documents
-
view
215 -
download
0
Transcript of Communicating Diagnostic and Therapeutic Information to Patients Accounting for Lower Health...

Communicating Diagnostic and Therapeutic Information to Patients
Accounting for Lower Health NumeracyChristopher R. Carpenter, MD, MSc, Richard T. Griffey, MD, MPH, Dan
Theodoro MD, June 2011 Journal Club
Division of Emergency Medicine

Special Thanks to our guests
• Mary Politi• Kim Kaphingst

Probability and Bayesian logic is confusing to everyone – not just those with low health numeracy
Lay persons are not used to thinking beyond positive or negative test results or therapies recommended by their doctors.
When clinicians consider test characteristics they often don’t consider these within the context of disease prevalence

A test correctly detects disease 95% of the time (sensitivity) in people with the disease and if negative effectively clears 90% of the patients in whom the disease is absent (specificity)
If disease is present in 1 out of 1000 people (prevalence) what is the probability that a randomly chosen person who tests positive really has the disease?
Classic Question:

YES NO TOTAL
YES 95 9990 10085
NO 5 89910 89915
TOTAL 100 99900 100000
Disease Status
Sym
pto
m P
rese
nt

Test characteristics:Validity (Accuracy) & Reliability
Reliable,
Not Valid
Valid,
Not Reliable
Valid and
Reliable


How Would You Communicate Risks & Benefits in the Emergency
Department?
• Need to find and appraise the evidence summary BEFORE the patient encounter
• Here’s an example using tPA for acute ischemic stroke and the Wash U Journal Club archives @ http://emed.wustl.edu/em_journal_club.html

http://emed.wustl.edu/emjclub_July2009_TheEvidenceSupportsThrombolyticsStroke4.5Hours.html

PGY IV Critical Appraisal

http://www.nntonline.net/visualrx/
Calculating Benefit Pictographs

From the Wash U PGY IV Critical Appraisal


What About Harm?
http://www.nntonline.net/visualrx/


PGY INeedle Aspiration of PTX
• Meta-analysis in 2007 identified only one high quality RCT upon which to base conclusions (Noppen 2002 – the PGY I article at that JC)
• Noppen et al. demonstrated – No difference in immediate success rate
• RR = 0.93 (95% CI 0.62-0.41)– No difference in early failure rate
• RR = 1.12 (95% CI 0.59-2.13)– Lower hospitalization rates in aspiration
• RR 0.52 (95% CI 0.36-0.75)

Case 1: PSP

Immediate Success Rate

Immediate Success Rate

Hospitalization Rate


PGY IICT for PE
• PIOPED II provided the following test characteristics for PE protocol CT

First risk stratification by Wells (prevalence):56% low probability38% intermediate probability6% high probability
Case 2: How accurate is CTA for PE?
So, we cannot PERC our patient but her Wells score is 0, so she is low probability for PE….
(sidestepping d-dimer testing…)
Test characteristics:In general, when PE is present CTA detects it 83% of the time (Sensitivity)In general when CTA was negative it was correct 95% of the time (specificity)
Among low prob patients though, a positive CTA indicates true disease only 58% of the time (PPV) and a negative CTA is correct 96% of the time (NPV).

Diagnostic CommunicationTwo Concepts
• Test Accuracy• Disease Probability

Concept #1 Test Accuracy

Sensitivity
= Has PE and CT shows it
= Has PE and CT missed it

Specificity
= Does not have PE and CT did not show a PE
= Does not have PE but CT showed a PE

If we knew you had a PE before we
tested you
If we knew you did not have a PE before we
tested you

Concept #2 Disease Probability

?

35
Fagan Nomogram
Low Risk ~3.6% mean probability of PE
3.6% pre-CT and CT no PE = 0.67%
In other words, if 1000 patients with these odds of having a PE had a CT
that did not demonstrate a PE, about 7 of them would still have a PE
No PE on CT

36
Fagan Nomogram
Low Risk ~3.6% mean probability of PE
3.6% pre-CT and CT with a PE = 42.3%
In other words, if 1000 patients with these odds of having a PE had a CT
that demonstrated a PE, about 423 of them would actually have a PE
PE found on CT


38
Fagan Nomogram
High Risk ~66.7% mean probability of PE
66.7% pre-CT and CT with a PE = 97.5%
In other words, if 1000 patients with these odds of having a PE had a CT
that demonstrated a PE, about 975 of them would actually have a PE
PE found on CT

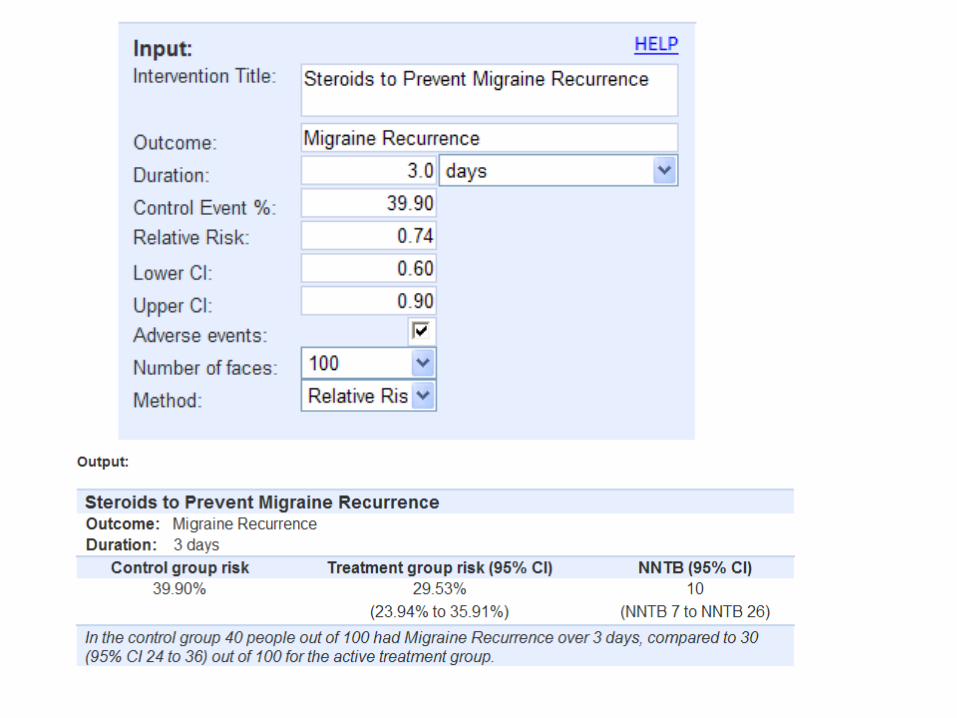
PGY IIISteroids to Prevent Recurrent
Migraine• Critical appraisal provides the RR and 95% CI
but not the control event rate so need to pull the original paper

Control Event Rate = [22 + 10 + 8 + 18 + 20 + 43 + 20] / 353Control Event Rate = 141/353
Control Event Rate = 0.399


PGY IVHead CT After Blunt Trauma
• 30 year old male in tornado-related building collapse without objective signs/symptoms of injury: Canadian Head CT Rule

Sensitivity
= Has clinically important brain injury and Canadian Rule shows it
= Has clinically important brain injury but Canadian Rule does not show it

Specificity
= Does not have a clinically important brain injury and Canadian Rule does not show one
= Does not have a clinically important brain injury but Canadian Rule suggests one
48
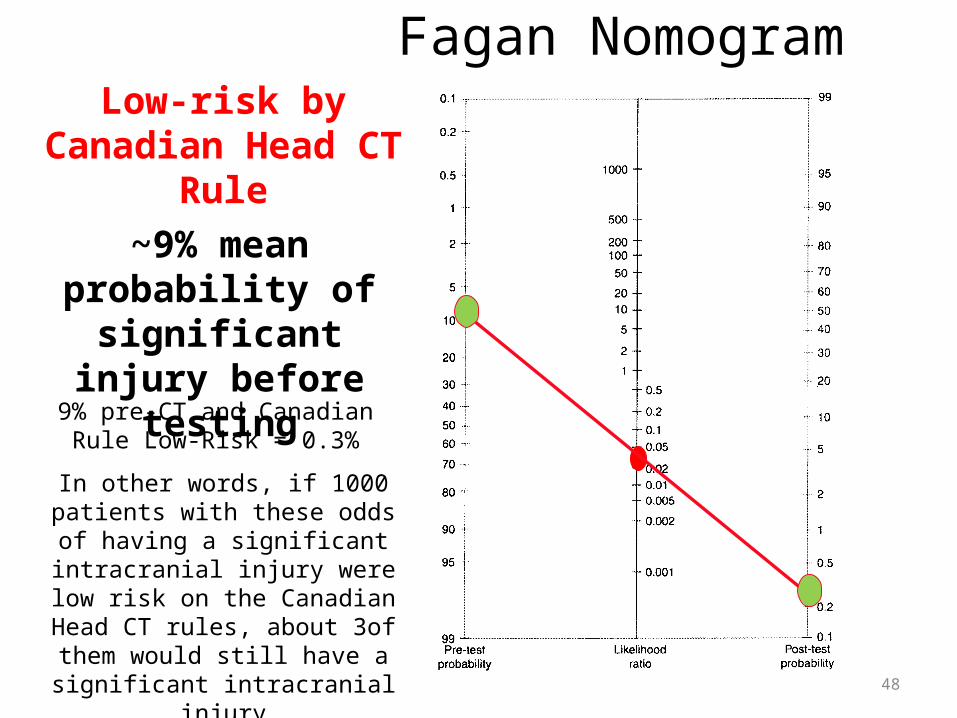
Fagan Nomogram
~9% mean probability of significant injury
before testing
9% pre-CT and Canadian Rule Low-Risk = 0.3%
In other words, if 1000 patients with these odds of having a significant
intracranial injury were low risk on the Canadian Head CT rules, about 3of them would still have a significant
intracranial injury
Low-risk by Canadian Head
CT Rule

49
Fagan Nomogram
~9% mean probability of significant injury
before testing
High Risk by Canadian Head
CT Rule
9% pre-CT and Canadian Rule High-Risk = 16%
In other words, if 1000 patients with these odds of having a significant
intracranial injury were non-low risk on the Canadian Head CT rules, about
160 of them would actually have a significant intracranial injury


51
What is EBM?
Clinical Expertise
Research Research EvidenceEvidence
Patient Preferences

References• Fagerlin A, et al. Making numbers matter: Present and future research in risk
communication, Am J Health Behav 2007; 31: S47-S56.• Houts PS, et al. The role of pictures in improving health communication: A
review of research on attention, comprehension, recall, and adherence, Patient Educ Couns 2006: 61: 173-190.
• Barry MJ et al. Reactions of potential jurors to a hypothetical malpractice suit alleging failure to perform a prostate-specific antigen test, J Law Med Ethics 2008; 36: 396-402.
• Moulton B, King JS; Aligning ethics with medical decision-making: The quest for informed patient choice, J Law Med Ethics 2010; 38: 85-97.
• Epstein RM, et al. Communicating evidence for participatory decision making, JAMA 2004; 291: 2359-2366.
• Lipkus IM; Numeric, verbal, and visual formats of conveying health risks: Suggested best practices and future recommendations, Med Dec Making 2007; 27: 696-713.

More References• Fagerlin A, et al. Reducing the influence of anecdotal reasoning on
people’s health care decisions: Is a picture worth a thousand statistics? Med Decis Making 2005; 25: 398-405.
• Fagerlin A, et al. Measuring numeracy without a math test: Development of the subjective numeracy scale, Med Dec Making 2007; 27: 672-680.
• Lipkus IM, et al. General performance on a numeracy scale among highly educated samples, Med Decis Making 2001; 21: 37-44.
• Woloshin S, et al. Assessing values for health: Numeracy matters, Med Decis Making 2001; 21: 382-390.
• Politi MC, et al. Communicating the uncertainties of harms and benefits of medical interventions, Med Decis Making 2007; 27: 681-695.
• Hoffrage U, et al. Representation facilitates reasoning: what natural frequencies are and what they are not, Cognition 2002; 84: 343-352.

And More References• Hoffrage U, Gigerenzer G; Using natural frequencies to improve diagnostic
inferences, Acad Med 1998; 73: 538-540.• Loong TW; Understanding sensitivity and specificity with the right side of the
brain, BMJ 2003; 327: 716-719.• Windish DM et al. Medicine residents’ understanding of the biostatistics and
results in the medical literature, JAMA 2007; 298: 1010-1022.• Horowitz HW; The interpreter of facts, JAMA 2008; 299: 497-498.• Halvorsen PA, et al. Different ways to describe the benefits of risk-reducing
treatments: a randomized trial, Ann Intern Med 2007; 146: 848-856.• Woloshin S, et al. The effectiveness of a primer to help people understand
risk: two randomized trials in distinct populations, Ann Intern Med 2007; 146: 256-265.
• Shalowitz DI, Wolf MS; Shared decision-making and the lower literate patient, J Law Med Ethics 2004; 32: 759-764.

Textbook References• Kassirer JP, Kopelman RI; Learning Clinical Reasoning, Williams and
Wilkins 1991.• Newman TB, Kohn MA; Evidence-Based Diagnosis, Cambridge University
Press 2009.• Gigerenzer G, Calculated Risks: How to Know When Numbers Deceive
You, Simon and Shuster 2002.