Commonwealth - Mass.Gov · Commonwealth’s total pension obligation performed in accordance ......
44
Commonwealth ACTUARIAL VALUATION REPORT JANUARY 1, 2006 PUBLIC EMPLOYEE RETIREMENT ADMINISTRATION COMMISSION COMMONWEALTH OF MASSACHUSETTS
Transcript of Commonwealth - Mass.Gov · Commonwealth’s total pension obligation performed in accordance ......
Commonwealth ACTUARIAL VALUATION REPORT
JANUARY 1, 2006
PUBLIC EMPLOYEE RE TIREMENT ADMINISTRATION COMMISSION
COMMONWEALTH OF MASSACHUSE T TS

COMMONWEALTH ACTUARIAL VALUATION REPORT
January 1, 2006
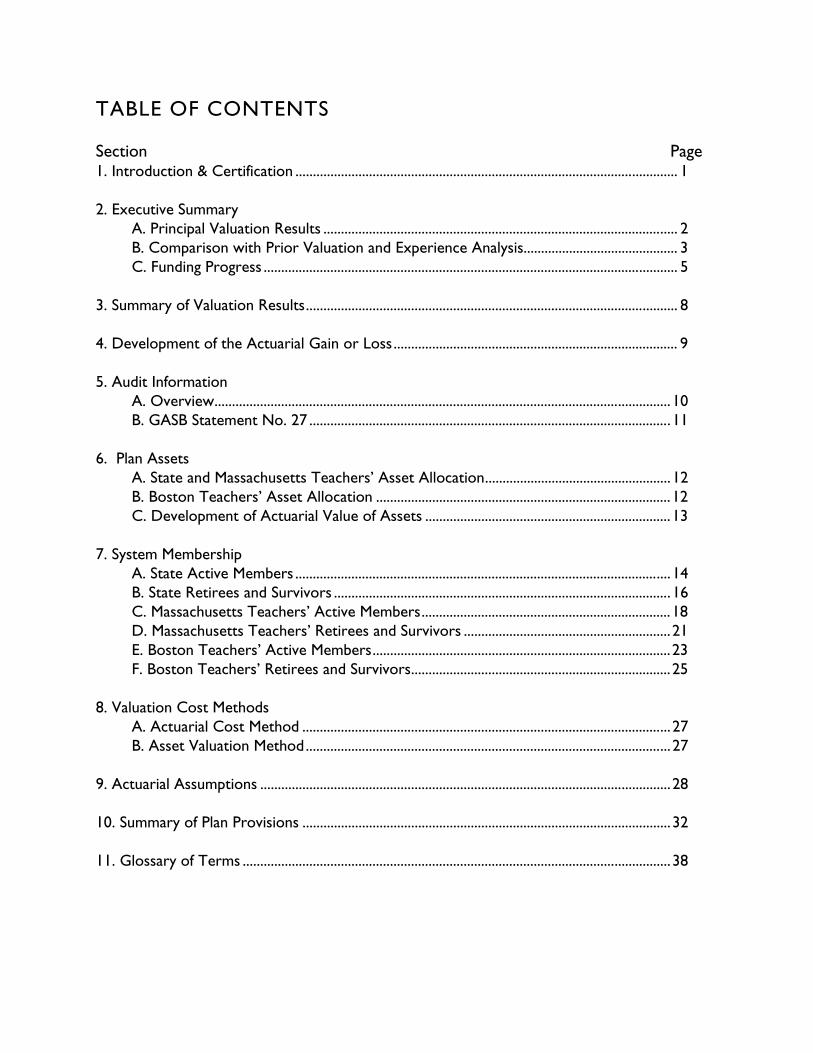
TABLE OF CONTENTS
Section Page 1. Introduction & Certification ............................................................................................................. 1
2. Executive Summary A. Principal Valuation Results ..................................................................................................... 2 B. Comparison with Prior Valuation and Experience Analysis............................................ 3 C. Funding Progress ...................................................................................................................... 5
3. Summary of Valuation Results.......................................................................................................... 8
4. Development of the Actuarial Gain or Loss................................................................................. 9
5. Audit Information A. Overview..................................................................................................................................10 B. GASB Statement No. 27 .......................................................................................................11
6. Plan Assets A. State and Massachusetts Teachers’ Asset Allocation.....................................................12 B. Boston Teachers’ Asset Allocation ....................................................................................12 C. Development of Actuarial Value of Assets ......................................................................13
7. System Membership A. State Active Members ...........................................................................................................14 B. State Retirees and Survivors ................................................................................................16 C. Massachusetts Teachers’ Active Members.......................................................................18 D. Massachusetts Teachers’ Retirees and Survivors ...........................................................21 E. Boston Teachers’ Active Members.....................................................................................23 F. Boston Teachers’ Retirees and Survivors..........................................................................25
8. Valuation Cost Methods A. Actuarial Cost Method .........................................................................................................27 B. Asset Valuation Method........................................................................................................27
9. Actuarial Assumptions .....................................................................................................................28
10. Summary of Plan Provisions .........................................................................................................32
11. Glossary of Terms ..........................................................................................................................38
1. INTRODUCTION & CERTIFICATION
This report presents the results of the actuarial valuation of the pension benefits that are the obligation of the Commonwealth of Massachusetts. The four components are:
- State Employees’ Retirement System - Massachusetts Teachers’ Retirement System - Boston Teachers - Cost of Living Allowance Reimbursements to Local Systems
The valuation was performed as of January 1, 2006 pursuant to Chapter 32 of the General Laws of the Commonwealth of Massachusetts, and is based on the plan provisions in effect at that time. The actuarial assumptions used to calculate the accrued liability and the normal cost are the same assumptions we used in our January 1, 2005 actuarial valuation and reflect the experience analysis we conducted in 2000.
This valuation is based on member data as of December 31, 2005, which was supplied by the State, Massachusetts Teachers’, and Boston Retirement Boards. We performed a number of tests on the data to ensure reasonableness and made specific assumptions for a number of State Teacher data items. Asset information as of December 31, 2005 was provided by the Pension Reserves Investment Management Board and by the Boston Retirement Board’s 2005 Annual Statement of Financial Condition. We reviewed both the membership data and financial information for reasonableness but we did not audit this information.
We believe this report represents an accurate appraisal of the actuarial status of the Commonwealth’s total pension obligation performed in accordance with generally accepted actuarial principles and practices relating to pension plans. In our opinion, the actuarial assumptions used in this report are reasonable, are related to plan experience and expectations, and represent our best estimate of anticipated experience.
Associate of the Society of Actuaries Enrolled Actuary Number 05-4709
Respectfully submitted, Public Employee Retirement Administration Commission
___________________________________ James R. Lamenzo Member of the American Academy of Actuaries
___________________________________ Joseph E. Connarton Executive Director
Dated: September 26, 2006
C O MM O NW E A L T H A C T U A R I A L V AL U A T I O N R EP OR T | J A N U A R Y 1 , 2 0 0 6 1
2. EXECUTIVE SUMMARY
PART A | PRINCIPAL VALUATION RESULTS
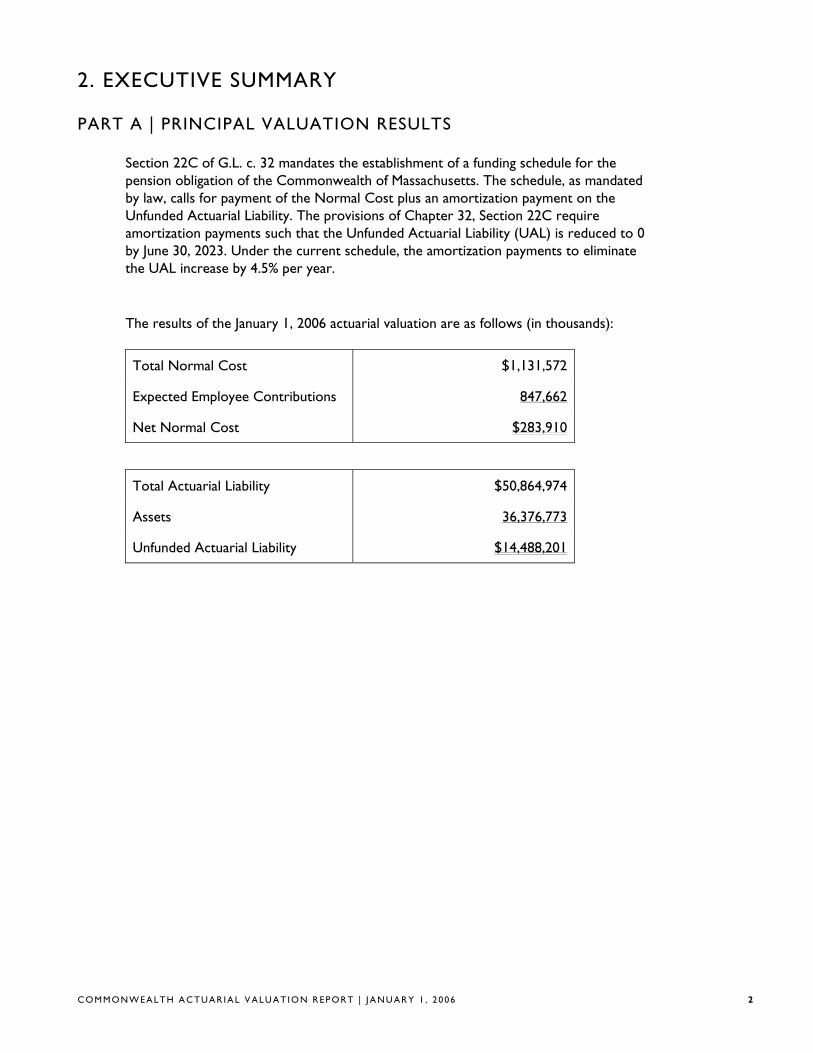
Section 22C of G.L. c. 32 mandates the establishment of a funding schedule for the pension obligation of the Commonwealth of Massachusetts. The schedule, as mandated by law, calls for payment of the Normal Cost plus an amortization payment on the Unfunded Actuarial Liability. The provisions of Chapter 32, Section 22C require amortization payments such that the Unfunded Actuarial Liability (UAL) is reduced to 0 by June 30, 2023. Under the current schedule, the amortization payments to eliminate the UAL increase by 4.5% per year.
The results of the January 1, 2006 actuarial valuation are as follows (in thousands):
Total Normal Cost $1,131,572
Expected Employee Contributions 847,662
Net Normal Cost $283,910
Total Actuarial Liability $50,864,974
Assets 36,376,773
Unfunded Actuarial Liability $14,488,201
C O MM O NW E A L T H A C T U A R I A L V AL U A T I O N R EP OR T | J A N U A R Y 1 , 2 0 0 6 2
2. EXECUTIVE SUMMARY (continued)
PART B | COMPARISON WITH PRIOR VALUATION AND EXPERIENCE ANALYSIS
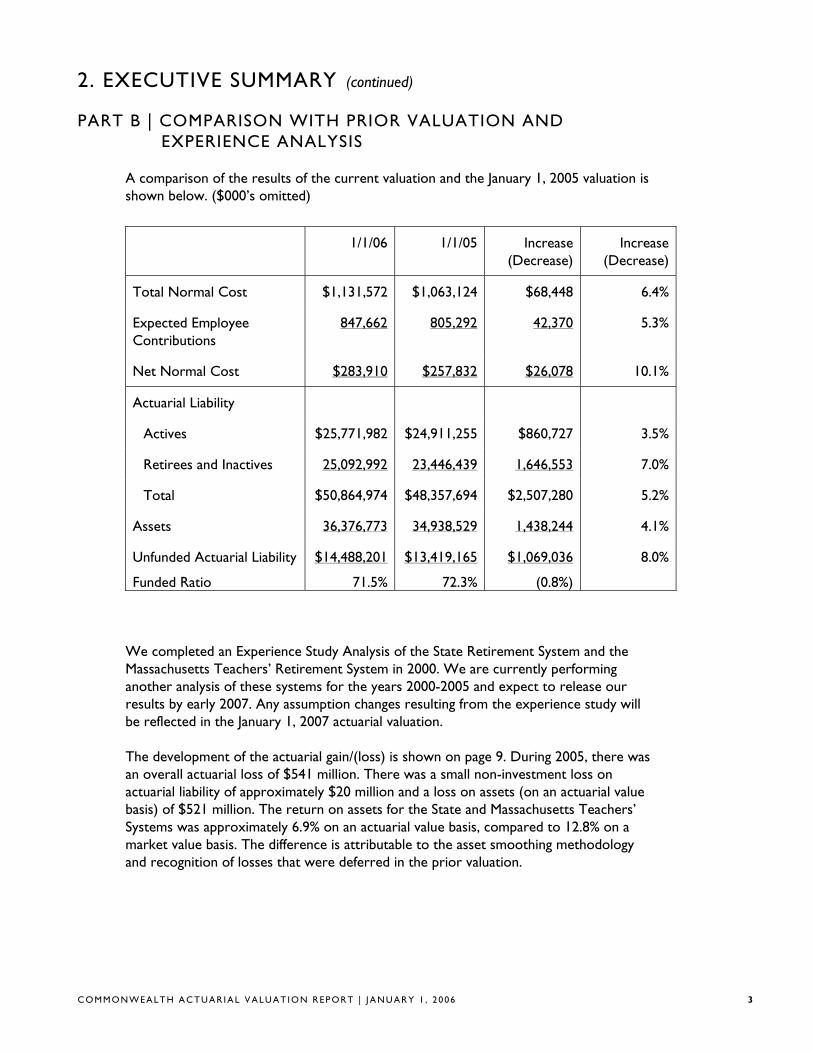
A comparison of the results of the current valuation and the January 1, 2005 valuation is shown below. ($000’s omitted)
1/1/06 1/1/05 Increase (Decrease)
Increase (Decrease)
Total Normal Cost
Expected Employee Contributions
Net Normal Cost
$1,131,572
847,662
$283,910
$1,063,124
805,292
$257,832
$68,448
42,370
$26,078
6.4%
5.3%
10.1%
Actuarial Liability
Actives
Retirees and Inactives
Total
Assets
Unfunded Actuarial Liability
Funded Ratio
$25,771,982
25,092,992
$50,864,974
36,376,773
$14,488,201
71.5%
$24,911,255
23,446,439
$48,357,694
34,938,529
$13,419,165
72.3%
$860,727
1,646,553
$2,507,280
1,438,244
$1,069,036
(0.8%)
3.5%
7.0%
5.2%
4.1%
8.0%
We completed an Experience Study Analysis of the State Retirement System and the Massachusetts Teachers’ Retirement System in 2000. We are currently performing another analysis of these systems for the years 2000-2005 and expect to release our results by early 2007. Any assumption changes resulting from the experience study will be reflected in the January 1, 2007 actuarial valuation.
The development of the actuarial gain/(loss) is shown on page 9. During 2005, there was an overall actuarial loss of $541 million. There was a small non-investment loss on actuarial liability of approximately $20 million and a loss on assets (on an actuarial value basis) of $521 million. The return on assets for the State and Massachusetts Teachers’ Systems was approximately 6.9% on an actuarial value basis, compared to 12.8% on a market value basis. The difference is attributable to the asset smoothing methodology and recognition of losses that were deferred in the prior valuation.
C O MM O NW E A L T H A C T U A R I A L V AL U A T I O N R EP OR T | J A N U A R Y 1 , 2 0 0 6 3
2. EXECUTIVE SUMMARY (cont inued)
PART B | COMPARISON WITH PRIOR VALUATION AND EXPERIENCE ANALYSIS (cont inued)
The development of the actuarial value of assets for the State and Massachusetts Teachers’ systems is shown on page 13. As of January 1, 2006, the actuarial value of assets is 93.2% of the market value. Under the corridor approach used in this valuation, the actuarial value of assets cannot be less than 85% nor greater than 115% of the market value. The January 1, 2006 actuarial value of assets is within this corridor. As of January 1, 2005 the calculated actuarial value was 98.4% of market value. For a comparison of the market and actuarial value of assets since 1997 see page 7.
We have detailed a number of the assumptions we made for missing or questionable data for active members of the Massachusetts Teachers’ Retirement System in Part C of Section 7. We believe these assumptions provide reasonable valuation results on an overall basis for the Commonwealth.
As in past valuations, the assets allocated to Boston teachers are based on the allocation of the total accrued liability between Boston teachers and other members of the State-Boston Retirement System. If only the annuity savings fund and annuity reserve fund for Boston teachers were included as Commonwealth valuation assets, the overall Commonwealth unfunded liability would increase by approximately $605 million and the overall funded ratio would decrease to 70.3%.
C O MM O NW E A L T H A C T U A R I A L V AL U A T I O N R EP OR T | J A N U A R Y 1 , 2 0 0 6 4
2. EXECUTIVE SUMMARY (continued)
PART C | FUNDING PROGRESS UNFUNDED LIABILITY
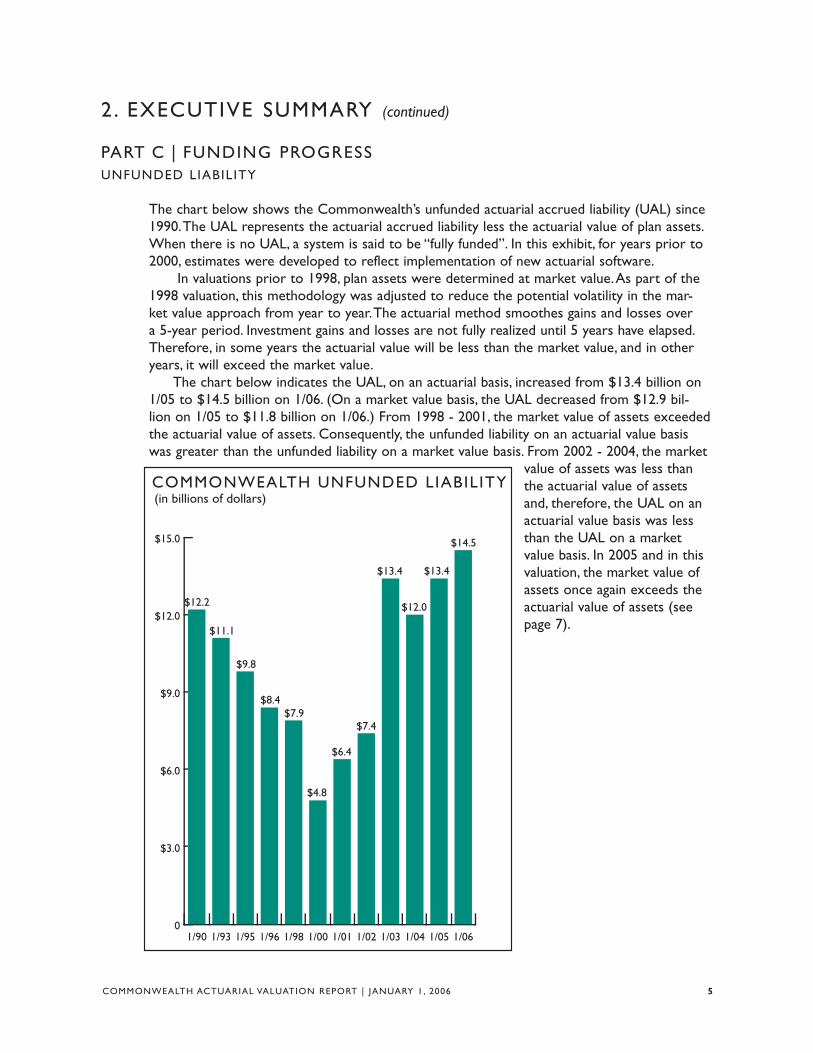
The chart below shows the Commonwealth’s unfunded actuarial accrued liability (UAL) since 1990.The UAL represents the actuarial accrued liability less the actuarial value of plan assets. When there is no UAL, a system is said to be “fully funded”. In this exhibit, for years prior to 2000, estimates were developed to reflect implementation of new actuarial software.
In valuations prior to 1998, plan assets were determined at market value.As part of the 1998 valuation, this methodology was adjusted to reduce the potential volatility in the market value approach from year to year.The actuarial method smoothes gains and losses over a 5-year period. Investment gains and losses are not fully realized until 5 years have elapsed. Therefore, in some years the actuarial value will be less than the market value, and in other years, it will exceed the market value.
The chart below indicates the UAL, on an actuarial basis, increased from $13.4 billion on 1/05 to $14.5 billion on 1/06. (On a market value basis, the UAL decreased from $12.9 billion on 1/05 to $11.8 billion on 1/06.) From 1998 - 2001, the market value of assets exceeded the actuarial value of assets. Consequently, the unfunded liability on an actuarial value basis was greater than the unfunded liability on a market value basis. From 2002 - 2004, the market
0
$3.0
$6.0
$9.0
$12.0
$15.0
1/061/051/041/031/021/011/001/981/961/951/931/90
$12.2
$11.1
$9.8
$8.4 $7.9
$4.8
COMMONWEALTH UNFUNDED LIABILITY (in billions of dollars)
$6.4
$7.4
$13.4
$12.0
$13.4
$14.5
value of assets was less than the actuarial value of assets and, therefore, the UAL on an actuarial value basis was less than the UAL on a market value basis. In 2005 and in this valuation, the market value of assets once again exceeds the actuarial value of assets (see page 7).
COMMONWEALTH ACTUARIAL VALUATION REPORT | JANUARY 1, 2006 5
2. EXECUTIVE SUMMARY (continued)
PART C | FUNDING PROGRESS (cont inued)
FUNDED RATIO
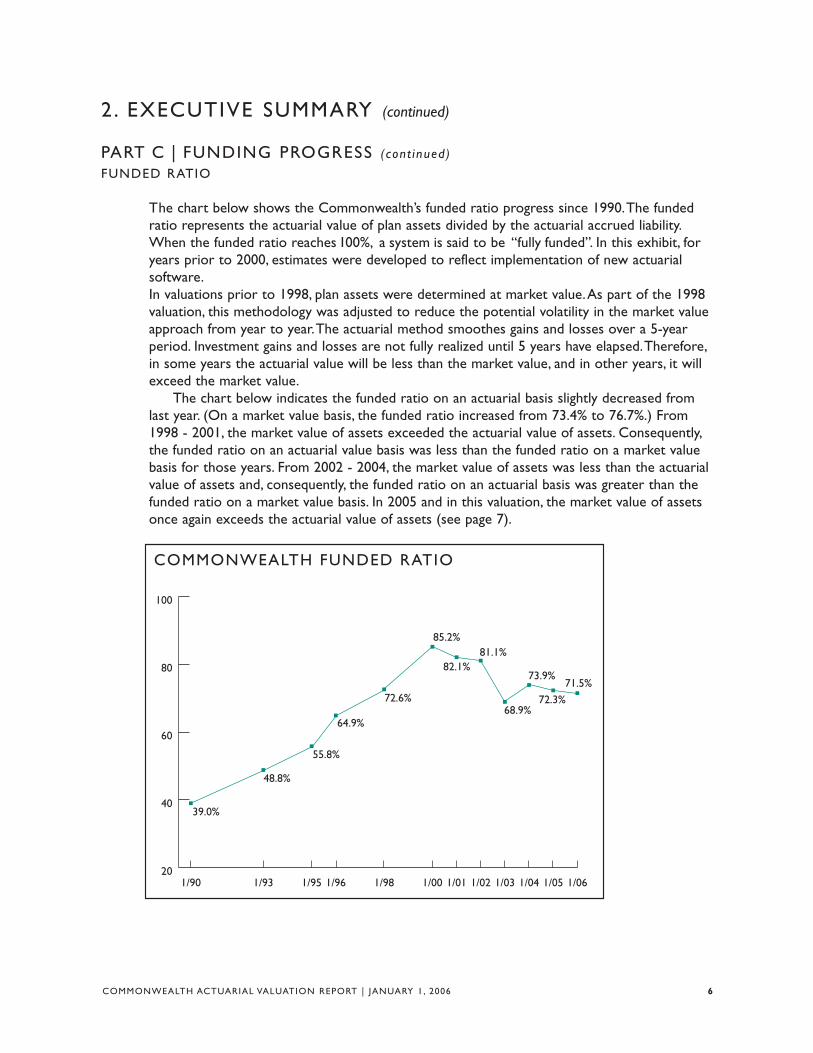
The chart below shows the Commonwealth’s funded ratio progress since 1990.The funded ratio represents the actuarial value of plan assets divided by the actuarial accrued liability. When the funded ratio reaches 100%, a system is said to be “fully funded”. In this exhibit, for years prior to 2000, estimates were developed to reflect implementation of new actuarial software. In valuations prior to 1998, plan assets were determined at market value.As part of the 1998 valuation, this methodology was adjusted to reduce the potential volatility in the market value approach from year to year.The actuarial method smoothes gains and losses over a 5-year period. Investment gains and losses are not fully realized until 5 years have elapsed.Therefore, in some years the actuarial value will be less than the market value, and in other years, it will exceed the market value.
The chart below indicates the funded ratio on an actuarial basis slightly decreased from last year. (On a market value basis, the funded ratio increased from 73.4% to 76.7%.) From 1998 - 2001, the market value of assets exceeded the actuarial value of assets. Consequently, the funded ratio on an actuarial value basis was less than the funded ratio on a market value basis for those years. From 2002 - 2004, the market value of assets was less than the actuarial value of assets and, consequently, the funded ratio on an actuarial basis was greater than the funded ratio on a market value basis. In 2005 and in this valuation, the market value of assets once again exceeds the actuarial value of assets (see page 7).
COMMONWEALTH FUNDED RATIO
20
40
60
80
100
1/061/051/041/031/021/011/001/981/961/951/931/90
39.0%
48.8%
55.8%
64.9%
72.6%
85.2%
82.1% 81.1%
68.9%
73.9%
72.3%
71.5%
COMMONWEALTH ACTUARIAL VALUATION REPORT | JANUARY 1, 2006 6
2. EXECUTIVE SUMMARY (continued)
PART C | FUNDING PROGRESS (cont inued)
COMPARISON OF MARKET AND ACTUARIAL VALUE OF ASSETS
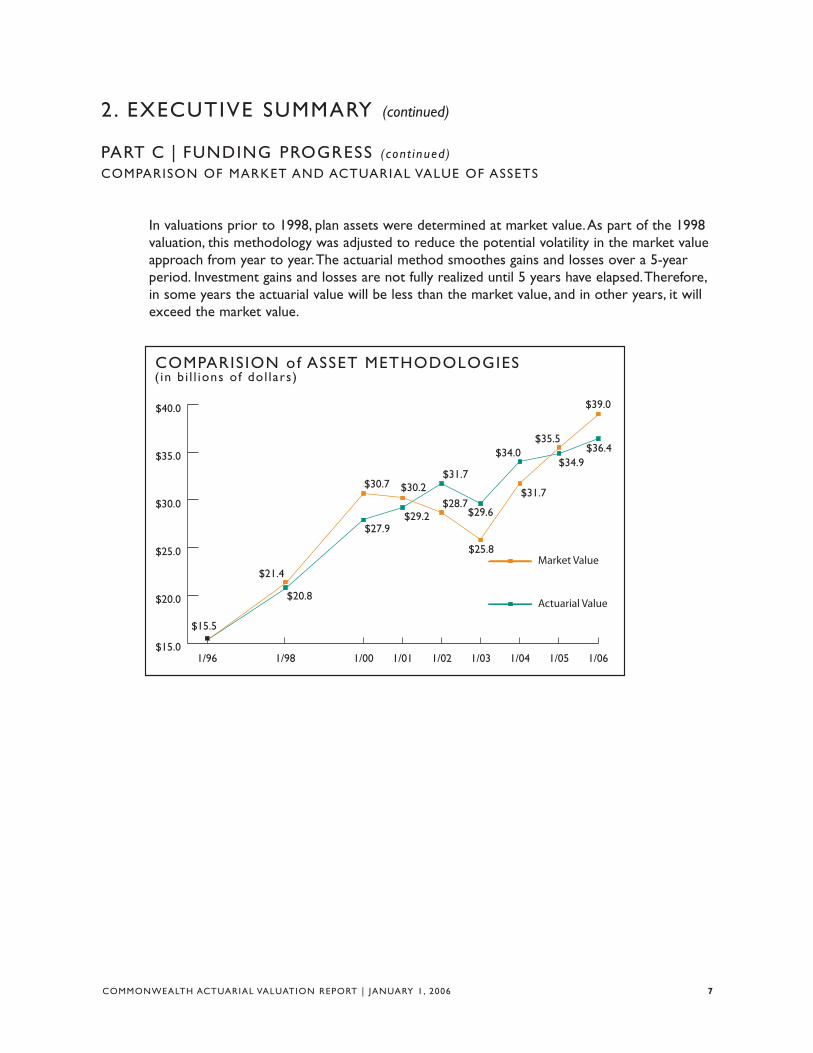
In valuations prior to 1998, plan assets were determined at market value.As part of the 1998 valuation, this methodology was adjusted to reduce the potential volatility in the market value approach from year to year.The actuarial method smoothes gains and losses over a 5-year period. Investment gains and losses are not fully realized until 5 years have elapsed.Therefore, in some years the actuarial value will be less than the market value, and in other years, it will exceed the market value.
COMPARISION of ASSET METHODOLOGIES ( in b i l l ions of dol lars)
$15.0
$20.0
$25.0
$30.0
$35.0
$40.0
1/061/051/041/031/021/011/001/981/96
Market Value
Actuarial Value
$15.5
$20.8
$27.9 $29.2
$31.7
$21.4
$30.7 $30.2 $28.7
$25.8
$29.6
$31.7
$34.0 $34.9
$35.5
$39.0
$36.4
COMMONWEALTH ACTUARIAL VALUATION REPORT | JANUARY 1, 2006 7
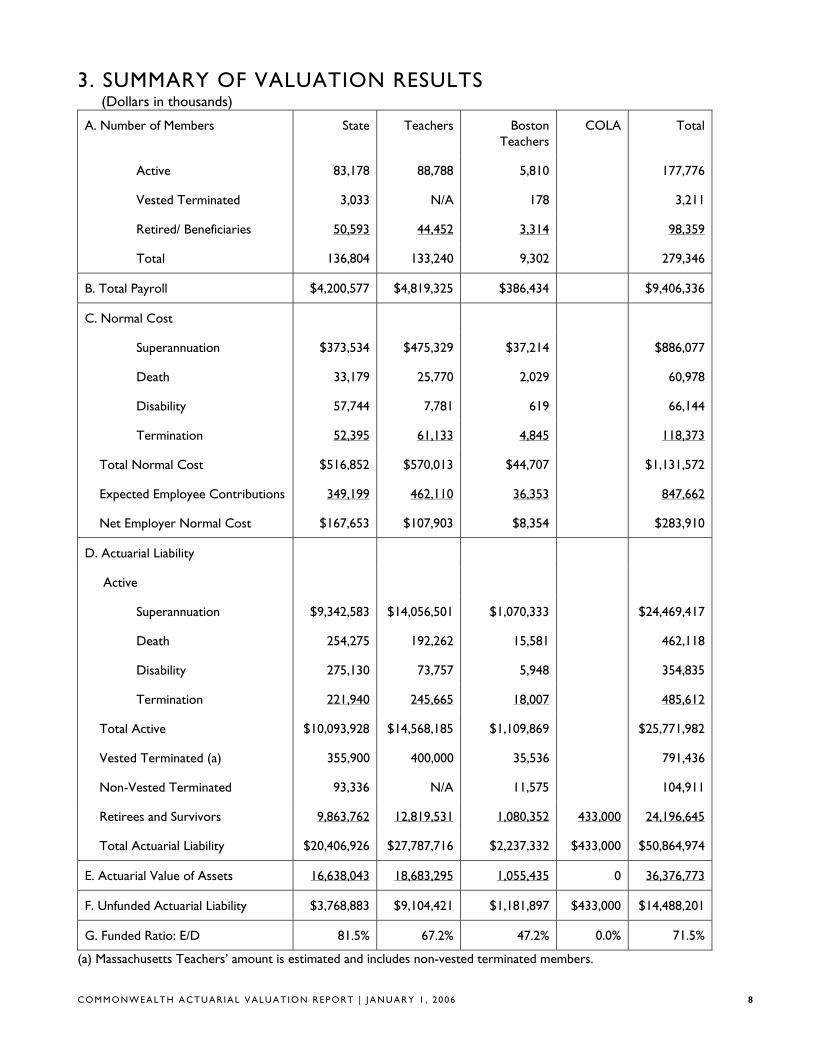
3. SUMMARY OF VALUATION RESULTS (Dollars in thousands)
A. Number of Members State Teachers Boston Teachers
COLA Total
Active 83,178 88,788 5,810 177,776
Vested Terminated 3,033 N/A 178 3,211
Retired/ Beneficiaries 50,593 44,452 3,314 98,359
Total 136,804 133,240 9,302 279,346
B. Total Payroll $4,200,577 $4,819,325 $386,434 $9,406,336
C. Normal Cost
Superannuation $373,534 $475,329 $37,214 $886,077
Death 33,179 25,770 2,029 60,978
Disability 57,744 7,781 619 66,144
Termination 52,395 61,133 4,845 118,373
Total Normal Cost $516,852 $570,013 $44,707 $1,131,572
Expected Employee Contributions 349,199 462,110 36,353 847,662
Net Employer Normal Cost $167,653 $107,903 $8,354 $283,910
D. Actuarial Liability
Active
Superannuation $9,342,583 $14,056,501 $1,070,333 $24,469,417
Death 254,275 192,262 15,581 462,118
Disability 275,130 73,757 5,948 354,835
Termination 221,940 245,665 18,007 485,612
Total Active $10,093,928 $14,568,185 $1,109,869 $25,771,982
Vested Terminated (a) 355,900 400,000 35,536 791,436
Non-Vested Terminated 93,336 N/A 11,575 104,911
Retirees and Survivors 9,863,762 12,819,531 1,080,352 433,000 24,196,645
Total Actuarial Liability $20,406,926 $27,787,716 $2,237,332 $433,000 $50,864,974
E. Actuarial Value of Assets 16,638,043 18,683,295 1,055,435 0 36,376,773
F. Unfunded Actuarial Liability $3,768,883 $9,104,421 $1,181,897 $433,000 $14,488,201
G. Funded Ratio: E/D 81.5% 67.2% 47.2% 0.0% 71.5%
(a) Massachusetts Teachers’ amount is estimated and includes non-vested terminated members.
C O MM O NW E A L T H A C T U A R I A L V AL U A T I O N R EP OR T | J A N U A R Y 1 , 2 0 0 6 8
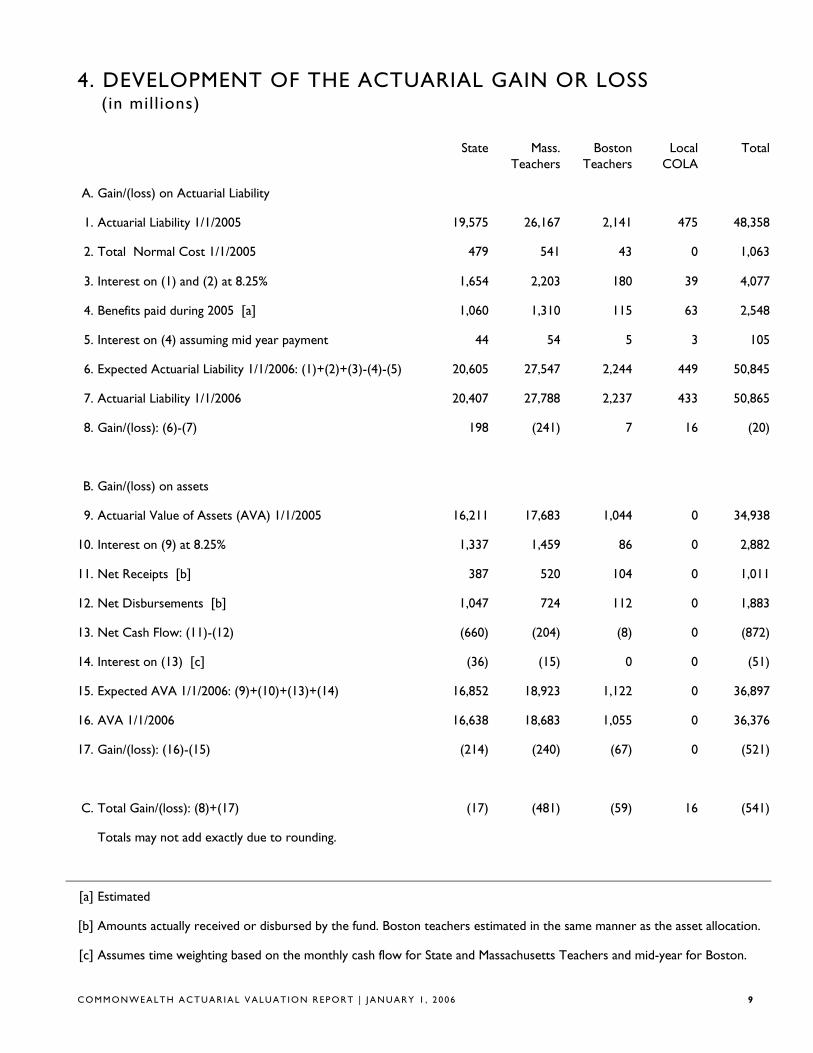
4. DEVELOPMENT OF THE ACTUARIAL GAIN OR LOSS (in mill ions)
State Mass. Boston Local Total Teachers Teachers COLA
A. Gain/(loss) on Actuarial Liability
1. Actuarial Liability 1/1/2005 19,575 26,167 2,141 475 48,358
2. Total Normal Cost 1/1/2005 479 541 43 0 1,063
3. Interest on (1) and (2) at 8.25% 1,654 2,203 180 39 4,077
4. Benefits paid during 2005 [a] 1,060 1,310 115 63 2,548
5. Interest on (4) assuming mid year payment 44 54 5 3 105
6. Expected Actuarial Liability 1/1/2006: (1)+(2)+(3)-(4)-(5) 20,605 27,547 2,244 449 50,845
7. Actuarial Liability 1/1/2006 20,407 27,788 2,237 433 50,865
8. Gain/(loss): (6)-(7) 198 (241) 7 16 (20)
B. Gain/(loss) on assets
9. Actuarial Value of Assets (AVA) 1/1/2005 16,211 17,683 1,044 0 34,938
10. Interest on (9) at 8.25% 1,337 1,459 86 0 2,882
11. Net Receipts [b] 387 520 104 0 1,011
12. Net Disbursements [b] 1,047 724 112 0 1,883
13. Net Cash Flow: (11)-(12) (660) (204) (8) 0 (872)
14. Interest on (13) [c] (36) (15) 0 0 (51)
15. Expected AVA 1/1/2006: (9)+(10)+(13)+(14) 16,852 18,923 1,122 0 36,897
16. AVA 1/1/2006 16,638 18,683 1,055 0 36,376
17. Gain/(loss): (16)-(15) (214) (240) (67) 0 (521)
C. Total Gain/(loss): (8)+(17) (17) (481) (59) 16 (541)
Totals may not add exactly due to rounding.
[a] Estimated
[b] Amounts actually received or disbursed by the fund. Boston teachers estimated in the same manner as the asset allocation.
[c] Assumes time weighting based on the monthly cash flow for State and Massachusetts Teachers and mid-year for Boston.
C O MM O NW E A L T H A C T U A R I A L V AL U A T I O N R EP OR T | J A N U A R Y 1 , 2 0 0 6 9
5. AUDIT INFORMATION
PART A | OVERVIEW
We have included the actuarial information required by GASB Statement No. 27 in this report. The Commonwealth of Massachusetts began implementing Statement No. 27 in Fiscal Year 1996.
Under GASB Statement No. 27, an Annual Required Contribution (ARC) must be calculated each year. The same methods and assumptions that are used to determine funding requirements are used in this calculation. At this time, the methods and assumptions used by the Commonwealth to determine the funding schedule are well within the parameters established by Statement No. 27.
When GASB 27 was implemented in FY96, a Net Pension Obligation (NPO) at transition was calculated. This was essentially the cumulative difference between the employer’s required contributions and the contributions actually made by the employer for all years, beginning with Fiscal Year 1988. In each year since FY96, the NPO has been updated.
As part of this valuation, we brought the NPO forward from FY05 to FY06. For FY06, the amortization cost was determined using a 4.5% increasing amortization to FY23 which is the schedule used by the Commonwealth to amortize its unfunded liability.
Note that, in any year, the amount of the ARC will not equal the Commonwealth’s appropriation amounts for the following reasons:
1. The ARC is based upon the most recent valuation, whereas the funding schedule is generally submitted to the legislature 15 months after the valuation upon which it is based. The funding schedule is then set for the upcoming three fiscal years.
2. Amortization bases of actuarial gains and losses and plan amendments may be amortized on a different basis than the rest of the funding schedule. However, the amortization cost that GASB 27 reflects is an amortization of the entire unfunded liability which is roughly equivalent to the current schedule.
3. Although there is no difference in the totals, contributions have been allocated in a slightly different manner between the State and COLA portions. For purposes of Statement No. 27, a larger contribution was made to COLA, with lesser amounts to the State. This was done so the NPO for the local COLA remains at zero. No assets are attributed to the local COLA.
C O MM O NW E A L T H A C T U A R I A L V AL U A T I O N R EP OR T | J A N U A R Y 1 , 2 0 0 6 10
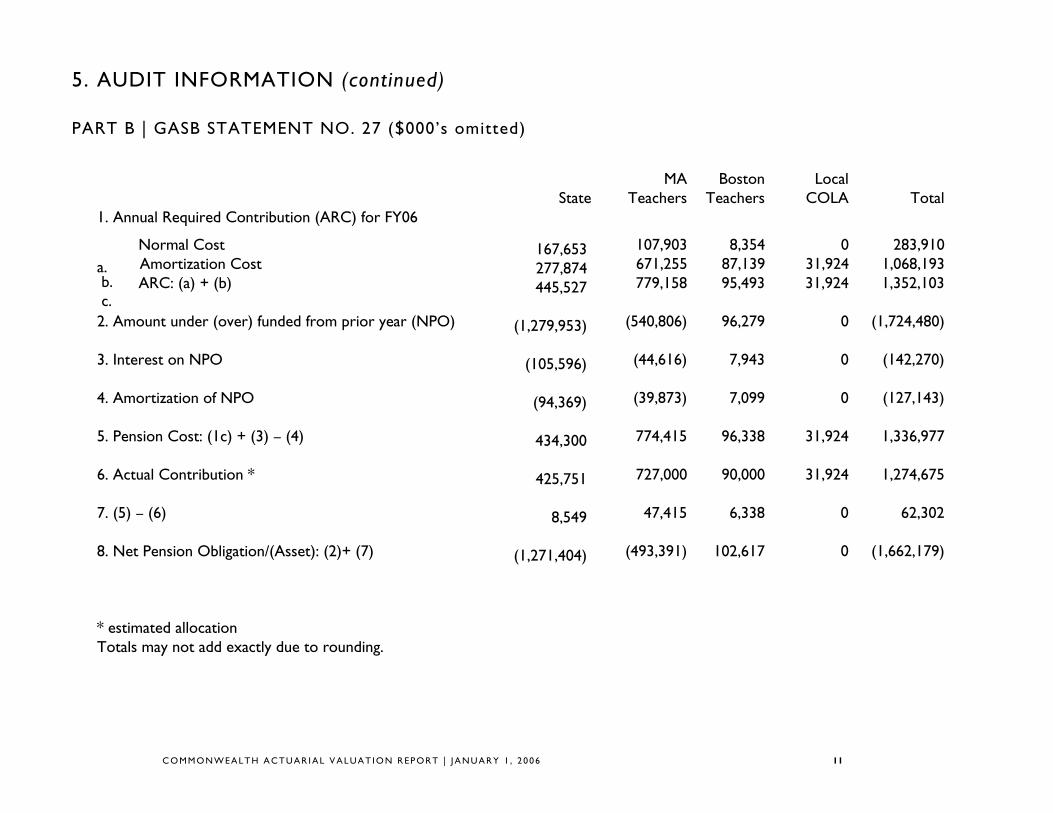
5. AUDIT INFORMATION (continued)
PART B | GASB STATEMENT NO. 27 ($000’s omitted)
MA Boston Local State Teachers Teachers COLA Total
1. Annual Required Contribution (ARC) for FY06
a. Normal Cost 167,653 107,903 8,354 0 283,910
b. Amortization Cost 277,874 671,255 87,139 31,924 1,068,193
c. ARC: (a) + (b) 445,527 779,158 95,493 31,924 1,352,103
2. Amount under (over) funded from prior year (NPO) (1,279,953) (540,806) 96,279 0 (1,724,480)
3. Interest on NPO (105,596) (44,616) 7,943 0 (142,270)
4. Amortization of NPO (94,369) (39,873) 7,099 0 (127,143)
5. Pension Cost: (1c) + (3) – (4) 434,300 774,415 96,338 31,924 1,336,977
6. Actual Contribution * 425,751 727,000 90,000 31,924 1,274,675
7. (5) – (6) 8,549 47,415 6,338 0 62,302
8. Net Pension Obligation/(Asset): (2)+ (7) (1,271,404) (493,391) 102,617 0 (1,662,179)
* estimated allocation Totals may not add exactly due to rounding.
C O MM O NW E A L T H A C T U A R I A L V AL U A T I O N R EP OR T | J A N U A R Y 1 , 2 0 0 6 11
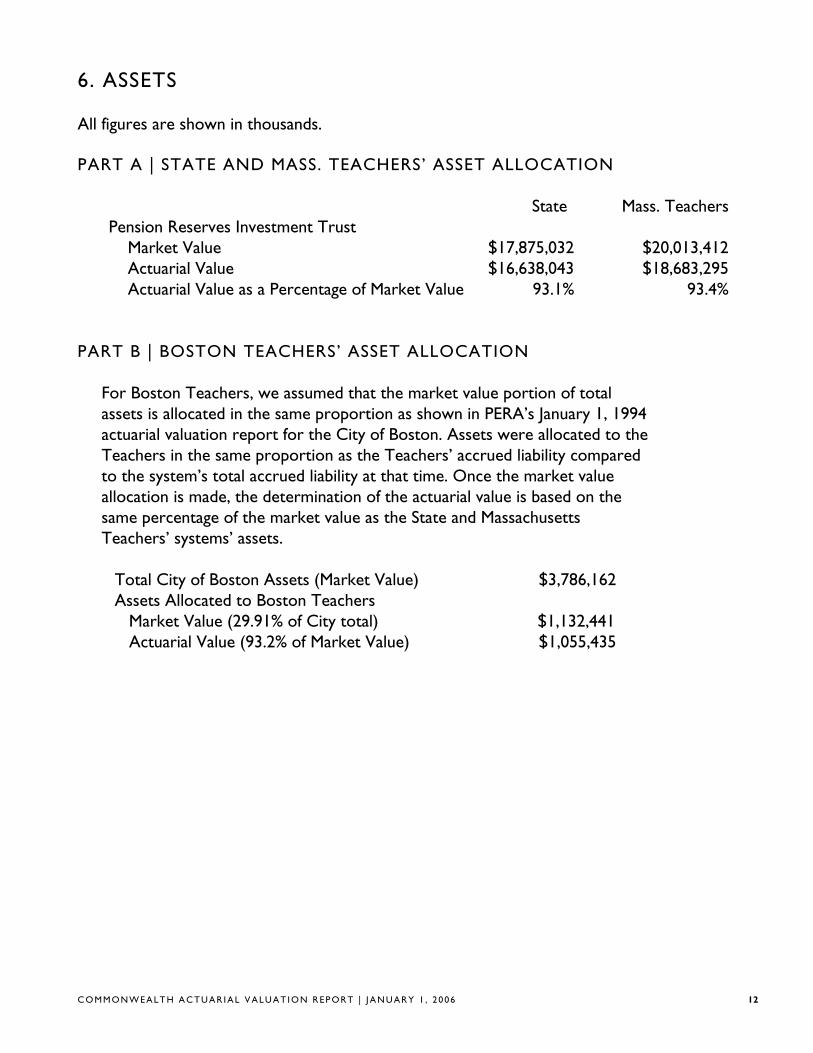
6. ASSETS
All figures are shown in thousands.
PART A | STATE AND MASS. TEACHERS’ ASSET ALLOCATION
State Mass. Teachers Pension Reserves Investment Trust
Market Value $17,875,032 $20,013,412 Actuarial Value $16,638,043 $18,683,295
Actuarial Value as a Percentage of Market Value 93.1% 93.4%
PART B | BOSTON TEACHERS’ ASSET ALLOCATION
For Boston Teachers, we assumed that the market value portion of total assets is allocated in the same proportion as shown in PERA’s January 1, 1994 actuarial valuation report for the City of Boston. Assets were allocated to the Teachers in the same proportion as the Teachers’ accrued liability compared to the system’s total accrued liability at that time. Once the market value allocation is made, the determination of the actuarial value is based on the same percentage of the market value as the State and Massachusetts Teachers’ systems’ assets.
Total City of Boston Assets (Market Value) $3,786,162 Assets Allocated to Boston Teachers
Market Value (29.91% of City total) $1,132,441 Actuarial Value (93.2% of Market Value) $1,055,435
C O MM O NW E A L T H A C T U A R I A L V AL U A T I O N R EP OR T | J A N U A R Y 1 , 2 0 0 6 12
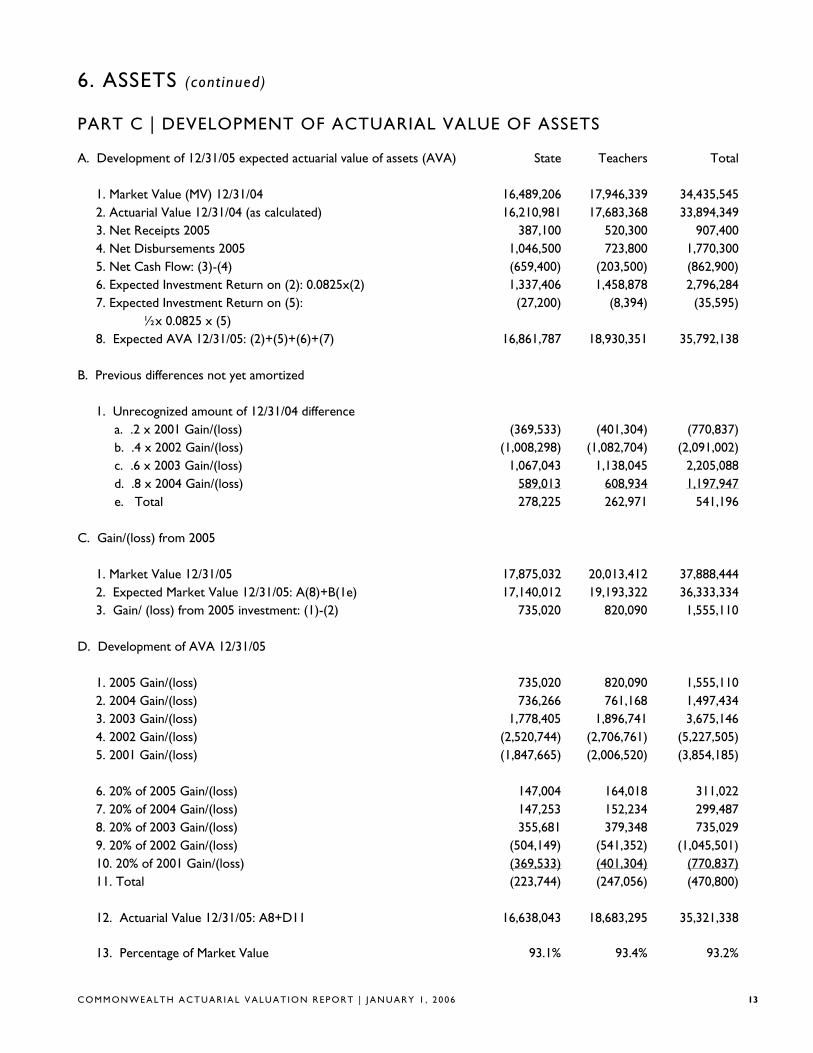
6. ASSETS (cont inued)
PART C | DEVELOPMENT OF ACTUARIAL VALUE OF ASSETS
A. Development of 12/31/05 expected actuarial value of assets (AVA) State Teachers Total
1. Market Value (MV) 12/31/04 16,489,206 17,946,339 34,435,545 2. Actuarial Value 12/31/04 (as calculated) 16,210,981 17,683,368 33,894,349 3. Net Receipts 2005 387,100 520,300 907,400 4. Net Disbursements 2005 1,046,500 723,800 1,770,300 5. Net Cash Flow: (3)-(4) (659,400) (203,500) (862,900) 6. Expected Investment Return on (2): 0.0825x(2) 1,337,406 1,458,878 2,796,284 7. Expected Investment Return on (5): (27,200) (8,394) (35,595)
½x 0.0825 x (5) 8. Expected AVA 12/31/05: (2)+(5)+(6)+(7) 16,861,787 18,930,351 35,792,138
B. Previous differences not yet amortized
1. Unrecognized amount of 12/31/04 difference a. .2 x 2001 Gain/(loss) (369,533) (401,304) (770,837) b. .4 x 2002 Gain/(loss) (1,008,298) (1,082,704) (2,091,002) c. .6 x 2003 Gain/(loss) 1,067,043 1,138,045 2,205,088 d. .8 x 2004 Gain/(loss) 589,013 608,934 1,197,947 e. Total 278,225 262,971 541,196
C. Gain/(loss) from 2005
1. Market Value 12/31/05 17,875,032 20,013,412 37,888,444 2. Expected Market Value 12/31/05: A(8)+B(1e) 17,140,012 19,193,322 36,333,334 3. Gain/ (loss) from 2005 investment: (1)-(2) 735,020 820,090 1,555,110
D. Development of AVA 12/31/05
1. 2005 Gain/(loss) 735,020 820,090 1,555,110 2. 2004 Gain/(loss) 736,266 761,168 1,497,434 3. 2003 Gain/(loss) 1,778,405 1,896,741 3,675,146 4. 2002 Gain/(loss) (2,520,744) (2,706,761) (5,227,505) 5. 2001 Gain/(loss) (1,847,665) (2,006,520) (3,854,185)
6. 20% of 2005 Gain/(loss) 147,004 164,018 311,022 7. 20% of 2004 Gain/(loss) 147,253 152,234 299,487 8. 20% of 2003 Gain/(loss) 355,681 379,348 735,029 9. 20% of 2002 Gain/(loss) (504,149) (541,352) (1,045,501) 10. 20% of 2001 Gain/(loss) (369,533) (401,304) (770,837) 11. Total (223,744) (247,056) (470,800)
12. Actuarial Value 12/31/05: A8+D11 16,638,043 18,683,295 35,321,338
13. Percentage of Market Value 93.1% 93.4% 93.2%
C O MM O NW E A L T H A C T U A R I A L V AL U A T I O N R EP OR T | J A N U A R Y 1 , 2 0 0 6 13
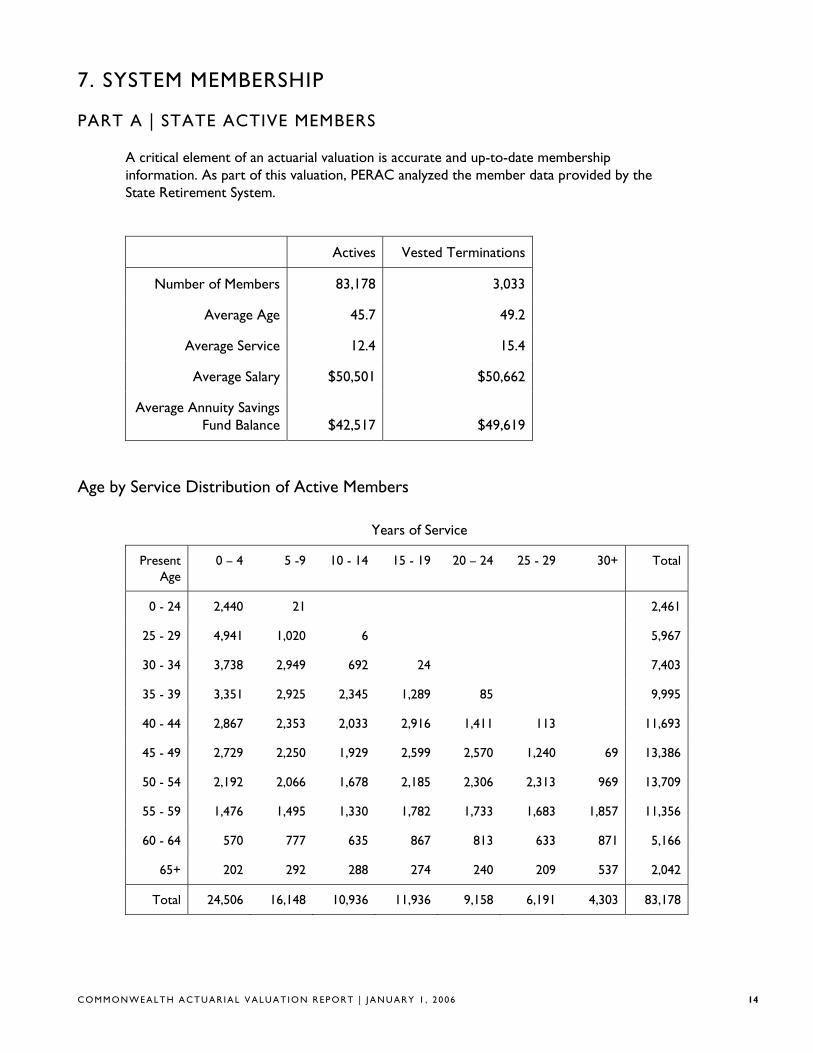
7. SYSTEM MEMBERSHIP
PART A | STATE ACTIVE MEMBERS
A critical element of an actuarial valuation is accurate and up-to-date membership information. As part of this valuation, PERAC analyzed the member data provided by the State Retirement System.
Actives Vested Terminations
Number of Members
Average Age
Average Service
Average Salary
Average Annuity Savings Fund Balance
83,178
45.7
12.4
$50,501
$42,517
3,033
49.2
15.4
$50,662
$49,619
Age by Service Distribution of Active Members
Years of Service
Present Age
0 – 4 5 -9 10 - 14 15 - 19 20 – 24 25 - 29 30+ Total
0 - 24 2,440 21 2,461
25 - 29 4,941 1,020 6 5,967
30 - 34 3,738 2,949 692 24 7,403
35 - 39 3,351 2,925 2,345 1,289 85 9,995
40 - 44 2,867 2,353 2,033 2,916 1,411 113 11,693
45 - 49 2,729 2,250 1,929 2,599 2,570 1,240 69 13,386
50 - 54 2,192 2,066 1,678 2,185 2,306 2,313 969 13,709
55 - 59 1,476 1,495 1,330 1,782 1,733 1,683 1,857 11,356
60 - 64 570 777 635 867 813 633 871 5,166
65+ 202 292 288 274 240 209 537 2,042
Total 24,506 16,148 10,936 11,936 9,158 6,191 4,303 83,178
C O MM O NW E A L T H A C T U A R I A L V AL U A T I O N R EP OR T | J A N U A R Y 1 , 2 0 0 6 14
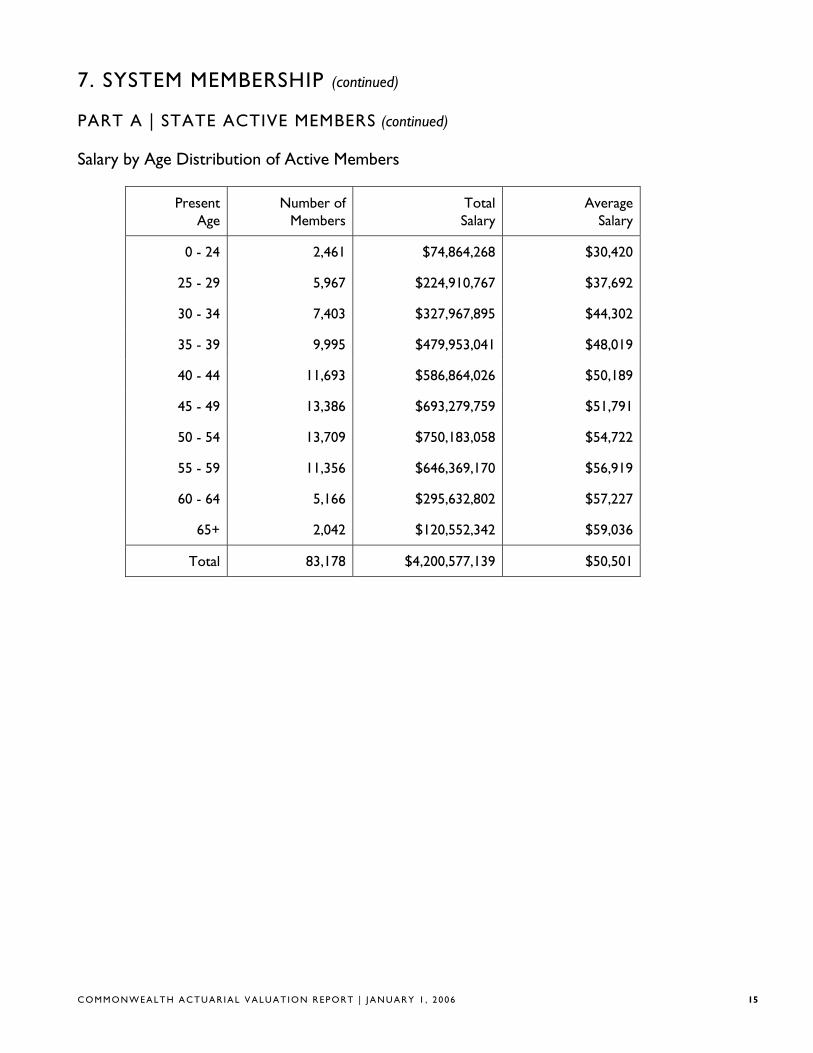
7. SYSTEM MEMBERSHIP (continued)
PART A | STATE ACTIVE MEMBERS (continued)
Salary by Age Distribution of Active Members
Present Number of Total Average Age Members Salary Salary
0 - 24 2,461 $74,864,268 $30,420
25 - 29 5,967 $224,910,767 $37,692
30 - 34 7,403 $327,967,895 $44,302
35 - 39 9,995 $479,953,041 $48,019
40 - 44 11,693 $586,864,026 $50,189
45 - 49 13,386 $693,279,759 $51,791
50 - 54 13,709 $750,183,058 $54,722
55 - 59 11,356 $646,369,170 $56,919
60 - 64 5,166 $295,632,802 $57,227
65+ 2,042 $120,552,342 $59,036
Total 83,178 $4,200,577,139 $50,501
C O MM O NW E A L T H A C T U A R I A L V AL U A T I O N R EP OR T | J A N U A R Y 1 , 2 0 0 6 15
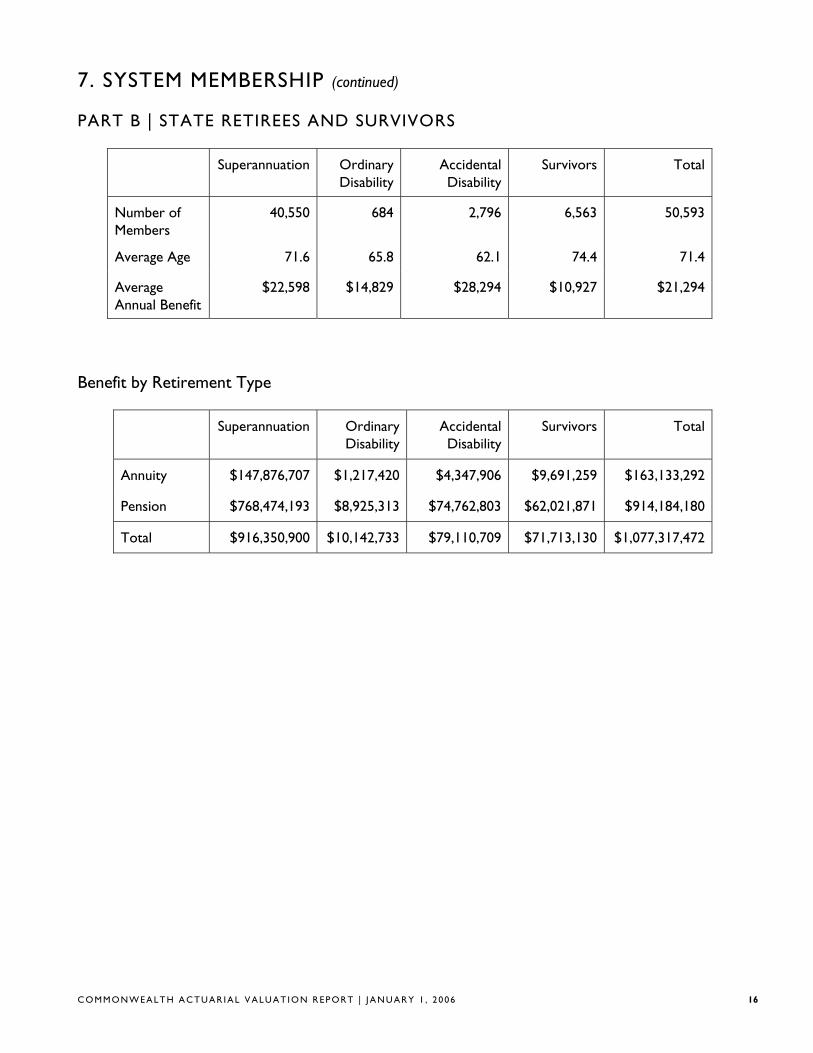
7. SYSTEM MEMBERSHIP (continued)
PART B | STATE RETIREES AND SURVIVORS
Superannuation Ordinary Disability
Accidental Disability
Survivors Total
Number of Members
Average Age
Average Annual Benefit
40,550
71.6
$22,598
684
65.8
$14,829
2,796
62.1
$28,294
6,563
74.4
$10,927
50,593
71.4
$21,294
Benefit by Retirement Type
Superannuation Ordinary Disability
Accidental Disability
Survivors Total
Annuity
Pension
$147,876,707
$768,474,193
$1,217,420
$8,925,313
$4,347,906
$74,762,803
$9,691,259
$62,021,871
$163,133,292
$914,184,180
Total $916,350,900 $10,142,733 $79,110,709 $71,713,130 $1,077,317,472
C O MM O NW E A L T H A C T U A R I A L V AL U A T I O N R EP OR T | J A N U A R Y 1 , 2 0 0 6 16
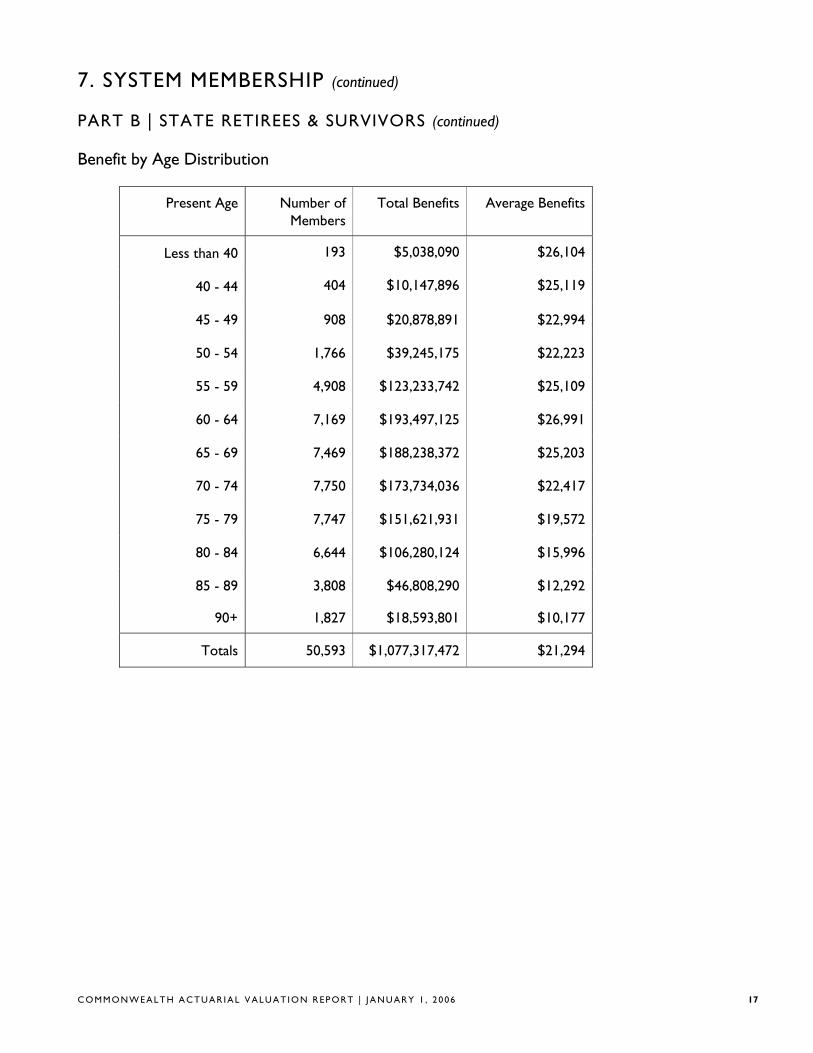
7. SYSTEM MEMBERSHIP (continued)
PART B | STATE RETIREES & SURVIVORS (continued)
Benefit by Age Distribution
Present Age Number of Members
Total Benefits Average Benefits
Less than 40 193 $5,038,090 $26,104
40 - 44 404 $10,147,896 $25,119
45 - 49 908 $20,878,891 $22,994
50 - 54 1,766 $39,245,175 $22,223
55 - 59 4,908 $123,233,742 $25,109
60 - 64 7,169 $193,497,125 $26,991
65 - 69 7,469 $188,238,372 $25,203
70 - 74 7,750 $173,734,036 $22,417
75 - 79 7,747 $151,621,931 $19,572
80 - 84 6,644 $106,280,124 $15,996
85 - 89 3,808 $46,808,290 $12,292
90+ 1,827 $18,593,801 $10,177
Totals 50,593 $1,077,317,472 $21,294
C O MM O NW E A L T H A C T U A R I A L V AL U A T I O N R EP OR T | J A N U A R Y 1 , 2 0 0 6 17
7. SYSTEM MEMBERSHIP (continued)
PART C | MASSACHUSETTS TEACHERS’ ACTIVE MEMBERS
A critical element of an actuarial valuation is accurate and up-to-date membership information. As part of this valuation, PERAC analyzed the member data provided by the Massachusetts Teachers’ Retirement System (TRS). We made several assumptions about missing, questionable, or unavailable data.
For a number of years, we have estimated the total creditable service for each member for the actuarial valuation. The estimate was based on either the employment date (date of hire as a teacher) or the adjusted employment date and was set equal to the greater of the two calculated service amounts. We used this methodology, which we believed was conservative, because we had no way to assess additional costs for members who buy back service near retirement. Earlier this year, with the help of the TRS, we compared the service estimated for valuation purposes with actual service for over 6,800 members who retired in 2004 and 2005. We found that, in total, our methodology slightly understated service. To better reflect this cost, we adjusted our normal cost and liability figures as of January 1, 2006. We used a 1% loading factor based on our analysis.
For members with a date of birth and/or date of hire that seemed questionable, we assumed (based on credited service or date of birth) the member was hired at age 30 (or at a younger age, if the member was under 30).
In past valuations, TRS expressed more confidence in the accuracy of the annuity savings fund (ASF) contributions than the salary data provided to us. Therefore, we estimated salaries based on the employee contribution rate and the ASF contributions. An improved methodology was developed to provide salary data to us this year. However, the reported salary in the original data provided to us was overstated for members who had a reported date in 2005 in the “status date” field. The salary data provided this year was generally accurate (reported salary reconciled with estimated salary based on ASF contributions and employee contribution rate) with the status date exception. We estimated salaries as in past years for members with a reported status date in 2005.
Based on our experience with prior years’ data and buyback issues, we made several adjustments. Members whose pay was less than $5,000 were assumed to be inactive. For members with pay between $5,000 and $10,000, we used an estimated pay of $20,000. For members with calculated pay over $150,000, we compared this year’s figure to the pay used in last year’s valuation. We adjusted this year’s figure if we believed it was overstated.
Pay for all members hired in 2005 was annualized. We assumed a rate of pay of $50,000 for members hired after October 1.
Because we could not determine the number of vested terminations, we estimated a combined inactive (terminated vested plus terminated with an ASF balance) liability. This is the same methodology we used in prior years.
C O MM O NW E A L T H A C T U A R I A L V AL U A T I O N R EP OR T | J A N U A R Y 1 , 2 0 0 6 18
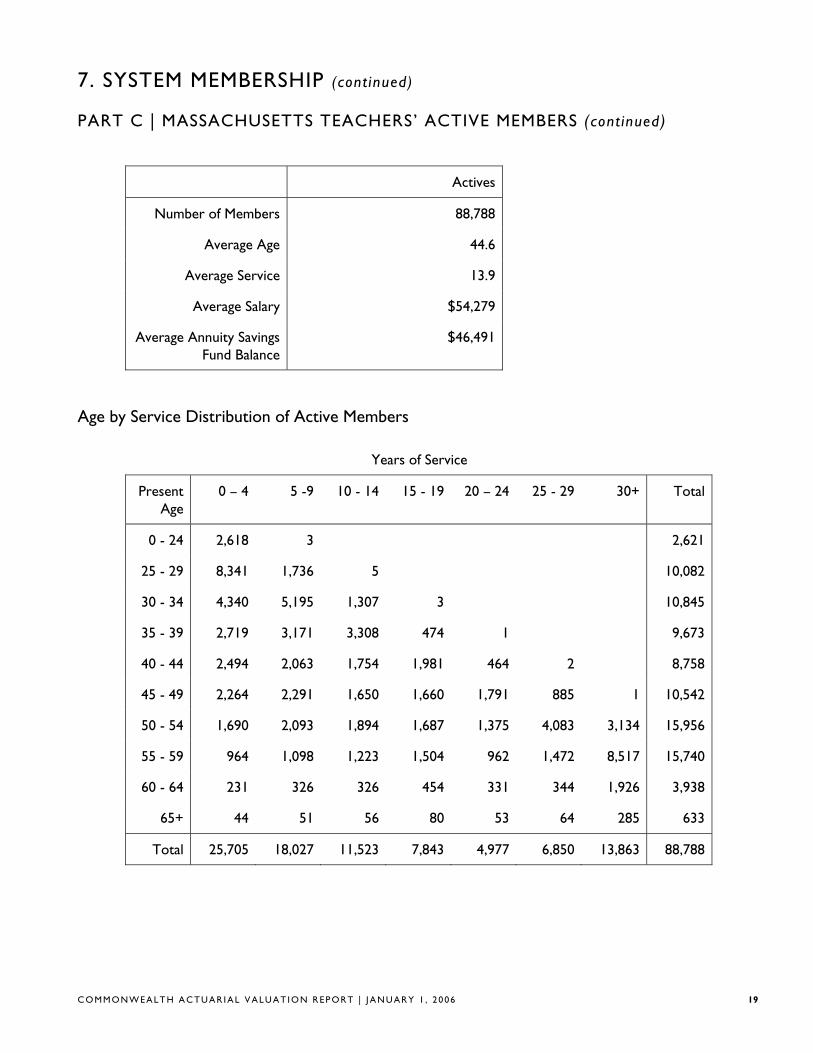
7. SYSTEM MEMBERSHIP (continued)
PART C | MASSACHUSETTS TEACHERS’ ACTIVE MEMBERS (cont inued)
Actives
Number of Members
Average Age
Average Service
Average Salary
Average Annuity Savings Fund Balance
88,788
44.6
13.9
$54,279
$46,491
Age by Service Distribution of Active Members
Years of Service
Present Age
0 – 4 5 -9 10 - 14 15 - 19 20 – 24 25 - 29 30+ Total
0 - 24 2,618 3 2,621
25 - 29 8,341 1,736 5 10,082
30 - 34 4,340 5,195 1,307 3 10,845
35 - 39 2,719 3,171 3,308 474 1 9,673
40 - 44 2,494 2,063 1,754 1,981 464 2 8,758
45 - 49 2,264 2,291 1,650 1,660 1,791 885 1 10,542
50 - 54 1,690 2,093 1,894 1,687 1,375 4,083 3,134 15,956
55 - 59 964 1,098 1,223 1,504 962 1,472 8,517 15,740
60 - 64 231 326 326 454 331 344 1,926 3,938
65+ 44 51 56 80 53 64 285 633
Total 25,705 18,027 11,523 7,843 4,977 6,850 13,863 88,788
C O MM O NW E A L T H A C T U A R I A L V AL U A T I O N R EP OR T | J A N U A R Y 1 , 2 0 0 6 19
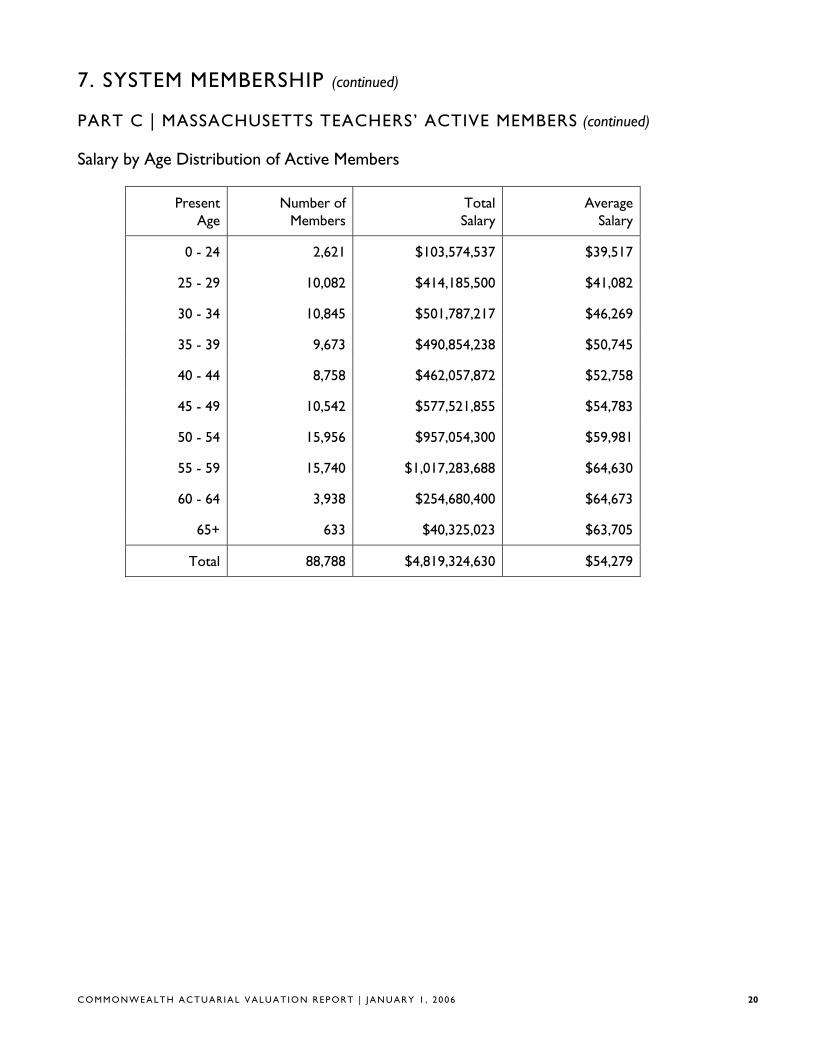
7. SYSTEM MEMBERSHIP (continued)
PART C | MASSACHUSETTS TEACHERS’ ACTIVE MEMBERS (continued)
Salary by Age Distribution of Active Members
Present Number of Total Average Age Members Salary Salary
0 - 24 2,621 $103,574,537 $39,517
25 - 29 10,082 $414,185,500 $41,082
30 - 34 10,845 $501,787,217 $46,269
35 - 39 9,673 $490,854,238 $50,745
40 - 44 8,758 $462,057,872 $52,758
45 - 49 10,542 $577,521,855 $54,783
50 - 54 15,956 $957,054,300 $59,981
55 - 59 15,740 $1,017,283,688 $64,630
60 - 64 3,938 $254,680,400 $64,673
65+ 633 $40,325,023 $63,705
Total 88,788 $4,819,324,630 $54,279
C O MM O NW E A L T H A C T U A R I A L V AL U A T I O N R EP OR T | J A N U A R Y 1 , 2 0 0 6 20
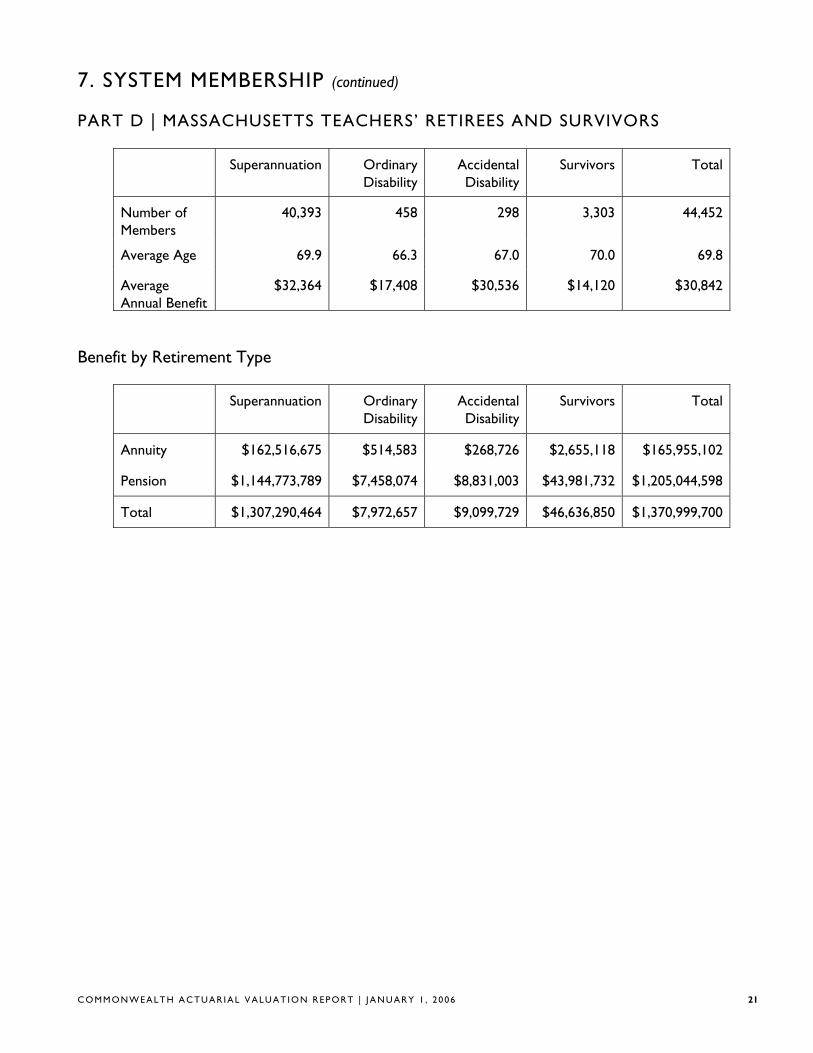
7. SYSTEM MEMBERSHIP (continued)
PART D | MASSACHUSETTS TEACHERS’ RETIREES AND SURVIVORS
Superannuation Ordinary Disability
Accidental Disability
Survivors Total
Number of Members
Average Age
Average Annual Benefit
40,393
69.9
$32,364
458
66.3
$17,408
298
67.0
$30,536
3,303
70.0
$14,120
44,452
69.8
$30,842
Benefit by Retirement Type
Superannuation Ordinary Disability
Accidental Disability
Survivors Total
Annuity
Pension
$162,516,675
$1,144,773,789
$514,583
$7,458,074
$268,726
$8,831,003
$2,655,118
$43,981,732
$165,955,102
$1,205,044,598
Total $1,307,290,464 $7,972,657 $9,099,729 $46,636,850 $1,370,999,700
C O MM O NW E A L T H A C T U A R I A L V AL U A T I O N R EP OR T | J A N U A R Y 1 , 2 0 0 6 21
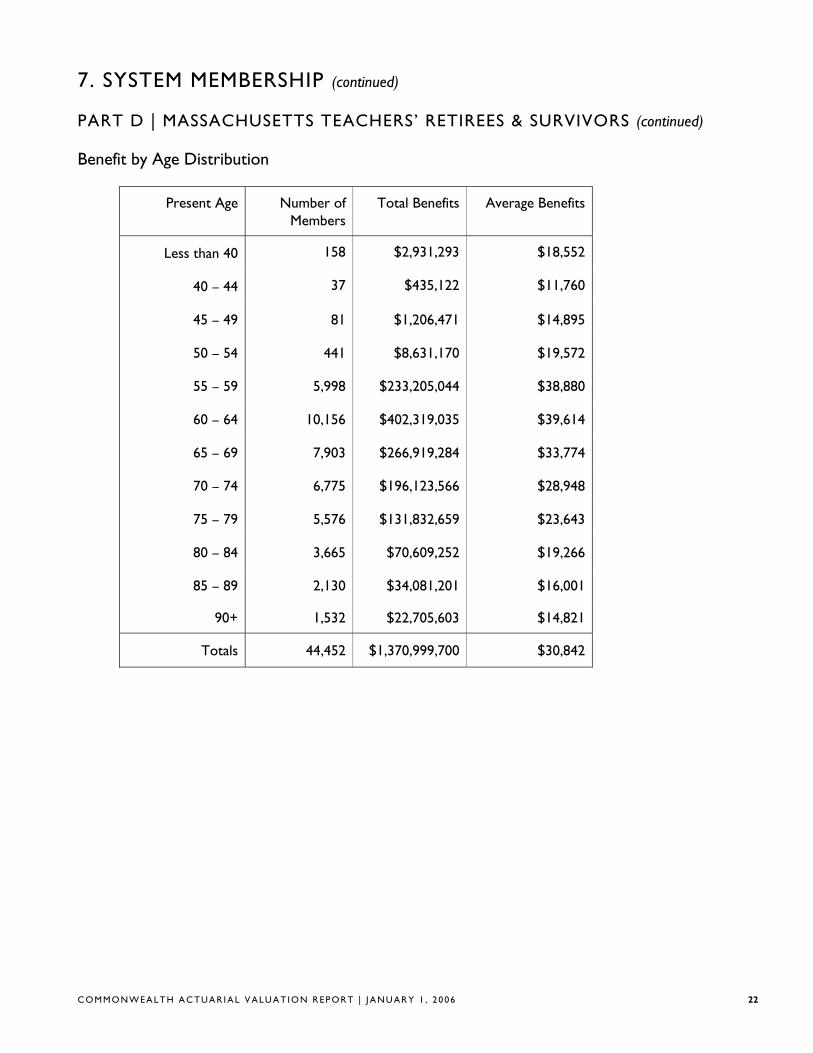
7. SYSTEM MEMBERSHIP (continued)
PART D | MASSACHUSETTS TEACHERS’ RETIREES & SURVIVORS (continued)
Benefit by Age Distribution
Present Age Number of Members
Total Benefits Average Benefits
Less than 40 158 $2,931,293 $18,552
40 – 44 37 $435,122 $11,760
45 – 49 81 $1,206,471 $14,895
50 – 54 441 $8,631,170 $19,572
55 – 59 5,998 $233,205,044 $38,880
60 – 64 10,156 $402,319,035 $39,614
65 – 69 7,903 $266,919,284 $33,774
70 – 74 6,775 $196,123,566 $28,948
75 – 79 5,576 $131,832,659 $23,643
80 – 84 3,665 $70,609,252 $19,266
85 – 89 2,130 $34,081,201 $16,001
90+ 1,532 $22,705,603 $14,821
Totals 44,452 $1,370,999,700 $30,842
C O MM O NW E A L T H A C T U A R I A L V AL U A T I O N R EP OR T | J A N U A R Y 1 , 2 0 0 6 22
7. SYSTEM MEMBERSHIP (continued)
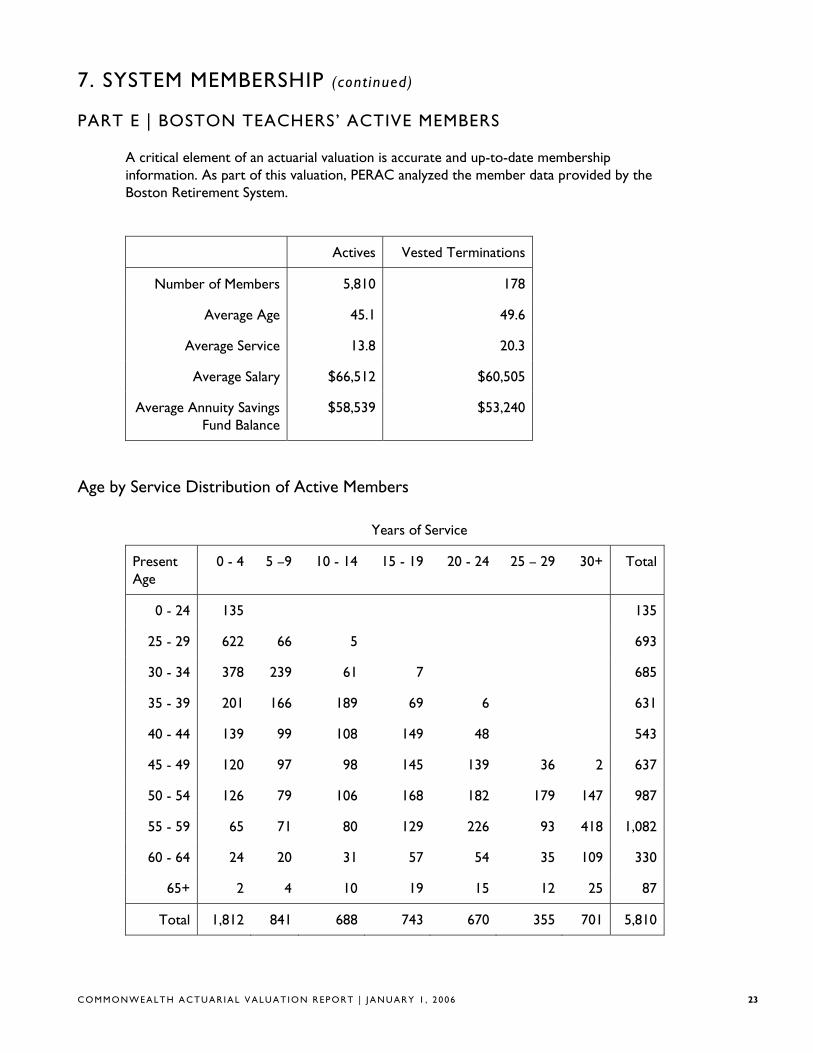
PART E | BOSTON TEACHERS’ ACTIVE MEMBERS
A critical element of an actuarial valuation is accurate and up-to-date membership information. As part of this valuation, PERAC analyzed the member data provided by the Boston Retirement System.
Actives Vested Terminations
Number of Members
Average Age
Average Service
Average Salary
Average Annuity Savings Fund Balance
5,810
45.1
13.8
$66,512
$58,539
178
49.6
20.3
$60,505
$53,240
Age by Service Distribution of Active Members
Years of Service
Present Age
0 - 4 5 –9 10 - 14 15 - 19 20 - 24 25 – 29 30+ Total
0 - 24 135 135
25 - 29 622 66 5 693
30 - 34 378 239 61 7 685
35 - 39 201 166 189 69 6 631
40 - 44 139 99 108 149 48 543
45 - 49 120 97 98 145 139 36 2 637
50 - 54 126 79 106 168 182 179 147 987
55 - 59 65 71 80 129 226 93 418 1,082
60 - 64 24 20 31 57 54 35 109 330
65+ 2 4 10 19 15 12 25 87
Total 1,812 841 688 743 670 355 701 5,810
C O MM O NW E A L T H A C T U A R I A L V AL U A T I O N R EP OR T | J A N U A R Y 1 , 2 0 0 6 23
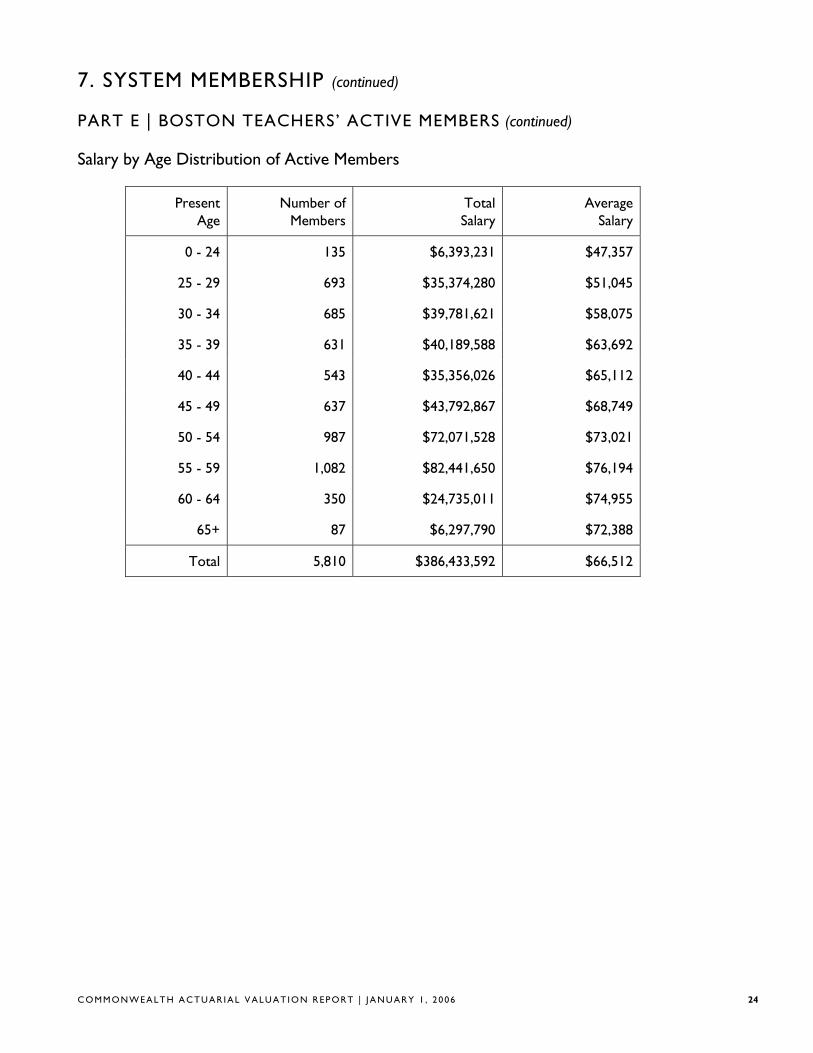
7. SYSTEM MEMBERSHIP (continued)
PART E | BOSTON TEACHERS’ ACTIVE MEMBERS (continued)
Salary by Age Distribution of Active Members
Present Number of Total Average Age Members Salary Salary
0 - 24 135 $6,393,231 $47,357
25 - 29 693 $35,374,280 $51,045
30 - 34 685 $39,781,621 $58,075
35 - 39 631 $40,189,588 $63,692
40 - 44 543 $35,356,026 $65,112
45 - 49 637 $43,792,867 $68,749
50 - 54 987 $72,071,528 $73,021
55 - 59 1,082 $82,441,650 $76,194
60 - 64 350 $24,735,011 $74,955
65+ 87 $6,297,790 $72,388
Total 5,810 $386,433,592 $66,512
C O MM O NW E A L T H A C T U A R I A L V AL U A T I O N R EP OR T | J A N U A R Y 1 , 2 0 0 6 24
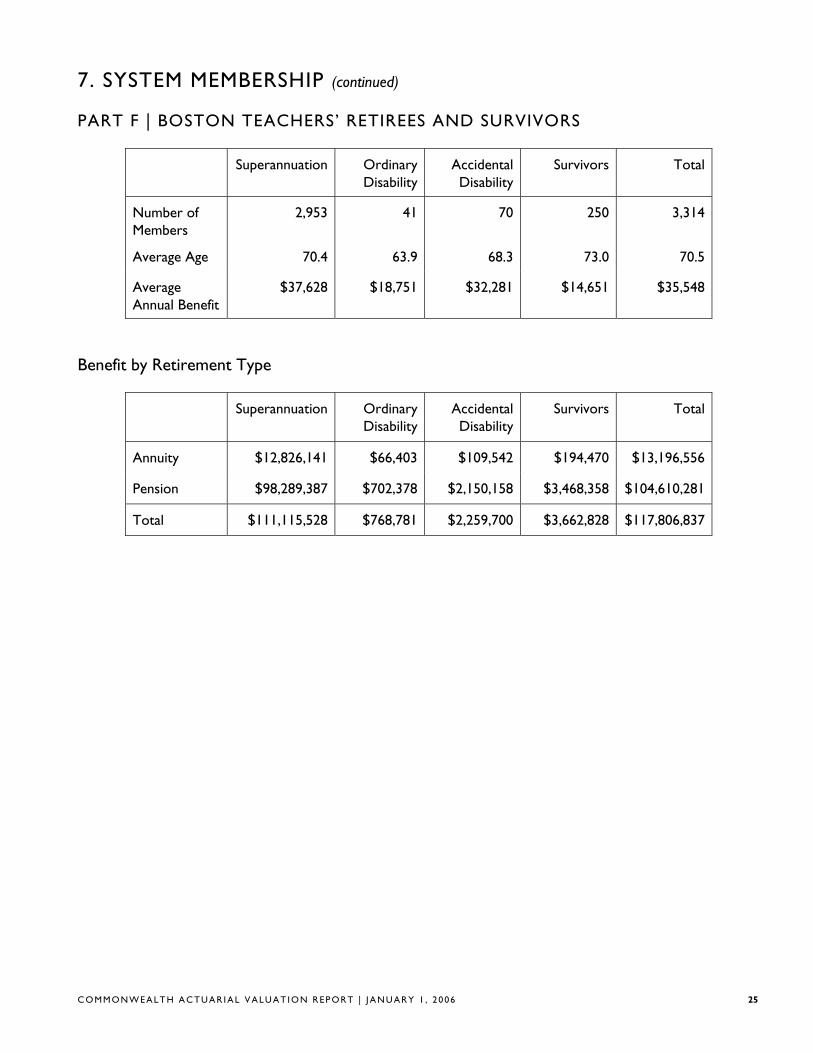
7. SYSTEM MEMBERSHIP (continued)
PART F | BOSTON TEACHERS’ RETIREES AND SURVIVORS
Superannuation Ordinary Disability
Accidental Disability
Survivors Total
Number of Members
Average Age
Average Annual Benefit
2,953
70.4
$37,628
41
63.9
$18,751
70
68.3
$32,281
250
73.0
$14,651
3,314
70.5
$35,548
Benefit by Retirement Type
Superannuation Ordinary Disability
Accidental Disability
Survivors Total
Annuity
Pension
$12,826,141
$98,289,387
$66,403
$702,378
$109,542
$2,150,158
$194,470
$3,468,358
$13,196,556
$104,610,281
Total $111,115,528 $768,781 $2,259,700 $3,662,828 $117,806,837
C O MM O NW E A L T H A C T U A R I A L V AL U A T I O N R EP OR T | J A N U A R Y 1 , 2 0 0 6 25
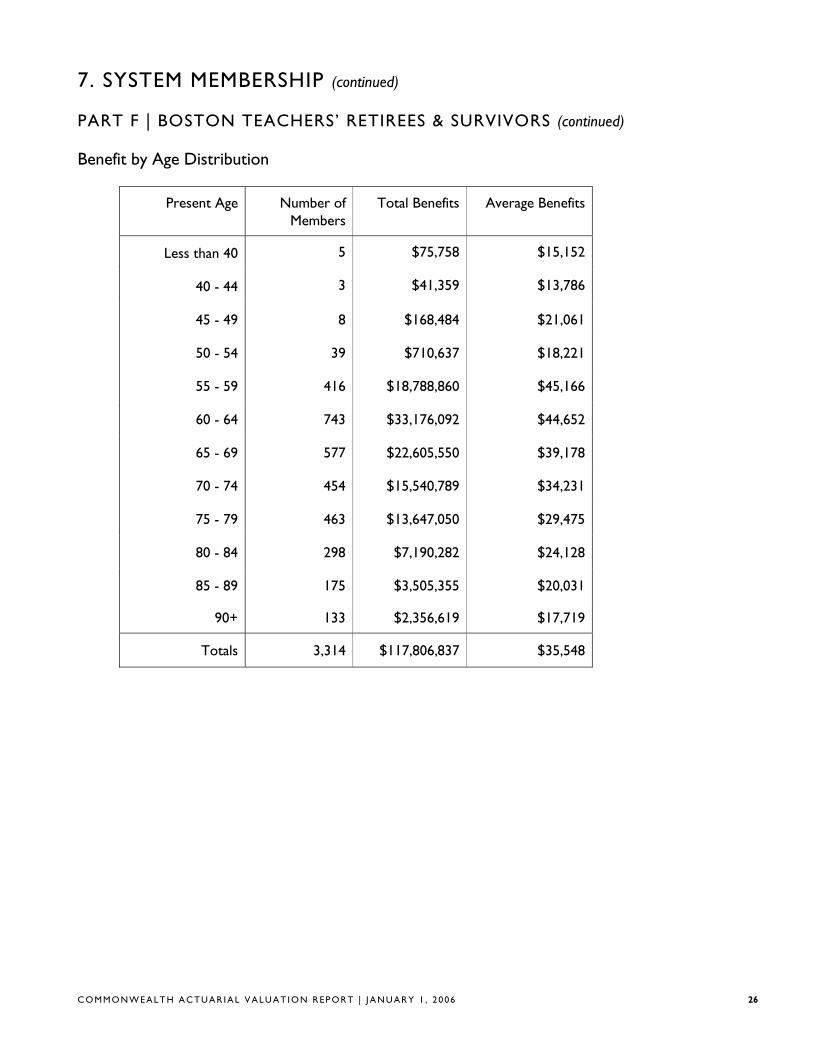
7. SYSTEM MEMBERSHIP (continued)
PART F | BOSTON TEACHERS’ RETIREES & SURVIVORS (continued)
Benefit by Age Distribution
Present Age Number of Members
Total Benefits Average Benefits
Less than 40 5 $75,758 $15,152
40 - 44 3 $41,359 $13,786
45 - 49 8 $168,484 $21,061
50 - 54 39 $710,637 $18,221
55 - 59 416 $18,788,860 $45,166
60 - 64 743 $33,176,092 $44,652
65 - 69 577 $22,605,550 $39,178
70 - 74 454 $15,540,789 $34,231
75 - 79 463 $13,647,050 $29,475
80 - 84 298 $7,190,282 $24,128
85 - 89 175 $3,505,355 $20,031
90+ 133 $2,356,619 $17,719
Totals 3,314 $117,806,837 $35,548
C O MM O NW E A L T H A C T U A R I A L V AL U A T I O N R EP OR T | J A N U A R Y 1 , 2 0 0 6 26
8. VALUATION COST METHODS
PART A | ACTUARIAL COST METHOD
The Actuarial Cost Method which was used to determine pension liabilities in this valuation is known as the Entry Age Normal Cost Method. Under this method, the Normal Cost for each active member on the valuation date is determined as the level percent of salary, which, if paid annually from the date the employee first became a retirement system member, would fully fund by retirement, death, disability or termination, the projected benefits which the member is expected to receive. The Actuarial Liability for each member is determined as the present value as of the valuation date of all projected benefits which the member is expected to receive, minus the present value of future annual Normal Cost payments expected to be made to the fund. Since only active members have a Normal Cost, the Actuarial Liability for inactives, retirees, and survivors is simply equal to the present value of all projected benefits. The Unfunded Actuarial Liability is the Actuarial Liability less current assets.
The Normal Cost for a member will remain a level percent of salary for each year of membership, except for changes in provisions of the Plan or the actuarial assumptions employed in projection of benefits and present value determinations. The Normal Cost for the entire system will also be changed by the addition of new members or the retirement, death, disability, or termination of members. The Actuarial Liability for a member will increase each year to reflect the additional accrual of Normal Cost. It will also change if the Plan provisions or actuarial assumptions change.
Differences each year between the actual experience of the Plan and the experience projected by the actuarial assumptions are reflected by adjustments to the Unfunded Actuarial Liability. An experience difference which increases the Unfunded Actuarial Liability is an Actuarial Loss and one which decreases the Unfunded Actuarial Liability is an Actuarial Gain.
PART B | ASSET VALUATION METHOD
The actuarial value of assets is determined in accordance with the deferred recognition method under which 20% of the gains or losses occurring in the prior year are recognized, 40% of those occurring 2 years ago, etc., so that 100% of gains and losses occurring 5 years ago are recognized. The actuarial value of assets will be adjusted, if necessary, in order to remain between 85% and 115% of market value.
In valuations prior to 1998, plan assets were determined at market value. As part of the 1998 valuation, this methodology was adjusted to reduce the potential volatility in the market value approach from year to year. The actuarial value of assets as of January 1, 2006 is approximately 93.2% of the market value.
C O MM O NW E A L T H A C T U A R I A L V AL U A T I O N R EP OR T | J A N U A R Y 1 , 2 0 0 6 27
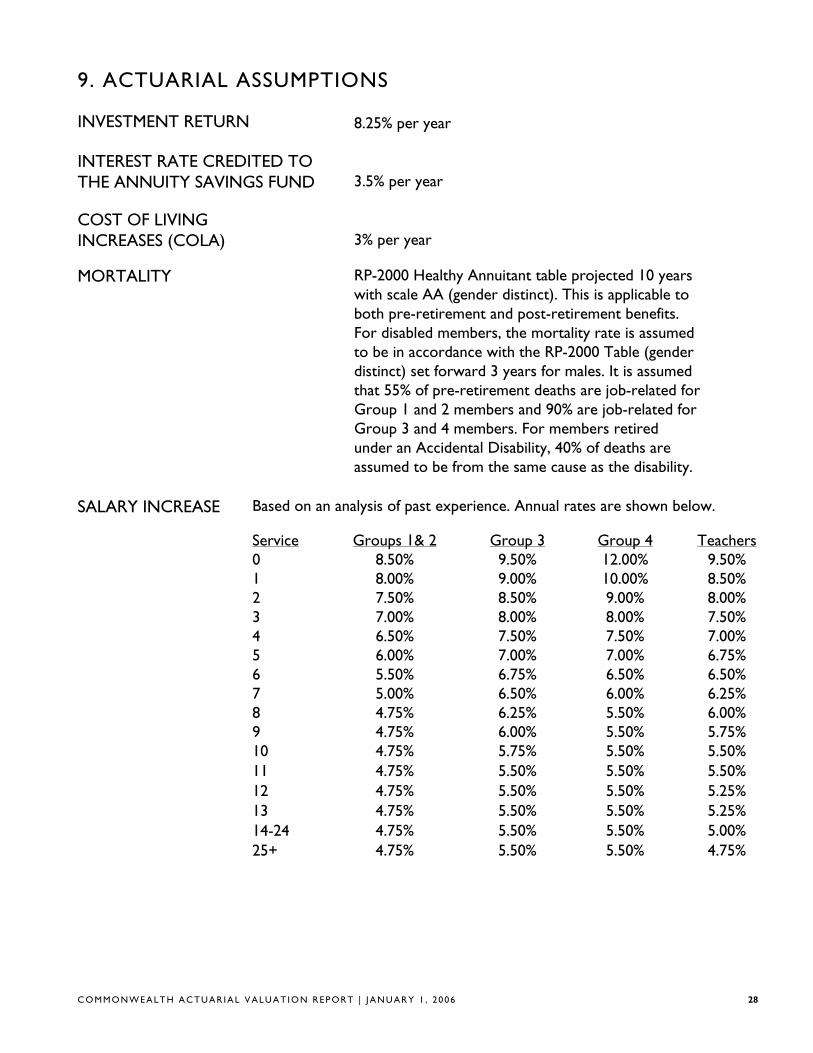
9. ACTUARIAL ASSUMPTIONS
INVESTMENT RETURN 8.25% per year
INTEREST RATE CREDITED TO THE ANNUITY SAVINGS FUND 3.5% per year
COST OF LIVING INCREASES (COLA) 3% per year
MORTALITY RP-2000 Healthy Annuitant table projected 10 years with scale AA (gender distinct). This is applicable to both pre-retirement and post-retirement benefits. For disabled members, the mortality rate is assumed to be in accordance with the RP-2000 Table (gender distinct) set forward 3 years for males. It is assumed that 55% of pre-retirement deaths are job-related for Group 1 and 2 members and 90% are job-related for Group 3 and 4 members. For members retired under an Accidental Disability, 40% of deaths are assumed to be from the same cause as the disability.
SALARY INCREASE Based on an analysis of past experience. Annual rates are shown below.
Service Groups 1& 2 Group 3 Group 4 Teachers 0 8.50% 9.50% 12.00% 9.50% 1 8.00% 9.00% 10.00% 8.50% 2 7.50% 8.50% 9.00% 8.00% 3 7.00% 8.00% 8.00% 7.50% 4 6.50% 7.50% 7.50% 7.00% 5 6.00% 7.00% 7.00% 6.75% 6 5.50% 6.75% 6.50% 6.50% 7 5.00% 6.50% 6.00% 6.25% 8 4.75% 6.25% 5.50% 6.00% 9 4.75% 6.00% 5.50% 5.75% 10 4.75% 5.75% 5.50% 5.50% 11 4.75% 5.50% 5.50% 5.50% 12 4.75% 5.50% 5.50% 5.25% 13 4.75% 5.50% 5.50% 5.25% 14-24 4.75% 5.50% 5.50% 5.00% 25+ 4.75% 5.50% 5.50% 4.75%
C O MM O NW E A L T H A C T U A R I A L V AL U A T I O N R EP OR T | J A N U A R Y 1 , 2 0 0 6 28
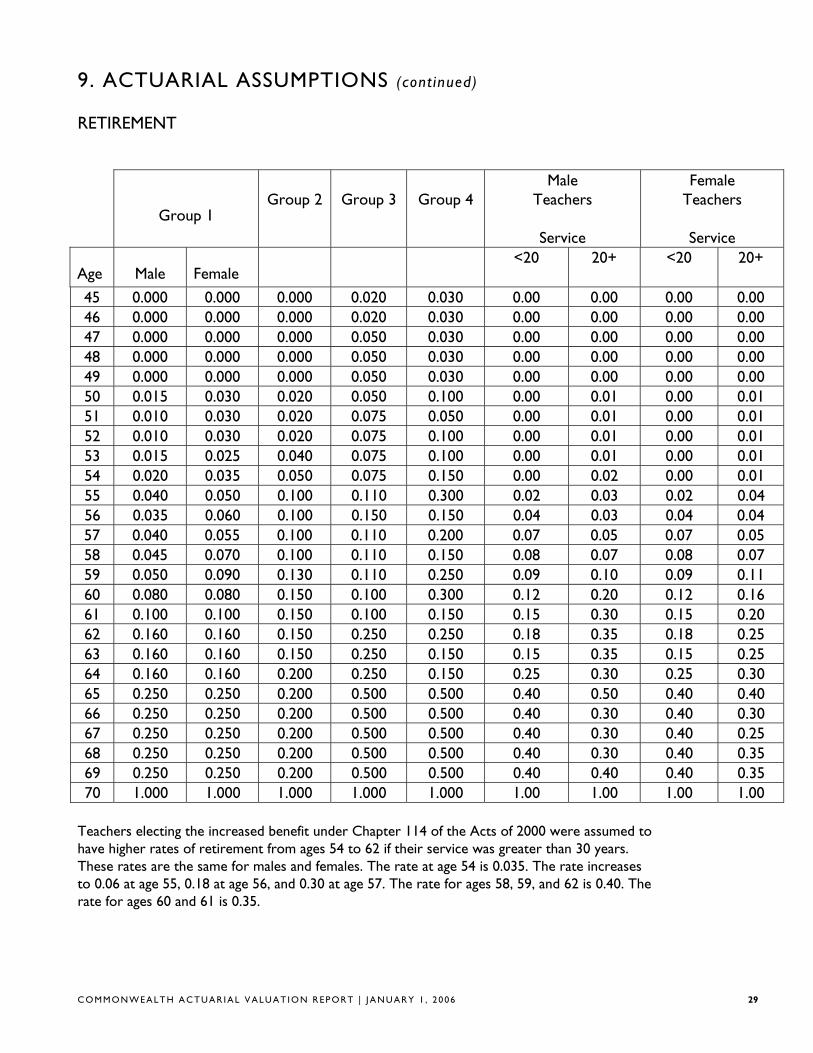
9. ACTUARIAL ASSUMPTIONS (cont inued)
RETIREMENT
Group 1 Group 2 Group 3 Group 4
Male Teachers
Service
Female Teachers
Service
Age Male Female <20 20+ <20 20+
45 0.000 0.000 0.000 0.020 0.030 0.00 0.00 0.00 0.00 46 0.000 0.000 0.000 0.020 0.030 0.00 0.00 0.00 0.00 47 0.000 0.000 0.000 0.050 0.030 0.00 0.00 0.00 0.00 48 0.000 0.000 0.000 0.050 0.030 0.00 0.00 0.00 0.00 49 0.000 0.000 0.000 0.050 0.030 0.00 0.00 0.00 0.00 50 0.015 0.030 0.020 0.050 0.100 0.00 0.01 0.00 0.01 51 0.010 0.030 0.020 0.075 0.050 0.00 0.01 0.00 0.01 52 0.010 0.030 0.020 0.075 0.100 0.00 0.01 0.00 0.01 53 0.015 0.025 0.040 0.075 0.100 0.00 0.01 0.00 0.01 54 0.020 0.035 0.050 0.075 0.150 0.00 0.02 0.00 0.01 55 0.040 0.050 0.100 0.110 0.300 0.02 0.03 0.02 0.04 56 0.035 0.060 0.100 0.150 0.150 0.04 0.03 0.04 0.04 57 0.040 0.055 0.100 0.110 0.200 0.07 0.05 0.07 0.05 58 0.045 0.070 0.100 0.110 0.150 0.08 0.07 0.08 0.07 59 0.050 0.090 0.130 0.110 0.250 0.09 0.10 0.09 0.11 60 0.080 0.080 0.150 0.100 0.300 0.12 0.20 0.12 0.16 61 0.100 0.100 0.150 0.100 0.150 0.15 0.30 0.15 0.20 62 0.160 0.160 0.150 0.250 0.250 0.18 0.35 0.18 0.25 63 0.160 0.160 0.150 0.250 0.150 0.15 0.35 0.15 0.25 64 0.160 0.160 0.200 0.250 0.150 0.25 0.30 0.25 0.30 65 0.250 0.250 0.200 0.500 0.500 0.40 0.50 0.40 0.40 66 0.250 0.250 0.200 0.500 0.500 0.40 0.30 0.40 0.30 67 0.250 0.250 0.200 0.500 0.500 0.40 0.30 0.40 0.25 68 0.250 0.250 0.200 0.500 0.500 0.40 0.30 0.40 0.35 69 0.250 0.250 0.200 0.500 0.500 0.40 0.40 0.40 0.35 70 1.000 1.000 1.000 1.000 1.000 1.00 1.00 1.00 1.00
Teachers electing the increased benefit under Chapter 114 of the Acts of 2000 were assumed to have higher rates of retirement from ages 54 to 62 if their service was greater than 30 years. These rates are the same for males and females. The rate at age 54 is 0.035. The rate increases to 0.06 at age 55, 0.18 at age 56, and 0.30 at age 57. The rate for ages 58, 59, and 62 is 0.40. The rate for ages 60 and 61 is 0.35.
C O MM O NW E A L T H A C T U A R I A L V AL U A T I O N R EP OR T | J A N U A R Y 1 , 2 0 0 6 29
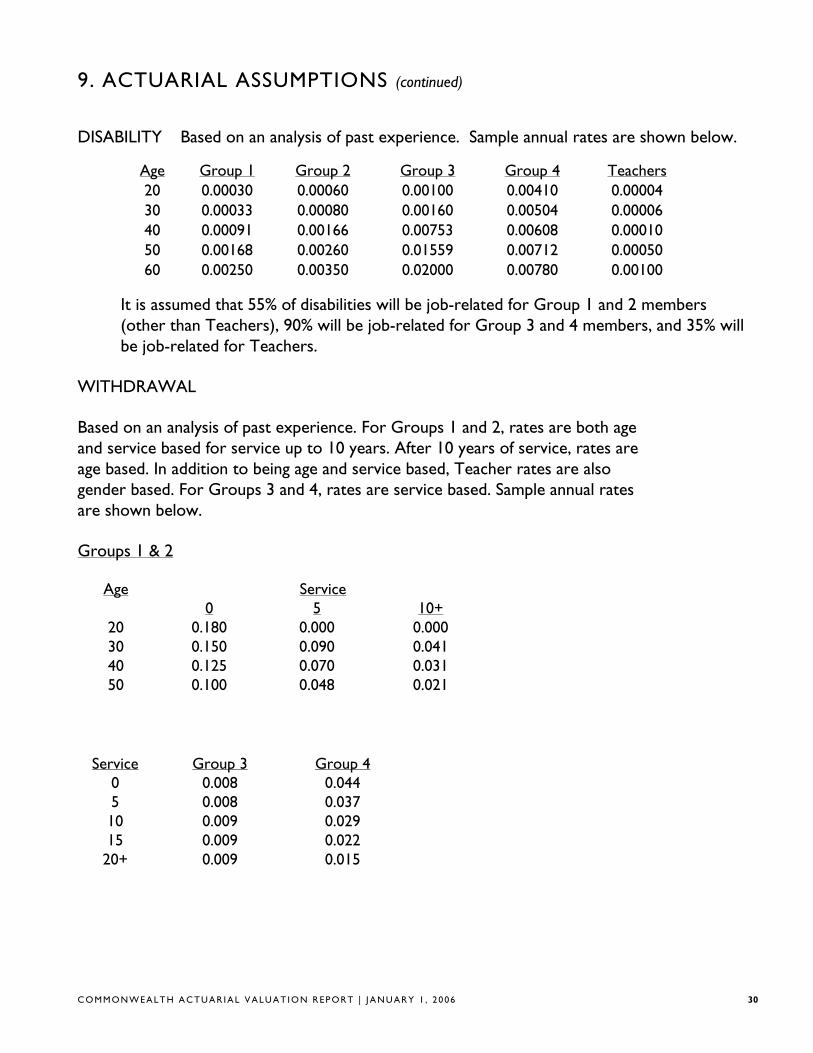
9. ACTUARIAL ASSUMPTIONS (continued)
DISABILITY Based on an analysis of past experience. Sample annual rates are shown below.
Age Group 1 Group 2 Group 3 Group 4 Teachers 20 0.00030 0.00060 0.00100 0.00410 0.00004 30 0.00033 0.00080 0.00160 0.00504 0.00006 40 0.00091 0.00166 0.00753 0.00608 0.00010 50 0.00168 0.00260 0.01559 0.00712 0.00050 60 0.00250 0.00350 0.02000 0.00780 0.00100
It is assumed that 55% of disabilities will be job-related for Group 1 and 2 members (other than Teachers), 90% will be job-related for Group 3 and 4 members, and 35% will be job-related for Teachers.
WITHDRAWAL
Based on an analysis of past experience. For Groups 1 and 2, rates are both age and service based for service up to 10 years. After 10 years of service, rates are age based. In addition to being age and service based, Teacher rates are also gender based. For Groups 3 and 4, rates are service based. Sample annual rates are shown below.
Groups 1 & 2
Age Service 0 5 10+
20 0.180 0.000 0.000 30 0.150 0.090 0.041 40 0.125 0.070 0.031 50 0.100 0.048 0.021
Service Group 3 Group 4 0 0.008 0.044 5 0.008 0.037 10 0.009 0.029 15 0.009 0.022
20+ 0.009 0.015
C O MM O NW E A L T H A C T U A R I A L V AL U A T I O N R EP OR T | J A N U A R Y 1 , 2 0 0 6 30
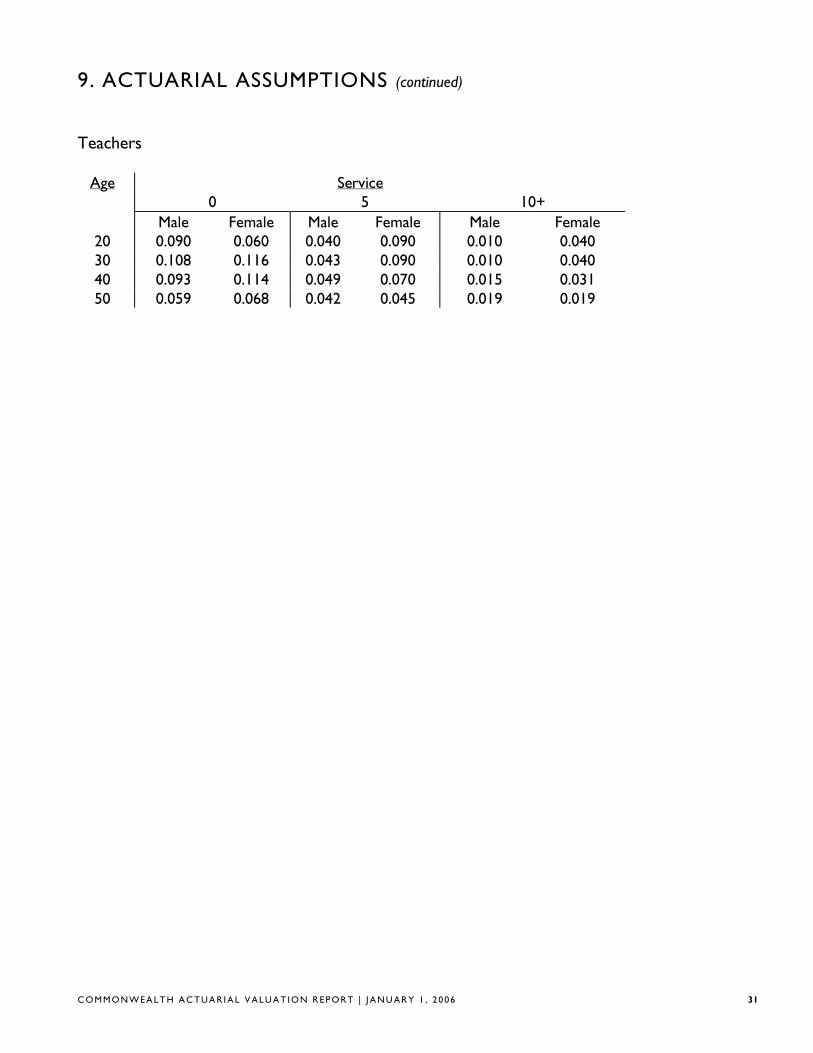
9. ACTUARIAL ASSUMPTIONS (continued)
Teachers
Age
20 30 40 50
0 Service
5 10+ Male Female Male Female Male Female 0.090 0.060 0.040 0.090 0.010 0.040 0.108 0.116 0.043 0.090 0.010 0.040 0.093 0.114 0.049 0.070 0.015 0.031 0.059 0.068 0.042 0.045 0.019 0.019
C O MM O NW E A L T H A C T U A R I A L V AL U A T I O N R EP OR T | J A N U A R Y 1 , 2 0 0 6 31
10. SUMMARY OF PLAN PROVISIONS
ADMINISTRATION
There are 106 contributory retirement systems for public employees in Massachusetts. Each system is governed by a retirement board and all boards, although operating independently, are governed by Chapter 32 of the Massachusetts General Laws. This law establishes benefits, contribution requirements, and an accounting and funds structure for all systems.
MEMBERSHIP
Membership is mandatory for nearly all full-time employees. Eligibility with respect to part-time, provisional, temporary, seasonal, or intermittent employment is governed by regulations promulgated by each retirement board, and approved by PERAC. Membership is optional for certain elected officials. There are 4 classes of membership in the Commonwealth:
Group 1:
General employees, including clerical, administrative, technical, and all other employees not otherwise classified.
Group 2:
Certain specified hazardous duty positions.
Group 3:
State police officers and inspectors
Group 4:
Police officers, firefighters, corrections officers, and other specified hazardous positions.
MEMBER CONTRIBUTIONS
Member contributions vary depending on the most recent date of membership: Date of Membership Contribution Rate Prior to 1975: 5% of regular compensation 1975 - 1983: 7% of regular compensation 1984 to 6/30/96: 8% of regular compensation 7/1/96 to present: 9% of regular compensation 7/1/96 to present: 12% of regular compensation (State Police) 7/1/01 to present: 11% of regular compensation (for teachers hired after 7/1/01 and
those accepting provisions of Chapter 114 of the Acts of 2000) 1979 to present: an additional 2% of regular compensation in excess of $30,000.
RATE OF INTEREST
Interest on regular deductions made after January 1, 1984 is at a rate established by PERAC in consultation with the Commissioner of Banks. The rate is obtained from the average
C O MM O NW E A L T H A C T U A R I A L V AL U A T I O N R EP OR T | J A N U A R Y 1 , 2 0 0 6 32
10. SUMMARY OF PLAN PROVISIONS (continued)
rates paid on individual savings accounts by a representative sample of at least 10 financial institutions.
RETIREMENT AGE
There is no mandatory retirement age for employees in Groups 1 and 2. Most Group 4 members must retire at age 65. As the result of a federal court decision, there is no mandatory retirement age for Group 3 members.
SUPERANNUATION RETIREMENT
A member is eligible for a superannuation retirement allowance (service retirement) upon meeting the following conditions:
• completion of 20 years of service, or
• attainment of age 55 if hired prior to 1978, or if classified in Group 4, or
• attainment of age 55 with 10 years of service, if hired after 1978, and if classified in Group 1 or 2
AMOUNT OF BENEFIT
A member’s annual allowance is determined by multiplying the member’s average salary by a benefit rate related to the member’s age and job classification at retirement, and the resulting product by his creditable service. The amount determined by the benefit formula cannot exceed 80% of the average salary. For veterans as defined in G.L. c. 32, s. 1, there is an additional benefit of $15 per year for each year of creditable service, up to a maximum of $300.
• Salary is defined as gross regular compensation.
• Average Salary is the average annual rate of regular compensation received during the 3 consecutive years that produce the highest average, or, if greater, during the last three years (whether or not consecutive) preceding retirement.
• The Benefit Rate varies with the member’s retirement age, but the highest rate of 2.5% applies to Group 1 employees who retire at or after age 65, Group 2 employees who retire at or after age 60, and to Group 4 employees who retire at or after age 55. A .1% reduction is applied for each year of age under the maximum age for the member’s group. For Group 2 employees who terminate from service under age 55, the benefit rate for a Group 1 employee shall be used.
• For a teacher who is subject to the provisions of Chapter 114 of the Acts of 2000 and who has completed at least 30 years of creditable service, the benefit rate is multiplied by the creditable service and the resulting percentage is increased by 2% per year for
C O MM O NW E A L T H A C T U A R I A L V AL U A T I O N R EP OR T | J A N U A R Y 1 , 2 0 0 6 33
10. SUMMARY OF PLAN PROVISIONS (continued)
each year of service in excess of 24. The amount determined cannot exceed 80% of the average salary.
• For Group 3 members, the rate is 3% for any age.
DEFERRED VESTED BENEFIT
A participant who has completed 10 or more years of creditable service is eligible for a deferred vested retirement benefit. Elected officials and others who were hired prior to 1978 may be vested after 6 years in accordance with G.L. c. 32, s. 10.
The participant’s accrued benefit is payable commencing at age 55, or the completion of 20 years, or may be deferred until later at the participant’s option.
WITHDRAWAL OF CONTRIBUTIONS
Member contributions may be withdrawn upon termination of employment. Employees who first become members on or after January 1, 1984, may receive only limited interest on their contributions if they voluntarily terminate their service. Those who leave service with less than 5 years receive no interest; those who leave service with greater than 5 but less than 10 years receive 50% of the interest credited.
ORDINARY DISABILITY
Eligibility: Non-veterans who become permanently incapacitated from the essential duties of their positions by reason of a non-job related condition with at least 10 years of creditable service (or 15 years creditable service in systems in which the local option contained in G.L. c. 32, s.6(1) has not been adopted).
Veterans with ten years of creditable service who become permanently incapacitated from the essential duties of their positions by reason of a non-job related condition prior to reaching “maximum age”.
Retirement Allowance: Equal to the accrued superannuation retirement benefit as if the member was age 55. If the member is a veteran, the benefit is 50% of the member’s final rate of salary during the preceding 12 months, plus an annuity based upon accumulated member contributions plus credited interest. If the member is over age 55, he/she will receive an allowance that is not less than the allowance he/she would have received if retired for superannuation.
C O MM O NW E A L T H A C T U A R I A L V AL U A T I O N R EP OR T | J A N U A R Y 1 , 2 0 0 6 34
10. SUMMARY OF PLAN PROVISIONS (continued)
ACCIDENTAL DISABILITY
Eligibility: Applies to members who become permanently incapacitated from the essential duties of the position as a result of a personal injury sustained or hazard undergone while in the performance of duties. There are no minimum age or service requirements.
Retirement Allowance: 72% of salary plus an annuity based on accumulated member contributions, with interest. This amount is not to exceed 100% of pay. However, for those who became members in service after January 1, 1988 or who have not been members in service continually since that date, the amount is limited to 75% of pay. There is an additional pension of $629.64 per year, per child who is under 18 at the time of the member’s retirement, with no age limitation if the child is mentally or physically incapacitated from earning. The additional pension may continue up to age 22 for any child who is a full time student at an accredited educational institution.
ACCIDENTAL DEATH
Eligibility: Applies to members who die as a result of a work-related injury or if the member was retired for accidental disability and the death was the natural and proximate result of the injury or hazard undergone on account of which such member was retired.
Allowance: An immediate payment to a named beneficiary equal to the accumulated deductions at the time of death, plus a pension equal to 72% of current salary and payable to the surviving spouse, dependent children or the dependent parent, plus a supplement of $312 per year, per child, payable to the spouse or legal guardian until all dependent children reach age 18 or 22 if a full time student, unless mentally or physically incapacitated.
The surviving spouse of a member of a police or fire department or any corrections officer who, under specific and limited circumstances detailed in the statute, suffers an accident and is killed or sustains injuries resulting in his death, may receive a pension equal to the maximum salary for the position held by the member upon his death.
In addition, an eligible family member of a firefighter, public prosecutor, police officer or corrections officer killed in the line of duty may receive a one time payment of $100,000 from the State Retirement Board.
C O MM O NW E A L T H A C T U A R I A L V AL U A T I O N R EP OR T | J A N U A R Y 1 , 2 0 0 6 35
10. SUMMARY OF PLAN PROVISIONS (continued)
DEATH AFTER ACCIDENTAL DISABILITY RETIREMENT
Effective November 7, 1996, Accidental Disability retirees were allowed to select Option C at retirement and provide a benefit for an eligible survivor. For Accidental Disability retirees prior to November 7, 1996, who could not select Option C, if the member’s death is from a cause unrelated to the condition for which the member received accidental disability benefits, a surviving spouse will receive an annual allowance of $6,000.
DEATH IN ACTIVE SERVICE
Eligibility: At least 2 years of service
Allowance: An immediate allowance equal to that which would have been payable had the member retired and elected Option C on the day before his or her death. For death occurring prior to the member’s superannuation retirement age, the age 55 benefit rate is used. The minimum annual allowance payable to the surviving spouse of a member-inservice who dies with at least two years of creditable service is $3,000, provided that the member and the spouse were married for at least one year and living together on the member’s date of death.
The surviving spouse of such a member-in-service receives an additional allowance equal to the sum of $1,440 per year for the first child and $1,080 per year for each additional child until all dependent children reach age 18 or 22 if full time students, unless mentally or physically incapacitated.
COST OF LIVING
Chapter 17 of the Acts of 1997 provides that the first $12,000 of a retiree’s total allowance is subject to an annual cost-of-living adjustment (COLA). Each year PERAC notifies the Massachusetts General Court of the percentage increase in the Consumer Price Index used for indexing Social Security benefits. This COLA is subject to an annual vote of the Massachusetts General Court, but cannot exceed 3.0%.
C O MM O NW E A L T H A C T U A R I A L V AL U A T I O N R EP OR T | J A N U A R Y 1 , 2 0 0 6 36
10. SUMMARY OF PLAN PROVISIONS (continued)
METHODS OF PAYMENT
A member may elect to receive his or her retirement allowance in one of 3 forms of payment.
Option A: Total annual allowance, payable in monthly installments, commencing at retirement and terminating at the member’s death.
Option B: A reduced annual allowance, payable in monthly installments, commencing at retirement and terminating at the death of the member, provided, however, that if the total amount of the annuity portion received by the member is less than the amount of his or her accumulated deductions, including interest, the difference or balance of his accumulated deductions will be paid in a lump sum to the retiree’s beneficiary or beneficiaries of choice.
Option C: A reduced annual allowance, payable in monthly installments, commencing at retirement. At the death of the retired employee, 2/3 of the allowance is payable to the member’s designated beneficiary (who may be the spouse, or former spouse who remains unmarried for a member whose retirement becomes effective on or after February 2, 1992, child, parent, sister, or brother of the employee) for the life of the beneficiary. For members who retired on or after January 12, 1988, if the beneficiary predeceases the retiree, the benefit payable increases (or “pops up”) based on the factor used to determine the Option C benefit at retirement. For members who retired prior to January 12, 1988, if the System has accepted Section 288 of Chapter 194 of the Acts of 1998 and the beneficiary predeceases the retiree, the benefit payable “pops up” in the same fashion. The Option C became available to accidental disability retirees on November 7, 1996.
ALLOCATION OF PENSION COSTS
If a member’s total creditable service was partly earned by employment in more than one retirement system, the cost of the "pension portion" is allocated between the different systems pro rata based on the member’s service within each retirement system.
C O MM O NW E A L T H A C T U A R I A L V AL U A T I O N R EP OR T | J A N U A R Y 1 , 2 0 0 6 37
11. GLOSSARY OF TERMS
ACTUARIAL ACCRUED LIABILITY
That portion of the Actuarial Present Value of pension plan benefits which is not provided by future Normal Costs or employee contributions. It is the portion of the Actuarial Present Value attributable to service rendered as of the Valuation Date.
ACTUARIAL ASSUMPTIONS
Assumptions, based upon past experience or standard tables, used to predict the occurrence of future events affecting the amount and duration of pension benefits, such as: mortality, withdrawal, disablement and retirement; changes in compensation; rates of investment earnings and asset appreciation or depreciation; and any other relevant items.
ACTUARIAL COST METHOD (OR FUNDING METHOD)
A procedure for allocating the Actuarial Present Value of all past and future pension plan benefits to the Normal Cost and the Actuarial Accrued Liability.
ACTUARIAL GAIN OR LOSS (OR EXPERIENCE GAIN OR LOSS)
A measure of the difference between actual experience and that expected based upon the set of Actuarial Assumptions, during the period between two Actuarial Valuation dates.
Note: The effect on the Accrued Liability and/or the Normal Cost resulting from changes in the Actuarial Assumptions, the Actuarial Cost Method or pension plan provisions would be described as such, rather than an Actuarial Gain (Loss).
ACTUARIAL PRESENT VALUE
The dollar value on the valuation date of all benefits expected to be paid to current members based upon the Actuarial Assumptions and the terms of the Plan.
AMORTIZATION PAYMENT
That portion of the pension plan appropriation which represents payments made to pay interest on and reduce the Unfunded Accrued Liability.
C O MM O NW E A L T H A C T U A R I A L V AL U A T I O N R EP OR T | J A N U A R Y 1 , 2 0 0 6 38
11 . GLOSSARY OF TERMS (continued)
ANNUAL STATEMENT
The statement submitted to PERAC each year that describes the asset holdings and Fund balances as of December 3l as well as the transactions during the calendar year that affected the financial condition of the retirement system.
ANNUITY RESERVE FUND
The fund into which total accumulated deductions, including interest, are transferred at the time a member retires, and from which annuity payments are made.
ANNUITY SAVINGS FUND
The fund in which employee contributions plus interest credited are held for active and inactive members.
ASSETS
The value of securities held by the plan.
COST OF BENEFITS
The estimated payment from the pension system for benefits for the fiscal year.
FUNDING SCHEDULE
The schedule, based upon the most recently approved actuarial valuation, which sets forth the amount which would be appropriated to the pension system in accordance with Section 22C of M.G.L. Chapter 32.
GASB
Governmental Accounting Standards Board
C O MM O NW E A L T H A C T U A R I A L V AL U A T I O N R EP OR T | J A N U A R Y 1 , 2 0 0 6 39
11. GLOSSARY OF TERMS (continued)
NORMAL COST
Total Normal Cost is that portion of the Actuarial Present Value of pension plan benefits, which is to be paid in a single fiscal year. The Employee Normal Cost is the amount of the expected employee contributions for the fiscal year. The Employer Normal Cost is the difference between the Total Normal Cost and the Employee Normal Cost.
PENSION FUND
The fund into which appropriation amounts, as determined by PERAC, are paid and from which pension benefits are paid.
PENSION RESERVE FUND
The fund that shall be credited with all amounts set aside by a system for the purpose of establishing a reserve to meet future pension liabilities. These amounts would include excess interest earnings.
SPECIAL FUND FOR MILITARY SERVICE CREDIT
The fund that is credited with an amount paid by the retirement board equaling the amount that would have been contributed by a member if the member had remained in active service instead of taking a military leave of absence. In the event of retirement or a non-job related death, such amount is transferred to the Annuity Reserve Fund. In the event of termination prior to retirement or death, such amount shall be transferred to the Pension Fund.
UNFUNDED ACCRUED LIABILITY
The excess of the Actuarial Accrued Liability over the Assets.
C O MM O NW E A L T H A C T U A R I A L V AL U A T I O N R EP OR T | J A N U A R Y 1 , 2 0 0 6 40

PERAC Five Middlesex Avenue | Third Floor Somerville, MA 02145 Ph: 617.666.4446 | Fax: 617.628.4002 TTY: 617.591.8917 | Web: www.mass.gov/perac