Common Schools Average Annual Enrollment (FTE)
53
Forecast Contact: Paula Moore 360-664-9376 [email protected] Common Schools Enrollment Caseload Forecast Council February 11, 2022 Common Schools Average Annual Enrollment (FTE) The Common School enrollment forecast includes K-12 grade level enrollments, Running Start enrollments, the University of Washington Transition Program, Open Door Dropout Reengagement Program, summer school, and private and home-schooled students receiving ancillary services from public schools. Forecast Comparisons (Academic Year Averages FTEs) The February 2022 forecast is, on average, 1,674 students or 0.2 percent lower than the November 2021 forecast for the 2021-23 Biennium. Academic Year Nov-21 Forecast Feb-22 Forecast Nov to Feb Difference Percent Difference 2021-22 1,060,406 1,059,125 -1,281 -0.1% 2022-23 1,067,806 1,065,739 -2,067 -0.2% 1
Transcript of Common Schools Average Annual Enrollment (FTE)

Forecast Contact:
Paula Moore 360-664-9376
Common Schools Enrollment Caseload Forecast Council
February 11, 2022
Common Schools Average Annual Enrollment (FTE)
The Common School enrollment forecast includes K-12 grade level enrollments, Running
Start enrollments, the University of Washington Transition Program, Open Door Dropout
Reengagement Program, summer school, and private and home-schooled students receiving
ancillary services from public schools.
Forecast Comparisons (Academic Year Averages FTEs)
The February 2022 forecast is, on average, 1,674 students or 0.2 percent lower than the
November 2021 forecast for the 2021-23 Biennium.
Academic
Year
Nov-21
Forecast
Feb-22
Forecast
Nov to Feb
Difference
Percent
Difference
2021-22 1,060,406 1,059,125 -1,281 -0.1%
2022-23 1,067,806 1,065,739 -2,067 -0.2%
1

Forecast Contact:
Paula Moore 360-664-9376
Tracking the Current Forecast (FTEs)
Actuals for Common Schools are tracking on par with the November forecast.
Academic Year Caseload Change (FTEs)
In 2020-21, Common Schools enrollment declined year-over-year by 3.7 percent due to concerns
about COVID-19 and remote/hybrid schooling. Some families opted for home-based instruction,
private school instruction, and delayed their child’s enrollment in kindergarten. Additional
families may have relocated out-of-state. Finally, immigrants moving into Washington state
significantly dropped.
In 2021-22, total enrollment remained flat. Kindergarten and 1st grade public school enrollment
rates improved from those of the prior year, though not to pre-pandemic rates. Further, year-
over-year declines occurred in grades 4-8 as well as grade 10, Running Start and Open Door. The
forecast assumes a shift in the enrollment trajectory and slower growth trends than occurred pre-
pandemic. Note, around 2009, with the great recession, birth rates declined resulting in smaller
age cohorts. The babies of 2009 are now in the 6th and 7th grade. The overall future growth trends
will be lower as these smaller age cohorts progress through the K-12 system.
Risks to the Forecast
The risks to the Common Schools enrollment forecast (K-12, Open Door, and Running Start) are
high. Demand for Common School enrollment, private school, and home-based instruction are
highly influenced by the state’s economic conditions, demand for labor, and net in-state
migration. Additional factors adding uncertainty: (1) remote-work providing opportunities for
families to relocate out-of-state and (2) immigration, both US policy and backlog of VISA
applications.
Nov-21 Percent
Forecast Actual Variance Variance
Nov-21 1,058,795 1,059,164 369 0.0%
Dec-21 1,057,248 1,057,106 -142 0.0%
Jan-22 1,055,075 1,054,075 -1,000 -0.1%
Academic
Year Caseload
Change from
Prior Year
Percent
Change
Actual 2013-14 1,002,769
2014-15 1,015,076 12,306 1.2%
2015-16 1,028,594 13,519 1.3%
2016-17 1,079,421 50,827 4.9%
2017-18 1,089,687 10,266 1.0%
2018-19 1,091,958 2,271 0.2%
2019-20 1,101,758 9,800 0.9%
2020-21 1,060,586 -41,172 -3.7%
Forecast 2021-22 1,059,125 -1,461 -0.1%
2022-23 1,065,739 6,614 0.6%
2

Forecast Contact:
Paula Moore 360-664-9376
Common School Special EducationCaseload Forecast Council
February 11, 2022
Special Education Average Annual Enrollment (HC)
(Age 3-PreK and State Funded Age K-21)
The Common School Special Education forecast consists of two programs: a separately
funded Age 3-Pre-Kindergarten program, and the Age K-21 school-based Special Education
program, indexed to 13.5 percent of each school district’s total full-time equivalent
enrollment. Up until the 2020-21 school year, Special Education also included the Age 0-2
Infant and Toddler program.
Forecast Comparisons (Academic Year Averages)
The February 2022 forecast is, on average, 1,171 students or 0.8 percent higher than the
November 2021 forecast for the 2021-23 Biennium.
Academic
Year
Nov-21
Forecast
Feb-22
Forecast
Nov to Feb
Difference
Percent
Difference
2021-22 141,455 142,969 1,514 1.1%
2022-23 145,167 145,995 829 0.6%
3

Forecast Contact:
Paula Moore 360-664-9376
Tracking the Current Forecast
The reported Special Education enrollment is tracking within 0.3 percent of forecast.
However, Special Education 3-PreK enrollment is tracking 5.6 percent above forecast, while
the tracking of K-21 is on par with the forecast. The tracking data is of reported Special
Education enrollment. These numbers are slightly different from the forecasted caseload
which, for those in the K-21 program, includes only students funded under the Special
Education basic funding target.
Academic Year Caseload Change
The Special Education forecast declined in 2020-21 for two reasons. First, the state-funded
Birth to Age 2 Special Education program shifted from OSPI to the Early Support for Infant
and Toddlers program at DCYF. This reduced the 2020-21 forecast by 10,381. Second,
Special Education enrollment declined due to concerns about COVID-19 and remote/hybrid
schooling. In 2021-22, the Special Education enrollment continued declined slightly from the
prior year, both in 3-PreK and K-age 21. By 2022-23, the 3-PreK participation rate is
forecasted to increase by the 2022-23. However, due to declining birth rates, this younger
group will not rebound to pre-pandemic levels. For 2022-23, the Special Education K-21
caseload, like Common Schools, will shift and follow a slower growth trajectory than pre-
pandemic. However, it is assumed that trajectory will slightly higher than Common Schools.
Risks to the Forecast
The risks to the Special Education enrollment forecast are high. Special Education enrollment is
subject to the same risks as the Common Schools forecast during this period of uncertainty.
Nov-21 Percent
Forecast Actual Variance Variance
Nov-21 146,611 146,661 50 0.0%
Dec-21 147,230 147,776 546 0.4%
Jan-22 148,081 148,866 785 0.5%
*Special education reported program headcount (Age 3-21)
Academic
Year Caseload
Change from
Prior Year
Percent
Change
Actual 2013-14 136,983
2014-15 138,909 1,926 1.4%
2015-16 141,992 3,083 2.2%
2016-17 145,006 3,014 2.1%
2017-18 151,515 6,509 4.5%
2018-19 156,201 4,686 3.1%
2019-20 160,361 4,160 2.7%
2020-21 144,060 -16,301 -10.2%
Forecast 2021-22 142,969 -1,091 -0.8%
2022-23 145,995 3,026 2.1%
4
Forecast Contact:
Paula Moore 360-664-9376
Education
Common School Bilingual Education Caseload Forecast Council
February 11, 2022
Bilingual Education Average Annual Enrollment (HC)
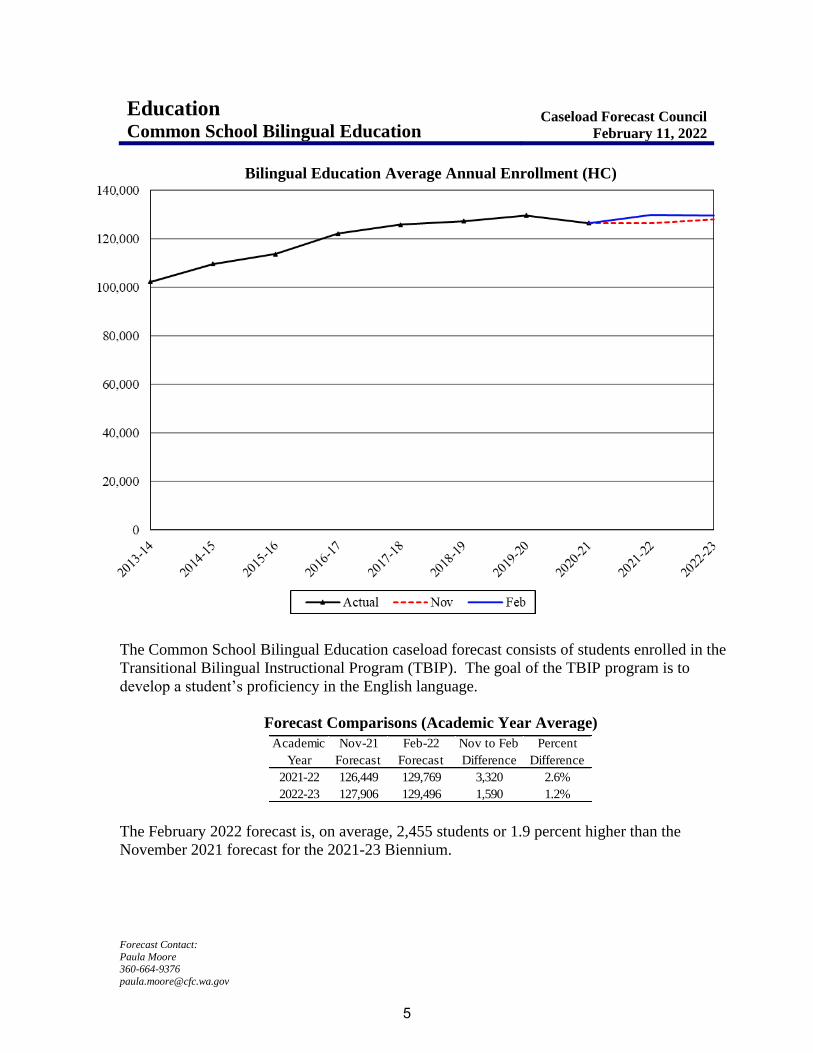
The Common School Bilingual Education caseload forecast consists of students enrolled in the
Transitional Bilingual Instructional Program (TBIP). The goal of the TBIP program is to
develop a student’s proficiency in the English language.
Forecast Comparisons (Academic Year Average)
The February 2022 forecast is, on average, 2,455 students or 1.9 percent higher than the
November 2021 forecast for the 2021-23 Biennium.
Academic
Year
Nov-21
Forecast
Feb-22
Forecast
Nov to Feb
Difference
Percent
Difference
2021-22 126,449 129,769 3,320 2.6%
2022-23 127,906 129,496 1,590 1.2%
5

Forecast Contact:
Paula Moore 360-664-9376
Tracking the Current Forecast
Actuals for TBIP are tracking 2.5 percent above the November forecast. However, K-6 TBIP
is tracking 3.9 percent above the November forecast, while 7-12 TBIP is on par with
November.
Academic Year Caseload Change
The TBIP forecast is sensitive to testing changes, the state’s job growth, US immigration policies
and VISA processing, and families moving to Washington State from other US states. The 2020-
21 caseload decline is due to concerns about COVID-19 and remote/hybrid schooling. In 2021-
22, more elementary children were identified for the program, as children returned from
remote/hybrid and the state implemented a new screener. For 2022-23, the forecast assumes flat
enrollment compared to pre-pandemic due to lower immigration to the state. It is also assumed
that students will stay in the program longer due to (1) the transition to a new state assessment
and (2) the impact remote/hybrid schooling in the 2020-21 school year.
After Exit Enrollment Courtesy Forecast
The After Exit program provides an additional two years of funding for students who exit the
TBIP program after demonstrating proficiency on the spring assessment. The February 2022
forecast is on par with the November 2021 forecast for the 2021-23 biennium.
Risks to the Forecast
Risks to the Bilingual Education forecast are high given the implementation of a new testing
system, COVID-19, and changes in immigration policy and processing of immigrant VISAs.
Nov-21 Percent
Forecast Actual Variance Variance
Nov-21 125,299 128,080 2,781 2.2%
Dec-21 126,317 129,403 3,086 2.4%
Jan-22 126,593 130,349 3,756 3.0%
Academic
Year Caseload
Change from
Prior Year
Percent
Change
Actual 2013-14 102,281
2014-15 109,516 7,236 7.1%
2015-16 113,676 4,160 3.8%
2016-17 122,074 8,398 7.4%
2017-18 125,775 3,701 3.0%
2018-19 127,154 1,379 1.1%
2019-20 129,601 2,447 1.9%
2020-21 126,427 -3,174 -2.4%
Forecast 2021-22 129,769 3,342 2.6%
2022-23 129,496 -273 -0.2%
Academic
Year
Nov-21
Forecast
Feb-22
Forecast
Nov to Feb
Difference
Percent
Difference
2021-22 22,685 22,431 -255 -1.1%
2022-23 23,442 23,634 192 0.8%
6

Forecast Contact:
Paula Moore 360-664-9376
Charter Schools Enrollment Caseload Forecast Council
February 11, 2022
Charter Schools Average Annual Enrollment (FTE)
The charter school forecast includes grade-level enrollments, special education, and bilingual
education. The CFC’s current charter school forecast dates to the 2016 legislative session, when
ESSB 6194 re-established charter schools as an educational system operating separately from the
common school system. The Washington State Charter School Commission (WA CSC) and the
Spokane School District (SSD) are the only approved authorizers of charter schools.
Forecast Comparisons (Academic Year Averages)
The February 2022 forecast is, on average, 189 students or 3.6 percent lower than the November
2021 forecast for the 2021-23 Biennium.
Academic
Year
Nov-21
Forecast
Feb-22
Forecast
Nov to Feb
Difference
Percent
Difference
2021-22 4,669 4,515 -155 -3.3%
2022-23 5,668 5,445 -222 -3.9%
7

Forecast Contact:
Paula Moore 360-664-9376
Tracking the Current Forecast
Actuals for the 2021-22 school year are tracking 2.7 percent below the November forecast,
primarily due to 4 programs experiencing mid-year enrollment decline.
Academic Year Caseload Change
Charter schools are still in an implementation and growth period in Washington State. The
enrollment initially grew through 2018-19, then declined in 2019-20 due to the closure of
four charter schools. An additional school announced a closure at the end of 2020-21.
Collectively, in 2020-21 charter schools expanded. Three new schools opened, serving 316
new students. In 2021-22, 5 additional schools opened, adding an estimated 625 students.
Two more schools will open in 2022-23, serving 287 students. These new schools are funded
on their budgeted, not actual, enrollment for the first year of operation. The only exception
would be if schools delay opening or close mid-year.
Charter school enrollment is forecasted to continue to grow in 2021-22 and 2022-23 as the
currently established and new charters expand grade levels served.
Risks to the Forecast
The risks to the charter school forecast are high. New schools vary in their success rates of
enrollment and scale-up. Another risk is overly optimistic enrollment and expansion plans from
authorized charter schools. COVID-19 adds additional risk to the forecast as it may temporarily
change the operations for some schools and impact charters’ recruitment, expansion, and/or
opening plans.
Nov-21 Percent
Forecast Actual Variance Variance
Nov-21 4,672 4,578 -93 -2.0%
Dec-21 4,665 4,544 -121 -2.6%
Jan-22 4,660 4,503 -157 -3.4%
Academic
Year Caseload
Change from
Prior Year
Percent
Change
Actual 2013-14
2014-15
2015-16
2016-17 1,603 1,603
2017-18 2,408 804 50.2%
2018-19 3,286 878 36.5%
2019-20 2,866 -420 -12.8%
2020-21 3,645 779 27.2%
Forecast 2021-22 4,515 870 23.9%
2022-23 5,445 931 20.6%
8

Forecast Contact:
Paula Moore 360-664-9376
College Bound Scholarship Program
Caseload Forecast Council
February 11, 2022
College Bound Scholarship Program
(Academic Year Enrollment)
The College Bound Scholarship Program (CBSP) provides the value of four years of tuition (at
public institution rates) and a book allowance to low-income students who pledge in the 7th, 8th
and, in some situations, 9th grade, graduate high school with a "C" or better average, avoid a
felony conviction, and enroll in an eligible education institution located in Washington state. The
CBSP caseload includes all CBSP eligible students enrolled in eligible institutions, including
those with financial need met through other sources. A student in CBSP needs to enroll within
two years of graduating from high school and has a five-year window to fully use the award.
Forecast Comparisons (Academic Year Averages)
The February 2022 forecast is, on average, 145 cases or 0.8 percent lower than the November
2021 forecast for the 2021-23 Biennium.
Academic
Year
Nov-21
Forecast
Feb-22
Forecast
Nov to Feb
Difference
Percent
Difference
2021-22 19,348 19,488 140 0.7%
2022-23 19,129 18,698 -430 -2.3%
9

Forecast Contact:
Paula Moore 360-664-9376
Tracking the Current Forecast
Actuals for Fall Term of the 2021-22 academic year are tracking 0.9 percent above the
November forecast. CBSP data updates occur four times per year. The February forecast
compares enrollment for Fall Term compared to the November forecast. The forecast model
relies on Fall Term to estimate the year’s overall enrollment as a portion of students defer
enrollment until spring and/or summer term.
Academic Year Caseload Change
Disruptions from COVID-19 caused a sharp decline in the CBSP caseload during the 2020-
21 year as fewer students enrolled in higher education. This resulted in a 7.7 percent decline
from the prior year. The 2021-22 year followed with a significantly improved labor market,
also lowering the demand for higher education. The forecast assumes a drop of 3.1 percent in
the CBSP caseload for the 2021-22 year. Enrollment is projected to decline further in the
2022-23 year, rather than stay flat or rebound, as high school seniors are signaling less
interest in post-secondary opportunities. Early FAFSA filings for the 2022-23 year by low-
income families are lower than prior years, particularly among high school seniors. The
combined impact of fewer entries and fewer continuing students is forecasted to cause a 4.1
percent year over year decline in the 2022-23 year for CBSP enrollment.
Risks to the Forecast
Risks to the CBSP forecast are high. Uncertainty due to COVID-19 adds additional risk to
the forecast. Shifts in the labor market could also impact the forecast. The demand for higher
education financial aid is often cyclical with the labor market—enrollment often declines
during when there is a strong demand for labor.
Nov-21 Percent
Forecast Actual Variance Variance
Fall Term 16,166 16,307 141 0.9%
Academic
Year Caseload
Change from
Prior Year
Percent
Change
Actual 2013-14 8,687
2014-15 12,318 3,631 41.8%
2015-16 15,599 3,281 26.6%
2016-17 17,251 1,652 10.6%
2017-18 19,730 2,479 14.4%
2018-19 20,431 701 3.6%
2019-20 21,798 1,367 6.7%
2020-21 20,109 -1,689 -7.7%
Forecast 2021-22 19,488 -621 -3.1%
2022-23 18,698 -790 -4.1%
10
Forecast Contact:
Paula Moore 360-664-9376
Washington College Grant
Caseload Forecast Council
February 11, 2022
Washington College Grant Forecast
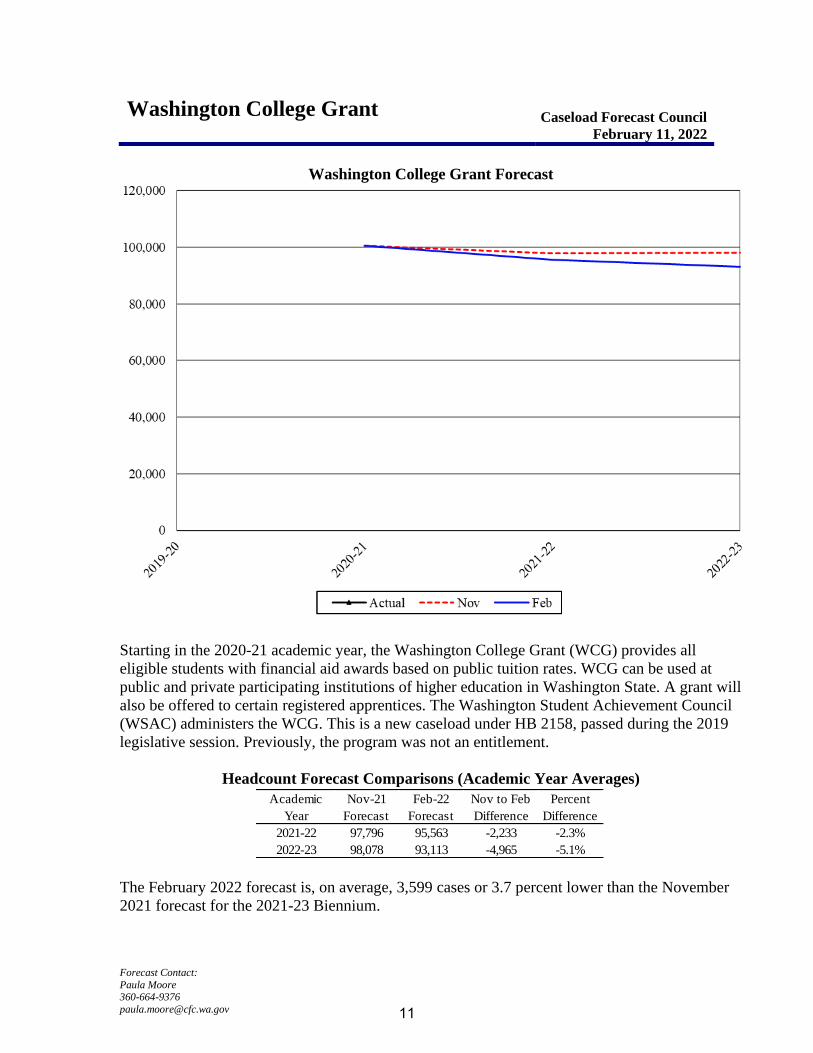
Starting in the 2020-21 academic year, the Washington College Grant (WCG) provides all
eligible students with financial aid awards based on public tuition rates. WCG can be used at
public and private participating institutions of higher education in Washington State. A grant will
also be offered to certain registered apprentices. The Washington Student Achievement Council
(WSAC) administers the WCG. This is a new caseload under HB 2158, passed during the 2019
legislative session. Previously, the program was not an entitlement.
Headcount Forecast Comparisons (Academic Year Averages)
The February 2022 forecast is, on average, 3,599 cases or 3.7 percent lower than the November
2021 forecast for the 2021-23 Biennium.
Academic
Year
Nov-21
Forecast
Feb-22
Forecast
Nov to Feb
Difference
Percent
Difference
2021-22 97,796 95,563 -2,233 -2.3%
2022-23 98,078 93,113 -4,965 -5.1%
11

Forecast Contact:
Paula Moore 360-664-9376
Tracking the Current Forecast
Actuals for Fall Term of the 2021-22 academic year are tracking 2.3 percent below the
November forecast. WCG data updates occur four times per year. The February forecast
compares enrollment for Fall Term compared to the November forecast. The forecast model
relies on Fall Term to estimate the year’s overall enrollment as a portion of students defer
enrollment until spring and/or summer term.
Academic Year Caseload Change (Headcount)
The WCG became an entitlement during the 2020-21 year, when COVID-19 impacted
demand for higher education. The tight labor market has further dampened the demand for
higher education in the 2021-22 year. The February forecasted revised down enrollment
estimates for the 2021-22 year based on lower fall term enrollment in the WCG. Enrollment
is projected to decline further in 2022-23 year, rather than stay flat or rebound, as high school
seniors are signaling less interest in post-secondary opportunities. Early FAFSA filings for
the 2022-23 year by low-income families are lower than prior years, particularly among high
school seniors.
Apprenticeships
The WCG forecast assumes flat enrollment for registered apprenticeships. The February 2022
forecast for WCG apprenticeships is set at 70 for both 2021-22 and 2022-23. This is a
downward revision from the November 2021 forecast, which assumed 375 for 2021-22 and
750 for 2022-23. These headcounts are included in the total WCG forecast.
Risks to the Forecast
Risks to the WCG forecast are high, as it is a new forecast. Uncertainty due to COVID-19
adds risk to the forecast. Shifts in the labor market are likely to have the most impact the
forecast. The demand for higher education financial aid is often cyclical with the labor
market—enrollment often declines during when there is a strong demand for labor.
Nov-21 Percent
Forecast Actual Variance Variance
Fall Term 74,014 72,308 -1,706 -2.3%
Academic
Year Caseload
Change from
Prior Year
Percent
Change
Actual 2013-14
2014-15
2015-16
2016-17
2017-18
2018-19
2019-20
2020-21 100,427 100,427
Forecast 2021-22 95,563 -4,864 -4.8%
2022-23 93,113 -2,451 -2.6%
12

Forecast Contact:
Paula Moore 360-664-9376
Early Support for Infants and Toddlers Caseload Forecast Council
February 11, 2022
Early Support for Infants and Toddlers (ESIT)
(Unofficial Courtesy Forecast)
The Early Support for Infants and Toddlers program (ESIT) coordinates and provides services
for eligible infants and toddlers and is administered by the Department of Children, Youth, and
Families (DCYF). The ESIT caseload is defined as the number of children with active
Individualized Family Service Plans (IFSPs). Children are evaluated and become eligible if
found to have specific developmental delays. As of September 1, 2020, ESIT includes state
funded services previously provided through Special Education Birth to Age 2.
Forecast Comparisons (Fiscal Year Averages)
The February 2022 forecast is, on average, 88 cases or 0.9 percent lower than the November
2021 forecast for the 2021-23 Biennium.
-
2,000
4,000
6,000
8,000
10,000
12,000
Actual Nov Feb
Fiscal
Year
Nov-21
Forecast
Feb-22
Forecast
Feb to Nov
Difference
Percent
Difference
2022 9,637 9,591 -46 -0.5%
2023 10,185 10,056 -129 -1.3%
13

Forecast Contact:
Paula Moore 360-664-9376
Tracking the Current Forecast
Actuals are tracking, on average, 8 cases or 0.1 percent below the November forecast.
Academic Year Caseload Change
The COVID-19 pandemic resulted in a sharp decline in the ESIT caseload, starting in March
of 2020. The program experienced reductions in entries and active participants. Referrals
from pediatricians and pediatric service providers also declined. The decline reversed starting
in January 2021, and growth returned as vaccines became available for providers and adult
caregivers. In total, for FY 2021, the ESIT caseload declined by 11.8 percent due to COVID-
19. In FY 2022 and 2023, the ESIT caseload is projected to grow, but at a lower rate than the
pre-pandemic average. This is because the overall age 0 to 2 population is forecasted to
decline due to drops in birth rates and fewer families moving into Washington State.
Risks to the Forecast
Risks to the February 2022 forecast are higher than normal as a result of uncertainty due to
COVID-19 prevalence, access to pediatric vaccines, birth rates, and net in-state migration.
Historically, changing birth rates and policy changes have most impacted this forecast.
Nov-21 Percent
Forecast Actual Variance Variance
Oct-21 9,502 9,483 -19 -0.2%
Nov-21 9,540 9,544 4 0.0%
Fiscal Year Caseload
Change from
Prior Year
Percent
Change
Actual 2014 6,143
2015 6,609 466 7.6%
2016 7,436 827 12.5%
2017 7,832 396 5.3%
2018 8,500 668 8.5%
2019 9,649 1,149 13.5%
2020 9,991 342 3.5%
2021 8,808 -1,182 -11.8%
Forecast 2022 9,591 782 8.9%
2023 10,056 465 4.8%
14

Forecast Contact:
Erik Sund 360-664-9374
Early Childhood Education and Assistance (ECEAP)
Caseload Forecast Council
February 11, 2022
Early Childhood Education and Assistance
The Early Childhood Education and Assistance Program (ECEAP) provides comprehensive
nutrition, health, education, and family support services to eligible children between the ages
of three and five years old who are not eligible for kindergarten to enhance their opportunity
for success in the common school system. ECEAP enrollment is forecast as total annual
enrollment calculated as a ten-month average to more accurately reflect that the majority of
enrollment occurs during the standard school year. Per statute, children who participate in
Head Start are not eligible for ECEAP and, as a result, are not included in the forecast.
Forecast Comparisons (Fiscal Year Averages)
The February 2022 forecast is, on average, 191 cases or 1.4 percent lower than the November
2021 forecast for the 2021-23 Biennium.
-
2,000
4,000
6,000
8,000
10,000
12,000
14,000
16,000
18,000
Actual Nov Feb
Fiscal
Year
Nov-21
Forecast
Feb-22
Forecast
Feb to Nov
Difference
Percent
Difference
2022 11,847 11,465 -382 -3.2%
2023 14,890 14,890 0 0.0%
15

Forecast Contact:
Erik Sund 360-664-9374
Tracking the Current Forecast
Actuals are tracking, on average, 145 cases or 1.4 percent below the November forecast.
ECEAP eligibility is primarily based on a child’s age and family income. Children otherwise
ineligible may also participate under rules adopted by the Department of Children, Youth and
Families (DCYF), provided that the number of such children is no more than 25 percent of
enrollment in the program. During the 2020-2021 school year, the program served an average of
about 729 such children per month. These children are not considered part of the state-funded
entitlement caseload and are not counted in this forecast.
ECEAP enrollment during the 2020-2021 school year was heavily impacted by the COVID-19
pandemic, with average monthly caseloads being 23.1 percent lower than during the 2019-2020
school year. While program participation has been higher so far during the 2021-2022 school
year, monthly caseloads are still below 2019-2020 levels. This forecast assumes the caseload will
continue increase gradually over the rest of the 2021-2022 school year as it did in 2020-2021 and
will return to historical levels, adjusted for increases in the number of enrollment slots funded by
the legislature, in the 2022-2023 school year.
Academic Year Caseload Change
Risks to the Forecast
Risks to this forecast are high. ECEAP participation was low throughout the 2020-2021
school year and has been low for first half of the 2021-2022 school year. The pace of
caseload recovery will continue to be influenced the progress achieved in limiting COVID-19
case counts in the community and by the availability of COVID-19 vaccines for younger
children.
Nov-21 Percent
Forecast Actual Variance Variance
Oct-21 10,398 10,174 -224 -2.2%
Nov-21 10,797 10,731 -66 -0.6%
Academic
Year Caseload
Change from
Prior Year
Percent
Change
Actual 2013-2014 8,196
2014-2015 9,356 1,160 14.2%
2015-2016 10,965 1,610 17.2%
2016-2017 11,294 329 3.0%
2017-2018 11,989 695 6.2%
2018-2019 12,660 671 5.6%
2019-2020 12,955 295 2.3%
2020-2021 9,964 -2,991 -23.1%
Forecast 2021-2022 11,465 1,501 15.1%
2022-2023 14,890 3,425 29.9%
16

Forecast Contact:
Liz Dehlbom 360-664-9373
Corrections Juvenile Rehabilitation
Caseload Forecast Council
February 11, 2022
Juvenile Rehabilitation
The Juvenile Rehabilitation (JR) caseload is comprised of three components: Juvenile
Commitments, Juvenile Parole Revocations, and Adult Commitments.
• Juvenile Commitments are individuals sentenced for crimes committed under age 18
and are under Juvenile Court jurisdiction.
• Juvenile Parole Revocations are individuals returned to confinement for up to 30 days
for violating parole after releasing from a Juvenile Commitment.
• Adult Commitments are individuals who committed crimes under age 18 and are
sentenced as adults to the Department of Corrections (DOC). They begin their
sentences in JR facilities.
Forecast Comparisons (Fiscal Year Averages)
17

Forecast Contact:
Liz Dehlbom 360-664-9373
The February 2022 forecast is, on average, 39 cases or 10.5 percent lower than the November
2021 forecast for the 2021-23 Biennium.
Tracking the Current Forecast
Actuals have been tracking, on average, 7 cases or 2.2 percent above the November 2021
forecast. The caseload declined in December after being near even for four months.
Declines were expected as new admissions continue to be depressed for both Juvenile and Adult
commitments compared to the overall average during the COVID-19 period. At the same time,
Juvenile commitment releases continue to be slightly increased as a result of the May policy
change relating the calculation of release dates near the minimum sentence range. The current
policy has produced shorter lengths of stay on average, though the number of new admissions
since implementation is too small to calculate the ongoing impact.
The forecast delays the timeline for admission increases for the next three months and extends
the timeframe for the courts to clear any case backlog by one year through FY 2024. This was
done to account for slower than expected court recovery. The caseload will continue to contract
through FY 2022 before gradually increasing over the biennium as admissions increase. The
caseload is expected to resume growth associated with E2SSB 6160 and E2SHB 1646 for the
next few years, though at diminished levels due to ongoing reductions in the volume of Juvenile
cases in the criminal justice system.
Fiscal Year Caseload Change
Risks to the Forecast
Risk to this forecast is high. There is substantial uncertainty surrounding the impact of
COVID-19 on the timeline for increased capacity in the criminal justice system in the short-
term as well as the long-term impact on future case volume. This may impact the expected
magnitude of E2SSB 6160 and E2SHB 1646.
18

Forecast Contact:
Liz Dehlbom 360-664-9373
Corrections Adult Inmate
Caseload Forecast Council
February 11, 2022
Adult Inmate
The Adult Inmate forecast includes adult criminal sentences under the state’s jurisdiction and
housed in prisons and partial confinement facilities. The forecast includes the effects of
changing demographics, offense types, and policy changes (new legislation or initiatives).
Forecast Comparisons (Fiscal Year Averages)
The February 2022 forecast is, on average, 262 cases or 1.9 percent lower than the November
2021 forecast for the 2021-23 Biennium.
Actuals have been tracking, on average, 61 cases or 0.5 percent below the November 2021
forecast. The caseload has experienced a slower decline in the last four months compared with
earlier in the COVID-19 period.
19

Forecast Contact:
Liz Dehlbom 360-664-9373
Tracking the Current Forecast
The overall decline of the caseload is a function of fewer admissions than releases with the
slowing of this decline in recent months reflective of fewer individuals releasing rather than an
increase in new admissions. The courts continue to have constrained capacity to process pending
cases given public health guidance during the COVID-19 pandemic and has resulted in the delay
in the resolution of cases. As a result of recent high case rates in the community, many counties
have again paused in-person proceedings through February. Additionally, the courts continue to
process cases as a result of the Washington State Supreme Court decision in State v. Blake,
requiring courts to vacate and resentence individuals with possession convictions in their
criminal history.
The forecast delays the timeline for admission increases for the next two months and extends the
timeframe for the courts to clear any case backlog by one year through FY 2025. This was done
to account for slower than expected court recovery. The caseload will continue to contract
slightly through FY 2022. It is expected that the caseload will gradually increase over the
biennium as admissions increase and courts begin to clear any case backlog.
Fiscal Year Caseload Change
Risks to the Forecast
Risk to this forecast is high. There is substantial uncertainty surrounding the impact of
COVID-19 on the timeline for increased capacity in the criminal justice system in the short-
term as well as the long-term impact on future case volume.
20

Forecast Contact:
Liz Dehlbom 360-664-9373
Corrections Contact-Required Community Supervision
Caseload Forecast Council
February 11, 2022
Contact-Required Community Supervision
The Contact-Required Community Supervision caseload includes adults who have been convicted
of a crime(s), are actively supervised by the Department of Corrections (DOC), and have
requirements to maintain contact with the DOC.
Forecast Comparisons (Fiscal Year Averages)
The February 2022 forecast is, on average, 415 cases or 3.3 percent lower than the November
2021 forecast for the 2021-23 Biennium.
Actuals have been tracking, on average, 249 cases or 1.9 percent above the November 2021
forecast. The caseload has experienced a slower decline in the last four months compared with
earlier in the COVID-19 period.
21
Forecast Contact:
Liz Dehlbom 360-664-9373
Tracking the Current Forecast
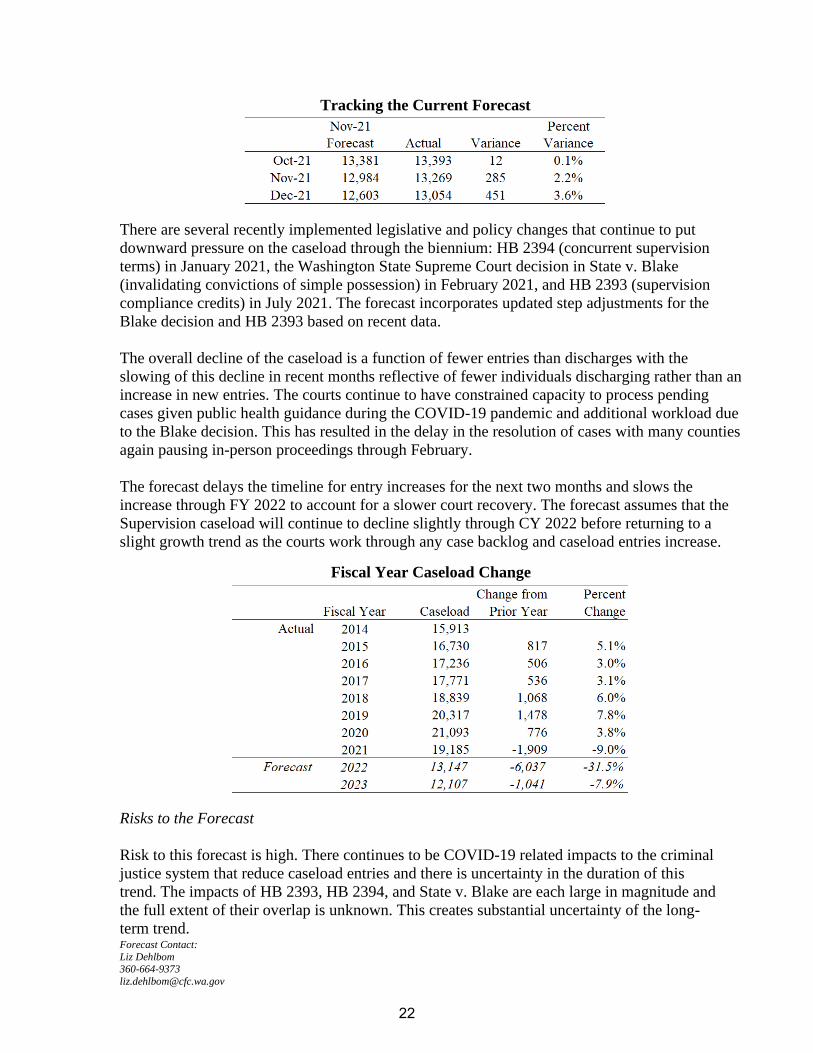
There are several recently implemented legislative and policy changes that continue to put
downward pressure on the caseload through the biennium: HB 2394 (concurrent supervision
terms) in January 2021, the Washington State Supreme Court decision in State v. Blake
(invalidating convictions of simple possession) in February 2021, and HB 2393 (supervision
compliance credits) in July 2021. The forecast incorporates updated step adjustments for the
Blake decision and HB 2393 based on recent data.
The overall decline of the caseload is a function of fewer entries than discharges with the
slowing of this decline in recent months reflective of fewer individuals discharging rather than an
increase in new entries. The courts continue to have constrained capacity to process pending
cases given public health guidance during the COVID-19 pandemic and additional workload due
to the Blake decision. This has resulted in the delay in the resolution of cases with many counties
again pausing in-person proceedings through February.
The forecast delays the timeline for entry increases for the next two months and slows the
increase through FY 2022 to account for a slower court recovery. The forecast assumes that the
Supervision caseload will continue to decline slightly through CY 2022 before returning to a
slight growth trend as the courts work through any case backlog and caseload entries increase.
Fiscal Year Caseload Change
Risks to the Forecast
Risk to this forecast is high. There continues to be COVID-19 related impacts to the criminal
justice system that reduce caseload entries and there is uncertainty in the duration of this
trend. The impacts of HB 2393, HB 2394, and State v. Blake are each large in magnitude and
the full extent of their overlap is unknown. This creates substantial uncertainty of the long-
term trend.
22

Forecast Contact:
Liz Dehlbom 360-664-9373
Corrections Community Custody Violator
Caseload Forecast Council
February 11, 2022
Community Custody Violator
The Community Custody Violator forecast includes adults who were under community custody,
violated their supervision conditions, and were sanctioned with confinement. Most of these
individuals are housed in local county/city jails, with the balance housed in state prisons.
Forecast Comparisons (Fiscal Year Averages)
The February 2022 forecast is, on average, 136 cases or 17.9 percent lower than the November
forecast for the 2021-23 Biennium.
Actuals have been tracking, on average, 110 cases or 23.0 percent below the November 2021
forecast. The caseload’s sharp decline over CY 2021 stalled in October and has remained even
through December.
23

Forecast Contact:
Liz Dehlbom 360-664-9373
Tracking the Current Forecast
The stall in decline is due to the Department of Corrections (DOC) in November 2021 phasing
out some of the temporary practice changes that have been in place due to COVID-19. These
have included suspension of certain treatment programs, reduction of urinalysis testing, and a
reduction of in-person caseload contacts. The caseload likely did not increase as anticipated
because of the historically seasonal nature of the caseload. The February forecast applies a
seasonal factor to the caseload until DOC fully phases out the temporary practices.
The forecast additionally incorporates revised step adjustments based on the implementation
experience in recent months for the DOC policy change reducing violation confinement sanction
length and the reductions in the overall Supervision caseload.
DOC had expected to implement the final phase-in to fully revert to pre-pandemic procedures in
January 2022, but due to the sharp rise in COVID-19 cases in the community this was revised to
March 2022. The forecast assumes that the Violator caseload will grow to a new ongoing level
over three months with the resumption of normal DOC operations.
Fiscal Year Caseload Change
Risks to the Forecast
Risks to this forecast are high. The timeline for full resumption of DOC supervision practices
may change as COVID-19 conditions in the community develop. The magnitude of step
adjustments adds an extra layer of risk to the forecast. It is also unclear how closely the large
decline in the supervision caseload will be mirrored in the Violator caseload over time.
24

Forecast Contact:
Erik Cornellier 360-664-9375
Temporary Assistance for Needy
Families (TANF)
Caseload Forecast Council
February 11, 2022
TANF Assistance Units (Courtesy Forecast)
The Temporary Assistance for Needy Families (TANF) forecast combines two forecasts: one for
WorkFirst or “All Family” cases that include children and their parents and one for “Child Only”
cases in which the parents or guardians do not receive part of the grant and are not subject to
work requirements. WorkFirst cases made up 52% of the caseload during calendar year 2019.
Forecast Comparisons (Fiscal Year Averages)
The February 2022 forecast is 1,593 cases or 6.1 percent higher than the November 2021
forecast for the 2021-23 Biennium.
-
5,000
10,000
15,000
20,000
25,000
30,000
35,000
40,000
45,000
50,000
Actual Nov Feb
Fiscal
Year
Nov-21
Forecast
Feb-22
Forecast
Feb to Nov
Difference
Percent
Difference
2022 26,793 27,949 1,156 4.3%
2023 25,212 27,242 2,030 8.0%
25
Forecast Contact:
Erik Cornellier 360-664-9375
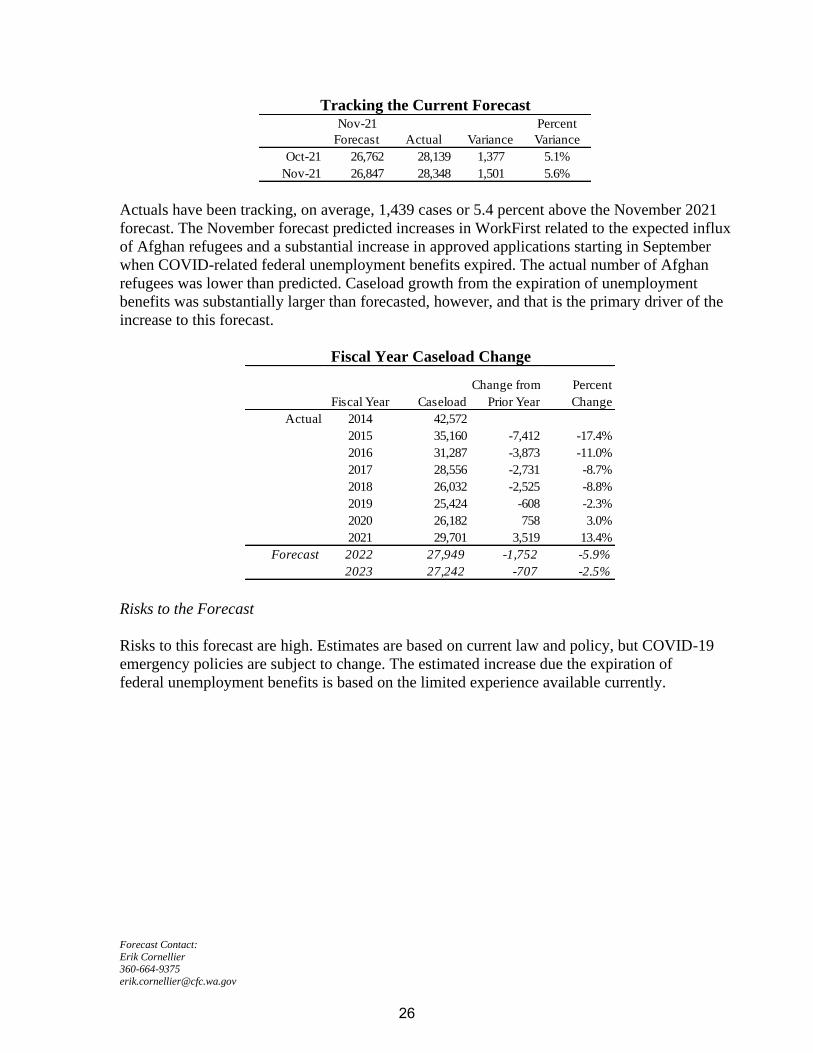
Tracking the Current Forecast
Actuals have been tracking, on average, 1,439 cases or 5.4 percent above the November 2021
forecast. The November forecast predicted increases in WorkFirst related to the expected influx
of Afghan refugees and a substantial increase in approved applications starting in September
when COVID-related federal unemployment benefits expired. The actual number of Afghan
refugees was lower than predicted. Caseload growth from the expiration of unemployment
benefits was substantially larger than forecasted, however, and that is the primary driver of the
increase to this forecast.
Fiscal Year Caseload Change
Risks to the Forecast
Risks to this forecast are high. Estimates are based on current law and policy, but COVID-19
emergency policies are subject to change. The estimated increase due the expiration of
federal unemployment benefits is based on the limited experience available currently.
Nov-21 Percent
Forecast Actual Variance Variance
Oct-21 26,762 28,139 1,377 5.1%
Nov-21 26,847 28,348 1,501 5.6%
Fiscal Year Caseload
Change from
Prior Year
Percent
Change
Actual 2014 42,572
2015 35,160 -7,412 -17.4%
2016 31,287 -3,873 -11.0%
2017 28,556 -2,731 -8.7%
2018 26,032 -2,525 -8.8%
2019 25,424 -608 -2.3%
2020 26,182 758 3.0%
2021 29,701 3,519 13.4%
Forecast 2022 27,949 -1,752 -5.9%
2023 27,242 -707 -2.5%
26

Forecast Contact:
Erik Cornellier 360-664-9375
Economic Services Administration Aged, Blind and Disabled Assistance Grant
Caseload Forecast Council
February 11, 2022
Aged, Blind and Disabled Assistance Grant Program – Total Caseload
The Aged, Blind and Disabled Assistance program (ABD) provides financial assistance to persons
whose long-term mental and/or physical disabilities likely qualify them for the federal
Supplemental Security Income (SSI) program, regardless of citizenship status. This forecast
includes three components: Presumptive SSI, Aged, and Disabled.
Forecast Comparisons (Fiscal Year Averages)
The February 2022 forecast is 250 cases or 1.2 percent higher than the November 2021 forecast
for the 2021-23 Biennium.
-
5,000
10,000
15,000
20,000
25,000
30,000
Actual Nov Feb
Fiscal
Year
Nov-21
Forecast
Feb-22
Forecast
Feb to Nov
Difference
Percent
Difference
2022 20,898 21,122 225 1.1%
2023 20,828 21,103 275 1.3%
27

Forecast Contact:
Erik Cornellier 360-664-9375
Tracking the Current Forecast
Actuals have been tracking, on average, 305 cases or 1.5 percent above the November 2021
forecast for the past two months. This coincides with an increase in Temporary Assistance for
Needy Families cases with the expiration of federal unemployment benefits in September of
2021.
Fiscal Year Caseload Change
The ABD growth rate exhibits large volatility. This is mainly due to:
1. HB 2667 that provided for a client to receive both the ABD program and the Essential
Needs and Housing Support program (HEN) assistance concurrently while an
application for federal SSI benefits is pending.
2. HB1831 that increased resources exempted when determining eligibility for public
assistance.
3. COVID-19 and related policy changes.
Risks to the Forecast
The risks to the forecast are moderate. The risks are mainly due to the uncertainties of the
COVID-19 impact and corresponding policy changes.
Nov-21 Percent
Forecast Actual Variance Variance
Oct-21 20,869 21,198 329 1.6%
Nov-21 20,821 21,103 282 1.4%
Fiscal Year Caseload
Change from
Prior Year
Percent
Change
Actual 2014 24,309
2015 21,914 -2,395 -9.9%
2016 20,512 -1,402 -6.4%
2017 20,075 -437 -2.1%
2018 19,707 -368 -1.8%
2019 20,293 586 3.0%
2020 20,442 149 0.7%
2021 21,528 1,087 5.3%
Forecast 2022 21,122 -406 -1.9%
2023 21,103 -19 -0.1%
28
Forecast Contact:
Erik Sund 360-664-9374
Working Connections Child Care (WCCC)
Caseload Forecast Council
February 11, 2022
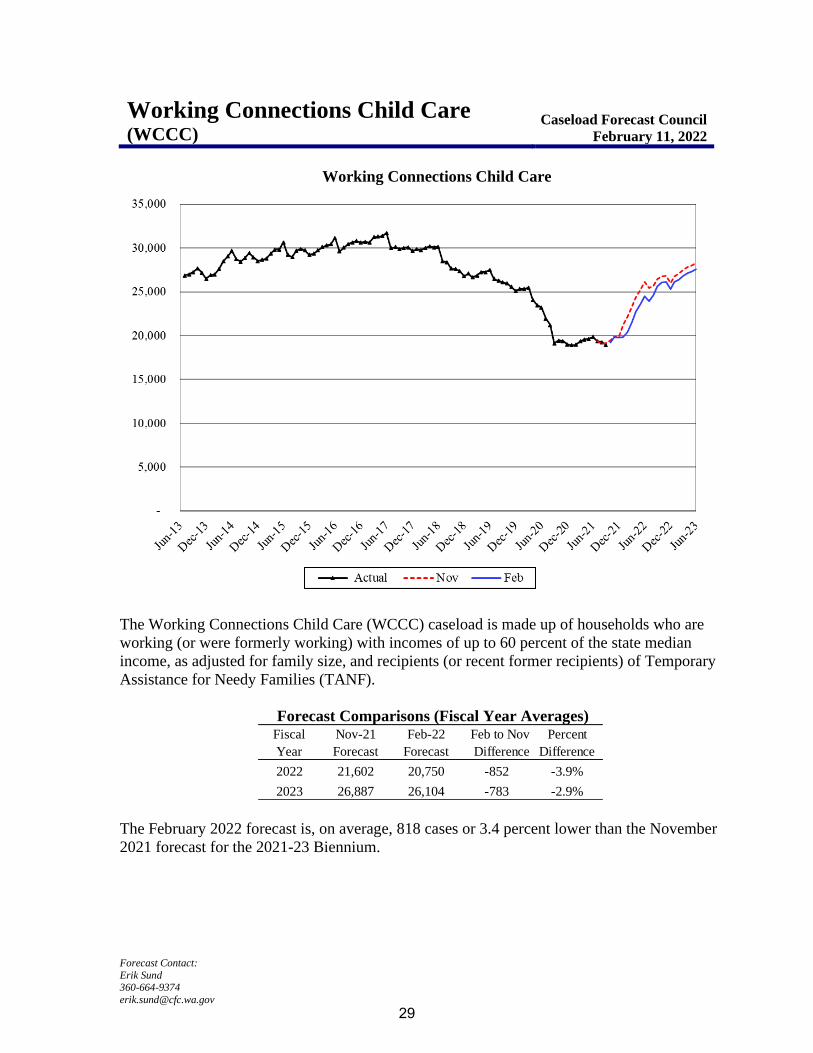
Working Connections Child Care
The Working Connections Child Care (WCCC) caseload is made up of households who are
working (or were formerly working) with incomes of up to 60 percent of the state median
income, as adjusted for family size, and recipients (or recent former recipients) of Temporary
Assistance for Needy Families (TANF).
Forecast Comparisons (Fiscal Year Averages)
The February 2022 forecast is, on average, 818 cases or 3.4 percent lower than the November
2021 forecast for the 2021-23 Biennium.
Fiscal
Year
Nov-21
Forecast
Feb-22
Forecast
Feb to Nov
Difference
Percent
Difference
2022 21,602 20,750 -852 -3.9%
2023 26,887 26,104 -783 -2.9%
29

Forecast Contact:
Erik Sund 360-664-9374
Tracking the Current Forecast
Actuals are tracking, on average, 16 cases or 0.1 percent below the November forecast.
Fiscal Year Caseload Change
This forecast includes three step adjustments to account for the expected caseload impacts of
E2SSB 5237 (Chapter 199, Laws of 2021). Among other changes to state programs for
children, this legislation: (1) changed the maximum family income eligible for WCCC from
200 percent of the federal poverty level to 60 percent of the State median income (SMI) for a
given family size; (2) established new schedules for copayments for families in WCCC with
lower maximum amounts; and (3) expanded the exemption from work requirements
previously provided to single parents enrolled in certain programs at community, technical,
and tribal colleges to include both parents that are not single and additional courses of study.
Each of these step adjustments serves to increase the caseload forecast, with the adjustments
increasing gradually from July 2021.
Additionally, the forecast continues to incorporate a step adjustment estimating the reduction
in the caseload caused by both reduced entries of new households and increased exits from
the program over the past 19 months due to health concerns, difficulty meeting work
requirements, and other effects of the COVID-19 pandemic. Due to the resurgence of COVID
infections late in 2021, this adjustment has been extended and will be phased out between
February and September of 2022.
Risks to the Forecast
Risks to this forecast are high. The pandemic has affected patterns of work and child care
utilization and has also affected the supply of child care services, leading in turn to a
substantial decline in the WCCC caseload. While this forecast anticipates that the caseload
Nov-21 Percent
Forecast Actual Variance Variance
Jul-21 19,424 19,378 -46 -0.2%
Aug-21 19,082 19,272 190 1.0%
Sep-21 19,130 18,938 -192 -1.0%
Fiscal Year Caseload
Change from
Prior Year
Percent
Change
Actual 2014 27,605
2015 29,175 1,570 5.7%
2016 29,828 653 2.2%
2017 30,767 939 3.1%
2018 29,991 -776 -2.5%
2019 27,412 -2,579 -8.6%
2020 25,200 -2,213 -8.1%
2021 19,699 -5,501 -21.8%
Forecast 2022 20,750 1,051 5.3%
2023 26,104 5,353 25.8%
30

Forecast Contact:
Erik Sund 360-664-9374
will begin to recover this year, the pandemic’s impact has been such that any divergence
from the expected trend of recovery due to changes in epidemiological conditions may
produce significant variance. The scale of the step adjustments associated with the program
expansion under E2SSB 5237 introduce further risks to the forecast.
31

Forecast Contact:
Erik Cornellier 360-664-9375
Tiered Reimbursement
Caseload Forecast Council
February 11, 2022
Tiered Reimbursement
Early Achievers is Washington’s quality rating and improvement system for early learning
providers. Early Achievers supports early learning professionals by providing resources such as
professional development opportunities, coaching, and financial incentives. Licensed childcare
centers, licensed family homes, and Early Childhood Education and Assistance Programs
(ECEAP) are required to enroll in Early Achievers to receive state subsidy for childcare services.
The Department of Children, Youth, and Families (DCYF) rates providers based on quality, and
they receive additional reimbursement based on quality. There are six tiers, and providers receive
higher reimbursement in each tier.
Providers enrolling in Early Achievers must rate at Level 3 within 30 months of enrollment,
and ECEAP providers must rate at Level 4 within 12 months if they are license-exempt or 18
months if they are licensed or certified.
-
500
1,000
1,500
2,000
2,500
3,000
3,500
Actual Nov Feb
32
Forecast Contact:
Erik Cornellier 360-664-9375
Forecast Comparisons (Fiscal Year Averages)
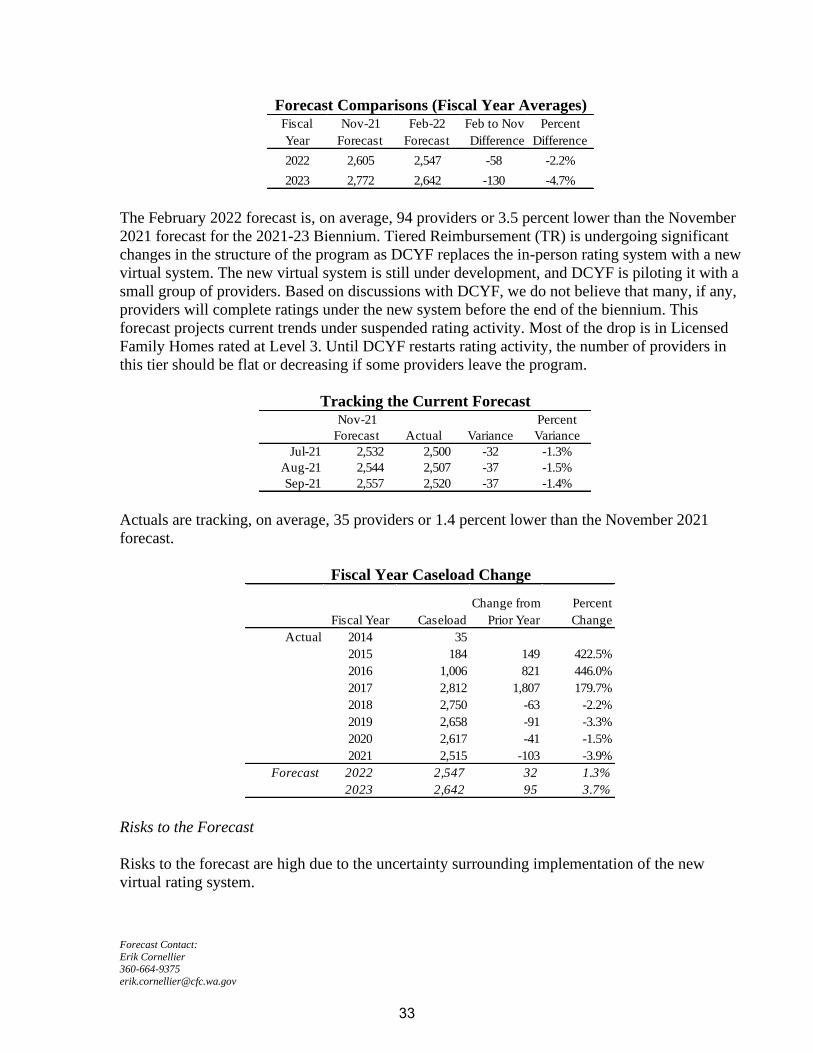
The February 2022 forecast is, on average, 94 providers or 3.5 percent lower than the November
2021 forecast for the 2021-23 Biennium. Tiered Reimbursement (TR) is undergoing significant
changes in the structure of the program as DCYF replaces the in-person rating system with a new
virtual system. The new virtual system is still under development, and DCYF is piloting it with a
small group of providers. Based on discussions with DCYF, we do not believe that many, if any,
providers will complete ratings under the new system before the end of the biennium. This
forecast projects current trends under suspended rating activity. Most of the drop is in Licensed
Family Homes rated at Level 3. Until DCYF restarts rating activity, the number of providers in
this tier should be flat or decreasing if some providers leave the program.
Tracking the Current Forecast
Actuals are tracking, on average, 35 providers or 1.4 percent lower than the November 2021
forecast.
Fiscal Year Caseload Change
Risks to the Forecast
Risks to the forecast are high due to the uncertainty surrounding implementation of the new
virtual rating system.
Fiscal
Year
Nov-21
Forecast
Feb-22
Forecast
Feb to Nov
Difference
Percent
Difference
2022 2,605 2,547 -58 -2.2%
2023 2,772 2,642 -130 -4.7%
Nov-21 Percent
Forecast Actual Variance Variance
Jul-21 2,532 2,500 -32 -1.3%
Aug-21 2,544 2,507 -37 -1.5%
Sep-21 2,557 2,520 -37 -1.4%
Fiscal Year Caseload
Change from
Prior Year
Percent
Change
Actual 2014 35
2015 184 149 422.5%
2016 1,006 821 446.0%
2017 2,812 1,807 179.7%
2018 2,750 -63 -2.2%
2019 2,658 -91 -3.3%
2020 2,617 -41 -1.5%
2021 2,515 -103 -3.9%
Forecast 2022 2,547 32 1.3%
2023 2,642 95 3.7%
33
Forecast Contact:
Erik Sund 360-664-9374
Children’s Services Screened-In Reports
Caseload Forecast Council
February 11, 2022
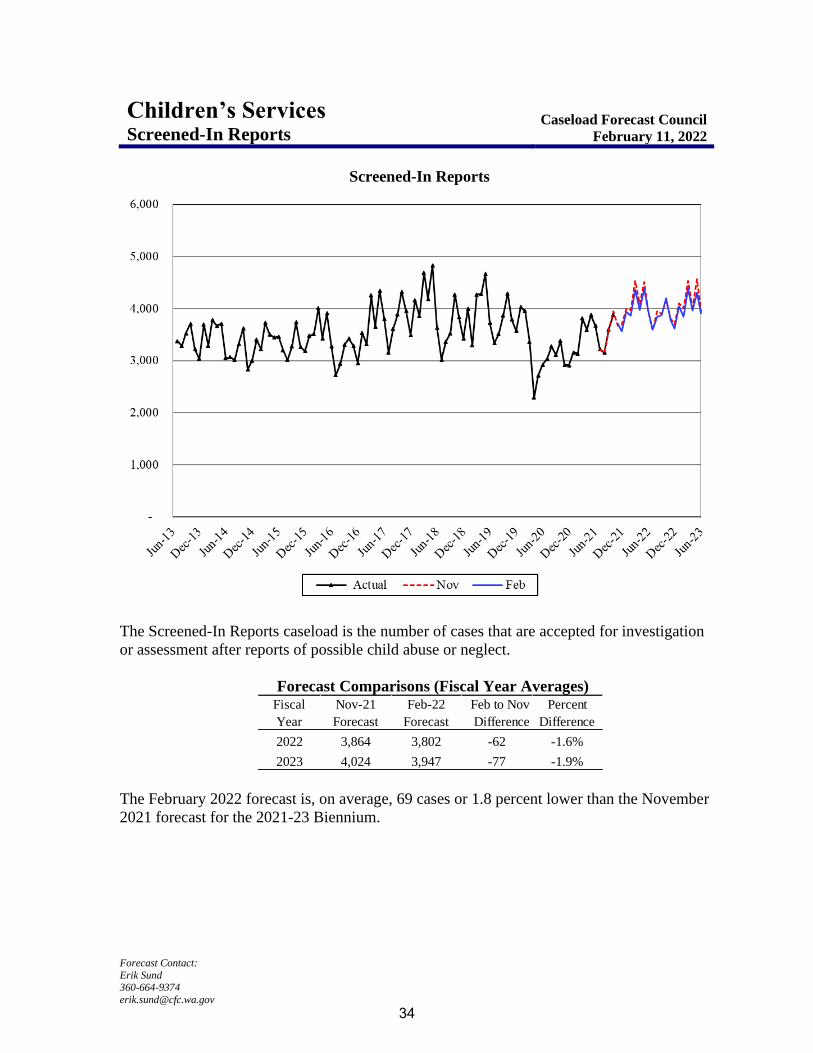
Screened-In Reports
The Screened-In Reports caseload is the number of cases that are accepted for investigation
or assessment after reports of possible child abuse or neglect.
Forecast Comparisons (Fiscal Year Averages)
The February 2022 forecast is, on average, 69 cases or 1.8 percent lower than the November
2021 forecast for the 2021-23 Biennium.
Fiscal
Year
Nov-21
Forecast
Feb-22
Forecast
Feb to Nov
Difference
Percent
Difference
2022 3,864 3,802 -62 -1.6%
2023 4,024 3,947 -77 -1.9%
34

Forecast Contact:
Erik Sund 360-664-9374
Tracking the Current Forecast
Actuals are tracking, on average, 18 cases or 0.5 percent below the November forecast.
This forecast assumes that the caseload for FY 2020 and FY 2021 were negatively impacted by
the COVID-19 pandemic and that, starting from January 2022, this caseload will gradually go
back to levels closer to those of the years immediately prior to the pandemic.
Fiscal Year Caseload Change
Risks to the Forecast
Risks to this forecast are high. The risks are due to both to uncertainty about the recovery
from the COVID-19 pandemic and to the historical volatility of this caseload.
Nov-21 Percent
Forecast Actual Variance Variance
Jul-21 3,222 3,222 0 0.0%
Aug-21 3,157 3,156 -1 0.0%
Sep-21 3,604 3,605 1 0.0%
Oct-21 3,957 3,884 -73 -1.8%
Fiscal Year Caseload
Change from
Prior Year
Percent
Change
Actual 2014 3,446
2015 3,302 -144 -4.2%
2016 3,443 141 4.3%
2017 3,464 21 0.6%
2018 3,984 520 15.0%
2019 3,808 -176 -4.4%
2020 3,472 -336 -8.8%
2021 3,324 -148 -4.3%
Forecast 2022 3,802 478 14.4%
2023 3,947 145 3.8%
35

Forecast Contact:
Erik Sund 360-664-9374
Children’s Services Licensed Foster Care
Caseload Forecast Council
February 11, 2022
Licensed Foster Care
The Licensed Foster Care (LFC) caseload is a forecast of the number of children in licensed
foster care during a calendar month. Financial assistance for licensed foster care includes a
monthly stipend, medical care, and a variety of additional services. This caseload has two
components – Basic Foster Care & Receiving Care (BFCRC) and Behavioral Rehabilitation
Services (BRS).
Forecast Comparisons (Fiscal Year Averages)
The February 2022 forecast is, on average, 155 cases or 2.8 percent lower than the November
2021 forecast for the 2021-23 Biennium.
Fiscal
Year
Nov-21
Forecast
Feb-22
Forecast
Feb to Nov
Difference
Percent
Difference
2022 5,304 5,189 -115 -2.2%
2023 5,650 5,455 -195 -3.5%
36
Forecast Contact:
Erik Sund 360-664-9374
Tracking the Current Forecast
Actuals are tracking, on average, 49 cases or 0.9 percent below the November forecast.
The BFCRC caseload has been declining since April 2019, and the COVID-19 pandemic
amplified the decline. The BRS caseload has experienced a similar trend since 2018. A BRS
provider rate increase in October 2019 resulted in a temporary capacity increase, but the caseload
resumed its decline with the onset of the pandemic. The combined LFC forecast assumes that the
impact of the pandemic will begin to ease after January 2022, aided by the increased availability
of vaccines. A step adjustment is included in the forecast to reflect this assumption.
Fiscal Year Caseload Change
Risks to the Forecast
Risks to the LFC caseload forecast are high because of the uncertainty associated both with
COVID-19 impacts and the causes of the caseload decline observed prior to the pandemic.
Nov-21 Percent
Forecast Actual Variance Variance
Jul-21 5,264 5,288 24 0.5%
Aug-21 5,261 5,245 -16 -0.3%
Sep-21 5,214 5,150 -64 -1.2%
Oct-21 5,256 5,115 -141 -2.7%
Fiscal Year Caseload
Change from
Prior Year
Percent
Change
Actual 2014 6,197
2015 6,198 0 0.0%
2016 6,251 53 0.9%
2017 6,467 216 3.5%
2018 6,493 25 0.4%
2019 6,463 -29 -0.5%
2020 5,980 -484 -7.5%
2021 5,497 -482 -8.1%
Forecast 2022 5,189 -309 -5.6%
2023 5,455 266 5.1%
37

Forecast Contact:
Erik Sund 360-664-9374
Children’s Services Extended Foster Care
Caseload Forecast Council
February 11, 2022
Extended Foster Care
The Extended Foster Care (EFC) caseload is the count of youth receiving certain foster care
benefits after turning 18 years old. EFC is intended to promote better outcomes for youth
who have aged out of the traditional foster care system.
Forecast Comparisons (Fiscal Year Averages)
The February 2022 forecast is, on average, 10 cases or 1.2 percent lower than the November
2021 forecast for the 2021-23 Biennium.
Fiscal
Year
Nov-21
Forecast
Feb-22
Forecast
Feb to Nov
Difference
Percent
Difference
2022 901 891 -10 -1.1%
2023 871 860 -11 -1.3%
38

Forecast Contact:
Erik Sund 360-664-9374
Tracking the Current Forecast
Actuals are tracking, on average, 15 cases or 1.5 percent above the November forecast.
This program has experienced many policy changes which have expanded eligibility for the
program and increased the caseload. The November forecast reflected the impact of the last
months of a temporary policy change, effective April 2020, that allowed youth who turn 21
while enrolled in EFC to continue receiving EFC support through September 2021.
Fiscal Year Caseload Change
Risks to the Forecast
The risks to the EFC forecast are moderate. The future rate of caseload growth is less certain
because program participation was directly impacted by a variety of policy changes in recent
years.
Nov-21 Percent
Forecast Actual Variance Variance
Jul-21 1,063 1,073 10 0.9%
Aug-21 1,079 1,094 15 1.4%
Sep-21 1,101 1,126 25 2.3%
Oct-21 829 839 10 1.2%
Fiscal Year Caseload
Change from
Prior Year
Percent
Change
Actual 2014 259
2015 365 106 40.8%
2016 465 100 27.4%
2017 533 68 14.6%
2018 586 53 10.0%
2019 663 77 13.2%
2020 747 84 12.6%
2021 849 102 13.7%
Forecast 2022 904 55 6.5%
2023 860 -44 -4.9%
39
Forecast Contact:
Erik Sund 360-664-9374
Children’s Services Adoption Support
Caseload Forecast Council
February 11, 2022
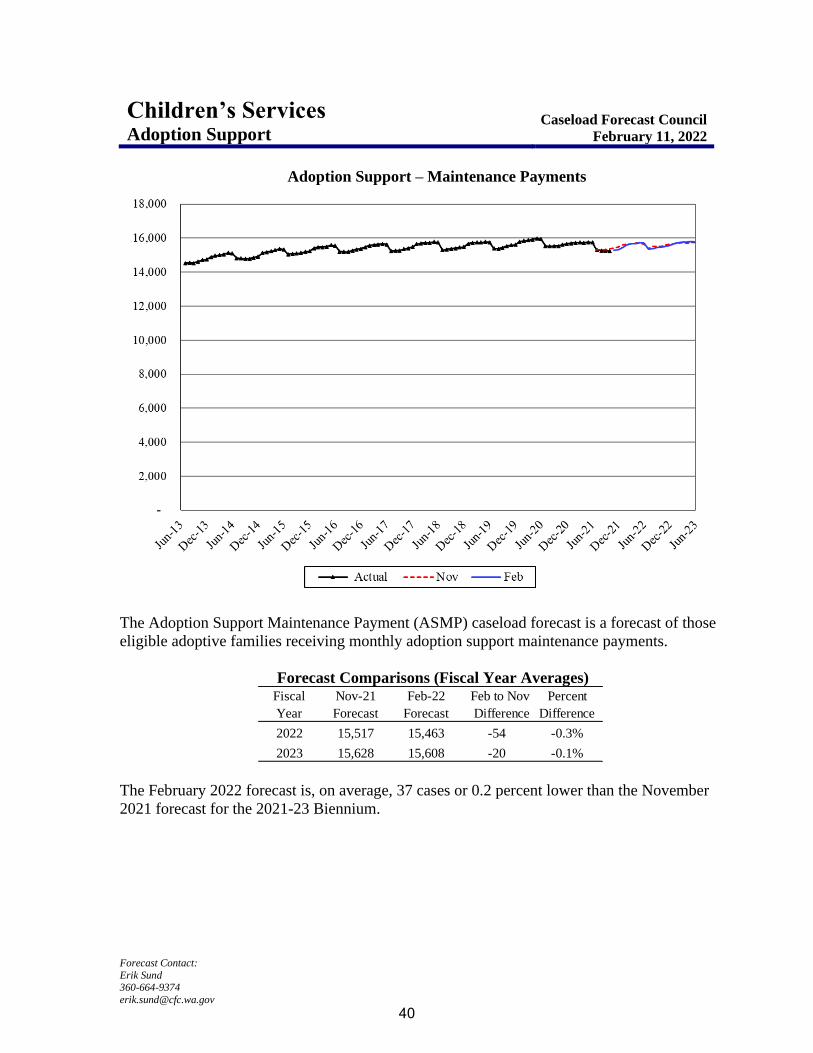
Adoption Support – Maintenance Payments
The Adoption Support Maintenance Payment (ASMP) caseload forecast is a forecast of those
eligible adoptive families receiving monthly adoption support maintenance payments.
Forecast Comparisons (Fiscal Year Averages)
The February 2022 forecast is, on average, 37 cases or 0.2 percent lower than the November
2021 forecast for the 2021-23 Biennium.
Fiscal
Year
Nov-21
Forecast
Feb-22
Forecast
Feb to Nov
Difference
Percent
Difference
2022 15,517 15,463 -54 -0.3%
2023 15,628 15,608 -20 -0.1%
40

Forecast Contact:
Erik Sund 360-664-9374
Tracking the Current Forecast
Actuals are tracking, on average, 63 cases or 0.4 percent below the November forecast.
This forecast assumes that the caseload for FY 2021 and early FY 2022 have been negatively
impacted by the COVID-19 pandemic and that, starting from January 2022, this caseload will
gradually return to levels more like those seen in the years immediately prior to the pandemic.
Fiscal Year Caseload Change
Risks to the Forecast
Risks to the ASMP forecast are low as it is a relatively stable caseload.
Nov-21 Percent
Forecast Actual Variance Variance
Jul-21 15,308 15,288 -20 -0.1%
Aug-21 15,308 15,271 -37 -0.2%
Sep-21 15,334 15,268 -66 -0.4%
Oct-21 15,379 15,251 -128 -0.8%
Fiscal Year Caseload
Change from
Prior Year
Percent
Change
Actual 2014 14,819
2015 15,043 224 1.5%
2016 15,317 274 1.8%
2017 15,432 115 0.8%
2018 15,530 98 0.6%
2019 15,566 36 0.2%
2020 15,693 127 0.8%
2021 15,655 -39 -0.2%
Forecast 2022 15,463 -192 -1.2%
2023 15,608 145 0.9%
41

Forecast Contact:
Shidong Zhang 360-664-9370
Medical Assistance Adult Caretakers and Children
Caseload Forecast Council
February 11, 2022
Medical Assistance for Adult Caretakers and Children
The Medical Assistance for Adult Caretakers and Children category is composed of seven
caseloads for parents/caretakers, pregnant clients, and children by citizenship and income level.
Forecast Comparisons (Fiscal Year Averages)
The February 2022 forecast is, on average, 37,078 cases or 3.7 percent higher than the November
2021 forecast for the 2021-23 Biennium.
Fiscal
Year
Nov-21
Forecast
Feb-22
Forecast
Feb to Nov
Difference
Percent
Difference
2022 1,043,180 1,071,302 28,123 2.7%
2023 945,195 991,229 46,034 4.9%
42

Forecast Contact:
Shidong Zhang 360-664-9370
Tracking the Current Forecast
Actuals are tracking, on average, 434 cases or a negligible percent above the November
forecast.
This February forecast updated two critical assumptions:
1. Extending the assumed Public Health Emergency (PHE) ending date from January 16,
2022 to June 30, 2022. In the PHE period, the Health Care Authority (HCA) cannot
terminate a client’s eligibility except for a few exemptions according to the Families
First Coronavirus Response Act (FFCRA), resulting in a continuous accumulation of
this caseload. On the other hand, it also reduced new enrollments and related potential
client pool. The changes of the PHE ending date assumption are the primary reason
for forecast changes in the pandemic period.
2. Extending the post-PHE eligibility re-determination completion time from 6 months
to 12 months. After the PHE, HCA will start to process the accumulated cases
according to federal requirements. The longer processing time assumption resulted in
a higher caseload forecast.
Fiscal Year Caseload Change
Risks to the Forecast
Risks to this forecast are high because of the uncertainties of the COVID-19 impact and
corresponding economic and policy impacts, especially the uncertainties of the PHE ending
time and the post PHE eligibility re-determination processing time.
Nov-21 Percent
Forecast Actual Variance Variance
Jul-21 1,045,983 1,047,056 1,073 0.1%
Aug-21 1,053,025 1,053,784 759 0.1%
Sep-21 1,058,108 1,058,561 454 0.0%
Oct-21 1,062,201 1,061,652 -549 -0.1%
Fiscal Year Caseload
Change from
Prior Year
Percent
Change
Actual 2014 889,916
2015 949,123 59,208 6.7%
2016 986,444 37,321 3.9%
2017 996,893 10,449 1.1%
2018 988,464 -8,430 -0.8%
2019 972,688 -15,776 -1.6%
2020 966,060 -6,628 -0.7%
2021 1,020,234 54,174 5.6%
Forecast 2022 1,071,302 51,068 5.0%
2023 991,229 -80,073 -7.5%
43
Forecast Contact:
Shidong Zhang 360-664-9370
Medical Assistance Low Income Adults
Caseload Forecast Council
February 11, 2022
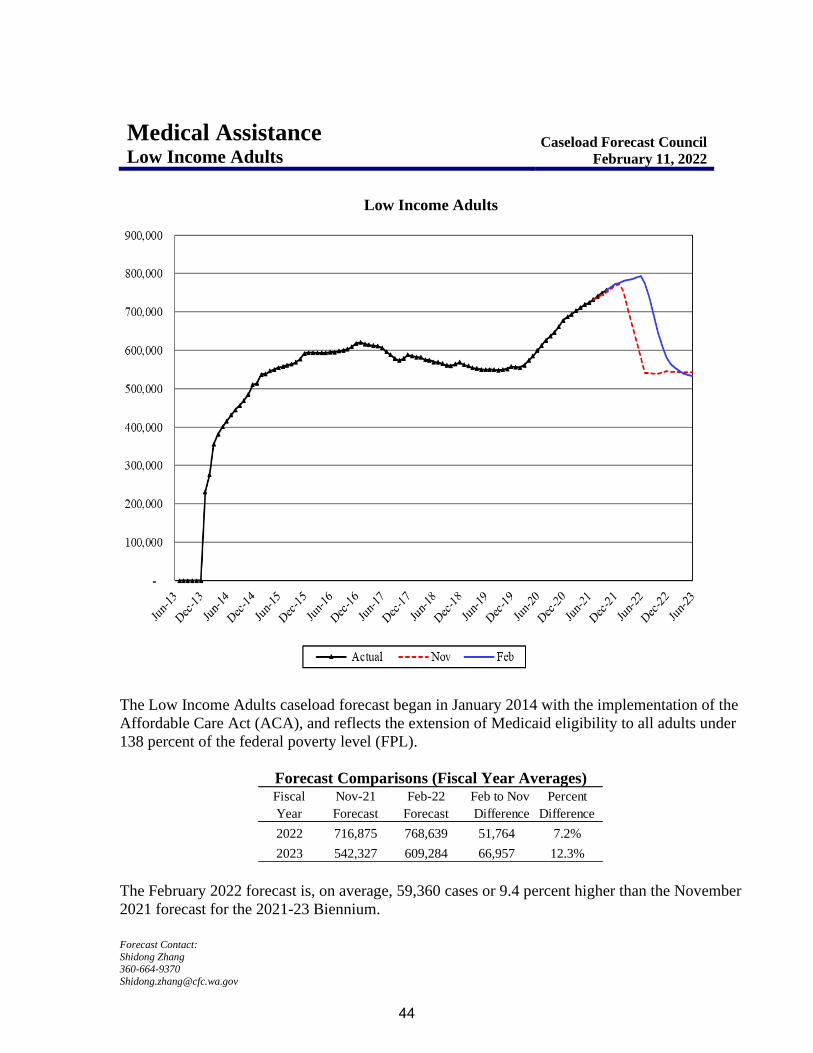
Low Income Adults
The Low Income Adults caseload forecast began in January 2014 with the implementation of the
Affordable Care Act (ACA), and reflects the extension of Medicaid eligibility to all adults under
138 percent of the federal poverty level (FPL).
Forecast Comparisons (Fiscal Year Averages)
The February 2022 forecast is, on average, 59,360 cases or 9.4 percent higher than the November
2021 forecast for the 2021-23 Biennium.
Fiscal
Year
Nov-21
Forecast
Feb-22
Forecast
Feb to Nov
Difference
Percent
Difference
2022 716,875 768,639 51,764 7.2%
2023 542,327 609,284 66,957 12.3%
44

Forecast Contact:
Shidong Zhang 360-664-9370
Tracking the Current Forecast
Actuals are tracking, on average, 3,525 cases or 0.5 percent above the November forecast.
This February forecast updated two critical assumptions:
1. Extending the assumed Public Health Emergency (PHE) ending date from January 16,
2022 to June 30, 2022. In the PHE period, the Health Care Authority (HCA) cannot
terminate a client’s eligibility except for a few exemptions according to the Families
First Coronavirus Response Act (FFCRA), resulting in a continuous accumulation of
this caseload. On the other hand, it also reduced new enrollments and related potential
client pool. The changes of the PHE ending date assumption are the primary reason
for forecast changes in the pandemic period.
2. Extending the post-PHE eligibility re-determination completion time from 6 months
to 12 months. After the PHE, HCA will start to process the accumulated cases
according to federal requirements. The longer processing time assumption resulted in
a higher caseload forecast.
Fiscal Year Caseload Change
Risks to the Forecast
Risks to this forecast are high because of the uncertainties of the COVID-19 impact and
corresponding economic and policy impacts, especially the uncertainties of the PHE ending time
and the post PHE eligibility re-determination processing time.
Nov-21 Percent
Forecast Actual Variance Variance
Jul-21 732,046 732,740 693 0.1%
Aug-21 738,881 741,489 2,608 0.4%
Sep-21 744,825 749,728 4,904 0.7%
Oct-21 750,564 756,457 5,893 0.8%
Fiscal Year Caseload
Change from
Prior Year
Percent
Change
Actual 2014 171,842
2015 503,331 331,489 192.9%
2016 582,126 78,795 15.7%
2017 608,845 26,719 4.6%
2018 581,128 -27,717 -4.6%
2019 559,726 -21,402 -3.7%
2020 561,665 1,938 0.3%
2021 675,256 113,592 20.2%
Forecast 2022 768,639 93,383 13.8%
2023 609,284 -159,355 -20.7%
45
Forecast Contact:
Shidong Zhang 360-664-9370
Medical Assistance Aged, Disabled and Other Medical
Caseload Forecast Council
February 11, 2022
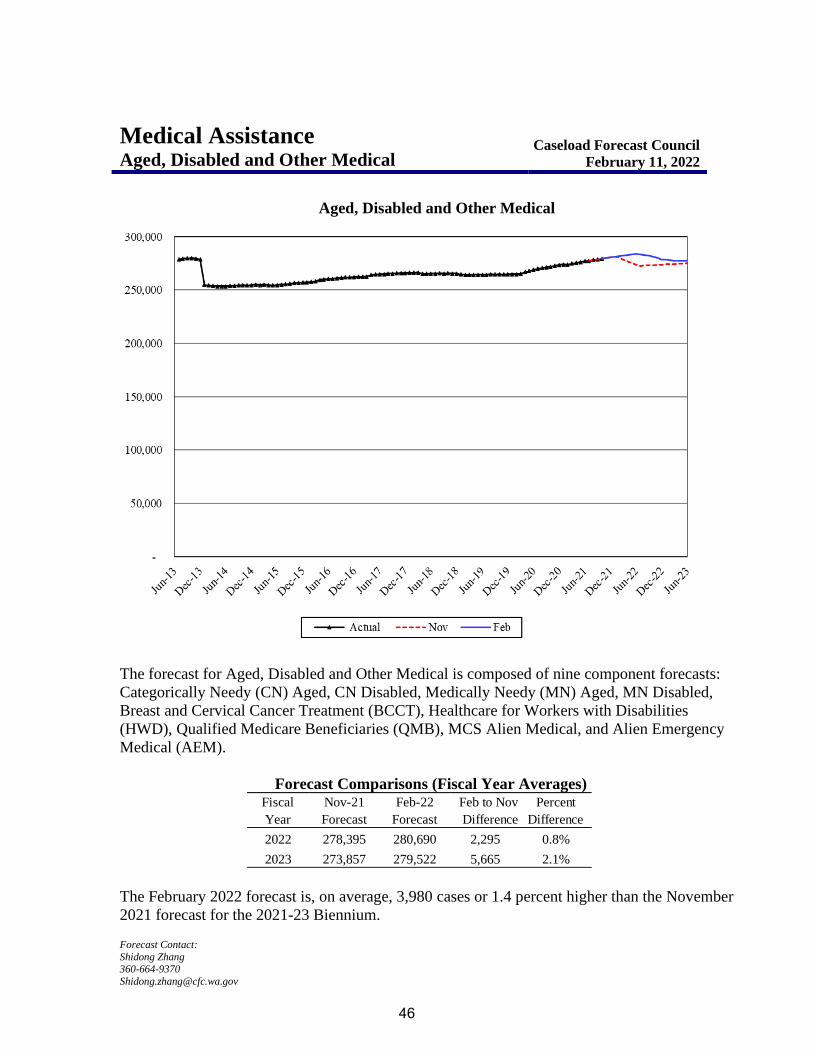
Aged, Disabled and Other Medical
The forecast for Aged, Disabled and Other Medical is composed of nine component forecasts:
Categorically Needy (CN) Aged, CN Disabled, Medically Needy (MN) Aged, MN Disabled,
Breast and Cervical Cancer Treatment (BCCT), Healthcare for Workers with Disabilities
(HWD), Qualified Medicare Beneficiaries (QMB), MCS Alien Medical, and Alien Emergency
Medical (AEM).
Forecast Comparisons (Fiscal Year Averages)
The February 2022 forecast is, on average, 3,980 cases or 1.4 percent higher than the November
2021 forecast for the 2021-23 Biennium.
Fiscal
Year
Nov-21
Forecast
Feb-22
Forecast
Feb to Nov
Difference
Percent
Difference
2022 278,395 280,690 2,295 0.8%
2023 273,857 279,522 5,665 2.1%
46

Forecast Contact:
Shidong Zhang 360-664-9370
Tracking the Current Forecast
Actuals are tracking, on average, 100 cases or a negligible percent below the November
forecast.
This February forecast updated two critical assumptions:
1. Extending the assumed Public Health Emergency (PHE) ending date from January 16,
2022 to June 30, 2022. In the PHE period, the Health Care Authority (HCA) cannot
terminate a client’s eligibility except for a few exemptions according to the Families
First Coronavirus Response Act (FFCRA), resulting in a continuous accumulation of
this caseload. On the other hand, it also reduced new enrollments and related potential
client pool. The changes of the PHE ending date assumption are the primary reason
for forecast changes in the pandemic period.
2. Extending the post-PHE eligibility re-determination completion time from 6 months
to 12 months. After the PHE, HCA will start to process the accumulated cases
according to federal requirements. The longer processing time assumption resulted in
a higher caseload forecast.
Fiscal Year Caseload Change
Risks to the Forecast
Risks to this forecast are high because of the uncertainties of the COVID-19 impact and
corresponding economic and policy impacts, especially the uncertainties of the PHE ending
time and the post PHE eligibility re-determination processing time.
Nov-21 Percent
Forecast Actual Variance Variance
Jul-21 277,498 277,360 -138 0.0%
Aug-21 278,127 278,086 -41 0.0%
Sep-21 278,765 278,759 -6 0.0%
Oct-21 279,463 279,248 -216 -0.1%
Fiscal Year Caseload
Change from
Prior Year
Percent
Change
Actual 2014 266,626
2015 254,523 -12,103 -4.5%
2016 257,518 2,995 1.2%
2017 262,535 5,017 1.9%
2018 265,611 3,075 1.2%
2019 264,910 -701 -0.3%
2020 265,572 662 0.3%
2021 273,448 7,876 3.0%
Forecast 2022 280,690 7,242 2.6%
2023 279,522 -1,167 -0.4%
47

Forecast Contact:
Shidong Zhang 360-664-9370
Long Term Care Nursing Homes
Caseload Forecast Council
February 11, 2022
Nursing Homes
The Nursing Homes (NH) forecast consists of Medicaid eligible clients who receive care in
state licensed nursing facilities. Nursing facilities provide care to eligible clients who require
short post-hospital, recuperative care, are no longer capable of independent living and require
nursing services or are patients with chronic disabilities needing long-term rehabilitation
and/or medical services.
Forecast Comparisons (Fiscal Year Averages)
The February 2022 forecast is, on average, 163 cases or 1.9 percent lower than the November
2021 forecast for the 2021-23 Biennium.
Fiscal
Year
Nov-21
Forecast
Feb-22
Forecast
Feb to Nov
Difference
Percent
Difference
2022 8,274 8,103 -171 -2.1%
2023 8,811 8,656 -155 -1.8%
48

Forecast Contact:
Shidong Zhang 360-664-9370
Tracking the Current Forecast
Actuals are tracking, on average, 87 cases or 1.1 percent below the November forecast.
The February forecast change reflects the extension of the Public Health Emergency (PHE)
ending date assumption from January 16, 2022 to June 30, 2022. As in previous forecasts, the
assumption of a caseload rebound to the pre-pandemic normal is pegged to PHE because PHE
reflects federal government’s belief of the pandemic situation.
Fiscal Year Caseload Change
This caseload has been hit hard by COVID-19. Many clients left NH facilities in the first two
pandemic waves around April 2020 and January 2021.
Risks to the Forecast
The risks to the nursing homes forecast are high due to the significant downward effect that the
COVID-19 pandemic has had on nursing homes. There are many layers of uncertainty in terms
of when the caseload will begin to rebound, how long a rebound will take, and at what level the
caseload reaches when it eventually resumes to a steady state.
Nov-21 Percent
Forecast Actual Variance Variance
Jul-21 7,925 7,899 -26 -0.3%
Aug-21 7,961 7,951 -10 -0.1%
Sep-21 8,101 7,875 -226 -2.8%
Fiscal Year Caseload
Change from
Prior Year
Percent
Change
Actual 2014 10,150
2015 10,032 -119 -1.2%
2016 9,915 -117 -1.2%
2017 9,775 -140 -1.4%
2018 9,706 -69 -0.7%
2019 9,635 -71 -0.7%
2020 9,212 -423 -4.4%
2021 7,968 -1,244 -13.5%
Forecast 2022 8,103 135 1.7%
2023 8,656 553 6.8%
49

Forecast Contact:
Shidong Zhang 360-664-9370
Long Term Care Home and Community Services (HCS)
Caseload Forecast Council
February 11, 2022
Home and Community Services
The Home and Community Services (HCS) promote, plan, develop, and provide long-term
care services for persons with disabilities and the elderly who may need Medicaid to help pay
for them. The services can be provided through individual provider (IP), agency provider
(AP), adult family homes (AFH), adult residential centers (ARC), assisted living (AL), and
Program of All-inclusive Care for the Elderly (PACE).
Forecast Comparisons (Fiscal Year Averages)
The February 2022 forecast is, on average, 810 cases or 1.2 percent lower than the November
2021 forecast for the 2021-23 Biennium.
Fiscal
Year
Nov-21
Forecast
Feb-22
Forecast
Feb to Nov
Difference
Percent
Difference
2022 64,779 64,032 -746 -1.2%
2023 67,239 66,364 -874 -1.3%
50

Forecast Contact:
Shidong Zhang 360-664-9370
Tracking the Current Forecast
Actuals are tracking, on average, 670 cases or 1.0 percent below the November forecast.
The February forecast change is primarily due to adjusting the AP and ARC caseload forecasts
lower, largely because of a tight job market. In addition, this forecast added a step adjustment to
quantify a planned PACE program expansion starting in February 2022.
Fiscal Year Caseload Change
Caseload growth for the 2021-23 Biennium is projected to be lower than projected in the
November forecast, primarily due to the above-mentioned adjustment.
Risks to the Forecast
Risks to this forecast are moderate mainly due to a tight job market making it challenging to
hire qualified staff.
Nov-21 Percent
Forecast Actual Variance Variance
Jul-21 63,611 63,191 -420 -0.7%
Aug-21 63,889 63,175 -714 -1.1%
Sep-21 64,077 63,200 -877 -1.4%
Fiscal Year Caseload
Change from
Prior Year
Percent
Change
Actual 2014 49,714
2015 52,275 2,561 5.2%
2016 54,082 1,807 3.5%
2017 53,618 -464 -0.9%
2018 55,392 1,774 3.3%
2019 57,235 1,843 3.3%
2020 59,713 2,478 4.3%
2021 62,111 2,398 4.0%
Forecast 2022 64,032 1,921 3.1%
2023 66,364 2,332 3.6%
51

Forecast Contact:
Shidong Zhang (360) 664-9370
Developmental Disabilities Personal Care Services
Caseload Forecast Council
February 11, 2022
DDA Personal Care
The DDA Personal Care caseload includes adults and children receiving Medicaid personal
care services. These services can be provided through individual provider (IP), agency
provider (AP), adult family homes (AFH) or adult residential centers (ARC).
Forecast Comparisons (Fiscal Year Averages)
The February 2022 forecast is, on average, 423 cases or 2.5 percent lower than the November
2021 forecast for the 2021-23 Biennium.
Fiscal
Year
Nov-21
Forecast
Feb-22
Forecast
Feb to Nov
Difference
Percent
Difference
2022 16,552 16,184 -367 -2.2%
2023 17,173 16,695 -478 -2.8%
52

Forecast Contact:
Shidong Zhang (360) 664-9370
Tracking the Current Forecast
Actuals are tracking, on average, 340 cases or 2.1 percent below the November forecast.
The agency provider (AP) caseload has stabilized at a lower level after an initial COVID-related
exit spike in April 2020. The individual provider (IP) caseload shows significant exit jumps
related to COVID waves around April 2020 and January 2021, in addition to a relatively smaller
delta variant wave that not assumed in the November forecast. The AFH and ARC forecasts are
consistent with previous forecasts.
Fiscal Year Caseload Change
Risks to the Forecast
Risks to the overall forecast are moderate due to the volatility introduced by the COVID-19
pandemic, primarily impacting the Agency and Individual Provider caseload trends.
Nov-21 Percent
Forecast Actual Variance Variance
Jul-21 16,228 15,944 -284 -1.7%
Aug-21 16,292 15,986 -306 -1.9%
Sep-21 16,353 15,925 -428 -2.6%
Fiscal Year Caseload
Change from
Prior Year
Percent
Change
Actual 2014 12,672
2015 12,831 159 1.3%
2016 13,143 312 2.4%
2017 13,722 580 4.4%
2018 14,586 863 6.3%
2019 15,263 677 4.6%
2020 15,671 408 2.7%
2021 15,901 230 1.5%
Forecast 2022 16,184 283 1.8%
2023 16,695 511 3.2%
53