Usability 2009 J T Burns1 Usability & Usability Engineering.

Common Industry Format for Usability Test Reports1 Version 2.0, May 18, 2001 Comments and questions about this format: [email protected]
1 Produced by the NIST Industry USability Reporting project: www.nist.gov/iusr If you have any comments or questions about this document, please contact: [email protected]

Common Industry Format for Usability Test Reports
ii
Contents
1 Scope ..........................................................................................................................1
2 Conformance ...............................................................................................................1
3 Relationship to existing standards...............................................................................2
4 Definitions....................................................................................................................2 4.1 Usability.....................................................................................................................2 4.2 Effectiveness ..............................................................................................................2 4.3 Efficiency ...................................................................................................................2 4.4 Satisfaction ................................................................................................................2 4.5 Context of use ............................................................................................................2 4.6 User .......................................................................................................................2 4.7 User group..................................................................................................................3 4.8 Context of use ............................................................................................................3 4.9 Goal .......................................................................................................................3 4.10 Task .......................................................................................................................3
5 Report format...............................................................................................................3 5.1 Title Page...................................................................................................................3 5.2 Executive Summary ....................................................................................................4 5.3 Introduction.................................................................................................................4 5.4 Method.......................................................................................................................5 5.5 Results .................................................................................................................... 11 5.6 Appendices .............................................................................................................. 14
6 Bibliography .............................................................................................................. 14
Appendix A -- Checklist..................................................................................................... 15
Appendix B -- Glossary ..................................................................................................... 20

Common Industry Format for Usability Test Reports
iii
Introduction
The purpose of this technical specification is to facilitate incorporation of usability as part of the procurement decision-making process for interactive software products. Examples of such decisions include purchasing, upgrading and automating. It provides a common format for human factors engineers and usability professionals in supplier companies to report the methods and results of usability tests to customer organizations.
Audience
The Common Industry Format (CIF) is meant to be used by usability professionals within supplier organizations to generate reports that can be used by customer organizations. The CIF is also meant to be used by customer organizations to verify that a particular report is CIF-compliant. The Usability Test Report itself is intended for two types of readers:
?? Human factors or other usability professionals in customer organizations who are evaluating both the technical merit of usability tests and the usability of the products.
?? Other technical professionals and managers who are using the test results to make business decisions.
The Methods and Results sections are aimed at the first audience. These sections 1) describe the test methodology and results in sufficient technical detail to allow replication by another organization if the test is repeated, and 2) support application of test data to questions about the product’s expected costs and benefits. Understanding and interpreting these sections will require technical background in human factors or usability engineering for optimal use. The second audience is directed to the Introduction, which provides summary information for non-usability professionals and managers. The Introduction may also be of general interest to other computing professionals.
Additional Information
Appendix A provides a checklist that can be used to ensure inclusion of required and recommended information. A glossary is provided in Appendix B to define terminology used in the report format description. Appendix C contains a Word template for report production.

Common Industry Format for Usability Test Reports
1
Common Industry Format for Usability Test Reports
1 Scope This technical specification can be used to report the results of a test of usability as defined in ISO 9241-11: effectiveness, efficiency and satisfaction in a specified context of use. Metrics for other more detailed usability requirements can be found in ISO/IEC 9126 parts 2 and 3.
This international technical specification is intended to be used by:
?? usability professionals within supplier organizations to generate reports that can be used by customer organizations
?? customer organizations to verify that a particular report conforms to this international technical specification
?? human factors or other usability professionals in customer organizations who are evaluating both the technical merit of usability tests and the usability of the products
?? other technical professionals and managers in the customer organization who are using the test results to make business decisions.
The Executive Summary and Product Details in 5.2 and 5.3 provide summary information for non-usability professionals and managers.
5.4 and 5.5 describe the test methodology and results in technical detail suitable for replication, and also support application of test data to questions about the product’s expected costs and benefits. Understanding and interpreting these sections will require technical background in human factors or usability engineering for optimal use.
The report format assumes sound practice [1, 2] has been followed in the design and execution of the test. Test procedures which produce measures that summarize usability should be used, i.e., the test is summative in nature. Some usability evaluation methods, such as formative tests, are intended to identify problems rather than produce measures; the format is not structured to support the results of such testing methods.
The format is primarily aimed at software products, but can easily be adapted to specify requirements for hardware products.
2 Conformance A usability test report conforms to this international technical specification if it complies with all the requirements in this international technical specification (stated as “shall”). The recommendations (stated as “should”) should be implemented whenever appropriate.
This technical specification specifies the minimum information that should be provided. Additional information may be included.

Common Industry Format for Usability Test Reports
2
3 Relationship to existing standards This document is not formally related to standards-making efforts but has been informed by existing standards and is consistent with major portions of these documents but is more limited in scope.
ISO 9241-11:(1998) Ergonomic requirements for office work with visual display terminals (VDTs) - Part 11: Guidance on usability
ISO/IEC 14598-5(1998): Information technology – Software product evaluation -Part 5: Process for evaluators
ISO 13407(1999): Human-centred design processes for interactive systems – Annex C
ISO/IEC 9126-2(2001): Software Engineering – Product quality - Part 2: External metrics
ISO/IEC 9126-3(2001): Software engineering – Product quality - Part 3: Internal metrics
ISO/IEC 9126-4:(2001): Software engineering – Product quality - Part 4: Quality in use metrics
4 Definitions For the purposes of this document, the following definitions apply. The source for these definitions is [ISO 9241-11:1998]
4.1 Usability
The extent to which a product can be used by specified users to achieve specified goals with effectiveness, efficiency and satisfaction in a specified context of use.
4.2 Effectiveness
The accuracy and completeness with which users achieve specified goals.
4.3 Efficiency
The resources expended in relation to the accuracy and completeness with which users achieve goals.
4.4 Satisfaction
Freedom from discomfort, and positive attitudes towards the use of the product.
4.5 Context of use
The users, tasks, equipment (hardware, software and materials), and the physical and social environments in which a product is used.
4.6 User
The person who interacts with the product.
Common Industry Format for Usability Test Reports
3
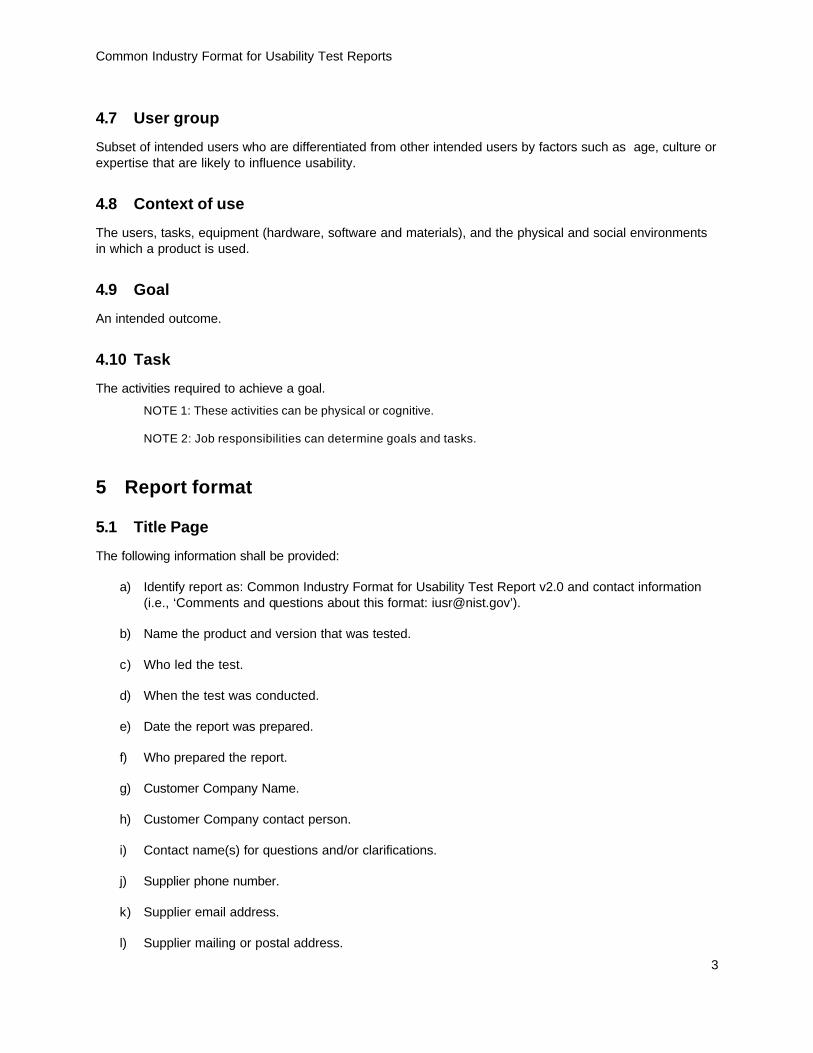
4.7 User group
Subset of intended users who are differentiated from other intended users by factors such as age, culture or expertise that are likely to influence usability.
4.8 Context of use
The users, tasks, equipment (hardware, software and materials), and the physical and social environments in which a product is used.
4.9 Goal
An intended outcome.
4.10 Task
The activities required to achieve a goal.
NOTE 1: These activities can be physical or cognitive.
NOTE 2: Job responsibilities can determine goals and tasks.
5 Report format
5.1 Title Page
The following information shall be provided:
a) Identify report as: Common Industry Format for Usability Test Report v2.0 and contact information (i.e., ‘Comments and questions about this format: [email protected]’).
b) Name the product and version that was tested.
c) Who led the test.
d) When the test was conducted.
e) Date the report was prepared.
f) Who prepared the report.
g) Customer Company Name.
h) Customer Company contact person.
i) Contact name(s) for questions and/or clarifications.
j) Supplier phone number.
k) Supplier email address.
l) Supplier mailing or postal address.
Common Industry Format for Usability Test Reports
4
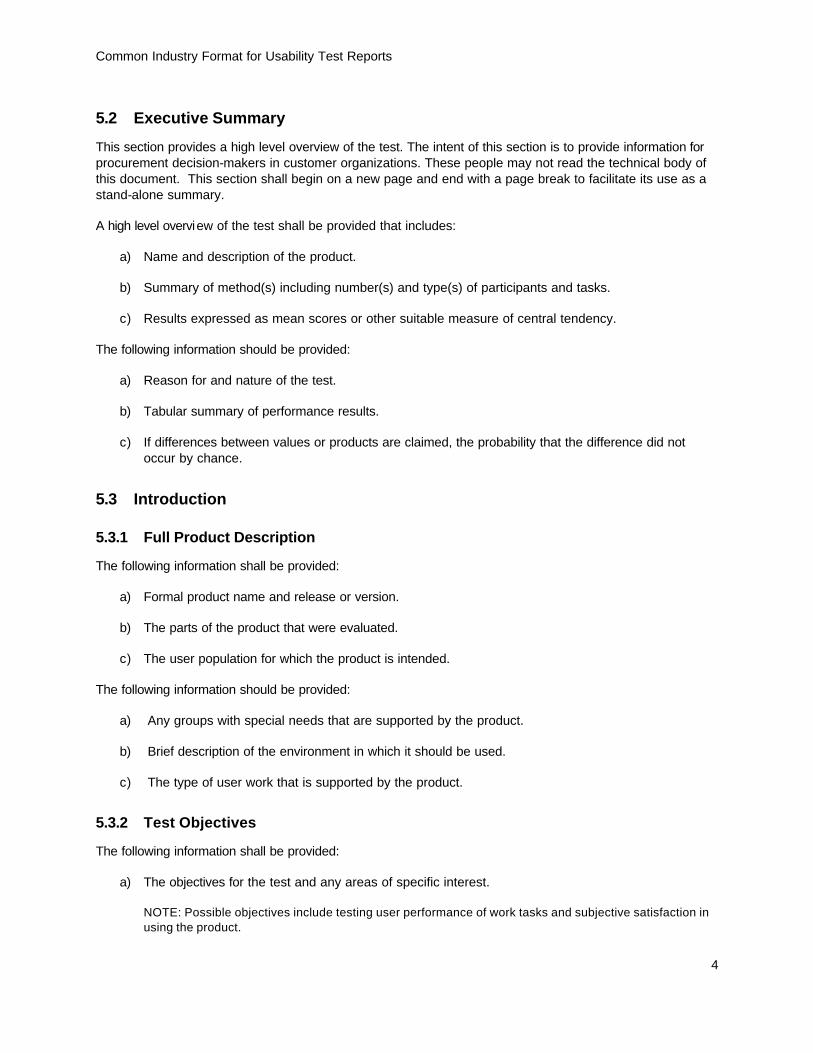
5.2 Executive Summary
This section provides a high level overview of the test. The intent of this section is to provide information for procurement decision-makers in customer organizations. These people may not read the technical body of this document. This section shall begin on a new page and end with a page break to facilitate its use as a stand-alone summary.
A high level overview of the test shall be provided that includes:
a) Name and description of the product.
b) Summary of method(s) including number(s) and type(s) of participants and tasks.
c) Results expressed as mean scores or other suitable measure of central tendency.
The following information should be provided:
a) Reason for and nature of the test.
b) Tabular summary of performance results.
c) If differences between values or products are claimed, the probability that the difference did not occur by chance.
5.3 Introduction
5.3.1 Full Product Description
The following information shall be provided:
a) Formal product name and release or version.
b) The parts of the product that were evaluated.
c) The user population for which the product is intended.
The following information should be provided:
a) Any groups with special needs that are supported by the product.
b) Brief description of the environment in which it should be used.
c) The type of user work that is supported by the product.
5.3.2 Test Objectives
The following information shall be provided:
a) The objectives for the test and any areas of specific interest.
NOTE: Possible objectives include testing user performance of work tasks and subjective satisfaction in using the product.
Common Industry Format for Usability Test Reports
5
b) Functions and components with which the user directly and indirectly interacted.
The following information should be provided:
a) Reason for focusing on a product subset, if the whole product was not tested.
5.4 Method
Sufficient information shall be provided to allow an independent tester to replicate the procedure used in testing.
5.4.1 Participants
The following information shall be provided:
a) The total number of participants tested.
NOTE: In order to generate valid summative statistical analyses, it is necessary to test sufficient numbers of subjects. Eight or more subjects/cell (segment) are recommended for this purpose [3].
b) Segmentation of user groups tested, if more than one.
c) Key characteristics and capabilities of user group.
d) How participants were selected; whether they had the essential characteristics.
e) Differences between the participant sample and the user population.
EXAMPLE: Actual users might attend a training course whereas test subjects were untrained.
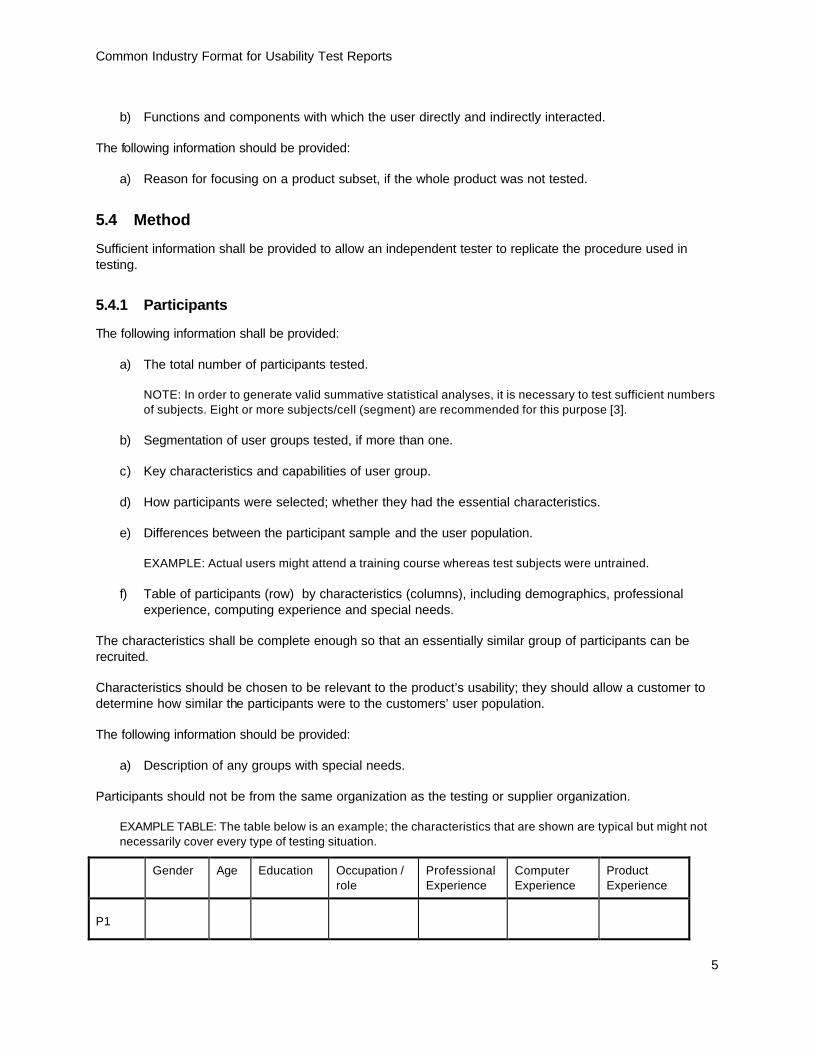
f) Table of participants (row) by characteristics (columns), including demographics, professional experience, computing experience and special needs.
The characteristics shall be complete enough so that an essentially similar group of participants can be recruited.
Characteristics should be chosen to be relevant to the product’s usability; they should allow a customer to determine how similar the participants were to the customers’ user population.
The following information should be provided:
a) Description of any groups with special needs.
Participants should not be from the same organization as the testing or supplier organization.
EXAMPLE TABLE: The table below is an example; the characteristics that are shown are typical but might not necessarily cover every type of testing situation.
Gender Age Education Occupation / role
Professional Experience
Computer Experience
Product Experience
P1

Common Industry Format for Usability Test Reports
6
P2
Pn
For ‘Gender’, indicate male or female.
For ‘Age’, state the chronological age of the participant, or indicate membership in an age range (e.g. 25-45) or age category (e.g. under 18, over 65) if the exact age is not known.
For ‘Education’, state the number of years of completed formal education (e.g., in the US a high school graduate would have 12 years of education and a college graduate 16 years).
For ‘Occupation/role’, describe the user’s job role when using the product. Use the Role title if known.
For ‘Professional experience’, give the amount of time the user has been performing in the role.
For ‘Computer experience’, describe relevant background such as how much experience the user has with the platform or operating system, and/or the product domain. This may be more extensive than one column.
For ‘Product experience’ indicate the type and duration of any prior experience with the product or with similar products.
5.4.2 Context of Product Use in the Test
The following information shall be provided:
a) Any known differences between the evaluated context and the expected context of use.
5.4.2.1 Tasks
The following information shall be provided:
a) The task scenarios for testing.
b) Why these tasks were selected.
EXAMPLES: The most frequent tasks, the most troublesome tasks.
c) The source of these tasks.
EXAMPLES: Observation of customers using similar products, product marketing specifications
d) Any task data given to the participants.
e) Completion or performance criteria established for each task.
5.4.2.2 Test Facility
The following information should be provided:
a) The setting and type of space in which the evaluation was conducted.
Common Industry Format for Usability Test Reports
7
EXAMPLES: Usability lab, cubicle office, meeting room, home office, home family room, manufacturing floor
b) Any relevant features or circumstances that could affect the results.
EXAMPLES: Video and audio recording equipment, one-way mirrors, or automatic data collection equipment
5.4.2.3 Participant’s Computing Environment
The following information shall provide enough information to replicate and validate the test, including:
a) Computer configuration, including model, OS version, required libraries or settings.
b) If used, browser name and version; relevant plug-in names and versions.
5.4.2.3.1 Display Devices
The following information shall be provided:
a) If screen-based, screen size, resolution, and color setting.
b) If print-based, the media size and print resolution.
c) If visual interface elements (such as fonts) can vary in size, specify the size(s) used in the test.
5.4.2.3.2 Audio Devices
The following information should be provided:
a) If used, the relevant settings or values for the audio bits, volume, etc.
5.4.2.3.3 Manual Input Devices
The following information should be provided:
a) If used, the make and model of devices used in the test.
5.4.2.4 Test Administrator Tools
The following information shall be provided:
a) If a standard questionnaire was used, describe or specify it here.
NOTE: Customized questionnaires are included in an appendix.
The following information should be provided:
a) Any hardware or software used to control the test or to record data.

Common Industry Format for Usability Test Reports
8
5.4.3 Experimental Design
The following information shall be provided:
a) The logical design of the test.
b) The independent variables and control variables.
c) The measures for which data were recorded for each set of conditions.
5.4.3.1 Procedure
The following information shall be provided:
a) Operational definitions of measures.
b) Descriptions of independent variables or control variables.
c) Time limits on tasks.
d) Policies and procedures for interaction between tester(s) and subjects.
The following information should be provided:
a) Sequence of events from greeting the participants to dismissing them.
b) Details of non-disclosure agreements, form completion, warm-ups, pre-task training, and debriefing.
c) Verification that the participants knew and understood their rights as human subjects [4].
d) Steps followed to execute the test sessions and record data.
e) Number and roles of people who interacted with the participants during the test session.
f) Whether other individuals were present in the test environment.
g) Whether participants were paid or otherwise compensated.
5.4.3.2 Participant General Instructions
The following information shall be provided:
a) Instructions given to the participants (here or in an Appendix).
b) Instructions on how participants were to interact with any other persons present, including how they were to ask for assistance and interact with other participants, if applicable.
5.4.3.3 Participant Task Instructions
The following information shall be provided:
a) Task instruction summary.
Common Industry Format for Usability Test Reports
9
5.4.4 Usability Metrics
As defined in Section 4.1, usability is measured by three types of metrics: effectiveness, efficiency, and satisfaction.
The following information shall be provided:
a) Metrics for effectiveness.
b) Metrics for efficiency.
c) Metrics for satisfaction.
Effectiveness and efficiency results shall be reported, even when they are difficult to interpret within the specified context of use. In this case, the report shall specify why the supplier does not consider the metrics meaningful.
EXAMPLE: Suppose that the context of use for the product includes real time, open-ended interaction between close associates. In this case, Time-On-Task may not be meaningfully interpreted as a measure of efficiency, because for many users, time spent on this task is “time well spent”.
If it is necessary to provide participants with assists, efficiency and effectiveness metrics shall be provided for both unassisted and assisted conditions, and the number and type of assists shall be included as part of the test results.
5.4.4.1 Effectiveness
Effectiveness relates the goals of using the product to the accuracy and completeness with which these goals can be achieved. Common measures of effectiveness include percent task completion, frequency of errors, frequency of assists to the participant from the testers, and frequency of accesses to help or documentation by the participants during the tasks. It does not take account of how the goals were achieved, only the extent to which they were achieved. Efficiency relates the level of effectiveness achieved to the quantity of resources expended.
5.4.4.1.1 Completion Rate
The completion rate is the percentage of participants who completely and correctly achieve each task goal. If goals can be partially achieved (e.g., by incomplete or sub-optimum results) then it may also be useful to report the average goal achievement, scored on a scale of 0 to 100% based on specified criteria related to the value of a partial result. For example, a spell-checking task might involve identifying and correcting 10 spelling errors and the completion rate might be calculated based on the percent of errors corrected. Another method for calculating completion rate is weighting; e.g., spelling errors in the title page of the document are judged to be twice as important as errors in the main body of text. The rationale for choosing a particular method of partial goal analysis should be stated, if such results are included in the report.
The following information shall be provided:
a) The percentage of participants who completely and correctly achieve each task goal.
5.4.4.1.2 Errors

Common Industry Format for Usability Test Reports
10
Errors are instances where test participants did not complete the task successfully, or had to attempt portions of the task more than once. Scoring of data should include classifying errors according to some taxonomy, such as in [5].
5.4.4.1.3 Assists
When participants cannot proceed on a task, the test administrator sometimes gives direct procedural help in order to allow the test to proceed. This type of tester intervention is called an assist for the purposes of this report.
The following information shall be provided:
a) The unassisted completion rate (i.e. the rate achieved without intervention from the testers) as well as the assisted rate (i.e. the rate achieved with tester intervention) where these two metrics differ.
For example, if a participant received an assist on Task A, that participant should not be included among those successfully completing the task when calculating the unassisted completion rate for that task. However, if the participant went on to successfully complete the task following the assist, he could be included in the assisted Task A completion rate. When assists are allowed or provided, the number and type of assists shall be included as part of the test results.
In some usability tests, participants are instructed to use support tools such as online help or documentation, which are part of the product, when they cannot complete tasks on their own. Accesses to product features which provide information and help are not considered assists for the purposes of this report. It may, however, be desirable to report the frequency of accesses to different product support features, especially if they factor into participants’ ability to use products independently.
5.4.4.2 Efficiency
Efficiency relates the level of effectiveness achieved to the quantity of resources expended. Efficiency is generally assessed by the mean time taken to achieve the task. Efficiency may also relate to other resources (e.g. total cost of usage). A common measure of efficiency is time on task.
The following information shall be provided:
a) The mean time taken to complete each task, together with the range and standard deviation of times across participants.
5.4.4.2.1 Completion Rate/Mean Time-On-Task
Completion Rate / Mean Time-On-Task is another measure of efficiency [5]. The relationship of success rate to time allows customers to compare fast error-prone interfaces (e.g., command lines with wildcards to delete files) to slow easy interfaces (e.g., using a mouse and keyboard to drag each file to the trash).
5.4.4.3 Satisfaction
The following information shall be provided:
a) One or more measures of user satisfaction.
Common Industry Format for Usability Test Reports
11
Satisfaction describes a user’s subjective response when using the product. User satisfaction may be an important correlate of motivation to use a product and may affect performance in some cases. Questionnaires to measure satisfaction and associated attitudes are commonly built using Likert and semantic differential scales.
A variety of instruments are available for measuring user satisfaction of software interactive products, and many companies create their own. Whether an external, standardized instrument is used or a customized instrument is created, subjective rating dimensions such as Satisfaction, Usefulness, and Ease of Use should be considered for inclusion, as these will be of general interest to customer organizations.
A number of questionnaires are available that are widely used. They include: ASQ [7], CUSI [8], PSSUQ [8], QUIS [9], SUMI [10], and SUS [11]). While each offers unique perspectives on subjective measures of product usability, most include measurements of Satisfaction, Usefulness, and Ease of Use.
Suppliers may choose to use validated published satisfaction measures or may submit satisfaction metrics they have developed themselves.
5.5 Results
5.5.1 Data Analysis
The following information shall be provided in sufficient detail to allow replication of the data scoring methods by another organization if the test is repeated:
a) Data collection and scoring.
EXAMPLE: How data was treated with respect to exclusion of outliers, categorization of error data, and criteria for scoring assisted or unassisted completion.
b) Data reduction.
EXAMPLE: How data were collapsed across tasks or task categories.
c) Statistical analysis.
EXAMPLE: Statistical procedures (e.g. transformation of the data) and tests (e.g. t-tests, F tests and statistical significance of differences between groups).
Scores that are reported as means shall include the standard deviation and optionally the standard error of the mean.
5.5.2 Presentation of the Results
The following information shall be provided:
a) Tabular performance results per task or task group.
Various graphical formats are effective in describing usability data at a glance. Bar graphs are useful for describing subjective data such as that gleaned from Likert scales. A variety of plots can be used effectively to show comparisons of expert benchmark times for a product vs. the mean participant performance time. The data may be accompanied by a brief explanation of the results but detailed interpretation is discouraged.
Common Industry Format for Usability Test Reports
12
5.5.2.1 Performance Results
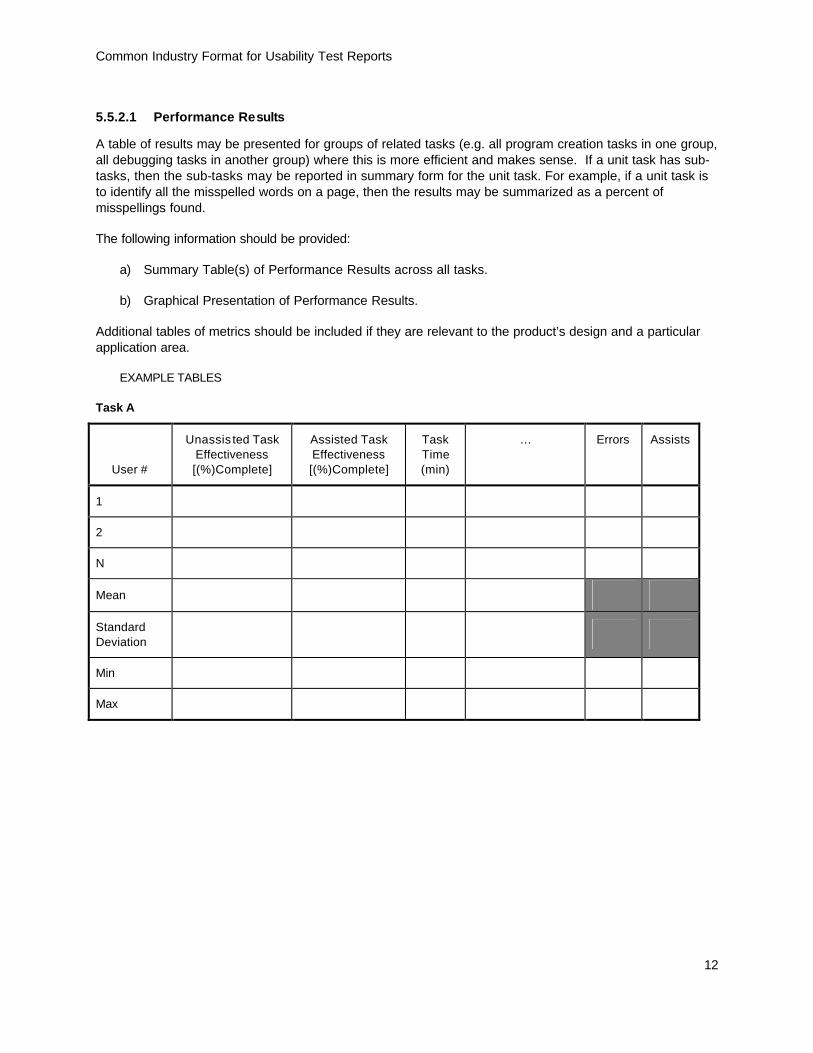
A table of results may be presented for groups of related tasks (e.g. all program creation tasks in one group, all debugging tasks in another group) where this is more efficient and makes sense. If a unit task has sub-tasks, then the sub-tasks may be reported in summary form for the unit task. For example, if a unit task is to identify all the misspelled words on a page, then the results may be summarized as a percent of misspellings found.
The following information should be provided:
a) Summary Table(s) of Performance Results across all tasks.
b) Graphical Presentation of Performance Results.
Additional tables of metrics should be included if they are relevant to the product’s design and a particular application area.
EXAMPLE TABLES
Task A
User #
Unassis ted Task Effectiveness [(%)Complete]
Assisted Task Effectiveness [(%)Complete]
Task Time (min)
… Errors Assists
1
2
N
Mean
Standard Deviation
Min
Max

Common Industry Format for Usability Test Reports
13
Summary
User #
Total Unassisted Task Effectiveness
[(%)Complete]
Total Assisted Task
Effectiveness [(%)Complete]
Total Task Time (min)
… Total Errors
Total Assists
1
2
N
Mean
Standard Deviation
Min
Max
5.5.2.2 Satisfaction Results
The following information shall be provided:
a) Tabular Satisfaction Results.
b) Summary table(s) of Satisfaction Results.
c) Graphical presentation of Satisfaction Results.
EXAMPLE TABLE
Satisfaction
User # Scale 1 Scale 2 Scale 3 … Scale N
1
2
N
Mean
Standard Deviation
Min
Max

Common Industry Format for Usability Test Reports
14
5.6 Appendices
The following information shall be provided:
a) Custom questionnaires, if used.
b) Participant general Instructions (if not in the body of the report).
c) Participant task Instructions.
The following information may be provided:
a) Release Notes explaining or updating the test results.
6 Bibliography 1. Rubin, J. (1994). Handbook of Usability Testing, How to Plan, Design, and Conduct Effective Tests.
New York: John Wiley & Sons, Inc.
2. Dumas, J. & Redish, G. (1999). A Practical Guide to Usability Testing. UK: Intellect.
3. Nielsen, J. & Landauer, T. K. (1993). A mathematical model of the finding of usability problems. In: CHI '93. Conference proceedings on Human factors in computing systems, 206-213
4. American Psychological Association. Ethical Principles in the Conduct of Research with Human Participants. 1982.
5. Norman, D.A. (1983). Design rules based on analyses of human error. Communications of the ACM, 26(4), 254-258.
6. Macleod, M., Bowden, R., Bevan, N. & Curson, I. (1997). The MUSiC Performance Measurement method, Behaviour and Information Technology, 16, 279-293.
7. Lewis, J. R. (1991). Psychometric evaluation of an after-scenario questionnaire for computer usability studies: the ASQ. SIGCHI Bulletin, 23(1), 78-81.
8. Lewis, J. R. (1995). IBM Computer usability satisfaction questionnaires: psychometric evaluation and instructions for use. International Journal of Human-Computer Interaction, 7, 57-78.
9. Chin, J. P., Diehl, V. A., and Norman, K. (1988). Development of an instrument measuring user satisfaction of the human-computer interface. In: CHI '88. Conference proceedings on Human factors in computing systems, 213-218.
10. Kirakowski, J. (1996). The software usability measurement inventory: Background and usage. In Jordan, P., Thomas, B., and Weerdmeester, B. (Eds.), Usability Evaluation in Industry. UK: Taylor and Francis.
11. Brooke, J. (1996). SUS: A “quick and dirty” usability scale. Usability Evaluation in Industry. UK: Taylor and Francis.

Common Industry Format for Usability Test Reports
15
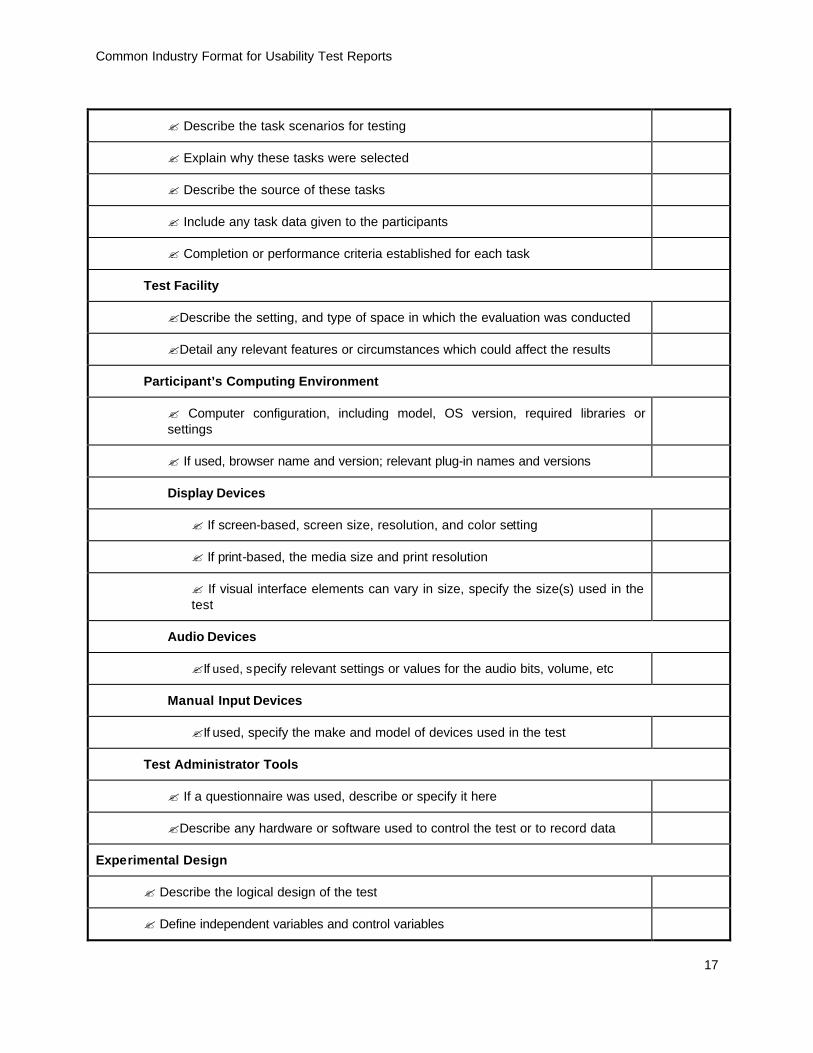
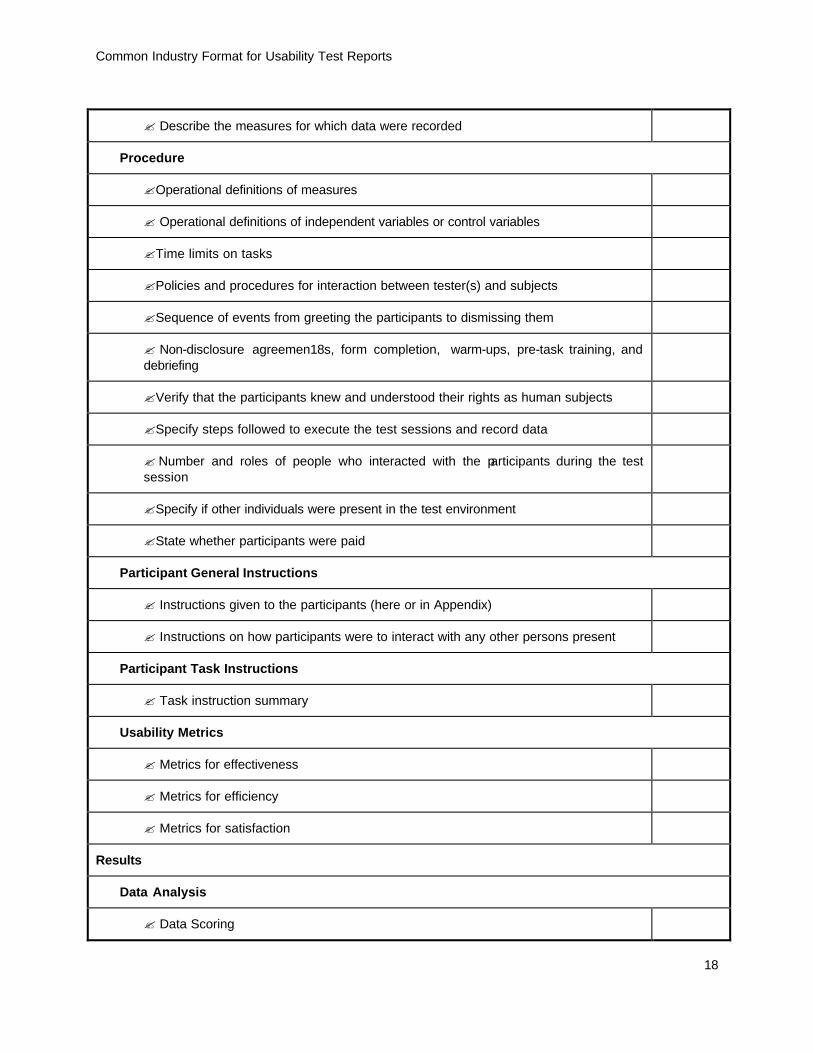
Appendix A -- Checklist
Use the following checklist to assure that required elements (?) are addressed in your CIF report. Recommended items are denoted with a ‘?’. Report corrections and suggestions to [email protected].
Title Page
? Enter Company Logo or Name
? Identify report as: Common Industry Format for Usability Test Report v2.0
? Name the product and version that was tested
? Who led the test
? When the test was conducted
? Date the report was prepared
? Who prepared the report
? Customer Company Name
? Customer Company contact person
? Contact name(s) for questions and/or clarifications
? Enter phone number
? Enter email address
? Enter mailing or postal address
Executive Summary
? Provide a high level overview of the test?
? Name and describe the product
? Summary of method(s) including number and type of participants and tasks
? Results expressed as mean scores or other suitable measure of central tendency
? Reason for and nature of the test
? Tabular summary of performance results
? If differences are claimed, the associated statistical probability?

Common Industry Format for Usability Test Reports
16
? Start on new page; end with page break
Introduction
Full Product Description
? Formal product name and release or version
? Describe what parts of the product were evaluated
? The user population for which the product is intended
? Any groups with special needs
? Brief description of the environment in which it should be used
? The type of user work that is supported by the product
Test Objectives
? State the objectives for the test and any areas of specific interest
? Functions and components with which the user directly and indirectly interacted
? Reason for focusing on a product subset
Method
Participants
? The total number of participants tested
? Segmentation of user groups tested, if more than one
? Key characteristics and capabilities of user group
? How participants were selected; whether they had the essential characteristics
? Differences between the participant sample and the user population
? Table of participant (row) characteristics (columns)
? Description of groups with special needs?
Context of Product Use in the Test
?Any known differences between the evaluated context and the expected context of use
Tasks
Common Industry Format for Usability Test Reports
17
? Describe the task scenarios for testing
? Explain why these tasks were selected
? Describe the source of these tasks
? Include any task data given to the participants
? Completion or performance criteria established for each task
Test Facility
? Describe the setting, and type of space in which the evaluation was conducted
? Detail any relevant features or circumstances which could affect the results
Participant’s Computing Environment
? Computer configuration, including model, OS version, required libraries or settings
? If used, browser name and version; relevant plug-in names and versions
Display Devices
? If screen-based, screen size, resolution, and color setting
? If print-based, the media size and print resolution
? If visual interface elements can vary in size, specify the size(s) used in the test
Audio Devices
? If used, specify relevant settings or values for the audio bits, volume, etc
Manual Input Devices
? If used, specify the make and model of devices used in the test
Test Administrator Tools
? If a questionnaire was used, describe or specify it here
? Describe any hardware or software used to control the test or to record data
Experimental Design
? Describe the logical design of the test
? Define independent variables and control variables
Common Industry Format for Usability Test Reports
18
? Describe the measures for which data were recorded
Procedure
?Operational definitions of measures
? Operational definitions of independent variables or control variables
?Time limits on tasks
?Policies and procedures for interaction between tester(s) and subjects
? Sequence of events from greeting the participants to dismissing them
? Non-disclosure agreemen18s, form completion, warm-ups, pre-task training, and debriefing
? Verify that the participants knew and understood their rights as human subjects
? Specify steps followed to execute the test sessions and record data
? Number and roles of people who interacted with the participants during the test session
? Specify if other individuals were present in the test environment
? State whether participants were paid
Participant General Instructions
? Instructions given to the participants (here or in Appendix)
? Instructions on how participants were to interact with any other persons present
Participant Task Instructions
? Task instruction summary
Usability Metrics
? Metrics for effectiveness
? Metrics for efficiency
? Metrics for satisfaction
Results
Data Analysis
? Data Scoring

Common Industry Format for Usability Test Reports
19
? Data Reduction
? Statistical Analysis
Presentation of the Results
Performance Results
? Tabular Performance Results per task or task group
? Summary Table(s) of Performance Results across all tasks
? Graphical Presentation of Performance Results
Satisfaction Results
? Tabular Satisfaction Results
? Summary Table(s) of Satisfaction Results
? Graphical Presentation of Satisfaction Results
Appendices
? Custom Questionnaires, if used
? Participant General Instructions
? Participant Task Instructions
? Release Notes

Common Industry Format for Usability Test Reports
20
Appendix B -- Glossary Automatic data collection equipment
Hardware and/or software for automatic collection of usability test data. Examples of such data collection include screen capture and video, audio, and keystroke recording, often with time stamping.
Configuration The specific collection of hardware and software, including model and version numbers, that constitutes the computing environment on which the product was tested. The configuration includes the platform.
Customer Organization considering the purchase of the product.
Debriefing Posttest interview with a participant.
Experimental design Plan for assigning experimental conditions to participants and the statistical analysis associated with the plan. Typically, this includes a specification of the independent variables, dependent variables, number of participants and sampling strategy, procedure for assigning participants to experimental conditions, and order in which test tasks are given.
Independent variable Variable manipulated by the tester to set up the test conditions. (Contrast with the dependent variable, which is a variable that is being measured by the study.)
Likert scale Rating scale designed to measure user attitudes or reactions by quantifying subjective information. It typically contains a set of favorable and unfavorable statements about the product, to which a respondent indicates his or her level of agreement or disagreement. A Likert questionnaire may have an odd or even number of points, is often numerically numbered, and typically has at least two anchors describing the extremes of the scale dimension. Example: This product was easy to use.
Strongly disagree
Somewhat disagree
Slightly disagree
Neutral Slightly agree
Somewhat agree
Strongly agree
I felt frustrated while using this product..
Strongly disagree
Somewhat disagree
Slightly disagree
Neutral Slightly agree
Somewhat agree
Strongly agree
Mean Arithmetic ‘average’ of a set of quantities. Specifically, the sum of the quantities divided by the number of quantities in the set.
Nondisclosure agreement an agreement between the supplier and the customer, in which they recognize that their cooperation requires them to divulge some of their proprietary information to each other, and in which each agrees not to disclose any of the other’s proprietary information to anyone else.
One-way mirror Piece of glass that appears as a mirror from one side and a window from the other, depending on the lighting conditions. This device allows testers to observe a usability test without themselves being observed by the participants.
Common Industry Format for Usability Test Reports
21
Participant Person who participates in a usability test as a representative of the product s target user population. A participant performs the test tasks and follows other instructions given by the tester.
Platform The kind(s) of computer (operating system and hardware) used for the testing. Examples of common platforms include Windows on COMPAQ, MacOS on Power Macintosh, UNIX on Sparc or HP/UX, Linux on Dell, and OS/2 on IBM.
Procurement decisionmaker A person responsible for making decisions about which products to acquire for the customer organization.
Replication The collection of two observations under identical test conditions. In this document, it is used to mean that the customer organization should be able to repeat the test described in the report with its own sample of participants.
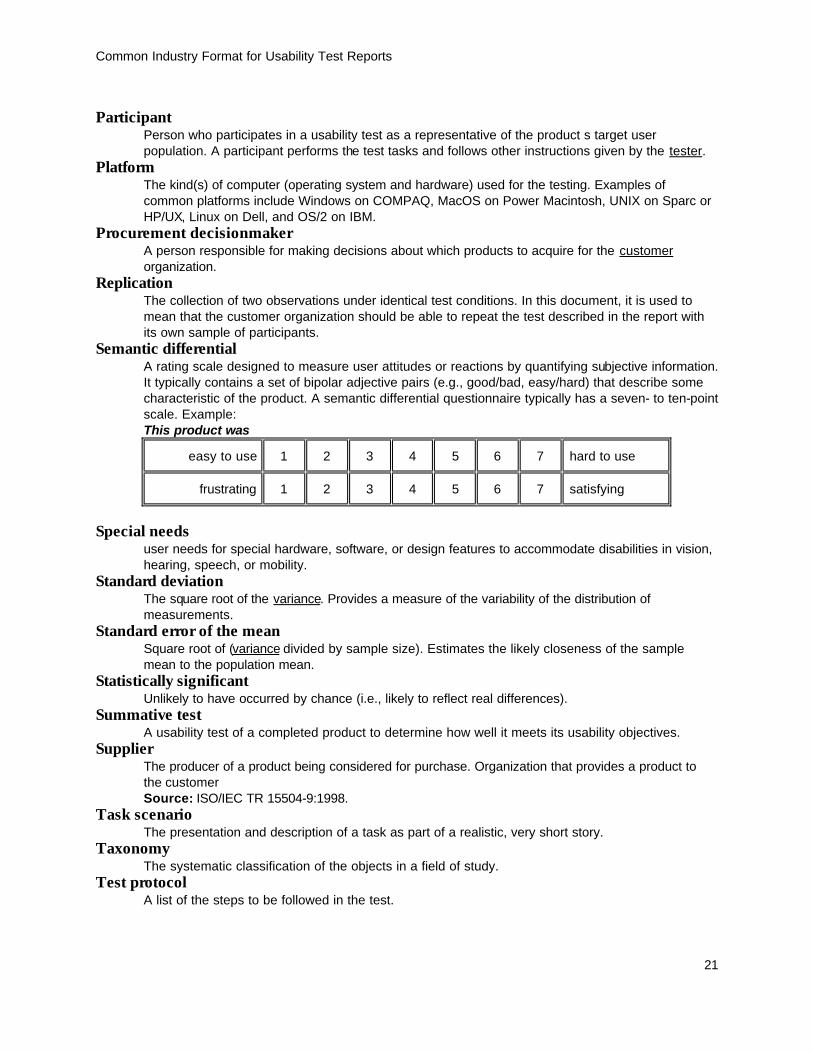
Semantic differential A rating scale designed to measure user attitudes or reactions by quantifying subjective information. It typically contains a set of bipolar adjective pairs (e.g., good/bad, easy/hard) that describe some characteristic of the product. A semantic differential questionnaire typically has a seven- to ten-point scale. Example: This product was
easy to use 1 2 3 4 5 6 7 hard to use
frustrating 1 2 3 4 5 6 7 satisfying
Special needs
user needs for special hardware, software, or design features to accommodate disabilities in vision, hearing, speech, or mobility.
Standard deviation The square root of the variance. Provides a measure of the variability of the distribution of measurements.
Standard error of the mean Square root of (variance divided by sample size). Estimates the likely closeness of the sample mean to the population mean.
Statistically significant Unlikely to have occurred by chance (i.e., likely to reflect real differences).
Summative test A usability test of a completed product to determine how well it meets its usability objectives.
Supplier The producer of a product being considered for purchase. Organization that provides a product to the customer Source: ISO/IEC TR 15504-9:1998.
Task scenario The presentation and description of a task as part of a realistic, very short story.
Taxonomy The systematic classification of the objects in a field of study.
Test protocol A list of the steps to be followed in the test.

Common Industry Format for Usability Test Reports
22
Tester / Test administrator A person who designs and/or conducts a usability test. (The tester is not the person who interacts with the product to exercise task scenarios; that person is a test participant.)
Usability Professional/Specialist/Engineer Person who engages in the practice of usability engineering/testing. Such practitioners know how to design and execute summative performance tests with human subjects and how to analyze the resulting data. Their training is usually an advanced degree in human factors, behavioral science, industrial engineering, human-computer interaction, industrial design, computer science, or a related field.
Validation A determination of the validity of a measure such as a questionnaire or a usability test.
Variance The sum of squared differences of a set of measurements from their mean, divided by the sample size.