
Common Designs for Controlled Clinical Trials A.Parallel Group Trials 1.Simplest example - 2 groups,...
49
Common Designs for Controlled Clinical Trials A. Parallel Group Trials 1. Simplest example - 2 groups, no stratification 2. Stratified design 3. Matched pairs 4. Factorial design B. Crossover Trials
-
Upload
jerome-hancock -
Category
Documents
-
view
215 -
download
1
Transcript of Common Designs for Controlled Clinical Trials A.Parallel Group Trials 1.Simplest example - 2 groups,...
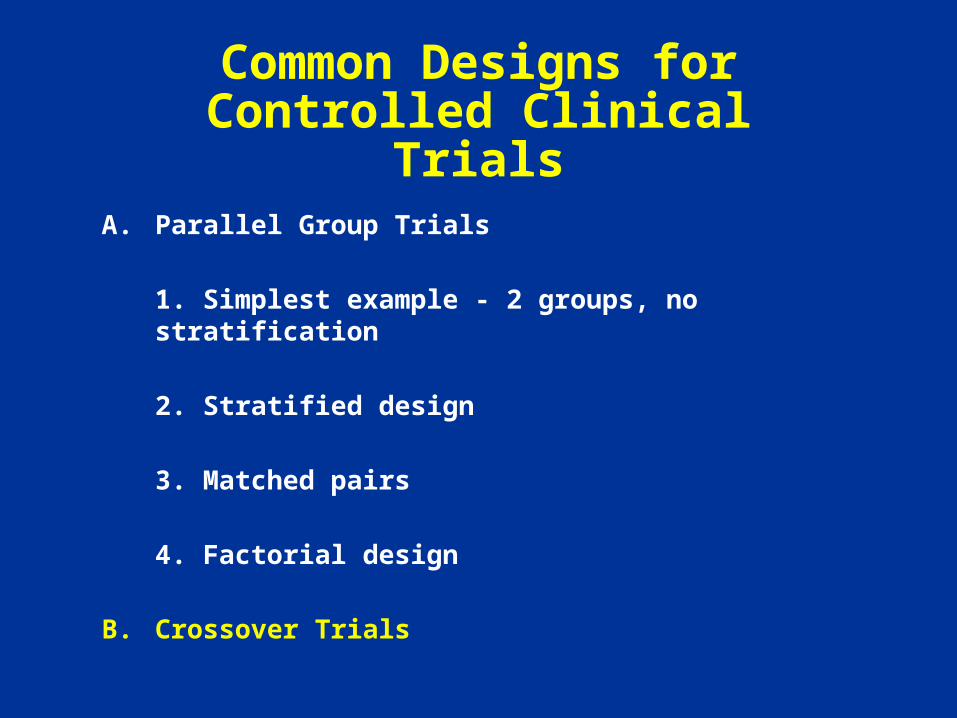
Common Designs for Controlled Clinical Trials
A. Parallel Group Trials
1. Simplest example - 2 groups, no stratification
2. Stratified design
3. Matched pairs
4. Factorial design
B. Crossover Trials

Parallel Group Design
y ij =m+Ti + eij
m= overall mean
Ti =effect of ith treatment
(i = A, B)
eij =error term for jth patient in ith group
eij ~ N(0,s2)
y ij ~N (m+Ti , s2)
s2= s s
2+ s e
2

Diastolic BP (mmHg) 58 36 94 0.62
Serum cholesterol 1200 400 1600 0.75(mg/dl)
Viral load 0.16 0.09 0.25 0.64(log10 copies/mL)
Overnight urine 325 625 950 0.34excretion of Na+
(meq/L)
Carbohydrate intake 110 208 318 0.35(% of calories)
Estimates of and for Selected Response Variables
2s
2e
2e
2s
2e
2s
2e
2s
Total
2s
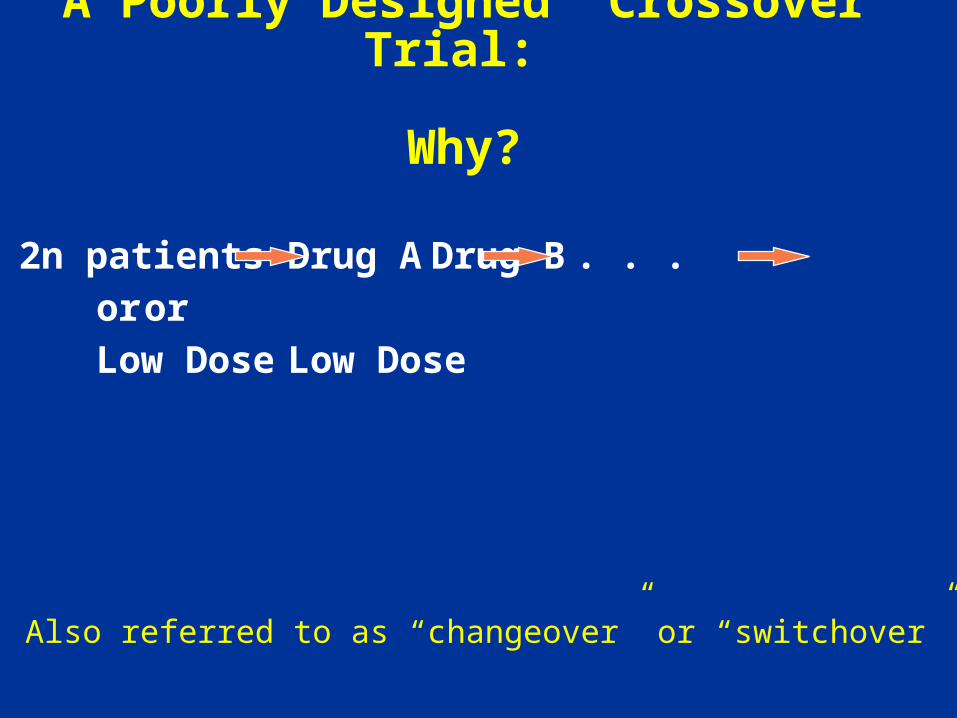
A Poorly Designed “Crossover” Trial:
Why?
2n patients Drug A Drug B . . .
or or
Low Dose Low Dose
Also referred to as “changeover” or “switchover”

Two-Period Crossover Trial
2n - Randomize Patients
Drug A
Drug B
Drug B
Drug A
W
A
S
H
O
U
T
1 2
Period
n
n
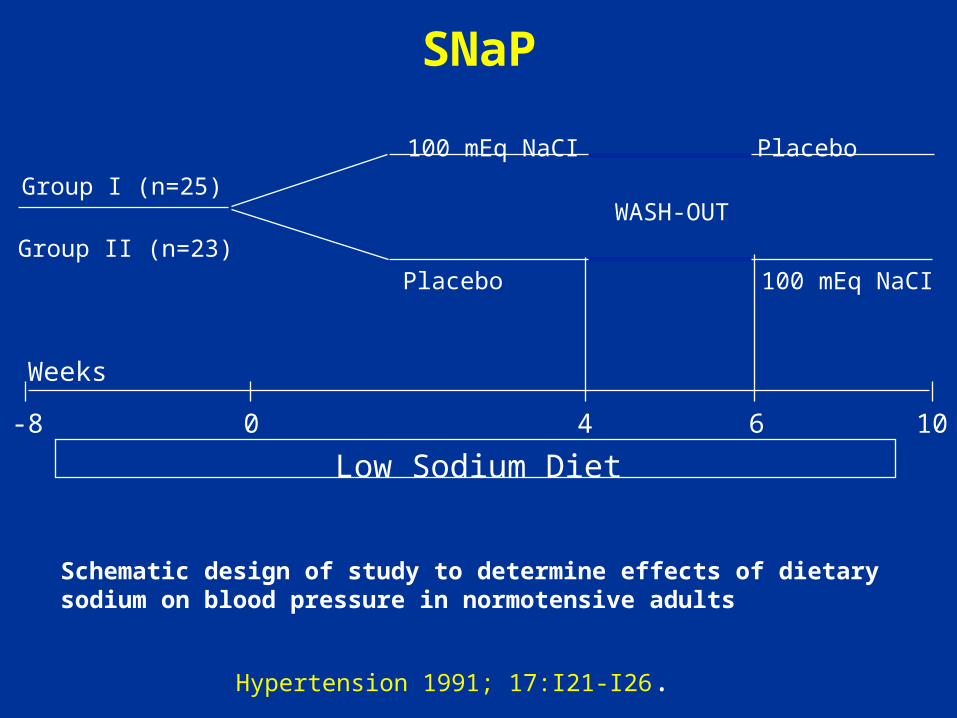
Schematic design of study to determine effects of dietary sodium on blood pressure in normotensive adults
Low Sodium Diet
-8 0 4 6 10
Weeks
Group I (n=25)
Group II (n=23)
100 mEq NaCI
Placebo 100 mEq NaCI
Placebo
WASH-OUT
SNaP
Hypertension 1991; 17:I21-I26.

Crossover TrialAdvantages:• Fewer patients required in most situations due to elimination of
between subject component of variability, therefore:– recruitment may be easier– can be more easily done in single center– fewer patients exposed to experimental treatment
• Less data collection
Disadvantages:• Interaction due to:
– differential carry-over effects of treatments– treatment x period interaction– differences between the two randomized groups (AB and
BA) at baseline• Patients must be observed longer• Losses to follow-up/missing data• Naturally occurring changes in underlying disease state
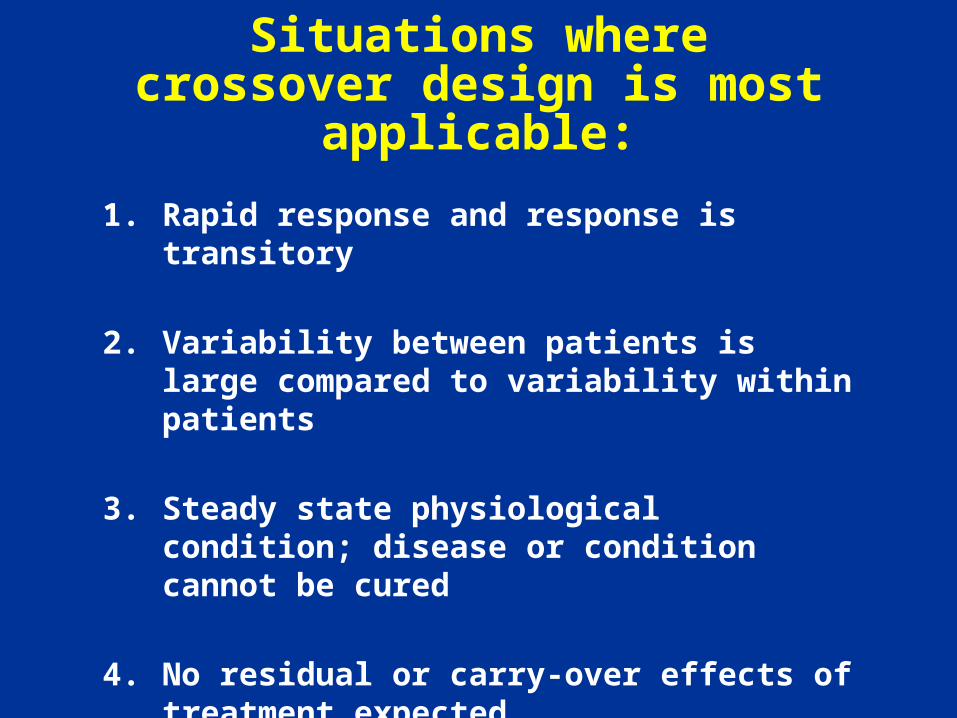
Situations where crossover design is most applicable:
1. Rapid response and response is transitory
2. Variability between patients is large compared to variability within patients
3. Steady state physiological condition; disease or condition cannot be cured
4. No residual or carry-over effects of treatment expected
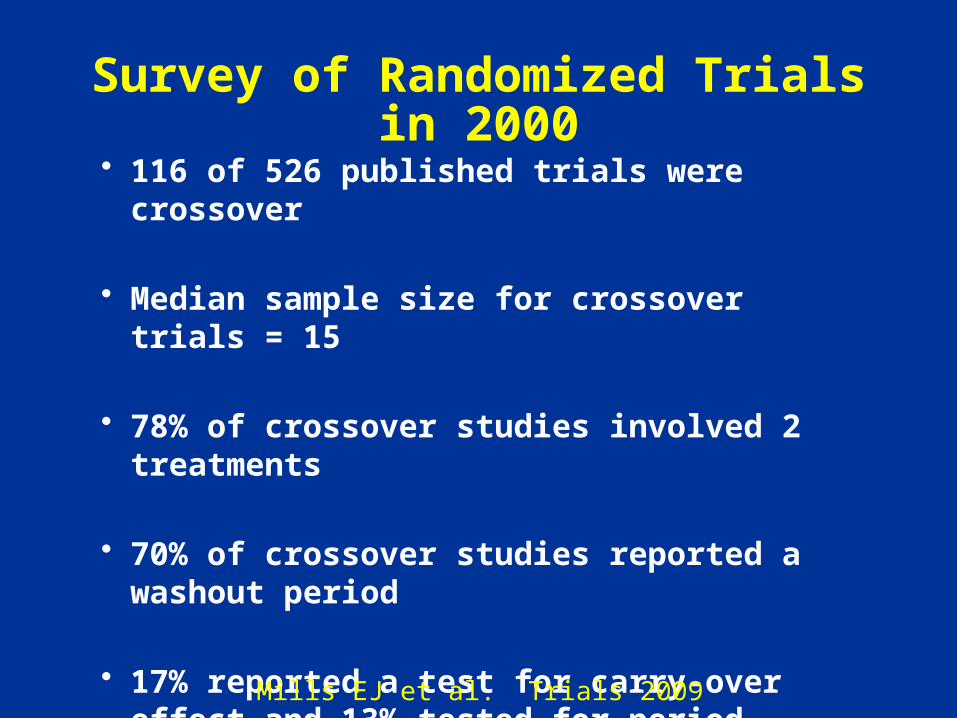
Survey of Randomized Trials in 2000
• 116 of 526 published trials were crossover
• Median sample size for crossover trials = 15
• 78% of crossover studies involved 2 treatments
• 70% of crossover studies reported a washout period
• 17% reported a test for carry-over effect and 13% tested for period effects
Mills EJ et al. Trials 2009
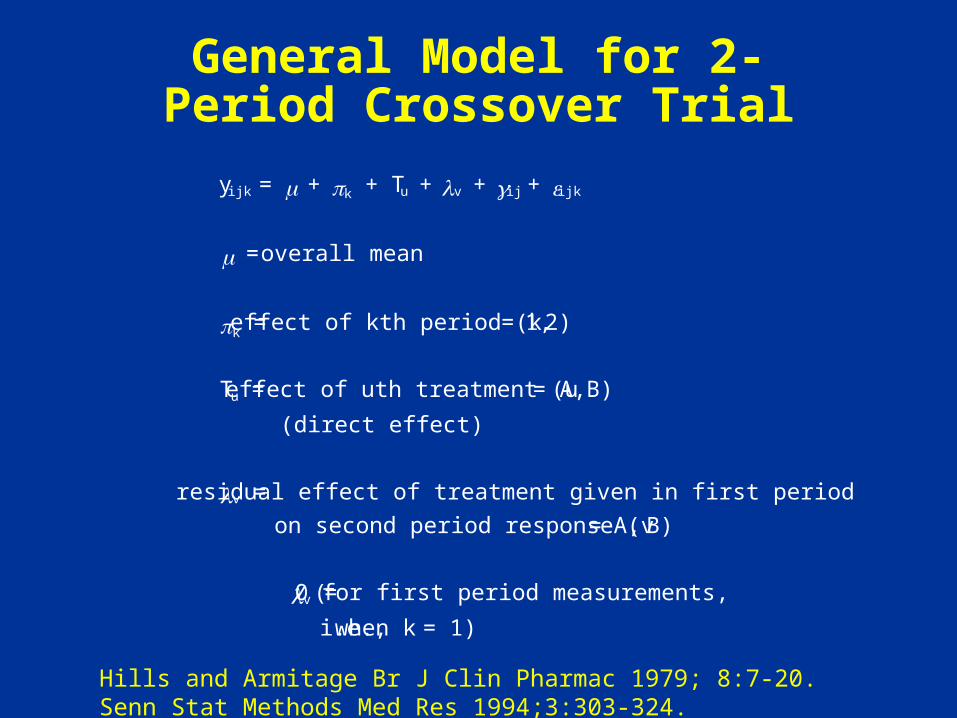
General Model for 2-Period Crossover Trial
y ijk = m + pk + Tu + l v + g ij + eijk
m = overall mean
pk = effect of kth period (k = 1, 2)
Tu = effect of uth treatment (u = A, B)
(direct effect)
l v = residual effect of treatment given in first period
on second period response (v = A, B)
( l v = 0 for first period measurements,
i.e., when k = 1)
Hills and Armitage Br J Clin Pharmac 1979; 8:7-20.Senn Stat Methods Med Res 1994;3:303-324.
2e2
s
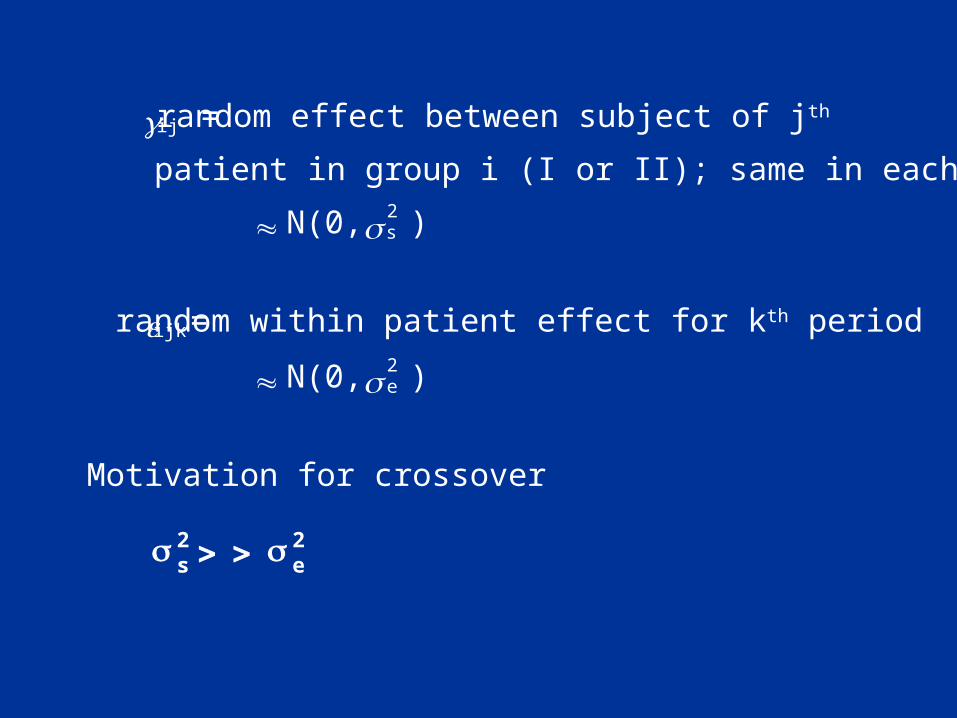
g ij = random effect between subject of jth
patient in group i (I or II); same in each period
» N(0, s s2 )
eijk = random within patient effect for kth period
» N(0, s e2 )
Motivation for crossover
+ + T +
+ + T +
+ + T
+ + T
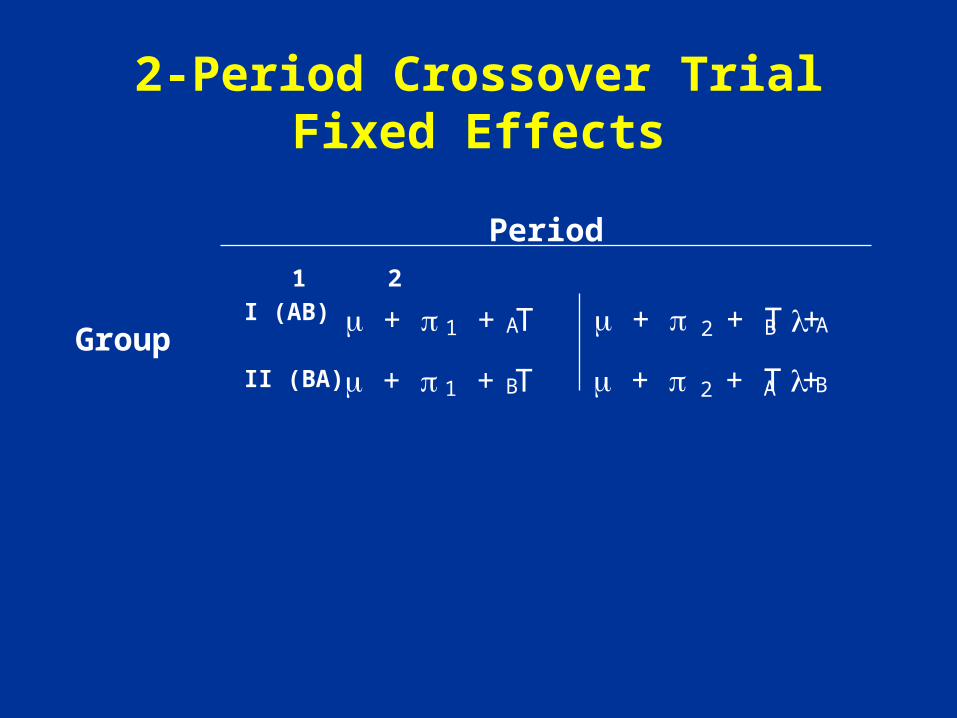
2-Period Crossover TrialFixed Effects
1 2
I (AB)
II (BA)
Group 1 A
1 B
2 B
2 A
A
B
Period

Group I (AB) Patient (i = 1)Response - Patient j
Period 1: y1j1 = m + p1 + TA + g1j + e1j1
Period 2: y ij2 = m + p2 + TB + l A + g1j + e1j2
Paired difference dI1 = y1j1 - y1j2
= (TA - TB ) - l A + (p1 - p2) + (e1j1 - e1j2)
E(d I) = (TA - TB) - l A + (p1 - p2)

Group II (BA) Patient (i = 2)Response - Patient jI
Period 1: y2j'1 = m + p1 + TB + g2j' + e2j'1
Period 2 : y2j'2 = m + p2 + TA + lB + g2j' + e2j'2
Paired difference y2j'1 - y2j2
= (TB - TA) - lB + (p1 - p2)+ (e2j'1 -e2j' 2)
Consider difference in opposite direction and call it dll
dII = (TA - TB) + lB + (p2 -p1)+ (e2j' 2 - e2j'1)
E(dII) = (TA - TB) + lB + (p2 -p1)
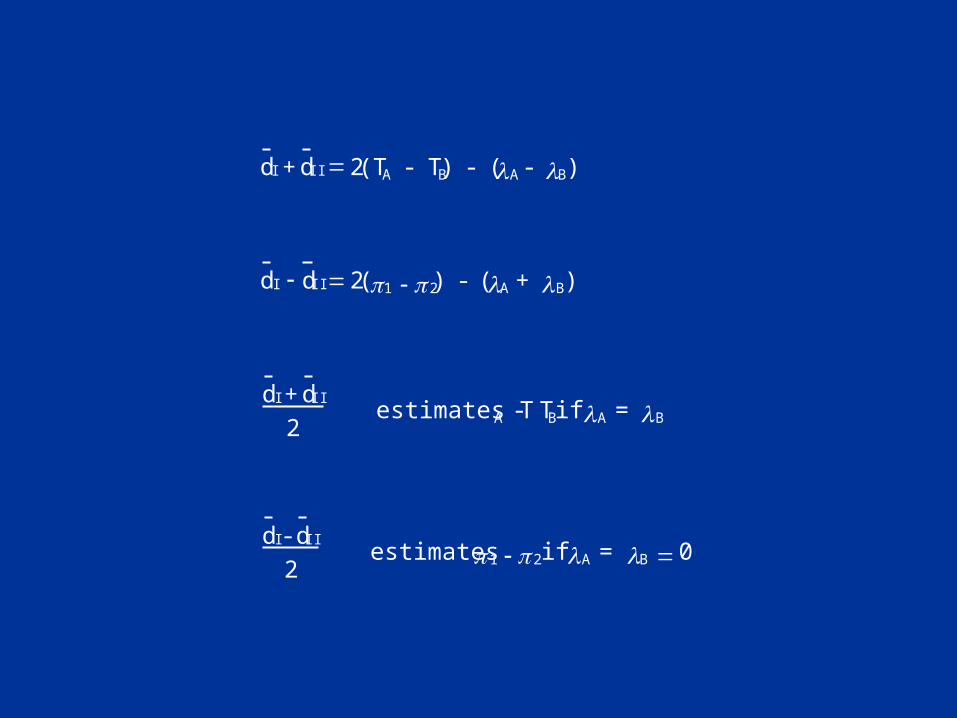
dI + dII = 2(TA - TB) - ( l A - lB)
dI - dII= 2(p1 -p2) - ( lA + l B)
dI + dII
2 estimates TA - TB if l A = l B
dI - dII
2 estimates p1 -p2 if l A = lB = 0

How Do We Convince Ourselves That AB
Consider the sum of the period 1and period 2 responses.
Group I (AB): E(SumI) = 2m + (p1+p2)
+ (TA + TB) + l A
Group II (BA): E(SumII) = 2m + (p1 +p2)
+ (TA + TB) + lB
Note that SumI - SumII estimates
l A - lB

Test for Carryover Has Low Power
• It is a between, instead of within, patient test (even when considering change from baseline, variance is 4 times larger)
• Although totals are used, direct information on carry over only comes from 2nd period – effect is diluted with sum’s.
• If there is evidence of a carryover effect (p<0.10 or 0.15), Grizzle proposed that the 1st period effects be used. This has been shown to be a sequential testing procedure that is not optimal. Some believe it is better not to carry out the test at all.
• Better be sure in the design that there is no carryover effect!

Possible Reasons for Rejecting Hypothesisof Equal Carry-over Effects
1. True carry-over effect for A or B, or both
2. Psychological carry-over effect
3. Difference between treatments depends on pre-treatment level of response variable
4. Group I and Group II differ significantly by chance

ResponseGroup II
Group IB
A
B
A
1 2Period
x x
1. Treatment effect
2. No period effect
3. No interaction

1. Treatment effect
2. Period effect
3. No interaction
ResponseGroup II
Group I
A
A
B
B
1 2Period
x
x
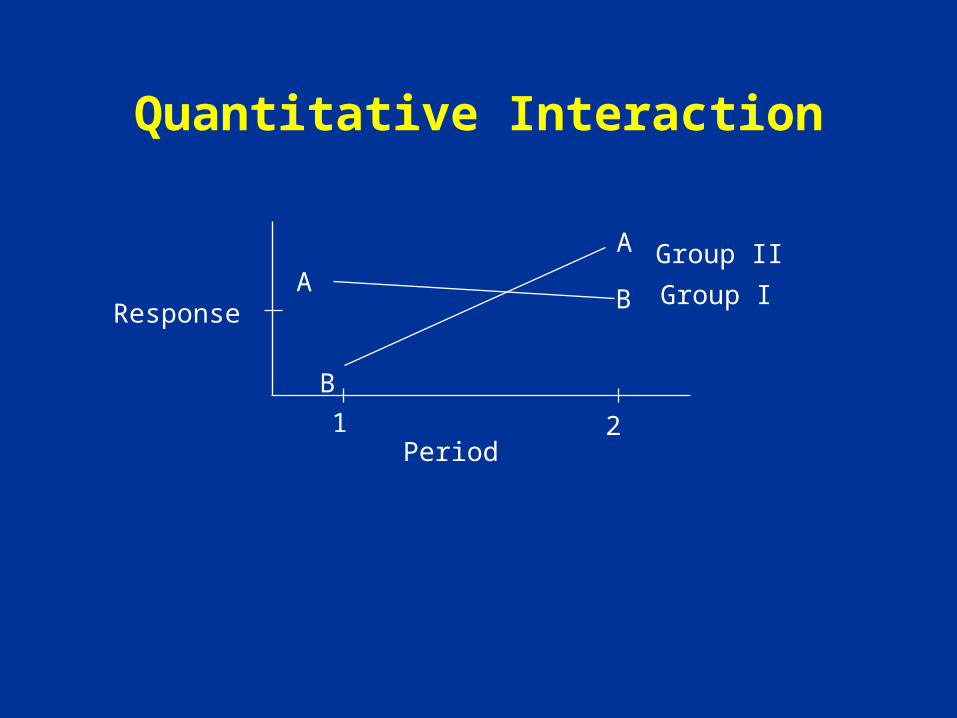
Quantitative Interaction
Response
Group II
Group I
B
A
BA
1 2Period

Qualitative Interaction
Response
Group IIGroup I
B
AB
A
1 2Period
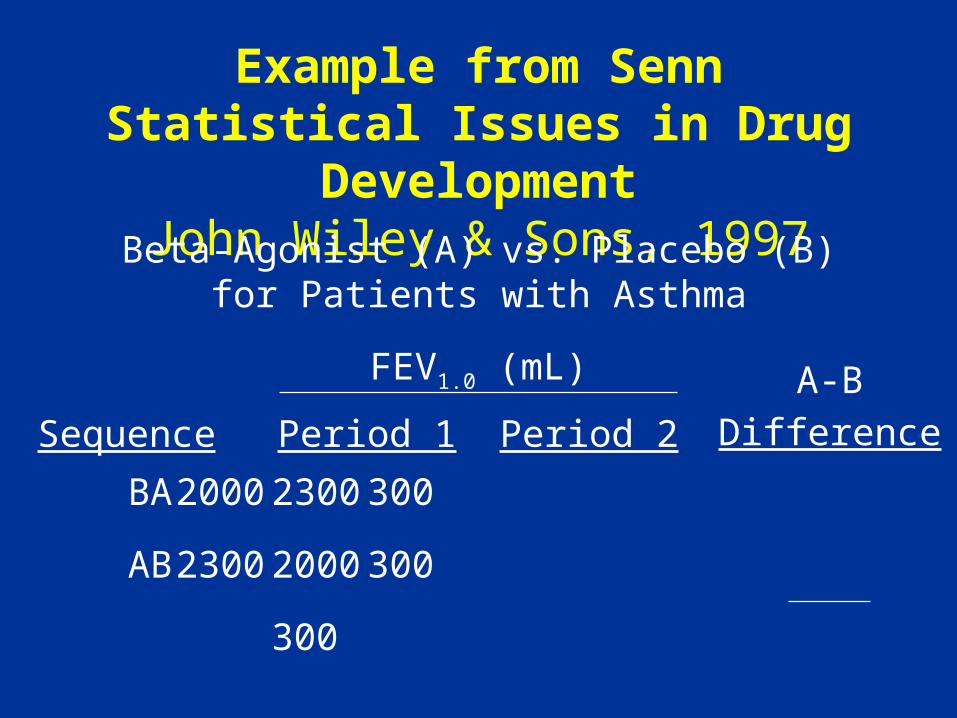
Example from SennStatistical Issues in Drug Development
John Wiley & Sons, 1997
BA 2000 2300 300
AB 2300 2000 300
300
Sequence Period 1 Period 2
A-B
Difference
FEV1.0 (mL)
Beta-Agonist (A) vs. Placebo (B)for Patients with Asthma

Senn Example (cont.)
BA 2350 2650 300
AB 2300 2000 300
300
Sequence Period 1 Period 2
A-B
Difference
• Add 350 mL to BA
Differences are recovered in spite
of difference between sequences
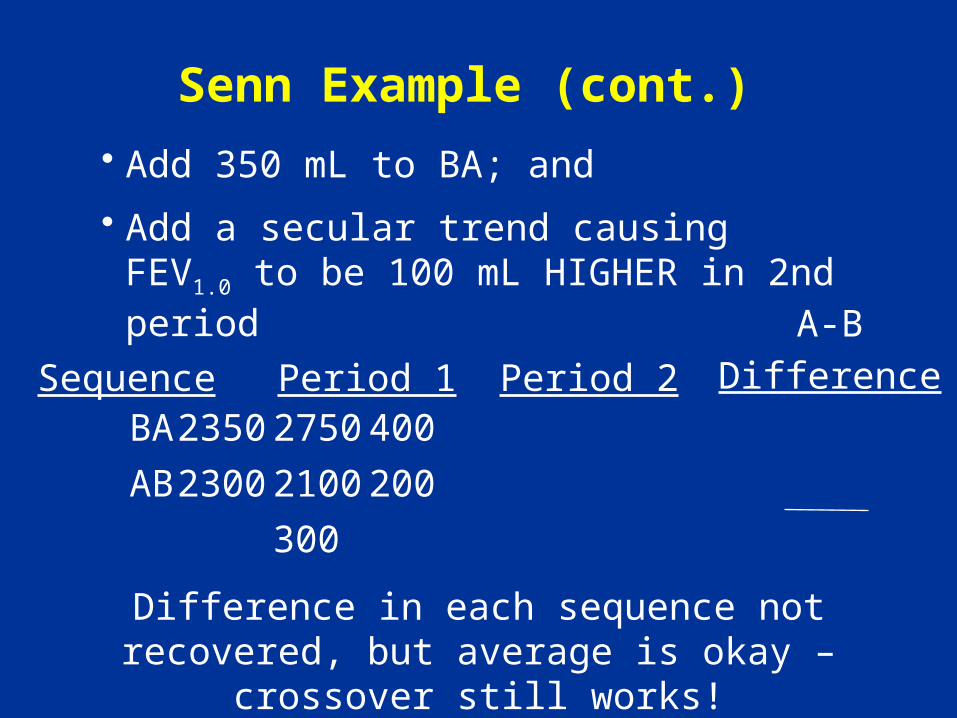
Senn Example (cont.)
BA 2350 2750 400
AB 2300 2100 200
300
Sequence Period 1 Period 2
A-B
Difference
• Add 350 mL to BA; and
• Add a secular trend causing FEV1.0 to be 100 mL HIGHER in 2nd period
Difference in each sequence not recovered, but average is okay – crossover still works!

Senn Example (cont.)
BA 2350 2750 400
AB 2300 2400 -100
150
Sequence Period 1 Period 2
A-B
Difference
• Add 350 mL to BA; and
• Add a secular trend causing FEV1.0 to be 100 higher in 2nd period; and
• Add a carry-over effect of A (still completely effective when B is given)
Crossover does not work!
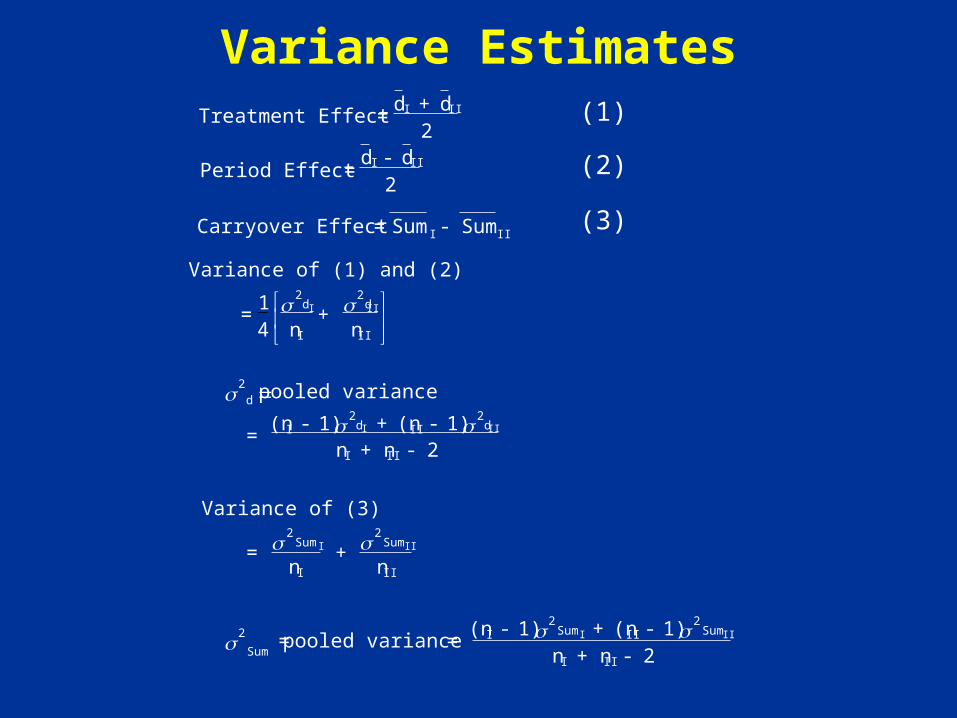
Variance EstimatesTreatment Effect =
dI + dII
2
Period Effect =dI - dII
2
Carryover Effect = Sum I - Sum II
Variance of (1) and (2)
=14s
2d I
nI
+ s2
dII
nII
é
ë ê
ù
û ú
s2
d = pooled variance
= (nI - 1)s
2dI + (nII - 1)s
2dII
nI + nII - 2
Variance of (3)
= s2
Sum I
nI
+ s2
Sum II
nII
s2
Sum= pooled variance =
(nI - 1)s2
SumI + (nII - 1)s2
SumII
nI + nII - 2
(1)
(2)
(3)
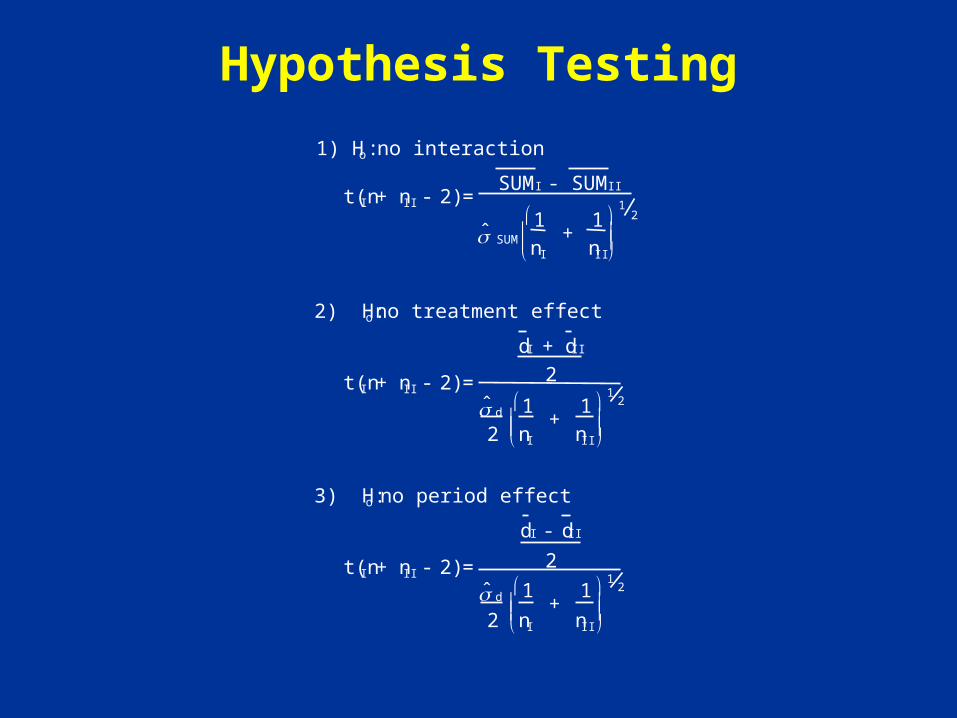
Hypothesis Testing
1) Ho : no interaction
t(nI + nII - 2) =SUMI - SUMII
ˆ s SUM
1
nI
+ 1
nII
æ
è ç ç
ö
ø÷ ÷
12
2) Ho : no treatment effect
t(nI + nII - 2) =
dI + dII
2
ˆ s d
2
1
nI
+ 1
nII
æ
è ç ç
ö
ø÷ ÷
12
3) Ho : no period effect
t(nI + nII - 2) =
dI - dII
2
ˆ s d
2
1
nI
+ 1
nII
æ
è ç ç
ö
ø÷ ÷
12

Group I
1 8 5 3 133 14 10 4 244 8 0 8 86 9 7 2 167 11 6 5 179 3 5 -2 811 6 0 6 613 0 0 0 016 13 12 1 2518 10 2 8 1219 7 5 2 1221 13 13 0 2622 8 10 -2 1824 7 7 0 1425 9 0 9 927 10 6 4 1628 2 2 0 4
PatientAccession No.
Period 1(A)
Period 2(B)
A-BDifference Sum
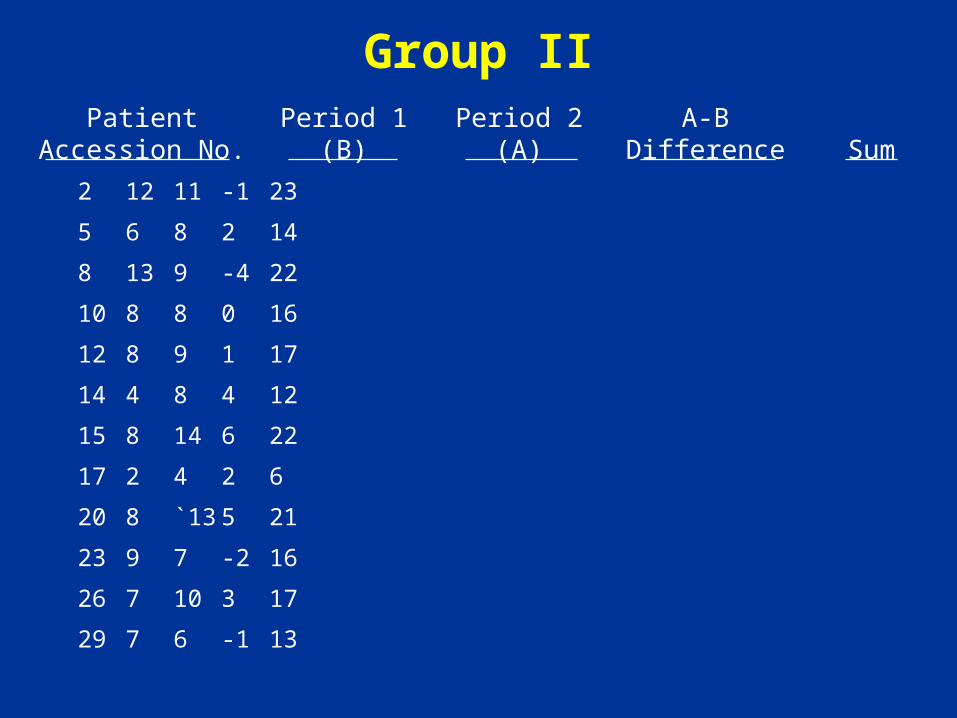
Group II
2 12 11 -1 23
5 6 8 2 14
8 13 9 -4 22
10 8 8 0 16
12 8 9 1 17
14 4 8 4 12
15 8 14 6 22
17 2 4 2 6
20 8 `13 5 21
23 9 7 -2 16
26 7 10 3 17
29 7 6 -1 13
PatientAccession No.
Period 1(B)
Period 2(A)
A-BDifference Sum

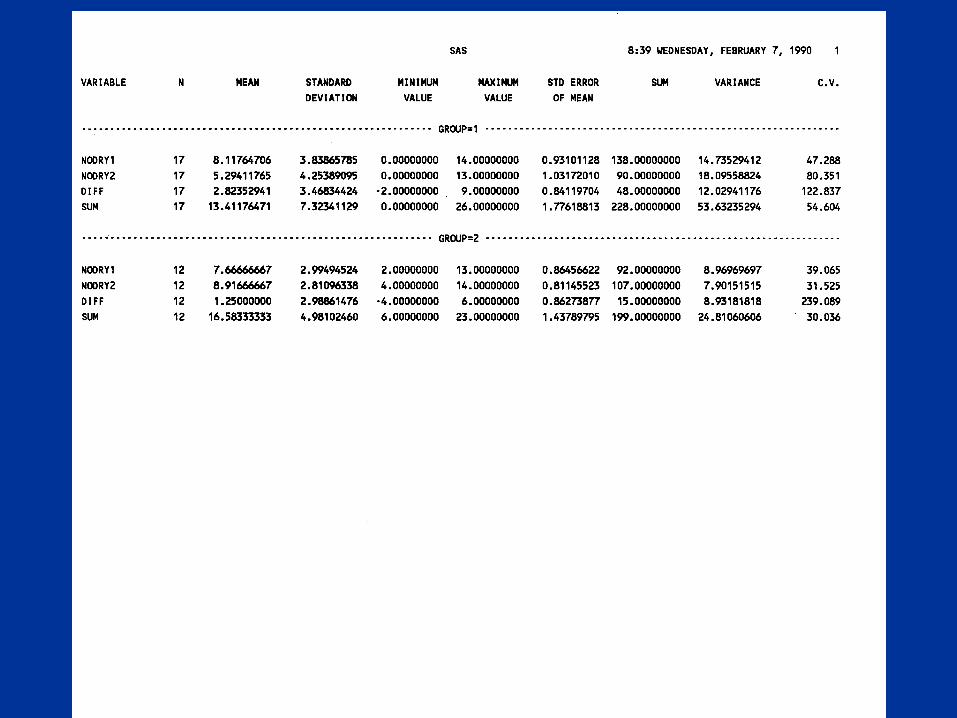
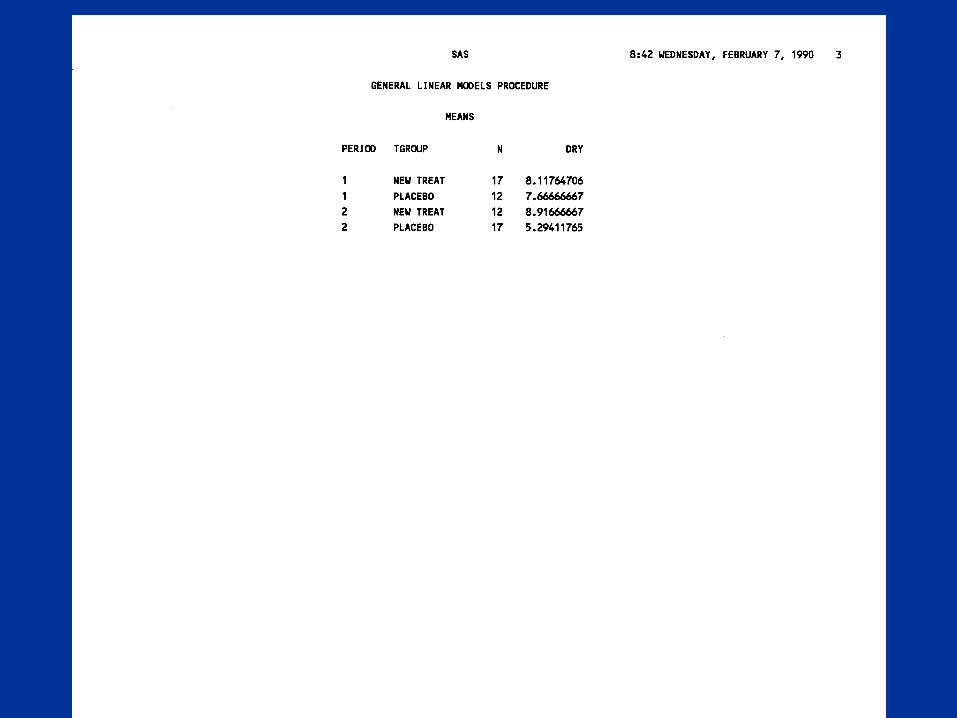
Group I (N = 17)
Mean 8.12 5.29 2.82 13.41SD 3.84 4.25 3.47 7.32SE 0.84 1.78
Period 1(A)
Period 2(B)
A-BDifference Sum
Group II (N = 12)
Mean 7.67 8.92 1.25 16.58
SD 2.99 2.81 2.99 4.98
SE 0.86 1.44
Period 1(B)
Period 2(A)
A-BDifference Sum
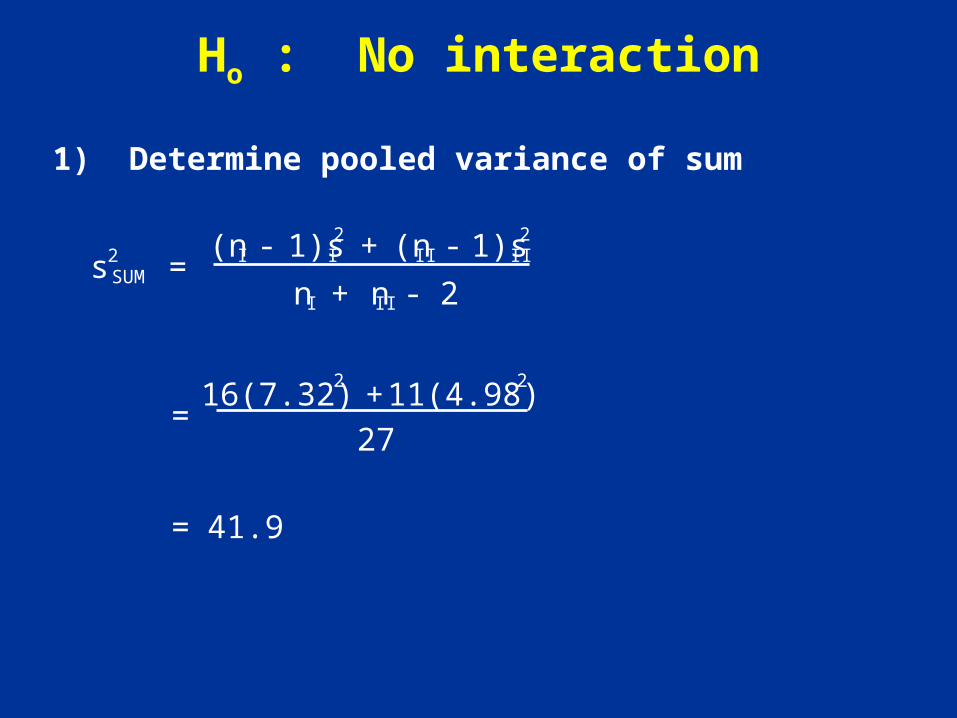
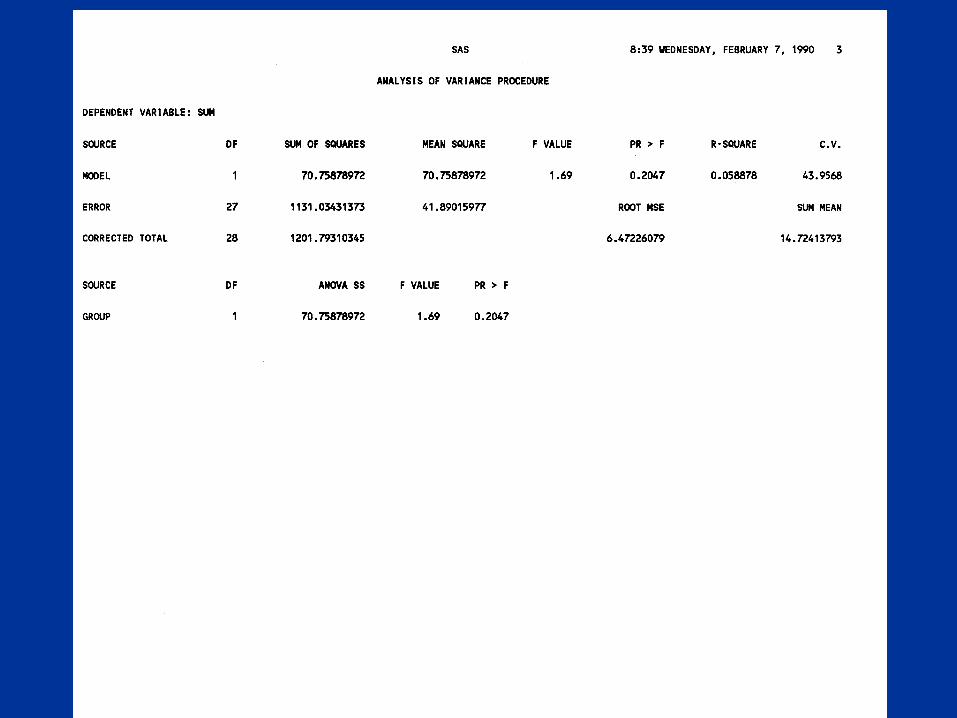
1) Determine pooled variance of sum
Ho : No interaction
sSUM2 =
(nI - 1)sI2 + (nII - 1)sII
2
nI + nII - 2
= 16(7.32)
2 + 11(4.98)
2
27
= 41.9

2) Calculate test statistic
3) Compare with t-tables with 27df, p = 0.20
t(nI + nII - 2) = SUMI - SUMII
sSUM2 1
nI
+ 1
nII
æ
è ç ç
ö
ø÷ ÷
= 16 - 13.49
41.861
17+
1
12
= 1.30
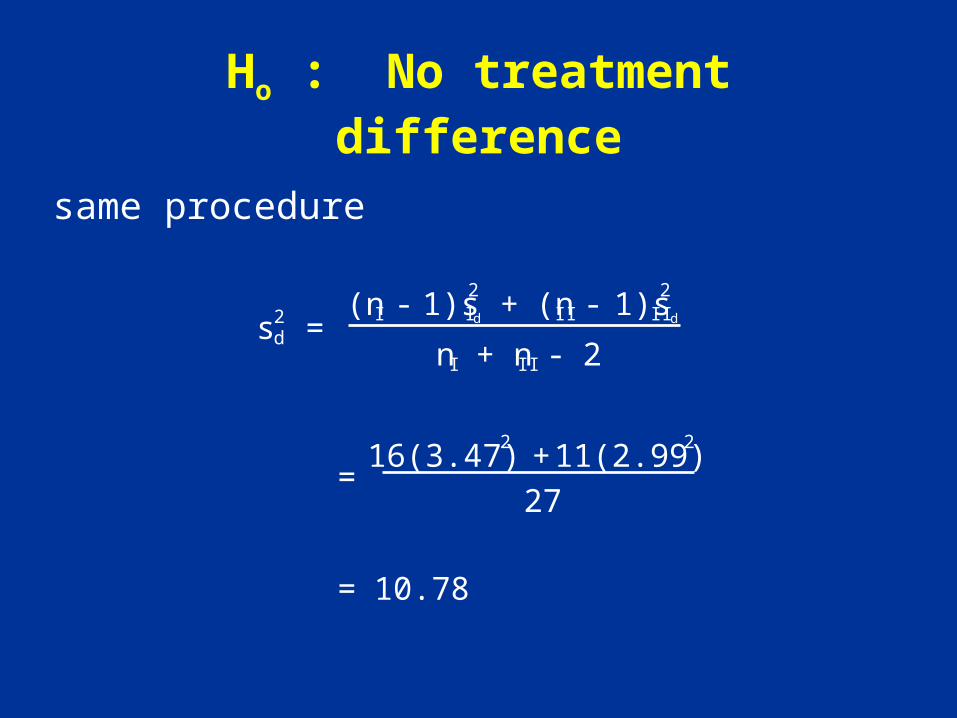
same procedure
Ho : No treatment difference
sd2 =
(nI - 1)sId
2 + (nII - 1)sII d
2
nI + nII - 2
= 16(3.47)
2 + 11(2.99)
2
27
= 10.78

t(nI + nII - 2) =
d I + d II2
æ
è ç ç
ö
ø÷ ÷
sd
2
1
nI
+ 1
nII
æ
è ç ç
ö
ø÷ ÷
=
2.82 + 1.24
2
æ
è ç
ö ø
÷
10.78
2
1
17+
1
12
= 3.28
p = 0.0028

Similarly for Ho : No Period Effect
t(nI + nII - 2) =
d I - d II2
æ
è ç ç
ö
ø÷ ÷
sd
2
1
nI
+ 1
nII
æ
è ç ç
ö
ø÷ ÷
=
2.82 - 1.24
2
æ
è ç
ö ø
÷
10.78
2
1
17+
1
12
=1.27
p = 0.21


Two-Period Crossover Trial
2n - Randomize Patients
Drug A
Drug B
Drug B
Drug A
W
A
S
H
O
U
T
1 2
Period
n
n
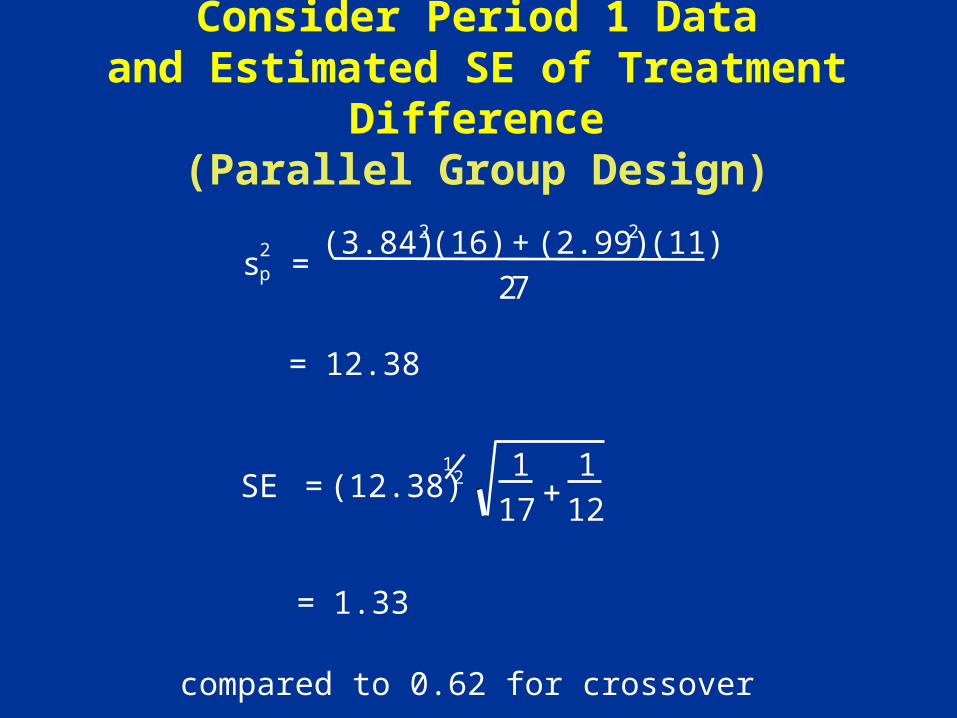
Consider Period 1 Dataand Estimated SE of Treatment Difference
(Parallel Group Design)
sp2 =
(3.84)2 (16) + (2.99)2 (11)
27
= 12.38
SE = (12.38)1
2 1
17+
1
12
= 1.33
compared to 0.62 for crossover

Advantages of Baseline Measurements
1. Description of study participants at entry
2. Comparability of treatment groups:AB vs. BA
3. More powerful test for treatment x period interaction
4. Improved precision for estimating treatment differences (e.g., analysis of covariance or change from baseline when correlation >0.5.)
5. Subgroup analysis
Advantage of a 2nd “Baseline” during Washout Between Periods
• Differences between “baseline” measurements for Group I and Group II may provide support for unequal residual effects.
NOTE!
This comparison does not replace comparison of sums of observation at the end of periods for Group I and Group II that was previously discussed.

Design for Estimating Direct and Residual Treatment Effects
Group 1 2 3
I A B C
II B C A
III C A B
PeriodSquare 1
Group 1 2 3
I A C B
II B A C
III C B A
PeriodSquare 2
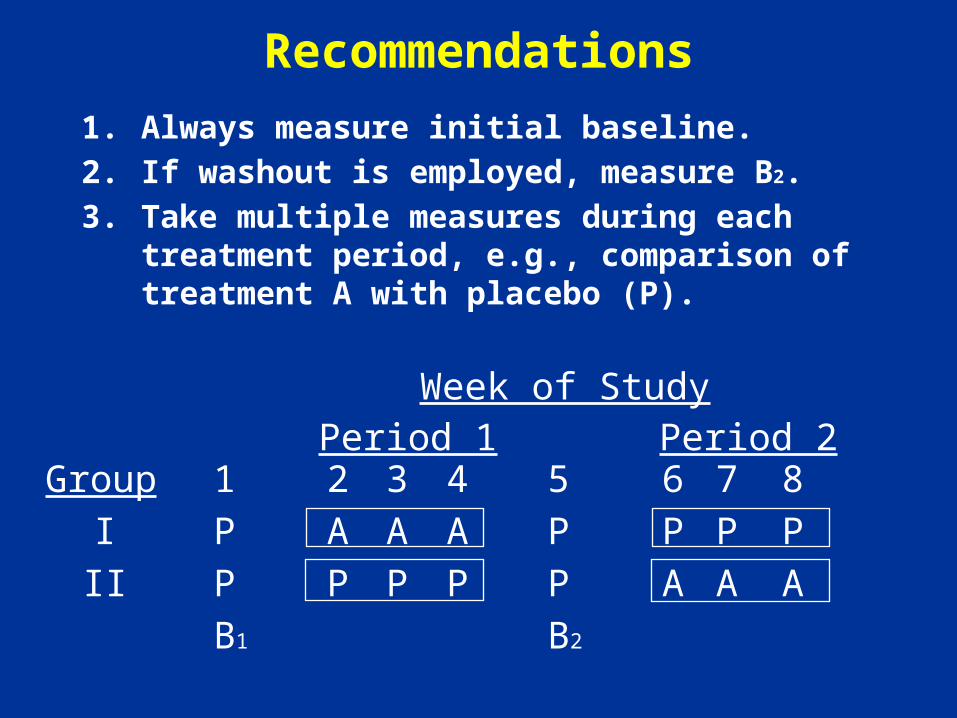
Recommendations
1. Always measure initial baseline.
2. If washout is employed, measure B2.
3. Take multiple measures during each treatment period, e.g., comparison of treatment A with placebo (P).
Week of Study
Group 1 2 3 4 5 6 7 8
I P A A A P P P P
II P P P P P A A A
B1 B2
Period 1 Period 2