Common Core State Standards CC-19 Samples and Surveys ...teachers.dadeschools.net/rbaglos/CC-19...
6
Samples and Surveys Objectives To identify sampling methods To recognize bias in samples and surveys A population is all the members of a set. A sample is part of a population. If you determine a sample carefully, the statistics for the sample can be used to make general conclusions about the larger population. Essential Understanding You can get good statistical information about a population by studying a sample of the population. Suppose you want to know what percent of all voters in your city favor a tax increase to pay for school improvements. It likely would be impossible to ask an opinion of every voter. So instead you select a sample of the voters to estimate the percentage who favor the idea. You can define different sample types by the methods used to select them. Key Concepts Sampling Types and Methods For a convenience sample, select any members of the population who are conveniently and readily available. For a self-selected sample, select only members of the population who volunteer for the sample. For a systematic sample, order the population in some way, and then select from it at regular intervals. In a random sample, all members of the population are equally likely to be chosen. Lesson Vocabulary • population • sample • convenience sample • self-selected sample • systematic sample • random sample • bias • observational study • controlled experiment • survey One day, you catch 100 fish at random from a lake. You tag the fish and then release them back into the lake. The next day you again catch 100 fish at random, as shown on the map. The red dots indicate the fish that have your tags. What can you conclude? Justify your conclusion. What happened to the other fish you tagged? CC - 19 MATHEMATICAL PRACTICES MACC.912.S-IC.1.1 Understand statistics as a process for making inferences about population parameters based on a random sample from that population. Also MACC.912.S-IC.2.3, MACC.912.S-IC.2.4, MACC.912.S-IC.2.6 MP 1, MP 2, MP 3, MP 4 Common Core State Standards CC-19 Samples and Surveys 81 CC-19 81 BIG idea Probability ESSENTIAL UNDERSTANDING You can get good statistical information about a population by studying a sample of the population. Math Background The statistical information you get about a population depends on the methods you use to sample the population. These methods may cause bias and influence the results of the studies. Understanding these can help to interpret the information more accurately. SAMPLE METHODS • Convenience sample: this may have bias when the members of the population who are conveniently and readily available do not represent all groups evenly. • Self-selected sample: this may have bias when certain groups of people choose not to volunteer. • Systematic sample: this may have bias when the method used to order the population does not include everyone. STUDY METHODS • Observational study: this may introduce bias or inaccuracy depending on the measuring tools and human error. • Controlled experiment: a double blind can help reduce bias. • Survey: poorly written survey questions may introduce bias. Mathematical Practice Construct viable arguments and critique the reasoning of others. In their study of sampling types and methods, students will distinguish skewed data and offer ways to prevent bias while, in the process, deciding whether certain arguments based on data make sense. 1 Interactive Learning Solve It! PURPOSE To determine information about a population from a sample PROCESS Students may consider the minimum number, total number, or possible range of the number of fish. FACILITATE Q What is the minimum number of fish that there could be in the pond? How do you know? [There must be at least 197 fish in the pond, the 97 caught the first day, the three caught twice, and the 97 untagged fish caught the second day.] Q If the second day is representative of any catch of one hundred fish, what is the ratio of untagged fish to tagged fish in the pond? [97 to 3] Preparing to Teach ANSWER See Solve It in Answers on next page. CONNECT THE MATH In the Solve It, students evaluate a random sample to reach conclusions about a population. In the lesson, students will analyze sampling methods and study methods for validity and bias. 2 Guided Instruction Take Note Q Are any of the sampling types and methods random? If a sample is not random, does that mean the conclusions drawn based on the sample are false? Explain. [The samples are not random because not all members of the population have the same chance of being chosen as part of the sample. The conclusions drawn from such samples may be true, but will likely be suspect.] CC-19
Transcript of Common Core State Standards CC-19 Samples and Surveys ...teachers.dadeschools.net/rbaglos/CC-19...
80 Honors Supplement
22. a. Use the table to find the range, the mean, and the standard deviation of the ages for each team.
b. Reasoning For two data sets, does the set with the greater range necessarily have the greater standard deviation? Support your answer with your results from part (a).
23. a. What effect will adding 10 to every value in a data set have on the standard deviation?
b. What will be the effect if you multiply each value by 10?
ChallengeC
Men
Women
Ages of the Members of SoccerTeams in an Adult League
19
23
24
18
23
21
21
23
21
22
22
21
22
36
21
23
22
22
26
20
23
31
30
33
22
25
21
24
26
27
20
32
24
22
30
28
HSM15_A2Hon_SE_CC_18_TrKit.indd 80 8/5/13 6:50 PM
Lesson 11-8 Samples and Surveys 81
Samples and Surveys
Objectives To identify sampling methods To recognize bias in samples and surveys
A population is all the members of a set. A sample is part of a population. If you determine a sample carefully, the statistics for the sample can be used to make general conclusions about the larger population.
Essential Understanding You can get good statistical information about a population by studying a sample of the population.
Suppose you want to know what percent of all voters in your city favor a tax increase to pay for school improvements. It likely would be impossible to ask an opinion of every voter. So instead you select a sample of the voters to estimate the percentage who favor the idea.
You can define different sample types by the methods used to select them.
Key Concepts Sampling Types and Methods
For a convenience sample, select any members of the population who are conveniently and readily available.
For a self-selected sample, select only members of the population who volunteer for the sample.
For a systematic sample, order the population in some way, and then select from it at regular intervals.
In a random sample, all members of the population are equally likely to be chosen.
Lesson Vocabulary
•population•sample•convenience
sample•self-selected
sample•systematic sample•random sample•bias•observational
study•controlled
experiment•survey
LessonVocabulary
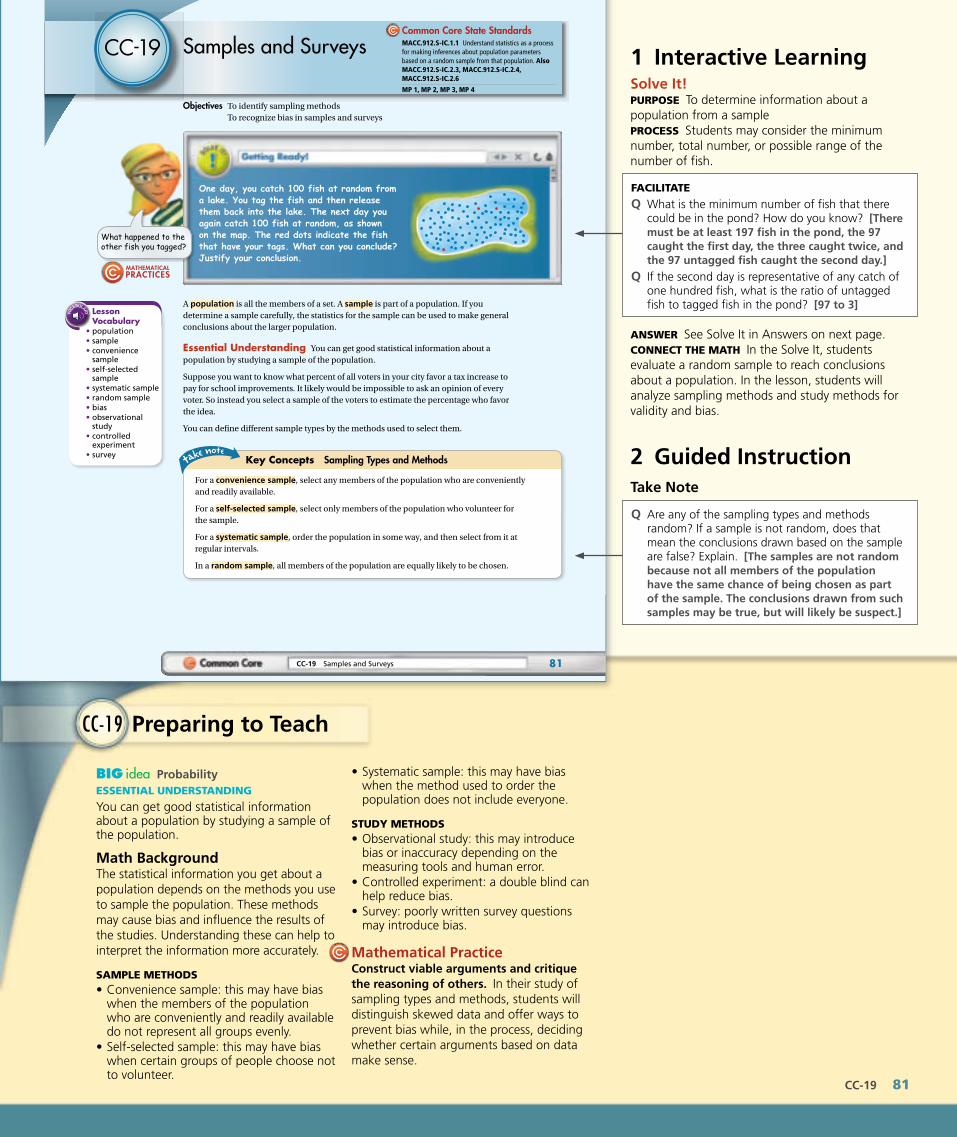
One day, you catch 100 fish at random from a lake. You tag the fish and then release them back into the lake. The next day you again catch 100 fish at random, as shown on the map. The red dots indicate the fish that have your tags. What can you conclude? Justify your conclusion.
What happened to the other fish you tagged?
CC-19
MATHEMATICAL PRACTICES
MACC.912.S-IC.1.1 Understand statistics as a process for making inferences about population parameters based on a random sample from that population. Also MACC.912.S-IC.2.3, MACC.912.S-IC.2.4, MACC.912.S-IC.2.6
MP 1, MP 2, MP 3, MP 4
Common Core State Standards
HSM15_A2Hon_SE_CC_19_TrKit.indd 81 8/5/13 6:51 PMCC-19 Samples and Surveys 81
HSM15_A2Hon_SE_TrKit.indd Page 81 8/5/13 11:00 PM epg /120/PE01457/TRANSITION_KITS/NA/ANCILLARY/2015/XXXXXXXXXX/Layout/Interior_Files/A ...
CC-19 81
Big idea ProbabilityEssEntial UndErstanding
You can get good statistical information about a population by studying a sample of the population.
Math BackgroundThe statistical information you get about a population depends on the methods you use to sample the population. These methods may cause bias and influence the results of the studies. Understanding these can help to interpret the information more accurately.
samplE mEthods•Conveniencesample:thismayhavebias
when the members of the population whoareconvenientlyandreadilyavailabledonotrepresentallgroupsevenly.
•Self-selectedsample:thismayhavebiaswhen certain groups of people choose not tovolunteer.
•Systematicsample:thismayhavebiaswhen the method used to order the populationdoesnotincludeeveryone.
stUdy mEthods•Observationalstudy:thismayintroduce
bias or inaccuracy depending on the measuring tools and human error.
•Controlledexperiment:adoubleblindcanhelp reduce bias.
•Survey:poorlywrittensurveyquestionsmay introduce bias.
Mathematical PracticeConstruct viable arguments and critique the reasoning of others. In their study of sampling types and methods, students will distinguish skewed data and offer ways to preventbiaswhile,intheprocess,decidingwhether certain arguments based on data make sense.
1 Interactive LearningSolve It!pUrposE To determine information about a population from a sampleproCEss Studentsmayconsidertheminimumnumber, total number, or possible range of the number of fish.
FaCilitatE
Q What is the minimum number of fish that there could be in the pond? How do you know? [There must be at least 197 fish in the pond, the 97 caught the first day, the three caught twice, and the 97 untagged fish caught the second day.]
Q Iftheseconddayisrepresentativeofanycatchofone hundred fish, what is the ratio of untagged fish to tagged fish in the pond? [97 to 3]
Preparing to Teach
ansWEr SeeSolveItinAnswersonnextpage.ConnECt thE math IntheSolveIt,studentsevaluatearandomsampletoreachconclusionsabout a population. In the lesson, students will analyze sampling methods and study methods for validityandbias.
2 Guided InstructionTake Note
Q Areanyofthesamplingtypesandmethodsrandom? If a sample is not random, does that mean the conclusions drawn based on the sample arefalse?Explain. [The samples are not random because not all members of the population have the same chance of being chosen as part of the sample. The conclusions drawn from such samples may be true, but will likely be suspect.]
CC-19

Got It?
Problem 1
82 Chapter 11 Probability and Statistics
Samples vary in how well they reflect a population. A sample has a bias when a part of a population is overrepresented or underrepresented. A bias is a systematic error introduced by the sampling method.
Analyzing Sampling Methods
Public Opinion A newspaper wants to find out what percent of the city population favors a property tax increase to raise money for local parks. What is the sampling method used for each situation? Does the sample have a bias? Explain.
A A newspaper article on the tax increase invites readers to express their opinions on the newspaper’s website.
This is a self-selected sample. It might have a bias, depending on who visits the website. The people who respond may overrepresent or underrepresent some views. For example, some property owners who are against the tax might organize a campaign to get friends and neighbors to visit the website.
B A reporter interviews people leaving the city’s largest park.
This is a convenience sample, since it is convenient for the reporter to stay in one place. Because the location is near a park, the sample may overrepresent park supporters and the results will have a bias.
C A survey service calls every 50th listing from the local phone book.
This is a systematic sample because the phone listing is ordered alphabetically. The regular sampling interval is every 50 listings. This sample may have a bias if there is some link between people who are listed (or not listed) in a phone book and people who pay property taxes.
1. a. To survey the eating habits of the community, employees of a local television station interview people visiting a food court in the mall. What sampling method are they using? Does the sample have a bias? Explain.
b. Reasoning A poll of every person in the population is a census. What is a situation that requires a census instead of a sample?
One way to collect sample information is to perform a study.
Who are the people in the sample?The people in the sample are only those who might be selected. In this case, only those who visit the website.
Key Concepts Study Methods
In an observational study, you measure or observe members of a sample in such a way that they are not affected by the study.
In a controlled experiment, you divide the sample into two groups. You impose a treatment on one group but not on the other “control” group. Then you compare the effect on the treated group to the control group.
In a survey, you ask every member of the sample a set of questions.
HSM15_A2Hon_SE_CC_19_TrKit.indd 82 8/5/13 6:51 PM
Problem 2
Problem 3
Got It?
Got It?
Lesson 11-8 Samples and Surveys 83
A poorly designed study can result in unreliable statistics. You should always analyze a study’s methods before making general conclusions about the population.
Analyzing Study Methods
Which type of study method is described in each situation? Should the sample statistics be used to make a general conclusion about the population?
A Researchers randomly choose two groups from 10 volunteers. Over a period of 8 weeks, one group eats ice cream before going to sleep, and the other does not. Volunteers wear monitoring devices while sleeping, and researchers record dream activity.
This is an example of a controlled experiment. The statistics for this study are based on such a small sample that the findings are unreliable as a general conclusion.
B Students in a science class record the height of bean plants as they grow.
This is an observational study. The statistics may provide a general conclusion about the growth rate of a bean plant. However, soil type, amount of sunlight and water, fertilizer, and other factors could affect the growth rate.
C Student council members ask every tenth student in the lunch line if they like the cafeteria food.
This is a survey. The results are not reliable because people waiting in line are more likely to enjoy the cafeteria food than those who brought their lunch from home.
2. A pharmaceutical company asks for volunteers to test a new drug to treat high blood pressure. Half of the volunteers will be given the drug, and half will be given a placebo. The researcher will monitor the blood pressure of each volunteer. Which type of study method is the researcher using? Should the sample statistics be used to make a general conclusion about the effectiveness of the drug in the larger population? Explain.
Designing a Survey
Sports During the 2008 Olympic Games, a U.S. swimmer won more medals than any other swimmer in history. What sampling method could you use to find the percent of students in your school who recognize that swimmer from a photograph? What is an example of a survey question that is likely to yield information that has no bias?
A possible sampling method is to question every 10th student entering school in the morning. This is a systematic sampling. It usually contains the least bias. A possible unbiased survey question is, “Who is pictured in this photograph?”.
3. What sampling method could you use to find the percent of residents in your neighborhood who recognize the governor of your state by name? What is an example of a survey question that is likely to yield information that has no bias?
How do you think of a survey question that has no bias?Keep it simple. The simplest question is likely to be the least biased.
How can you tell if a sample is a random sample?In a random sample, each group of the same size is equally likely to be chosen.
HSM15_A2Hon_SE_CC_19_TrKit.indd 83 8/5/13 6:51 PM82 Common Core
HSM15_A2Hon_SE_TrKit.indd Page 82 8/5/13 11:00 PM epg /120/PE01457/TRANSITION_KITS/NA/ANCILLARY/2015/XXXXXXXXXX/Layout/Interior_Files/A ...
82 Common Core
AnswersSolve It!There are about 3333 fish in the lake. You canestimatethatforevery3fishyoutagged,there are 97 additional fish. 100
3 = 33.3 and 33.3 * 100 = 3333.
Got It? 1. a. Conveniencesample;yes;sincethelocation
isatthefoodcourt,thesamplemayover-represent fast food supporters.
b. Sample:populationdatafortheUScensus 2. Controlledstudy;ifotherfactorsofthe
volunteersarerandom,likeage,gender,andoverallhealth,theresultscanbeusedtomakea general conclusion.
3. Answersmayvary.Sample:Useasystematicsample.Gotoeveryfifthhouseinyourneighborhood.Statethefirstandlastnamesofthegovernorandaskahouseholdmembertoidentifythenamedperson.Apossibleunbiasedsurveyquestionis,“Whoisthisperson?”.
Problem 1
Q In1A,whatotherconcernsmightyouhaveabout how the sample is collected? [Sample: Not everyone reads a newspaper.]
Q Whatisanexampleofalocationthatthereportercouldhaveusedin1Bthatmighthavemadethelikeliness of bias less? [Sample: a grocery store]
EXtEnsion
Got It?
Take Note
Q If the newspaper drew a conclusion about the public’sopinionontheproposedpropertytaxinafuture issue, why would you want to know what sampling method was used? [If the sample is random, then the conclusions reached by the newspaper are more reliable than if the sample is not random.]
Q Whatquestioncouldmoreaccuratelybeansweredbythesurveysampledescribedin1a? [Sample: What food do people choose to eat in the mall food court?]
Q For 1b, why would someone choose to use a sample instead of a census? [Sample: It might be too expensive or too time consuming to poll every member of a population.]
Q Which study method would be the best to use to testtheeffectivenessofanewmigraineheadachepainreliever?Explain. [Controlled experiment; administer the new drug to one group of migraine sufferers and another drug to a control group of migraine sufferers, and then compare the effectiveness.]

Got It?
Problem 1
82 Chapter 11 Probability and Statistics
Samples vary in how well they reflect a population. A sample has a bias when a part of a population is overrepresented or underrepresented. A bias is a systematic error introduced by the sampling method.
Analyzing Sampling Methods
Public Opinion A newspaper wants to find out what percent of the city population favors a property tax increase to raise money for local parks. What is the sampling method used for each situation? Does the sample have a bias? Explain.
A A newspaper article on the tax increase invites readers to express their opinions on the newspaper’s website.
This is a self-selected sample. It might have a bias, depending on who visits the website. The people who respond may overrepresent or underrepresent some views. For example, some property owners who are against the tax might organize a campaign to get friends and neighbors to visit the website.
B A reporter interviews people leaving the city’s largest park.
This is a convenience sample, since it is convenient for the reporter to stay in one place. Because the location is near a park, the sample may overrepresent park supporters and the results will have a bias.
C A survey service calls every 50th listing from the local phone book.
This is a systematic sample because the phone listing is ordered alphabetically. The regular sampling interval is every 50 listings. This sample may have a bias if there is some link between people who are listed (or not listed) in a phone book and people who pay property taxes.
1. a. To survey the eating habits of the community, employees of a local television station interview people visiting a food court in the mall. What sampling method are they using? Does the sample have a bias? Explain.
b. Reasoning A poll of every person in the population is a census. What is a situation that requires a census instead of a sample?
One way to collect sample information is to perform a study.
Who are the people in the sample?The people in the sample are only those who might be selected. In this case, only those who visit the website.
Key Concepts Study Methods
In an observational study, you measure or observe members of a sample in such a way that they are not affected by the study.
In a controlled experiment, you divide the sample into two groups. You impose a treatment on one group but not on the other “control” group. Then you compare the effect on the treated group to the control group.
In a survey, you ask every member of the sample a set of questions.
HSM15_A2Hon_SE_CC_19_TrKit.indd 82 8/5/13 6:51 PM
Problem 2
Problem 3
Got It?
Got It?
Lesson 11-8 Samples and Surveys 83
A poorly designed study can result in unreliable statistics. You should always analyze a study’s methods before making general conclusions about the population.
Analyzing Study Methods
Which type of study method is described in each situation? Should the sample statistics be used to make a general conclusion about the population?
A Researchers randomly choose two groups from 10 volunteers. Over a period of 8 weeks, one group eats ice cream before going to sleep, and the other does not. Volunteers wear monitoring devices while sleeping, and researchers record dream activity.
This is an example of a controlled experiment. The statistics for this study are based on such a small sample that the findings are unreliable as a general conclusion.
B Students in a science class record the height of bean plants as they grow.
This is an observational study. The statistics may provide a general conclusion about the growth rate of a bean plant. However, soil type, amount of sunlight and water, fertilizer, and other factors could affect the growth rate.
C Student council members ask every tenth student in the lunch line if they like the cafeteria food.
This is a survey. The results are not reliable because people waiting in line are more likely to enjoy the cafeteria food than those who brought their lunch from home.
2. A pharmaceutical company asks for volunteers to test a new drug to treat high blood pressure. Half of the volunteers will be given the drug, and half will be given a placebo. The researcher will monitor the blood pressure of each volunteer. Which type of study method is the researcher using? Should the sample statistics be used to make a general conclusion about the effectiveness of the drug in the larger population? Explain.
Designing a Survey
Sports During the 2008 Olympic Games, a U.S. swimmer won more medals than any other swimmer in history. What sampling method could you use to find the percent of students in your school who recognize that swimmer from a photograph? What is an example of a survey question that is likely to yield information that has no bias?
A possible sampling method is to question every 10th student entering school in the morning. This is a systematic sampling. It usually contains the least bias. A possible unbiased survey question is, “Who is pictured in this photograph?”.
3. What sampling method could you use to find the percent of residents in your neighborhood who recognize the governor of your state by name? What is an example of a survey question that is likely to yield information that has no bias?
How do you think of a survey question that has no bias?Keep it simple. The simplest question is likely to be the least biased.
How can you tell if a sample is a random sample?In a random sample, each group of the same size is equally likely to be chosen.
HSM15_A2Hon_SE_CC_19_TrKit.indd 83 8/5/13 6:51 PMCC-19 Samples and Surveys 83
HSM15_A2Hon_SE_TrKit.indd Page 83 8/5/13 11:00 PM epg /120/PE01457/TRANSITION_KITS/NA/ANCILLARY/2015/XXXXXXXXXX/Layout/Interior_Files/A ...
CC-19 83
Problem 2Reviewwithstudentsthemeaningsandusesof a control group and placebos in controlled experiments.
Got It?
Problem 3
Got It?
Q What factors should you consider to determine if astudymethodisvalid? [Sample: sample was chosen randomly, sample is the appropriate size, bias in the collection of data]
Q What other factors might be considered when doing medical research on a group of volunteers? [Sample: Researchers may want a representative sample by age, gender, medical history, and other medical conditions.]
Q What do you need to be concerned about as you think of a sampling method? [whether populations are underrepresented or overrepresented and whether all members of the population have an equal opportunity to be chosen]
Q Whatconditionsinyourschoolwouldrequireyoutorevisethesamplingmethodtoavoidbias? [Sample: Some students do not arrive at school in the morning.]
Q What should the photograph not depict? [Sample: a swimming pool, medals, the Olympic symbol]
Q Wouldmailingasurveytoneighborsbeagoodsamplingmethod?Explain. [No; residents who do not recognize the name may be less interested and therefore less likely to respond.]
Additional Problems 1. For each situation, what
sampling method is used? Doesthesamplehaveabias?
a. Apoliticalcandidatewantsto know what percent of hisconstituencyfavorsReferendumAonanupcoming ballot election. His staff asks each person who comes into the candidate’s office for three days whether they support ReferendumA.
b. The manager of a grocery store wants to determine what percent of shoppers use store coupons. He asks everytenthshopperwhopasses through the store’s doorforthenextweekif
he or she intends to use a storecouponontheirvisit.ansWErs
a. conveniencesample;visitorstotheofficeof the candidate may share the candidate’s opinions more than the population as a whole
b. systematicsample;no
2. Which type of study method is described in each situation? Shouldthesamplestatisticsbe used to make a general conclusion about the population?
a. Scientistsstudytheeffectsof the phases of the moon onthelevelsoflowtideand high tide in 200
coastalcitiesintheU.S.for a period of 12 months.
b. Apetfoodcompanyrandomly chooses two groups of 20 puppies forastudy.Onegroupeats a new brand of dog food and the other group eatsanoff-branddogfood for a period of 4 weeks. Researchers record muscular and skeletal growth rates in both groups.
c. For a class project, students in Health class askeverytenthstudententering the school if they eat breakfast in the morning.
ansWErs:
a. observationalstudy;Thestatistics are reliable since severallocationswereused and the data were collected for a year.
b. controlledexperiment;The statistics are unreliable since a small sample wasused.Otherfactorsmay include the breeds of the dogs used in the experiment.
c. survey;Theresultsarereliable since a random sample was used.
Lesson Check
84 Chapter 11 Probability and Statistics
Do you know HOW? 1. To investigate a community’s reading habits, a
newspaper conducts a poll from a table near the exit of a history museum.
a. What is the sampling method? b. Does the sampling method have any bias? Explain.
2. A survey asks, “Aren’t handmade gifts always better than tacky purchased gifts?” Does this survey question have any bias? Explain.
Do you UNDERSTAND? 3. Vocabulary What is the difference between a
population and a sample? Give an example of each.
4. Writing What does it mean to have an unbiased sample? Why does it matter?
5. Reasoning Would a large or small sample tend to give a better estimate of how the total population feels about a topic? Explain.
Practice and Problem-Solving Exercises
Identify the sampling method. Then identify any bias in each method.
6. A supermarket wants to find the percent of shoppers who use coupons. A manager interviews every shopper entering the greeting card aisle.
7. A maintenance crew wants to estimate how many of 3000 air filters in a 30-story office building need replacing. The crew examines five filters chosen at random on each floor of the building.
8. The student government wants to find out how many students have after-school jobs. A pollster interviews students selected at random as they board buses at the end of the school day.
For Exercises 9–11, identify the type of study method described in each situation and explain whether the sample statistics can be used to make a general conclusion about the population.
9. A list of students is randomly generated from the school database. Information for every student is entered into the database, and each student has an equally likely chance of being selected. The students selected are asked how much time they spend on household chores each week.
10. The local librarian collects data about the types of books that are checked out so that she can place a new book order accordingly. She records the type of book checked out by every other person each day for three weeks.
11. Gardening A gardener tests a new plant food by planting seeds from the same package in the same soil and location. Each plant is given the same amount of water, but one plant is given food and the other is given no food at all. He records the growth and flowering rates of each plant.
12. a. Energy What sampling method could you use to find the percent of adults in your community who support building more nuclear power plants?
b. What is an example of a survey question that is likely to yield unbiased information?
PracticeA See Problem 1.
See Problem 2.
See Problem 3.
MATHEMATICAL PRACTICES
MATHEMATICAL PRACTICES
HSM15_A2Hon_SE_CC_19_TrKit.indd 84 8/5/13 6:51 PM
Lesson 11-8 Samples and Surveys 85
A university researcher is studying the effect of watching television on residents of the city. Describe a sampling method that can be used for each population.
13. all teenagers 14. all homeowners
15. all women over the age of 21 16. all children under the age of 13
17. Think About a Plan An online advertisement asks you to participate in a survey. The survey asks how much time you spend online each week. What sampling method is the survey using? Identify any bias in the sampling method.
• What population is likely to see the survey? • What population is likely to respond to the survey?
18. Entertainment A magazine publisher mails a survey to every tenth person on a subscriber list. The survey asks for three favorite leisure activities. What sampling method is the survey using? Identify any bias in the sampling method.
19. Student government members survey every tenth student who enters the school building and asks whether students favor the school’s new dress code. The sample statistics show that 54% favor the new dress code, 42% oppose the dress code, and 4% have no opinion.
a. What is the population?
b. What is the sample?
c. What general conclusion can be made about the population?
20. Compare and Contrast Describe how a convenience sample and a self-selected sample are alike and how they are different.
21. Elections In a recent election, a survey of randomly selected registered voters was conducted to determine which candidate was likely to win. 48% of respondents said that they would vote for candidate A, 46% would vote for candidate B, and 6% were undecided. Based on the sampling results, can you make a general conclusion that it is more likely that candidate A will win the election? Explain.
22. Customer Satisfaction A car dealership conducts a satisfaction survey. They randomly select a sample of 500 customers from a list of 5000 new customers in the past year. Of the 500 surveys sent, 300 are returned. The statistics show that the dealership is achieving a high level of customer satisfaction. Can the owner of the dealership assume this is true overall? Explain.
23. For a class project, a student studies the likelihood that students turn in their homework each day. For each of her classes, she observes the teacher collect homework. She records the number of students who turn in homework, and the number who do not. The resulting data show that 86% of students turned in homework on time and 5% of students did not turn in any homework at all during the week.
a. What type of sampling method was used?
b. What type of study was performed?
c. Can the student use these statistics to make a general conclusion about all students in her school? Explain.
ApplyB
HSM15_A2Hon_SE_CC_19_TrKit.indd 85 8/5/13 6:51 PM84 Common Core
HSM15_A2Hon_SE_TrKit.indd Page 84 8/8/13 5:41 PM user /120/PE01457/TRANSITION_KITS/NA/ANCILLARY/2015/XXXXXXXXXX/Layout/Interior_Files/S ...
84 Common Core
3. The city planning commission is considering widening a thoroughfare throughthecenteroftowntorelievetraffic jams. What sampling method could you use to find the percent of citydriverswhowouldfavorachangetothethoroughfare?Whatsurveyquestionwouldyouasktoavoidbias?ansWEr Getalistoflicenseddriversforyourcityandcalleverytwentiethdriveronthealphabeticallist.Agoodsurveyquestionwouldbe“Wouldyoufavorwideningthethoroughfarethroughthecenteroftown?”
Additional Problems (continued)
3 Lesson CheckDo you know HOW?•IfstudentshavedifficultyidentifyingthebiasofthesurveyquestioninExercise2,askthemtoidentifytheadjectivesinthequestion.
Do you UNDERSTAND?•InExercise3,ifstudentsdonotunderstandthe
difference between a population and a sample, usetheclassasanexampleofapopulationandastudentasanexampleofasample.
•ForExercise4,ifstudentsareunsurewhatmakesa sample unbiased, ask them what makes a sample biased.
•IfstudentshavedifficultywiththereasoninginExercise5,posequestionsaboutthefishpondintheSolveIt:Ifyouonlycaughtonefishonthe second day, and it was tagged, could you conclude that all the fish in the pond were tagged?
Close
Q What should be considered in determining the reliabilityofagivensample? [the sampling type and sampling method, the survey question or questions asked, and the size of the sample]
Lesson Check 1. a. conveniencesample b. Yes;sincethelocationisnear
theexitofahistorymuseum,thesamplemayoverrepresentpeoplewho enjoy learning history and the resultswillhaveabias.
2. Yes;thequestionisleadingandloaded. It suggests the person wants a particular answer.
3. Allmembersofthesetarethepopulation.Asampleisasubsetofthepopulation.Answersmayvary.Sample:population:studentsinahighschool;sample:studentswholiketosnowboard.
4. Itisimportanttohaveaslittleerroraspossibleinasample,thusgivinganunbiasedsample.Anunbiasedsampleismorerepresentativeofanentirepopulation.
5. Alargesamplesizewouldgiveabetter estimate. The size of the sample is important to the reliability of the sample.
Practice and Problem-Solving Exercises 6. Conveniencesampling;Thissampling
methodoverrepresentsshoppersthatbuy greeting cards.
7. systematicsampling;nobias 8. conveniencesampling;Ifstudents
walkordrivetoschool,orareinvolvedinafterschoolactivities,theyareunderrepresented by this sampling method.
9. Survey;thestatisticscanbeusedtomake a general conclusion about the population because the sample is randomlygenerated,andthesurveyquestiondoesnotintroduceabiasinto the study.
Answers
Lesson Check
84 Chapter 11 Probability and Statistics
Do you know HOW? 1. To investigate a community’s reading habits, a
newspaper conducts a poll from a table near the exit of a history museum.
a. What is the sampling method? b. Does the sampling method have any bias? Explain.
2. A survey asks, “Aren’t handmade gifts always better than tacky purchased gifts?” Does this survey question have any bias? Explain.
Do you UNDERSTAND? 3. Vocabulary What is the difference between a
population and a sample? Give an example of each.
4. Writing What does it mean to have an unbiased sample? Why does it matter?
5. Reasoning Would a large or small sample tend to give a better estimate of how the total population feels about a topic? Explain.
Practice and Problem-Solving Exercises
Identify the sampling method. Then identify any bias in each method.
6. A supermarket wants to find the percent of shoppers who use coupons. A manager interviews every shopper entering the greeting card aisle.
7. A maintenance crew wants to estimate how many of 3000 air filters in a 30-story office building need replacing. The crew examines five filters chosen at random on each floor of the building.
8. The student government wants to find out how many students have after-school jobs. A pollster interviews students selected at random as they board buses at the end of the school day.
For Exercises 9–11, identify the type of study method described in each situation and explain whether the sample statistics can be used to make a general conclusion about the population.
9. A list of students is randomly generated from the school database. Information for every student is entered into the database, and each student has an equally likely chance of being selected. The students selected are asked how much time they spend on household chores each week.
10. The local librarian collects data about the types of books that are checked out so that she can place a new book order accordingly. She records the type of book checked out by every other person each day for three weeks.
11. Gardening A gardener tests a new plant food by planting seeds from the same package in the same soil and location. Each plant is given the same amount of water, but one plant is given food and the other is given no food at all. He records the growth and flowering rates of each plant.
12. a. Energy What sampling method could you use to find the percent of adults in your community who support building more nuclear power plants?
b. What is an example of a survey question that is likely to yield unbiased information?
PracticeA See Problem 1.
See Problem 2.
See Problem 3.
MATHEMATICAL PRACTICES
MATHEMATICAL PRACTICES
HSM15_A2Hon_SE_CC_19_TrKit.indd 84 8/5/13 6:51 PM
Lesson 11-8 Samples and Surveys 85
A university researcher is studying the effect of watching television on residents of the city. Describe a sampling method that can be used for each population.
13. all teenagers 14. all homeowners
15. all women over the age of 21 16. all children under the age of 13
17. Think About a Plan An online advertisement asks you to participate in a survey. The survey asks how much time you spend online each week. What sampling method is the survey using? Identify any bias in the sampling method.
• What population is likely to see the survey? • What population is likely to respond to the survey?
18. Entertainment A magazine publisher mails a survey to every tenth person on a subscriber list. The survey asks for three favorite leisure activities. What sampling method is the survey using? Identify any bias in the sampling method.
19. Student government members survey every tenth student who enters the school building and asks whether students favor the school’s new dress code. The sample statistics show that 54% favor the new dress code, 42% oppose the dress code, and 4% have no opinion.
a. What is the population?
b. What is the sample?
c. What general conclusion can be made about the population?
20. Compare and Contrast Describe how a convenience sample and a self-selected sample are alike and how they are different.
21. Elections In a recent election, a survey of randomly selected registered voters was conducted to determine which candidate was likely to win. 48% of respondents said that they would vote for candidate A, 46% would vote for candidate B, and 6% were undecided. Based on the sampling results, can you make a general conclusion that it is more likely that candidate A will win the election? Explain.
22. Customer Satisfaction A car dealership conducts a satisfaction survey. They randomly select a sample of 500 customers from a list of 5000 new customers in the past year. Of the 500 surveys sent, 300 are returned. The statistics show that the dealership is achieving a high level of customer satisfaction. Can the owner of the dealership assume this is true overall? Explain.
23. For a class project, a student studies the likelihood that students turn in their homework each day. For each of her classes, she observes the teacher collect homework. She records the number of students who turn in homework, and the number who do not. The resulting data show that 86% of students turned in homework on time and 5% of students did not turn in any homework at all during the week.
a. What type of sampling method was used?
b. What type of study was performed?
c. Can the student use these statistics to make a general conclusion about all students in her school? Explain.
ApplyB
HSM15_A2Hon_SE_CC_19_TrKit.indd Page 85 8/8/13 5:43 PM user /120/PE01457/TRANSITION_KITS/NA/ANCILLARY/2015/XXXXXXXXXX/Layout/Interior_Files/S ...CC-19 Samples and Surveys 85
HSM15_A2Hon_SE_TrKit.indd Page 85 8/8/13 5:53 PM user /120/PE01457/TRANSITION_KITS/NA/ANCILLARY/2015/XXXXXXXXXX/Layout/Interior_Files/S ...
CC-19 85
10. Observationalstudy;thestatisticsaresomewhat unreliable in this study becausenotalllibrarygoershaveanequallylikelychanceofbeingselected.Althoughthedatacollectedcannotbe used to make a general conclusion about the entire population, it may still givethelibrarianusefulinformationtomake her decision.
11. Controlledexperiment;thestatisticsfrom this study can be used to make a general conclusion about the effectivenessoftheplantfoodforthisparticular plant type as compared with givingnoplantfoodatall.
12. a. Answersmayvary.Sample:systematicsampling;callevery50thlisting in the local phone book.
b. Checkstudents’work.
13. Answersmayvary.Sample:Conveniencesampling;interviewstudents at a local high school.
14. Sample:Systematicsampling;contactevery50thhomeowneronalistofhomeowners in the community.
15. Sample:Self-selectedsampling;anewspaperarticleinvitesfemalesoverthe age of 21 to call the paper and expresstheiropinions.
16. Sample:Conveniencesampling;contact pediatricians in the community toaskthemtohaveparentsofallchildren under the age of 13 complete aquestionnaire.
17. self-selectedsampling;biasedbecauseonly those who spend time online will respond.
4 PracticeassignmEnt gUidEBasic: 6–12all,15–19,23
Average: 7–11odd,15–19,21–23
Advanced: 7–11odd,16–19,23,24
mathematical practices are supported by exerciseswithredheadings.HerearethePracticessupportedinthislesson:
MP1:MakeSenseofProblemsEx.17MP2:ReasonAbstractlyEx.12a,24MP2:ReasonQuantitativelyEx.5MP3:CompareArgumentsEx.20MP3:CommunicateEx.4
Applicationsexerciseshaveblueheadings. Exercise22supportsMP4:Model.
homEWorK QUiCK ChECKTo check students’ understanding of key skills and concepts,gooverExercises7,9,17,19,and23.
18. systematicsampling;Thissamplemayhavea bias since people with no strong interest in anyleisure-timeactivitymaychoosenottorespond.
19. a. all students at the school b. everytenthstudentwhoenterstheschool
buildingthedayofthesurvey c. Answersmayvary.Sampleanswer:Alittle
overhalfofstudentsfavorthenewdresscode.
20. Answersmayvary.Sampleanswer:Bothsamplesmayintroducebiasbecauserespondentsarenottrulyrandom.Aconveniencesamplemayallowforamorerepresentativesamplethanaself-selectedsample,becauserespondentsofaself-selectedsamplemayhavestrongfeelingsaboutthestudy topic, and other members of the sample may not respond because it is not an important topic to them.
21–23. Seenextpage.

86 Chapter 11 Probability and Statistics
24. Open Ended The government uses a variety of methods to estimate how the general public is feeling about the economy. A researcher wants to conduct a study to determine whether people who live in his state are representative of the latest government results. What type of study should the researcher use? Explain.
25. In a recent telephone survey, respondents were asked questions to determine whether they supported the new law that required every passenger to wear a seat belt while in a moving vehicle. The first question was, “According to the National Highway Traffic Safety Administration, wearing seat belts could prevent 45% of the fatalities suffered in car accidents. Do you think that everyone should wear safety belts?” Does this question introduce a bias into the survey? Explain.
ChallengeC
HSM15_A2Hon_SE_CC_19_TrKit.indd 86 8/5/13 6:51 PM
Lesson H-15 Normal Distributions 87
Objective To use a normal distribution
A discrete probability distribution has a finite number of possible events, or values.
The events for a continuous probability distribution can be any value in an interval of real numbers. If a data set is large, the distribution of its discrete values approximates a continuous distribution.
Essential Understanding Many common statistics (such as human height, weight, or blood pressure) gathered from samples in the natural world tend to have a normal distribution about their mean.
A normal distribution has data that vary randomly from the mean. The graph of a normal distribution is a normal curve.
Even and odd functions are defined as follows.Even function: f (x) = f (−x)Odd function: −f (x) = f (−x)Which is the graph of an even function? Of an odd function? Justify your answers.
x
y
O x
y
O
y
O
Normal Distributions
Try it out. Suppose (2, 2) is a point on f(x). If f(x) is even, what other point is on the graph of f(x)?
Lesson Vocabulary
•discrete probability distribution
•continuous probability distribution
•normal distribution
LessonVocabulary
Key Concept Normal Distribution
�3deviations
�1deviation
mean
�2deviations
�1deviation
�3deviations
�2deviations
2.35% 2.35%13.5% 13.5%
34% 34%
A normal distribution has a symmetric bell shape centered on the mean.
In a normal distribution,• 68% of data fall within one standard
deviation of the mean• 95% of data fall within two standard
deviations of the mean• 99.7% of data fall within three standard
deviations of the mean
CC-20
MATHEMATICAL PRACTICES
MACC.912.S-ID.1.4 Use the mean and standard deviation of a data set to fit it to a normal distribution and to estimate population percentages. Recognize that there are data sets for which such a procedure is not appropriate . . .
MP 1, MP 3, MP 4
Common Core State Standards
HSM15_A2Hon_SE_CC_20_TrKit.indd 87 8/5/13 6:51 PM86 Common Core
HSM15_A2Hon_SE_TrKit.indd Page 86 8/8/13 5:54 PM user /120/PE01457/TRANSITION_KITS/NA/ANCILLARY/2015/XXXXXXXXXX/Layout/Interior_Files/S ...
86 Common Core
AnswersPractice and Problem-Solving Exercises (continued) 21. Answerswillvary.Sampleanswer:No,because
youwouldhavetoassumethatallregisteredvoterswillactuallyvoteonElectionDay.
22. Answerwillvary.Sampleanswer:Yes,thesample is randomly determined, a reasonable numberofsurveyswerereturned,sothestatistics can be used to reliably apply to the entire population.
23. a. conveniencesample b. observationalstudy c. Answersmayvary.Sampleanswer:The
statistics do not necessarily represent the school population because a random sample was not used to conduct the study. Therefore, the statistics are unreliable and should not be used to make a general conclusion about the school population.
24. Checkstudents’responses. 25. Yes,thequestionisleadingtherespondent
toaparticulardesiredanswer,anditgivesstatisticsthatmayelicitastrongreaction.Also,itrequirestherespondenttoansweraquestionabout whether a person should wear a safety belt, which may not necessarily influence whether they support the law.