Common Applications for Acoustic Emission Testing (AET)
55
Common Applications for Acoustic Emission Testing (AET) STEVEN GARCIA, PRINCIPAL WWW.AMERISCANLLC.COM
Transcript of Common Applications for Acoustic Emission Testing (AET)

Common Applications for Acoustic Emission Testing
(AET)
STEVEN GARCIA, PRINCIPAL
WWW.AMERISCANLLC.COM

About the presenter, Steven Garcia
▪ Started Ameriscan LLC in 2018.
▪ Performed specialized acoustic emission testing and field data acquisition world-wide for over 24 years.
▪ Previously Employed with Stress Engineering Services 1996 - 2018
▪ Graduated from Texas A&M, Mechanical Engineering Technology, B.S.
▪ ASNT Member
2

Ameriscan LLC
▪ Company formed in 2018 to provide acoustic emission testing and 3D laser scanning of coke drums.
▪ Performed services for several major clients, including Arkema, Chevron, CHS, CNRL, Suncor, Phillips66, PBF Energy, Nayara Energy (India), and others.
▪ Only company in the world to provide both AE testing and 3D laser scanning for coke drum operators.
▪ Provide services for global clients.
3

For more information on AET
Edited by Ron Miller, Ph.D.
www.asnt.org
4

An Overview of the Presentation
▪ What is Acoustic emission (AE)?
▪ Common Applications of AE
▪ AE Hardware
▪ AE Basics and Source Discrimination
▪ Location Processor
▪ Advantages of AET vs. other inspection methods
▪ Case Studies

What is AET?
▪ An NDE method
▪ Relies on high frequency emissions from flaws
▪ Emissions are picked-up and located by PZT probes (Think GPS)
▪ The part must be properly stressed to generate emissions required to detect damage/defects.
▪ Tells you if there is a significant flaw, where it is located, and when it is emitting.
▪ Tells you if a known flaw is growing. (i.e. continuous monitoring)
6

The role of AET for the Inspection of Pressure Vessels and Piping…
▪ AET has predominantly been applied to in-service vessels as a “screening” method to detect and locate the presence of active flaws (ID/OD) and to guide inspection/repair efforts during turnarounds.
▪ AET has also been used to detect and locate fabrication flaws, during initial Code acceptance hydrostatic tests. (Per BPVC Section VIII) Fabrication flaws are likely to be initiation sites for possible fatigue cracks in a few years.

Test Results
Typical AET results: A drawing showing areas for follow-up. Areas selected will be prioritized according to the intensity of the indications at each location.
More Advanced Results: Correlating damage or cracking vs. operating conditions (ex: Coke Drums, Cl SCC), Modal Analysis using waveforms.

Common Applications of AE at Processing Plants
▪ Crack Detection
▪ Online Testing of Pressure Vessels
▪ Cooldowns/Start-Ups
▪ Hydrostatic Tests (Proof Tests during fabrication or after repair)
▪ Leak Detection of Above Ground Storage Tanks (AGST)
▪ Active Corrosion of AGST (NOTE** - Cannot detect inactive corrosion!!
▪ Long-Term Monitoring of Existing Flaws for growth
▪ Composite Testing

Issues affecting AET
▪ Know the possible damage mechanisms -> How to best stress the component (based on the mechanism)
▪ Background noise (mechanical, process, electrical)
▪ Weather issues (Snow, Rain, etc.)
▪ Pneumatic safety issues
▪ Planning for AET during a Shutdown
▪ Interpreting AET results
▪ Requires localized follow-up NDE at the areas prioritized by the inspection results.

Benefits of AET
▪ Global inspection method vs. localized
▪ Saves Money by not having to enter vessels. AE does not require large areas of insulation removal to locate and/or monitor existing defects.
▪ Saves Money by concentrating inspection budget on specific items
▪ Shortens Shutdowns by directing inspection resources where it is needed most.
▪ Monitoring existing “cracks” for growth (24/7 Monitoring)
▪ Detects leaks
▪ AE is effective at cryogenic as well as elevated temperatures.
▪ It is fast!

AE Technology – Hardware
Vallen Digital
System
AMSY-6

AE Technology – Hardware
Arbitrary
Waveform
Generator,
AMSY-6 Chassis,
and Sensor
Verification
Fixture

Sensor Verification Test Output
14

AE Technology – What are Waveguides? Why use them?
Allow operators to
couple the sensors
to high or low
temperature
materials without
damaging the sensor
Waveguides are
typically 12-14” long
unless the structure
is exceptionally hot
or covered by thick
insulationTemperature > 200 oF
¼” Hole in lagging
¼” Hole in insulation
Attach to lagging
Adjust collar against spring

Introduction to AE
16

AE Signals
Transients
These features are the basis
for “Feature Based” AET
Vo
lts
or
dB

Feature Based Acoustic Emission Analysis
▪ Signals are analyzed classifying signals based on the various features captured by the system:
Amplitude, Counts, Rise-time, Duration, Energy,
RMS Voltage
▪ Feature based acoustic emission is a time-proven technique for locating large cracks in a structure.
Cracks: high amplitude, short RT, Counts from 100-1000
Mechanical rubbing: low amplitude, average RT, long duration

Continuous Emissions
Continuous Emissions – Commonly used for leak testing applications
▪ Typically measured as RMS (Root Mean Square) Voltage or
▪ ASL (Average Signal Level) in dBV
olt
so
r d
B
time
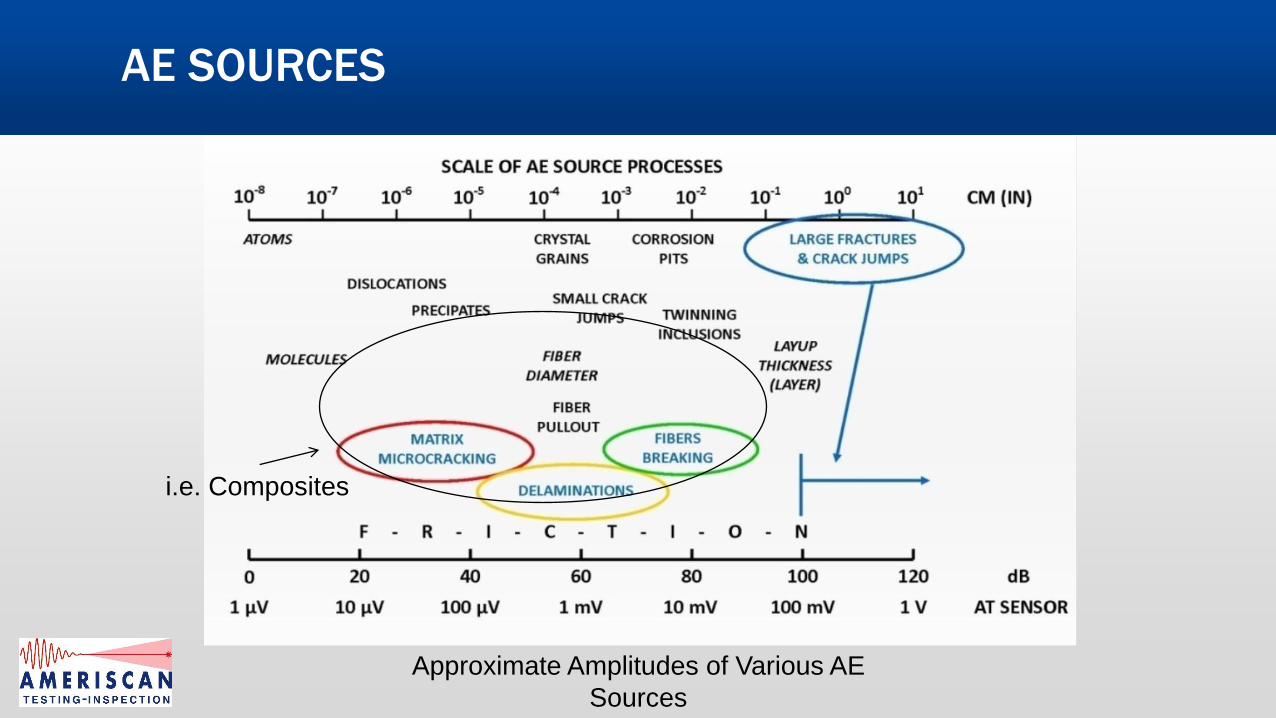
AE SOURCES
Approximate Amplitudes of Various AE
Sources
i.e. Composites

Example of a Fiber Break in a FRP Vessel
Note this amplitude [mV]

“Noise” i.e. part movement, rubbing, process, etc.
Much lower, but still crosses the detection threshold limit, not a
crisp signal like the fiber break.

Location Processor – Lightly Filtered Data

Example Data from a Pressure Vessel
24
Events X-Loc. Y-Loc. θ1 - Azimuth Angle θ2 - Azimuth Angle
Y1 - Elevation on the
Drum (Lower Bound)
Y2 - Elevation on the
Drum (Upper Bound) mean(Amp [dB]) sum(Energy [eu]) sum(Counts)
[in.] [in.] [degrees] [degrees] [in.] [in.]
78 466.70 73.53 140.91 156.19 49.53 97.53 69.88 6,275,982 88,871
62 470.47 43.91 142.11 157.39 19.91 67.91 69.67 5,600,586 74,899
47 476.42 24.26 144.01 159.28 0.26 48.26 70.49 5,109,110 60,605
23 -549.79 -145.44 177.36 192.64 -169.44 -121.44 59.55 273,983 15,723
16 527.27 -62.48 160.19 175.47 -86.48 -38.48 61.74 326,590 14,299
14 -528.16 -175.68 184.25 199.52 -199.68 -151.68 63.15 286,551 12,229
12 453.64 102.21 136.76 152.03 78.21 126.21 71.36 1,223,632 14,838
11 48.25 -169.42 7.72 23.00 -193.42 -145.42 56.43 101,334 4,289
10 -478.49 -191.50 200.06 215.33 -215.50 -167.50 58.31 124,237 5,710
7 543.29 -89.48 165.29 180.57 -113.48 -65.48 60.56 112,728 5,200
5 549.89 -111.51 167.39 182.67 -135.51 -87.51 59.39 53,943 3,021
5 377.26 156.01 112.44 127.72 132.01 180.01 62.05 237,898 3,958
Centroid of Cluster Range of Cluster
The recorded data is filtered to
eliminate erroneous emissions
and a cluster analysis is
performed.

MONPAC Method for Classifying Indications – Intensity Analysis
Developed as a joint venture between MISTRAS and Monsanto and released in 1989 as a means for evaluating fixed equipment. At the time, MISTRAS was known as Physical Acoustics (PAC). This is where the name MONPAC was derived from.
The method analyzes data on a per-channel basis (zonal) instead of a multichannel approach. Technology back in 1989 was a limitation when considering a multichannel approach. Today, at Ameriscan, we prefer to use a combination of per channel data and multichannel source location. MONPAC has proven to be an over-simplified approach when inspecting in-service pressure vessels with significant background AE activity.

MONPAC Method for Classifying Indications – Intensity Analysis (MISTRAS’ Method)
Historic Index – Compares the average signal strength of the last 20% or 200, whichever is less, events to the average signal strength of all events. It is used for determining the changes of the slope in the cumulative signal strength vs. hit curve. A sharp rise at the “knee” of the curve (a large historic index) represents the onset of damage.
Severity - The average signal strength for the ten events having the largest numerical value of signal strength. Will also increase sharply at the knee of the curve.

Example of a Zonal Intensity Plot (ZIP) Used for Intensity Analysis

Case Study #1Leaking Pressure Safety Valve (PSV)
28

Problem
▪ The client was detecting excessive H2S within the flare product flow.
▪ It was determined that the source of the excessive H2S was due to a faulty pressure safety valve (PSV) within one of their process units, but they could not narrow down which valve was faulty.
▪ Shutting down the unit would lead to approximately one week of unscheduled downtime. This unit had been previously shut down to make repairs to the PSVs, but the necessary repairs were not made to eliminate the leak in the faulty PSV.
29

Utilizing AE to Detect the Leak
• A single sensor (400KHz or
broadband) is mounted to the
valve body via a magnetic hold-
down, tape, etc.
• The acoustic emissions were
monitored for approximately
10 minutes per valve
From Researchgate.net
• Acoustic Emissions has a long history related to valve
leak detection applications. The instrumentation detects
the ultrasonic “whistling” noise related to the turbulent
flow of product through the valve.
30

Acoustic Emission Data
▪ RMS – Noise [µV] is measured over time.
▪ Ten (10) valves were tested in one day. All of the other valves exhibited a mean RMS – Noise value of approximately 6 µV.
▪ A periodic (20 second) cycling of the RMS coincided with product leakage by the valve disc.
31

Conclusion
• The client was detecting excessive H2S within the flare
product flow.
• Acoustic Emission was utilized to test ten (10) valves in the
unit to investigate the source of the product leakage.
• Leakage was detected on one of the PSVs. This provided
the operators with the information required to order the
parts to make the repairs at the next shutdown.
• Acoustic Emission was a rapid, reliable, and cost effective
means to locate the product leakage through the PSV.
32

Case Study #2Potential HTHA Damage of a Catalytic Reactor
33

Problem
• Pressure vessel survey indicted high-susceptibility to HTHA damage based on material (C-1/2 Mo), time in service, and hydrogen partial pressure.
• Thick-walled reactor - ~4 inches
• Reactor was insulated with skin temp above 700 Deg. F
• High-temp prevented other NDE methods while in service.
• Client could not shut down operating unit for internal inspection.
• Client needed information quickly to plan for future.
34

Utilizing AE to Determine Potential HTHA Damage
• Initial online AE test revealed activity near a circumferential
weld seam/heat-affected zone. High concern for potential HTHA
damage due to age/process/material.
• Reactor skin temp made it difficult for other NDE methods.
• Long-term AE monitoring was suggested in lieu of shutdown.
• Process upsets during monitoring caused rapid thermal
gradients, which caused high-amplitude AE activity in ares of
concern.
35

Acoustic Emission Data
36

Conclusion
• Plant Management requested maintaining online AE for
extended period until replacement reactor was available.
• New reactor was designed with 2-1/4 chrome material and
ordered for fabrication.
• Process controls put in place to maintain temp below 600 F to
prevent damaging excursions.
• Client able to maintain critical operations uninterrupted.
• Continuous AE monitoring has been in place for over 3 years.
• Managed remotely via cellular connection.
37

Case Study #3Coke Drums
38

Problem
• Recent laser scan showed severely bulged areas on 2 drums.
• Engineering analysis showed problematic area with bulge at a circumferential weld seam.
• Client wanted inspection with minimal disturbance to normal coking cycles and insulation.
• Scaffolding entire structure was cost-prohibitive.
• AE testing had never been performed.
39

AE Used to Detect Problem Areas for Follow-up
• Waveguides used to minimize
insulation disturbance and
protect sensor from surface
temp.
• Data collection equipment
mounted on skirt deck to
minimize cable lengths.
• Multiple AE sensors installed by a rope access crew for
all 6 drums.
• Monitoring took place during normal coking cycles.
40

Acoustic Emission Data
▪ Only data during the quench and heat-up portions of the cycle were used for data analysis.
▪ Thermal gradients during these periods are most damaging and cause the most cumulative damage.
41
Heat UpQuench

Acoustic Emission Data Cont.
▪ Several areas identified, but most severe area highlighted based on repeated AE activity during multiple cycles at same location.
42

Conclusion
• Multiple AE sensors were installed to cover entire drum
• All drums tested with no incidents and within time-frame
requested by client.
• No scaffolding required, saved client significant money.
• Most problematic area of bulge near weld seam identified
with confirmed crack after PAUT.
• AE data correlated well with laser scans and engineering
assessment.
43

Case Study #4Anhydrous Ammonia Tank
44

Problem
• Large atmospheric anhydrous ammonia tank needed periodic inspection for mechanical integrity.
• Opening tank for internal inspection not an option due to concerns with oxygen exposure exacerbating ammonia SCC potential.
• Cold temperatures caused ice to form on external walls when exposed to air.
• UT survey needed to be done simultaneously as AE inspection.
• Client unhappy with previous inspection report.
45

Ammonia Tank AE setup
• Utilized existing inspection ports
used for UT measurements to
minimize insulation disturbance.
• Methanol/Alcohol used to
mitigate ice formation during
sensor installation.
• 126 AE sensors installed by AE crew using JLG manlifts.
UT Survey performed at same time as sensor
installation.
• Monitoring took place during filling operation from
barges at dock.
46

Acoustic Emission Data
▪ No locatable AE data from propagating flaws due to ammonia SCC were observed during the fill test.
▪ Client resumed tank operation until next inspection interval.
47

Case Study #5Process Column Through-wall failure
48

Problem
• Chemical company developed through-wall failure in a process absorber tower causing immediate unit shutdown.
• Failed area removed for metallurgical analysis and new section plate welded in to repair.
• Concern about other areas of column due to unknown failure mechanism.
• Limited time to perform the inspection and give results.
49

Acoustic Emission Data
▪ Multiple AE sensors installed for complete coverage.
▪ AE testing took place during pneumatic over-pressure test.
▪ Locatable AE data was observed during the pneumatic test and reported.
▪ Recommended to the client to follow-up in the specific areas noted using conventional NDT.
50

Case Study #6H2S Driers
51

Problem
• 2 of 4 H2S Dryers developed through-wall failures during service within months of each other.
• Vessels were less than 6 years in-service, all built at same time by same fabricator.
• Material specs were reviewed and were correct for the service conditions.
• H2S being released during failures.
• Client wanted long-term inspection until vessel replacement with minimal disturbance to insulation and process.
• Needed immediate notification of potential failures.
• AE testing had never been performed at this facility – client unsure of technique.
52

Acoustic Emission Setup
▪ Multiple sensors installed per vessel to obtain 100% coverage.
▪ Waveguides used to minimize insulation disturbance and protect sensor from surface temp.
▪ Wireless connection for 24/7 monitoring.
▪ Data alarms used to alert power failures and data activity.
53

Conclusion
• Multiple AE sensors were installed on each vessel to
provide 100% coverage.
• Remote monitoring system installed with wireless access
to AE monitoring system and data.
• Alerts for any AE activity sent via text messages.
• Managed 24/7 from Houston office with no personnel in
the unit.
• Client continued normal operations for 11 months with no
incidents of failure while new vessels were fabricated for
replacement.
54

Conclusion
• Questions ?
55