Commodity Trading Industry Outlook
15
During the Nineteenth Century, Indian commodities markets viewed ever-increasing regional exchanges in several parts of the country. Although official derivatives trading in commodities began in India as early as in 1875, the ban imposed by the Government/regulators after independence had retarded the growth of com- modity futures market. The most prevalent contracts during that time were fabric futures (Cotton, Jute etc.) or contracts based on a gamut of Indian exotic spices (Pepper, Turmeric etc.) 1 . Since 1980s in general and economic and trade liberalisation in the early 1990s in particular, the Government of India (GoI) formed several advisory Committees namely, Committee on Forward Markets (Khusro Commit- tee),Committee on Forward Markets (Kabra Committee) and Expert Committee on Strengthening and Develop- ing Agricultural Marketing (Guru Committee) to revive the commodity futures market in India. Over the course of time, the need for a regulated market offering standardized products was realised. In this background, the nationwide regulatory authority, Forward Markets Commission (FMC) was established in 1953 under the Forwards Contracts Regulations Act, 1952 (FCRA) 2 . The merger of FMC with the Securities Exchange Board of India (SEBI) in September 2015, further increased investors’ confidence in the Indian Commodities Markets. FCRA was repealed and commodities derivatives regulation was brought under the under the defini- tion of securities under the Securities Contracts (Regulation) Act,1956 (SCRA). INDUSTRY OUTLOOK 5 August 2019 Commodity Trading Industry Outlook
Transcript of Commodity Trading Industry Outlook
During the Nineteenth Century, Indian commodities markets viewed ever-increasing regional exchanges in
several parts of the country. Although official derivatives trading in commodities began in India as early as in
1875, the ban imposed by the Government/regulators after independence had retarded the growth of com-
modity futures market. The most prevalent contracts during that time were fabric futures (Cotton, Jute etc.) or
contracts based on a gamut of Indian exotic spices (Pepper, Turmeric etc.)1.
Since 1980s in general and economic and trade liberalisation in the early 1990s in particular, the Government
of India (GoI) formed several advisory Committees namely, Committee on Forward Markets (Khusro Commit-
tee),Committee on Forward Markets (Kabra Committee) and Expert Committee on Strengthening and Develop-
ing Agricultural Marketing (Guru Committee) to revive the commodity futures market in India.
Over the course of time, the need for a regulated market offering standardized products was realised. In this
background, the nationwide regulatory authority, Forward Markets Commission (FMC) was established in 1953
under the Forwards Contracts Regulations Act, 1952 (FCRA)2. The merger of FMC with the Securities Exchange
Board of India (SEBI) in September 2015, further increased investors’ confidence in the Indian Commodities
Markets. FCRA was repealed and commodities derivatives regulation was brought under the under the defini-
tion of securities under the Securities Contracts (Regulation) Act,1956 (SCRA).
INDUSTRY OUTLOOK
5 August 2019
Commodity Trading Industry Outlook

Government/Regulator’s initiatives
PRODUCT DEVELOPMENT AND DIVERSIFICATION
Market regulator SEBI has allowed mutual funds’ entry into commodity derivatives markets. Mutual Fund
Amendment Regulations 2018 and the Portfolio Management Amendment Regulations 2016 would be
amended enabling portfolio and mutual fund managers to participate in agri and non-agri commodity deriva-
tives segment (CDS)4. SEBI has also allowed options trading in many commodities –gold, crude, copper, guar
etc. To enhance liquidity, liquidity enhancement scheme in gold options is also allowed. Such moves are expect-
ed to increase retail participation, and thus volumes in commodities, though the pace may not match the equity.
In 2019, MCX has taken step to modify optional delivery of Zinc and aluminum to compulsory delivery mecha-
nism. In other words, MCX has amended aluminium and zinc contract specifications to make delivery ‘compul-
sory’ against the current optional delivery mechanism. The physical settlement will be executed through the
Comris account. Mandatory delivery in aluminum would start from March and for Zinc from April onwards. The
pricing is based on local prices that are traded on MCX along with taxes, freight, landing cost and warehousing
cost.
In India, several derivatives contracts launched are unable to generate market interest. For instance, in 2014,
MCX discontinued its potato futures due to the lack of depth in the markets. Specialised futures and options
allow traders to pursue better hedging strategies based on their requirements, for example, brass futures. In
2018, MCX launched brass contracts. Instead of hedging for all the constituents of brass (Copper, Zinc, Lead
and Iron), it is simpler for traders to reduce exposure to all price fluctuations by investing in brass futures.
RECENT DEVELOPMENTS
After continuous recovery was seen in 2016 and 2017, the year 2018 can be marked as an unstable year for
commodities. The CRB Index, in the first two-quarters of 2018 was well-built. However, after that the index
witnessed major drop in the prices, especially in 4th quarter on distress selling in agro commodities amid histor-
ical corrections in metals and energy, amid fall in equity market and rise in dollar index3. The year 2018 was
also characterized by the geopolitical tension between USA and North Korea and some unrest in Middle East.
Further, US and China trade war made the whole world nervous and disturbed the historical trading pattern. At
the same time Brexit issue will prolong to trouble the financial market. Confidence in currency is fragile right
now be it EU currencies or emerging nations. Gold may get stronger further for the same reason amid some
ambiguity in stock market.

MSP FOR KHARIF CROPS OF 2019-20 SEASON
Volatility in spot prices is one of the main reasons for hedging in commodity futures. The disposition to partici-
pate in a derivatives market will increase by easing the mechanism the investors use to arrive at a trust-based
spot price. E-NAM (Electronic National Agricultural Markets) is one such initiative by the Government of India to
allow farmers across different states to have virtual access to physical ‘mandis’ (spot markets). This electronic
platform allows state level agricultural markets to integrate at a national level promoting the uniformity.
A framework for warehouse companies and other allied service providers engaged in non-agricultural goods to
help in settlement and delivery mechanisms was proposed by SEBI in 2018. The proposed guidelines would be
applicable for warehouses and assayers engaged in non-agricultural commodities such as precious metals,
gems and stones, metals, minerals and alloys but excludes crude oil, electricity and natural gas. In order to
ensure efficient delivery by the clearing corporations (CC), SEBI is considering a broad set of standards and
norms for compliance by CC accredited storage agencies for storage of physically delivered non-agri goods.
Under the proposal, Sebi said there should be a tripartite agreement among stock exchange, clearing corpora-
tion and warehouse service providers (WSP). Sebi observed that warehousing or storage infrastructure and its
ancillary services play a critical role in the delivery mechanism of the commodity derivatives markets5.
The Cabinet Committee on Economic Affairs has approved the increase in the Minimum Support Prices (MSPs)
for all kharif crops for 2019-20 season. For the kharif crops of 2019-20, Government has increased the MSPs
of soybean by Rs 311 per quintal, sunflower by Rs 262 per quintal and sesame by Rs 236 per quintal which is a
major step towards increasing the income of farmers. Government has increased the MSPs of tur by Rs.125 per
quintal and urad by Rs.100 per quintal. This will help address the issues related to requirement of pulses in view
of the need to meet the nutritional security and protein requirements of a large section of population. The MSP
of jowar has been hiked by Rs 120 per quintal while in case of ragi it has been hiked by Rs 253 per quintal. The
move comes in the backdrop of the need to promote cultivation and consumption of nutri-cereals. Besides, India
celebrated 2018 as the National Year of Millets and the Food and Agriculture Organisation (FAO) Council has
approved India's proposal to observe an International Year of Millets in 2023. For cotton (medium staple) and
cotton (long staple), the MSP has been increased by Rs. 105 per quintal and Rs. 100 per quintal respectively6.

Table 1: Turnover in the Commodity Derivative market (in INR Trillion)
Table 2: Federal Open Market Committee (FOMC) and European Central Bank (ECB) meeting schedule for 2019
Source: SMC report Commodity Outlook 2019
Source: FOMC, ECB and SMC Commodity Outlook 2019
Year Turnover in the Commodity Derivative market
(in INR Trillion)
2012-13 170
2013-14 101
2014-15 NA
2015-16 67
2016-17 64
2017-18 60
2018-19
(Apr-Nov)
45
Sl No. Months 2019 Federal Open Market Committee (FOMC) Meeting
European Central Bank (ECB) Meeting
1 January 29th and 30th 9th and 24th
2 February _ 6th and 20th
3 March 19th and 20th 7th and 20th
4 April 30th 10th
5 May 1st 8th and 22nd
6 June 18th and 19th 6th and 26th
7 July 30th and 31st 10th and 25th
8 August _ 7th
9 September 17th and 18th 12th and 25th
10 October 29th and 30th 24th
11 November _ 6th and 20th
12 December 10th and 11th 5th and 12th

World Bank Commodity Market Outlook 2019
At present, many Indian companies prefer to hedge on London Metal Exchange (LME)7. The launch of compul-
sory delivery contracts will provide them with a mechanism to hedge in India only, thus enabling them to avoid
additional currency risk that arises due to LME trading8. Making delivery compulsory in zinc and aluminum
contracts would result in traders rolling over contracts before expiry. This compulsory delivery also opens up
scope for improvement of warehousing sector, as compulsory delivery needs more warehouses, grading system
and assaying9.
According to the World Bank’s latest Commodity Markets Outlook 2019 (April 2019), most commodity prices
gained momentum during the first quarter of 2019. Production cuts by OPEC and its partners have substantially
reduced global supply and supported oil prices. In contrast, prices of Asian LNG imports have plunged on
weaker demand and surging U.S. exports, which rose by one-third between 2018 Q3 and 2019 Q1. In
2019-20, U.S. farmers intend to substitute soybean plantings with other crops, including maize.
Crude oil prices, which averaged $68/bbl in 2018, are expected to average $66/bbl over 2019 and $65/bbl
in 2020, with balanced risks primarily related to policy outcomes. Non-energy prices in 2019 are expected to
remain below 2018 averages, before rising moderately in 2020 as the global economy emerges from its recent
soft patch. The weakness of energy, as well as metal and mineral prices in late 2018, mainly reflected concerns
about global growth, especially in China amid trade tensions. Renewed fiscal stimulus and the resumption of
U.S.- China trade negotiations in January, however, improved growth prospects and supported a rebound in
commodity prices. This rebound was compounded by a series of commodity-specific supply factors.
Crude oil prices fell 6 percent in the first quarter of 2019 (q/q) following a 11.5 percent decline in the previous
quarter. However, prices have risen steadily since the start of the year, with the price of Brent crude oil reaching
$74/bbl and West Texas Intermediate (WTI) reaching $66/bbl in late April. These fluctuations have been driven
by supply developments: in November the United States granted waivers to its sanctions against Iran to eight
countries, which, together with a sharp increase in supply among OPEC countries, primarily Saudi Arabia,
resulted in much higher than- expected global production in the last quarter of 2018. This contributed to oil
prices plunging 41 percent between mid-October and December. However, subsequent production cuts by
OPEC and its partners, together with supply disruptions elsewhere, have since boosted prices.
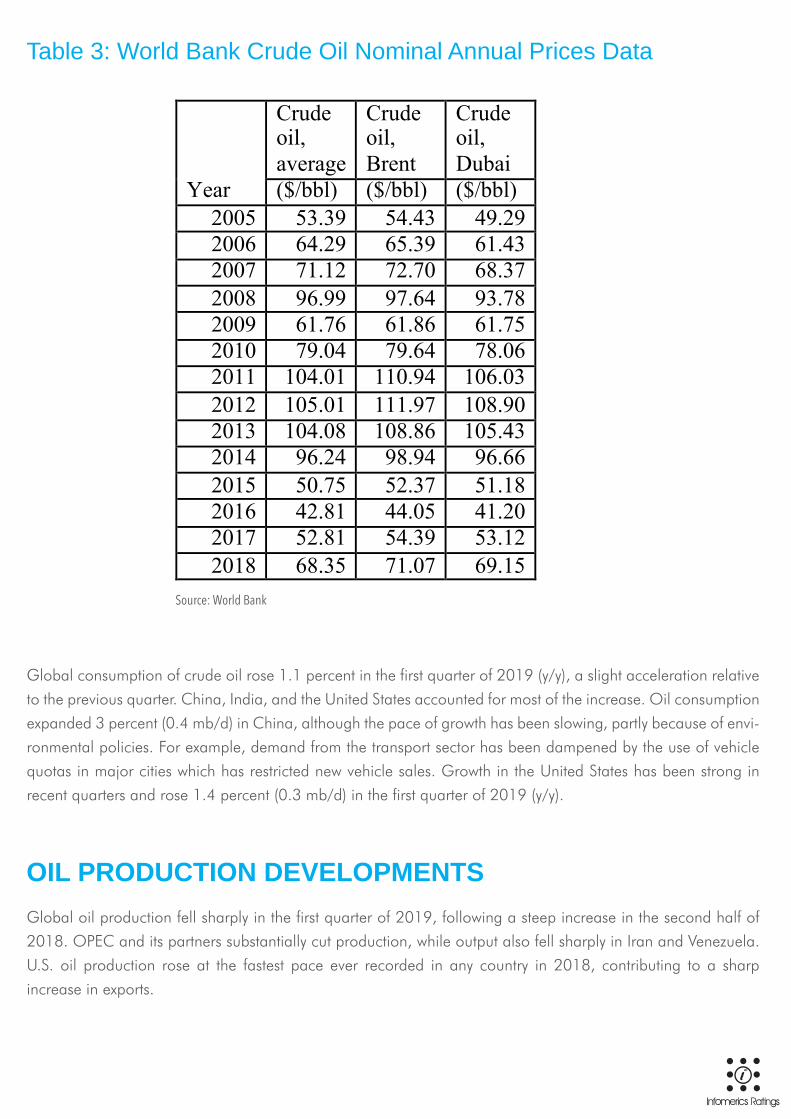
Table 3: World Bank Crude Oil Nominal Annual Prices Data
Global consumption of crude oil rose 1.1 percent in the first quarter of 2019 (y/y), a slight acceleration relative
to the previous quarter. China, India, and the United States accounted for most of the increase. Oil consumption
expanded 3 percent (0.4 mb/d) in China, although the pace of growth has been slowing, partly because of envi-
ronmental policies. For example, demand from the transport sector has been dampened by the use of vehicle
quotas in major cities which has restricted new vehicle sales. Growth in the United States has been strong in
recent quarters and rose 1.4 percent (0.3 mb/d) in the first quarter of 2019 (y/y).
OIL PRODUCTION DEVELOPMENTS Global oil production fell sharply in the first quarter of 2019, following a steep increase in the second half of
2018. OPEC and its partners substantially cut production, while output also fell sharply in Iran and Venezuela.
U.S. oil production rose at the fastest pace ever recorded in any country in 2018, contributing to a sharp
increase in exports.
Source: World Bank
Year
Crude oil, average
Crude oil, Brent
Crude oil, Dubai
($/bbl) ($/bbl) ($/bbl) 2005 53.39 54.43 49.29 2006 64.29 65.39 61.43 2007 71.12 72.70 68.37 2008 96.99 97.64 93.78 2009 61.76 61.86 61.75 2010 79.04 79.64 78.06 2011 104.01 110.94 106.03 2012 105.01 111.97 108.90 2013 104.08 108.86 105.43 2014 96.24 98.94 96.66 2015 50.75 52.37 51.18 2016 42.81 44.05 41.20 2017 52.81 54.39 53.12 2018 68.35 71.07 69.15

OIL MARKET PROSPECTSOil prices are expected to average $66/bbl in 2019, amid weaker expectations for demand growth in 2019,
rising U.S. production, and OPEC restraint. Increased levels of spare capacity in OPEC countries and adequate
inventories provide a buffer against unexpected outages.
Source: Petroleum Planning & Analysis Cell (PPAC)
Source: Petroleum Planning & Analysis Cell (PPAC)
Table 4: Crude Oil Price (Indian Basket) 2018-19 (Apr-March) 2019-20 (Apr-June) [USD/bbl] Year Apr May June July Aug Sept Oct Nov Dec Jan Feb Mar Apr May June
2018-19
69.22
75.25
73.83
73.47
72.53
77.88 80.08
65.40 57.77 59.27
64.53 66.74
2019-20
71.00
70.02
62.39

World Bank Energy Commodities Price Data
World Bank Non Energy Commodities Price Data
Source: World Bank Commodity Market Outlook 2019
Source: World Bank Commodity Market Outlook 2019

Other Product/Commodity wise developments are as follows:
Natural GasNatural gas prices have been volatile over the past 12 months, and price differentials between the three bench-
marks have shrunk on increased supply. Very low levels of inventories in the United States contributed to tempo-
rary price spikes in 2018. Coal prices also fell sharply in the first quarter of 2019, on lower natural gas prices
and reduced demand from China and some other countries.
Agricultural Price DevelopmentsAgricultural commodity prices stabilized in 2019 Q1 following declines in 2018. The factors that pushed prices
down last year have moderated, including easing of trade tensions, lower plantings in the U.S., and stabilization
of currencies of key exporters.
Grains, Oils and MealsThe World Bank’s Grain Price Index gained nearly 2 percent in the first quarter of 2019 (q/q), and is more than
1 percent higher than a year ago. Production estimates for 2018-19 have been revised upward throughout the
season. According to the U.S. Department of Agriculture’s (USDA) latest assessment (April 2019), global sup-
plies of the three main grains (wheat, maize, and rice) are projected to reach 3,126 million metric tons (mmt)
this season (September 2018 to August 2019), nearly 1 percent higher than last season’s supplies. The World
Bank’s Oil and Meals Price Index remained broadly stable in the first quarter of 2019 (q/q) but stands 14
percent lower than 2018 Q1. Although there was price weakness across the board last year, it was more
pronounced in coconut, palm kernel, and palm oils, whose prices plunged by 42, 38, and 17 percent, respec-
tively, from 2018 Q1 to 2019 Q1.
The edible oil production outlook for the current season (ending September 2019) continues to look promising
due to favorable growing conditions. Global output of the 17 major edible oils (including palm, soybean, and
rapeseed, which together account for two-thirds of global output) is forecast to increase 2 percent in the
2018-19 season. More than two-thirds of the production gains are projected to come from palm oil. Indonesia
and Malaysia are the primary producers of palm oil, and both are experiencing favorable weather conditions.
Most of the remaining growth is expected from sunflower oil, due to good growing conditions in Ukraine and
Russia, which together account for half of global output. Global oilseed output for 2018-19 is also projected
to rise, with supplies of the 10 major oilseeds projected to reach 578 mmt, up from last season’s 566 mmt. All
of the growth is expected to come from soybeans, mostly from Argentina and, to a lesser extent, the United
States. Global soybean prices were also depressed by upwardly revised production estimates and weaker
demand for animal feed resulting from the spread of African swine flu to China in the second half of 2018. The
edible oil and oilseed markets have also been affected by trade frictions. Soybeans were particularly impacted
by the imposition of a 25 percent tariff in July 2018 by China on imports from the United States. Because the
U.S. and China are the largest players in the global soybean market—the United States accounts for one-third
of global production and China accounts for two thirds of global imports—the tariffs exerted downward pres-
sure on soybean prices.

METALS AND MINERALS
Agricultural raw materials market developmentsNatural rubber prices staged a recovery in response to supply shortfalls of key Asian suppliers. Cotton prices
remain weak on expected ample supplies due to larger plantings.
FertilizersThe World Bank’s Fertilizer Price Index fell 5.4 percent in the first quarter of 2019 (q/q) after three consecutive
quarterly increases. Seasonally weak Chinese demand, limited fertilizer application in North America, and
declines in input costs contributed to the recent price fall. Fertilizer demand is expected to recover and the price
index is forecast to increase by 4.8 percent in 2019, led by potash. Over the medium term, prices are subject
to downside risks as adoption of enhanced-efficiency specialty fertilizers (controlled and slow-release) gain
pace, leading to reduced application of conventional fertilizers.
Alone among base metals, aluminum prices dropped 5.1 percent in the first quarter as supply concerns reced-
ed in early 2019. A production embargo on the world’s largest alumina refinery, Alunorte in Brazil (10 percent
of global alumina supply excluding China), due to alleged environmental breaches was lifted although the
resumption of full production is still awaiting federal court approval. Aluminum production and smelter capacity
have expanded in China where environmental curbs were less stringent than expected. Aluminum prices are
projected to fall by 8 percent in 2019 reflecting lower alumina prices and large aluminum overcapacity in
China. Risks are tilted to the upside arising from tighter-than-expected environmental policies in China and a
delayed resumption of Alunorte’s full production.
Zinc prices increased 3.1 percent in the first quarter following gains in the preceding quarter,accompanied by
steep drawdowns in inventories. Price increases have largely reflected robust demand from China, which
accounts for half of global consumption, and smelter bottlenecks that restricted refined output. Against the
backdrop of rapidly growing zinc ore production, smelter capacity constraints have driven refining fees (zinc
concentrate treatment charges) to near recordhighs. Zinc prices are projected to fall by 1.8 percent in 2019 on
moderating demand and new ore production coming onstream from Australia, Canada, and South Africa. This
outlook is subject to upside risk from the possibility of tighter-than expected environmental policy in China con-
straining smelter capacity.
Lead prices rose 3.6 percent in the first quarter, in a partial rebound from declines in the preceding two quar-
ters. Prices were supported by strong import demand from China, which accounts for two-fifths of global con-
sumption, amid production cuts in the country as a result of efforts to reduce emissions. Inventories have also
fallen to the lowest level in nearly 10 years. Lead prices are projected to gradually increase over the remainder
of 2019 but remain 11.6 percent lower than in 2018. More stringent environmental regulations. In China
restricting the recycling of lead scrap materials, which accounts for more than two-fifths of total refined produc-
tion, presents an upside risk to the forecast. Over the medium term, a shift toward electric vehicles is likely to
depress demand for lead, which is heavily used in batteries for internal combustion engine vehicles but not in
electric vehicles. Tin prices saw the largest increase among base metals in the first quarter, rising 9.9 percent
(q/q), largely reversing declines in the two preceding quarters. Iron ore prices increased sharply by 16.2 percent
in the first quarter, primarily due to supply disruptions in Brazil and Australia.
Precious Metals
Gold prices, after reaching a recent trough in September 2018, increased 6.1 percent in the first quarter. Prices
have been supported by strong demand and a fall in long-term real interest rates. The depreciation of the U.S.
dollar against the renminbi led to a strengthening in Chinese jewelry demand. Emerging market central banks,
particularly China, India, Russia, and Turkey, have increased gold holdings to diversify their asset base, and
investors have increased net long positions in gold-backed exchange traded funds. These factors have more
than offset soft industrial demand. Demand in the electronics sector has been stable but the use of gold in
dental applications continues to fall due to the preference for cheaper porcelain alloys. Gold prices are
forecast to be 3.2 higher in 2019 on expectations of robust demand and a prolonged pause in interest rate
hikes by the U.S. Federal Reserve.
Silver prices have moved in line with gold, rising 6.9 percent in the first quarter. Silver’s heavy discount to gold
has led investors to diversify their portfolios, with Indian investment demand rising. Jewelry demand and silver-
ware fabrication also rose moderately. However, industrial demand for silver, which accounts for more than half
of total demand, remains weak. Tariffs on solar imports to the United States led to reduced use of silver in solar
panels in 2018, and this trend is expected to persist. The use of silver in photovoltaics is expected to decline as
it is one of the most expensive components. Silver prices are projected to remain broadly unchanged in 2019.
Platinum prices remained unchanged in the first quarter of 2019 after steep declines in the first three quarters
of 2018. Jewelry and automotive demand, each accounting for about two-fifths of platinum demand, continue
to trend lower. Platinum, used extensively in the catalytic converters on diesel engine vehicles, has fallen out of
favor in Europe due to declining market share for diesel vehicles. On the other hand, the price of palladium,
which is used for pollution control in gasoline-powered vehicles, has been boosted by supply disruptions in
South Africa. Despite diverging platinum and palladium prices, prospects for substitution are limited at present
due to technical constraints. In addition, with the switch to electric vehicles on the horizon there is less incentive
to invest in platinum-based technology, which may become obsolete. Platinum prices are expected to decline
by 4.5 percent in 2019.
According to the NCDEX latest report in July 2019, among Agri commodities, Cotton seed oil cake, Carda-
mom, and Crude palm oil remained the largest gainers on the long side whereas Coriander, Guar gum, and
Mentha oil remained the best performers on the short side during the week ending on July 26, 2019. Among
Non-agri commodities, Lead, Silver and Crude oil remained the largest gainers on the long side whereas Natu-
ral gas, Aluminium and Steel remained the best performers on the short side during the week ending on July
26, 201910.
Cotton prices gained initially in the month of October on lower new crop arrivals and recovery in ICE cotton
prices after a positive report from USDA. Later, prices have fallen on lower demand from textile industry and rise
Industry Risk
The government is in the process of addressing the issue of Commodity Transaction Tax (CTT) and exploring
the possibility of a cut in the CTT rate. According to the Commodity Participants Association of India (CAPI),
CTT was making India one of the most expensive markets to hedge commodity price risk. After the merger of
FMC with SEBI, the commodities derivatives markets were also under surveillance within the Integrated Surveil-
lance System of SEBI, which has been used for the securities market. This enhanced the vigil over the commodi-
ties markets effectively and enabled SEBI in taking appropriate actions for any misconduct and manipulation of
the market.
According to World Bank report on Commodities Market Outlook in 2019, due to the weak start into the year,
energy prices are expected to average 5.4 percent lower in 2019 than in 2018 (a downward revision from
October) followed by a slight decline in 2020. Non-energy prices are projected to decline 2.1 percent in 2019
(a modest downward revision from October) followed by a pick up in 2020.
in arrivals. In December, the marginal recovery owing to crop losses in Gujarat and Maharashtra did not
sustain and prices have fallen amid India trade negotiations with China and lower demand from ginners due
to adequate stocks. However, prices started gaining at the end of February amid rising consumption in both
domestic & overseas market and weakened rupee and continued in the month for March, supported by
increased demand from China and Vietnam11.
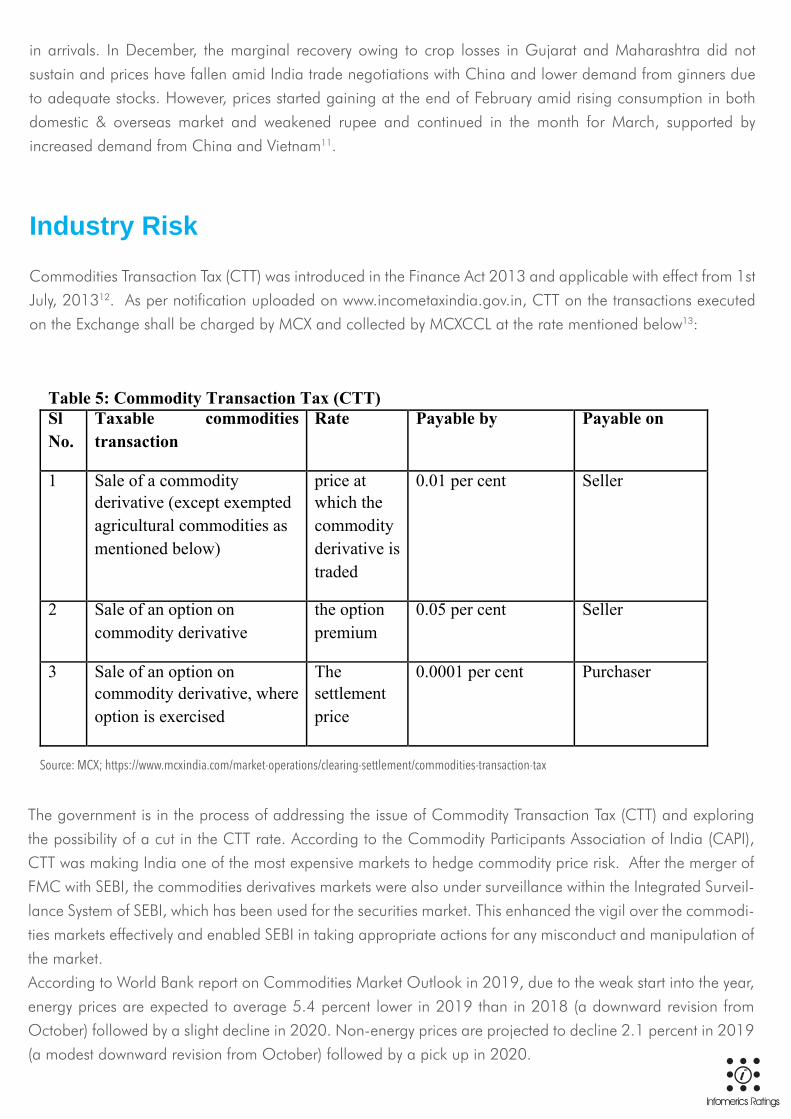
Commodities Transaction Tax (CTT) was introduced in the Finance Act 2013 and applicable with effect from 1st
July, 201312. As per notification uploaded on www.incometaxindia.gov.in, CTT on the transactions executed
on the Exchange shall be charged by MCX and collected by MCXCCL at the rate mentioned below13:
Table 5: Commodity Transaction Tax (CTT) Sl No.
Taxable commodities transaction
Rate Payable by Payable on
1 Sale of a commodity derivative (except exempted agricultural commodities as mentioned below)
price at which the commodity derivative is traded
0.01 per cent Seller
2 Sale of an option on commodity derivative
the option premium
0.05 per cent Seller
3 Sale of an option on commodity derivative, where option is exercised
The settlement price
0.0001 per cent Purchaser
Source: MCX; https://www.mcxindia.com/market-operations/clearing-settlement/commodities-transaction-tax
Future Outlook
The outlook for commodity prices, especially oil, is vulnerable to policy-related risks. Other risks include geo-
political events such as conflict in Libya, weaker-than-expected growth in major oil consumers, especially China
and the United States, and environmental policies.
Metal prices are expected to continue their recovery in 2019 and 2020 following sharp drops in the second
half of 2018. Supply concerns (especially in copper and zinc), disruptions (in iron ore production due to the
tailings dam disaster in Brazil), and China’s fiscal stimulus are expected to provide support. Downside risks
include a weaker-than expected demand boost from China’s fiscal stimulus and a prolonged stall in U.S.-China
trade negotiations; upside risks include tighter-than expected environmental policies and slower-than expected
easing of supply bottlenecks. Agricultural prices are expected to fall 2.6 percent in 2019, on average, amid
ample stocks. In 2020, prices are expected to rise 1.7 percent on expected cuts in U.S. crop plantings and
higher costs of energy and fertilizers.
Risks to this outlook are to the upside. Higher-than-expected energy costs could lift prices of some crops such
as grains and oilseeds. Greater-than-projected growth in biofuel production could also lead to higher prices
for some food commodities. The report also highlighted several risks for agricultural products like- strengthen-
ing of the U.S. dollar and currency movements of major exporters of particular commodities, adverse weather
patterns (including the ongoing weal El Nino), diversion of food commodities to biofuels.
After a turbulent 2018, the year 2019 seems to be an interesting year in many aspects. Hostile trade environ-
ment, political events, tension in Europe may slowdown the upside journey but overall the moderate growth is
expected. The year 2019 is expected to remain volatile due to trade war issue, OPEC and Non-OPEC produc-
tion cut, many elections viz. in US (2020) and India (2019), Brexit, Italy issue, fragile currencies, expectations
of El Nino etc. Metals and energy will keep investors on toes and agro commodities are likely to be more remu-
nerative this year on account of lower production. Recently, India became the first country in the world to launch
diamond futures owing to concentration of diamond polishing and cutting here. Going forward, the commodi-
ty market scenario will improve with increased participation, new financial products, accountable settlement
process etc.
FOOTNOTES
1. ‘Indian Commodity Markets-Outlook for 2025’; https://www.mcxindia.com/docs/default-source/about-us/commodi-ty-insights-yearbook/2018/02-emerging-trends/1-indian-commodity-markets/indian-commodity-markets-outlook-for-2025---m-thenmozhi.pdf?sfvrsn=aaf6c890_22. ‘Indian Commodity Markets-Outlook for 2025’; https://www.mcxindia.com/docs/default-source/about-us/commodi-ty-insights-yearbook/2018/02-emerging-trends/1-indian-commodity-markets/indian-commodity-markets-outlook-for-2025---m-thenmozhi.pdf?sfvrsn=aaf6c890_23. SMC report Commodity Outlook 2019.4. ‘Expect commodities market to see rapid expansion after recent SEBI moves’(30 March 2019)Economic Times https://economictimes.indiatimes.com/markets/commodi-ties/news/expect-commodities-market-to-see-rapid-expansion-after-recent-sebi-moves/articleshow/68643413.cms?from=mdr5. ‘SEBI proposes warehousing norms for non-agri goods’(5 December 2018) HinduBusinessLine https://www.thehindubusinessline.com/markets/sebi-propos-es-warehousing-norms-for-non-agri-goods/article25672223.ece and ‘Consultation paper on framework for Warehouse Service Providers (WSP), warehouses, assayers and other allied service providers engaged inrespect of non- agricultural goods such as precious metals, gems & stones, metals, minerals and alloys but excluding crude oil, electricity and natural gas6. NICR (NCDEX Group company) Monthly Commodities Report (June 2019) https://www.ncdex.com/Downloads/Knowledge/pdf/Monthly_Commodi-ties_Report_June_2019.pdf

Disclaimer‘ Infomerics Valuation And Rating Private Limited has taken due care and caution in preparing the report and information is based from sources which it believes to be reliable and authentic. However, Infomerics Valuation and Rating Private Limited does not guarantee the accuracy, timeliness, adequacy or completeness of any information and is not responsible for any errors or omissions. Use of information and data contained in this report is at user’s own and sole risk.The management of Infomerics Valuation and Rating Private Limited are not liable for the results obtained and interpreted from the use of such information.’
Infomerics Valuation And Rating Pvt. Ltd.SEBI REGISTERED / RB I ACCREDITED / NS IC EMPANELLED
CREDIT RAT ING AGENCY
CONTACT DETAILSMr. Sankhanath Bandyopadhyay (Economist)
Phone:011-24654796
REGISTERED & HEAD OFFICEPhone No: +91 11 24655636, 41743541, E-mail: [email protected]
Address: 104, 106,108/ 01st Floor, Golf Apartments, Sujan Singh Park, Maharishi Ramanna Marg,
New Delhi-1100003.
CORPORATE OFFICE
Mr. Santosh Kr. Yadav
Mobile No.: +91 8929802902, E-mail: [email protected]
Office No.: 022-62396023; 022-62396053
Address: Office no 1105, B wing, Kanakia Wallstreet, Off Andheri Kurla Road, Andheri East,
Mumbai -4000093.
EAST INDIA OFFICE
Mr. Avik Sarkar
Mobile No.: +91 8929802903, E-mail: [email protected]
Office No.: 033-46022266,
Branch office Address: 202, 2nd Floor, Justice Court,
2/3 Justice Dwarkanath Road, Near Elgin Road Lee Road Crossing,
Kolkata-700020.
AHMEDABAD OFFICE
Mr. Dheeraj Jaiswal
Mobile No.: +91 8929802910, E-mail: [email protected]
Branch office Address: 1102/A, Synergy Tower, Prahaladnagar Corporate Road,Nr. Vodafone House, Off S. G. Highway,
Ahmedabad - 380015, Gujarat, India