Commodity Price Forecasts - Oxford Economics · 3 Commodity Price Forecasts • We expect world oil...
19
Commodity Price Forecasts: September 2012 Copyright (C) 2012 Oxford Economics
Transcript of Commodity Price Forecasts - Oxford Economics · 3 Commodity Price Forecasts • We expect world oil...
Commodity Price Forecasts:
September 2012
Copyright (C) 2012 Oxford Economics
1
Commodity Price Forecasts
Contents
1 Contents .......................................... ................................................. 1
2 Overview .......................................... ................................................. 2
3 Latest Forecasts .................................. ............................................ 6
3.1 Oil Prices ..................................................................................................... 6 3.2 Non-Oil Commodity Price Indices ............................................................... 7 3.3 Base Metal Indices ................................................................................... 10
4 Recent Developments ............................... .................................... 13
4.1 Energy ....................................................................................................... 14 4.2 Base Metals .............................................................................................. 15 4.3 Precious Metals ........................................................................................ 17 4.4 The Economist Price Indices .................................................................... 18
Commodity Price Forecasts
Commodity Price Forecasts: September 20122
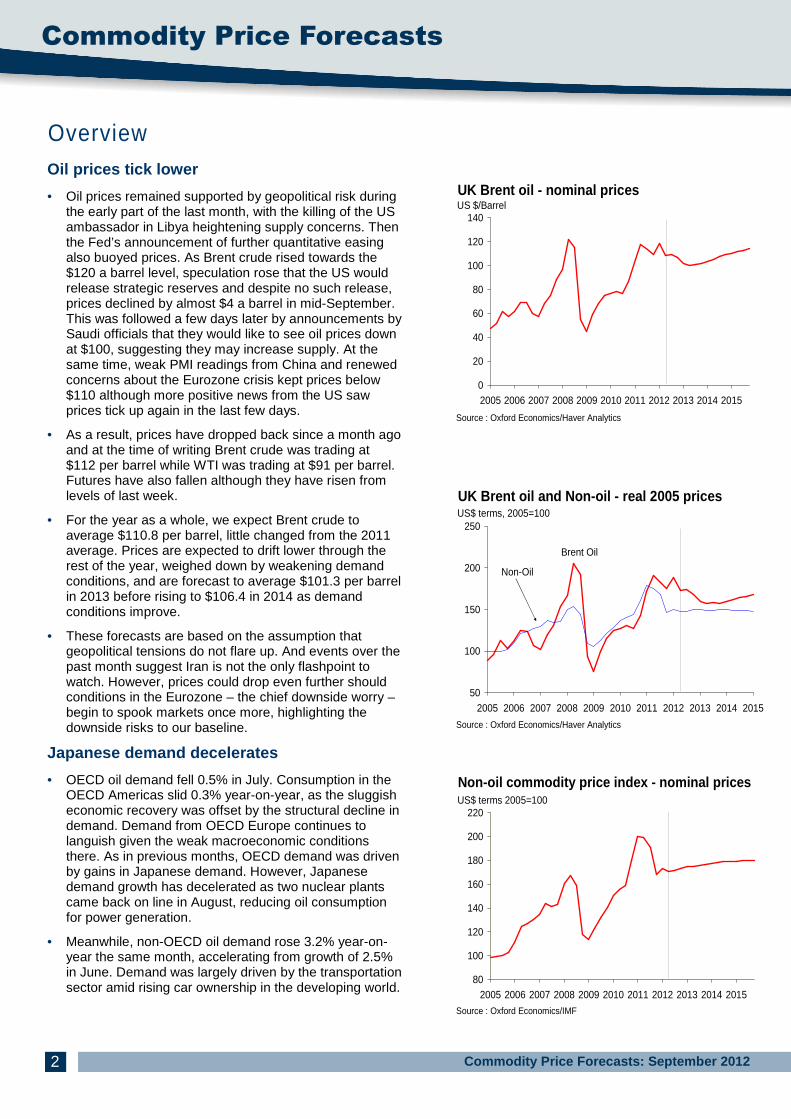
Overview Oil prices tick lower
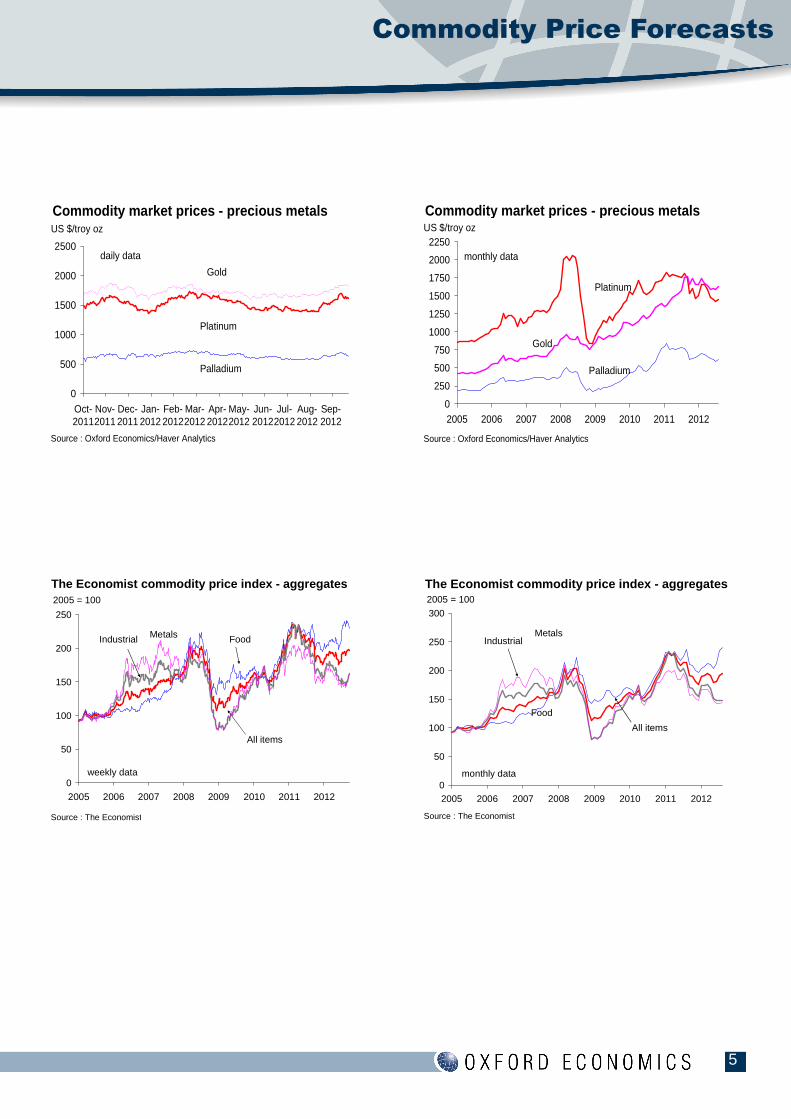
• Oil prices remained supported by geopolitical risk during the early part of the last month, with the killing of the US ambassador in Libya heightening supply concerns. Then the Fed’s announcement of further quantitative easing also buoyed prices. As Brent crude rised towards the $120 a barrel level, speculation rose that the US would release strategic reserves and despite no such release, prices declined by almost $4 a barrel in mid-September. This was followed a few days later by announcements by Saudi officials that they would like to see oil prices down at $100, suggesting they may increase supply. At the same time, weak PMI readings from China and renewed concerns about the Eurozone crisis kept prices below $110 although more positive news from the US saw prices tick up again in the last few days.
• As a result, prices have dropped back since a month ago and at the time of writing Brent crude was trading at $112 per barrel while WTI was trading at $91 per barrel. Futures have also fallen although they have risen from levels of last week.
• For the year as a whole, we expect Brent crude to average $110.8 per barrel, little changed from the 2011 average. Prices are expected to drift lower through the rest of the year, weighed down by weakening demand conditions, and are forecast to average $101.3 per barrel in 2013 before rising to $106.4 in 2014 as demand conditions improve.
• These forecasts are based on the assumption that geopolitical tensions do not flare up. And events over the past month suggest Iran is not the only flashpoint to watch. However, prices could drop even further should conditions in the Eurozone – the chief downside worry – begin to spook markets once more, highlighting the downside risks to our baseline.
Japanese demand decelerates
• OECD oil demand fell 0.5% in July. Consumption in the OECD Americas slid 0.3% year-on-year, as the sluggish economic recovery was offset by the structural decline in demand. Demand from OECD Europe continues to languish given the weak macroeconomic conditions there. As in previous months, OECD demand was driven by gains in Japanese demand. However, Japanese demand growth has decelerated as two nuclear plants came back on line in August, reducing oil consumption for power generation.
• Meanwhile, non-OECD oil demand rose 3.2% year-on-year the same month, accelerating from growth of 2.5% in June. Demand was largely driven by the transportation sector amid rising car ownership in the developing world.
50
100
150
200
250
2005 2006 2007 2008 2009 2010 2011 2012 2013 2014 2015
UK Brent oil and Non-oil - real 2005 pricesUS$ terms, 2005=100
Source : Oxford Economics/Haver Analytics
Brent Oil
Non-Oil
80
100
120
140
160
180
200
220
2005 2006 2007 2008 2009 2010 2011 2012 2013 2014 2015
Non-oil commodity price index - nominal pricesUS$ terms 2005=100
Source : Oxford Economics/IMF
0
20
40
60
80
100
120
140
2005 2006 2007 2008 2009 2010 2011 2012 2013 2014 2015
UK Brent oil - nominal pricesUS $/Barrel
Source : Oxford Economics/Haver Analytics
3
Commodity Price Forecasts
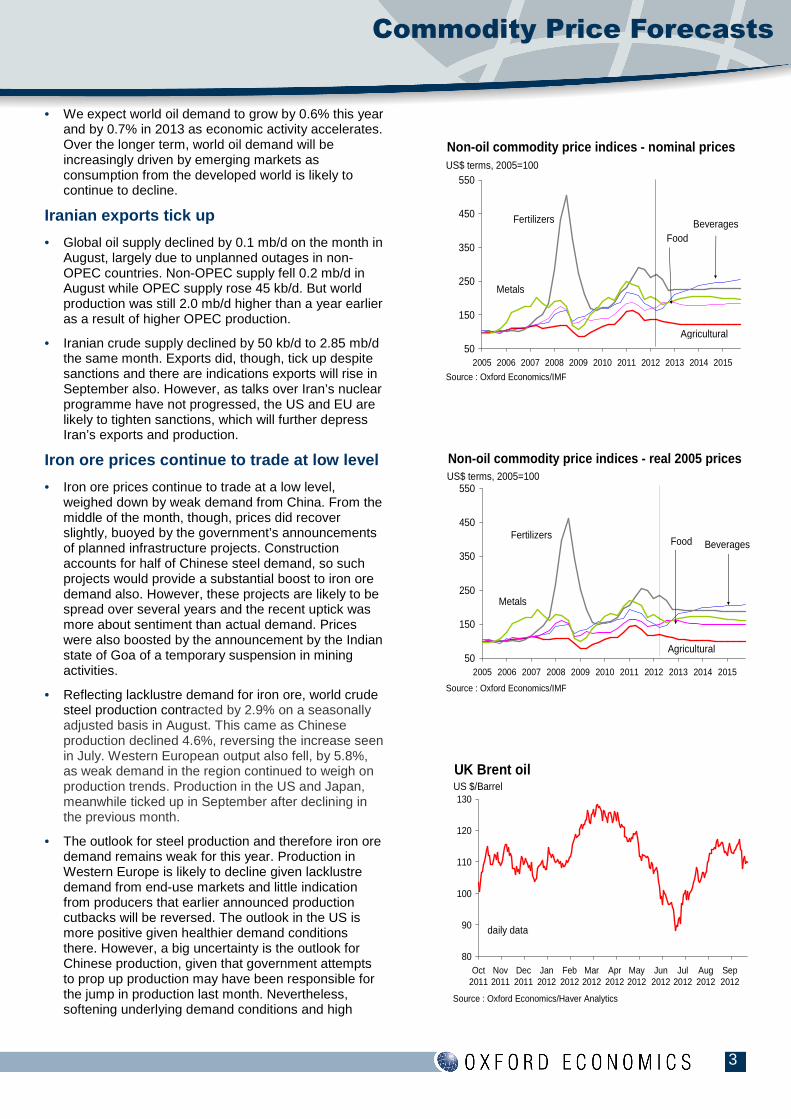
• We expect world oil demand to grow by 0.6% this year and by 0.7% in 2013 as economic activity accelerates. Over the longer term, world oil demand will be increasingly driven by emerging markets as consumption from the developed world is likely to continue to decline.
Iranian exports tick up
• Global oil supply declined by 0.1 mb/d on the month in August, largely due to unplanned outages in non-OPEC countries. Non-OPEC supply fell 0.2 mb/d in August while OPEC supply rose 45 kb/d. But world production was still 2.0 mb/d higher than a year earlier as a result of higher OPEC production.
• Iranian crude supply declined by 50 kb/d to 2.85 mb/d the same month. Exports did, though, tick up despite sanctions and there are indications exports will rise in September also. However, as talks over Iran’s nuclear programme have not progressed, the US and EU are likely to tighten sanctions, which will further depress Iran’s exports and production.
Iron ore prices continue to trade at low level
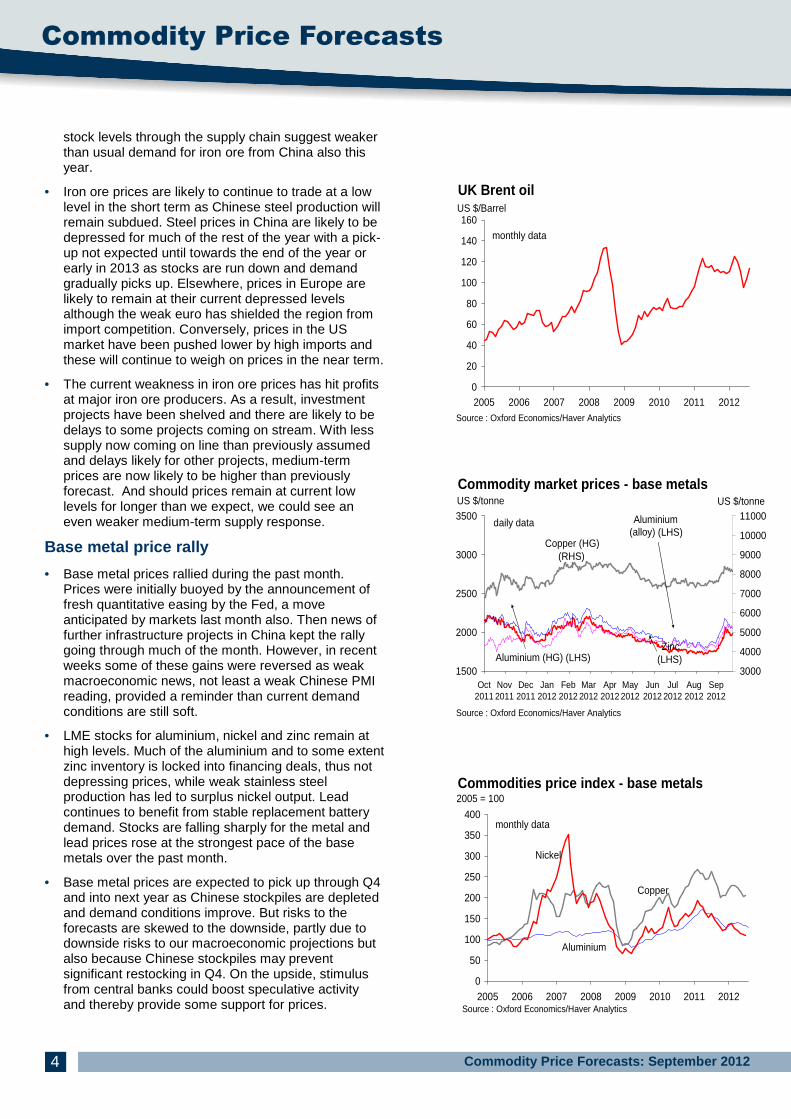
• Iron ore prices continue to trade at a low level, weighed down by weak demand from China. From the middle of the month, though, prices did recover slightly, buoyed by the government’s announcements of planned infrastructure projects. Construction accounts for half of Chinese steel demand, so such projects would provide a substantial boost to iron ore demand also. However, these projects are likely to be spread over several years and the recent uptick was more about sentiment than actual demand. Prices were also boosted by the announcement by the Indian state of Goa of a temporary suspension in mining activities.
• Reflecting lacklustre demand for iron ore, world crude steel production contracted by 2.9% on a seasonally adjusted basis in August. This came as Chinese production declined 4.6%, reversing the increase seen in July. Western European output also fell, by 5.8%, as weak demand in the region continued to weigh on production trends. Production in the US and Japan, meanwhile ticked up in September after declining in the previous month.
• The outlook for steel production and therefore iron ore demand remains weak for this year. Production in Western Europe is likely to decline given lacklustre demand from end-use markets and little indication from producers that earlier announced production cutbacks will be reversed. The outlook in the US is more positive given healthier demand conditions there. However, a big uncertainty is the outlook for Chinese production, given that government attempts to prop up production may have been responsible for the jump in production last month. Nevertheless, softening underlying demand conditions and high
50
150
250
350
450
550
2005 2006 2007 2008 2009 2010 2011 2012 2013 2014 2015
Non-oil commodity price indices - nominal pricesUS$ terms, 2005=100
Source : Oxford Economics/IMF
Metals
BeveragesFood
Agricultural
Fertilizers
50
150
250
350
450
550
2005 2006 2007 2008 2009 2010 2011 2012 2013 2014 2015
Non-oil commodity price indices - real 2005 pricesUS$ terms, 2005=100
Source : Oxford Economics/IMF
Metals
Beverages
Agricultural
FoodFertilizers
80
90
100
110
120
130
Oct2011
Nov2011
Dec2011
Jan2012
Feb2012
Mar2012
Apr2012
May2012
Jun2012
Jul2012
Aug2012
Sep2012
UK Brent oilUS $/Barrel
Source : Oxford Economics/Haver Analytics
daily data
Commodity Price Forecasts
Commodity Price Forecasts: September 20124
stock levels through the supply chain suggest weaker than usual demand for iron ore from China also this year.
• Iron ore prices are likely to continue to trade at a low level in the short term as Chinese steel production will remain subdued. Steel prices in China are likely to be depressed for much of the rest of the year with a pick-up not expected until towards the end of the year or early in 2013 as stocks are run down and demand gradually picks up. Elsewhere, prices in Europe are likely to remain at their current depressed levels although the weak euro has shielded the region from import competition. Conversely, prices in the US market have been pushed lower by high imports and these will continue to weigh on prices in the near term.
• The current weakness in iron ore prices has hit profits at major iron ore producers. As a result, investment projects have been shelved and there are likely to be delays to some projects coming on stream. With less supply now coming on line than previously assumed and delays likely for other projects, medium-term prices are now likely to be higher than previously forecast. And should prices remain at current low levels for longer than we expect, we could see an even weaker medium-term supply response.
Base metal price rally
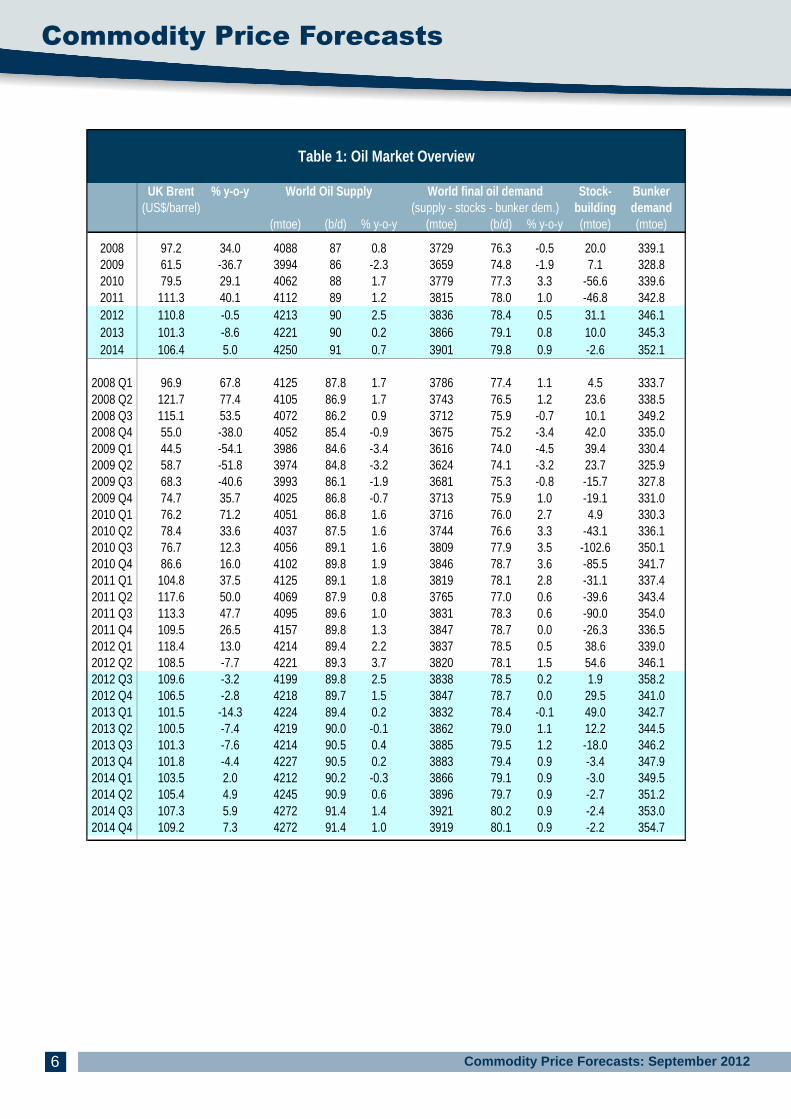
• Base metal prices rallied during the past month. Prices were initially buoyed by the announcement of fresh quantitative easing by the Fed, a move anticipated by markets last month also. Then news of further infrastructure projects in China kept the rally going through much of the month. However, in recent weeks some of these gains were reversed as weak macroeconomic news, not least a weak Chinese PMI reading, provided a reminder than current demand conditions are still soft.
• LME stocks for aluminium, nickel and zinc remain at high levels. Much of the aluminium and to some extent zinc inventory is locked into financing deals, thus not depressing prices, while weak stainless steel production has led to surplus nickel output. Lead continues to benefit from stable replacement battery demand. Stocks are falling sharply for the metal and lead prices rose at the strongest pace of the base metals over the past month.
• Base metal prices are expected to pick up through Q4 and into next year as Chinese stockpiles are depleted and demand conditions improve. But risks to the forecasts are skewed to the downside, partly due to downside risks to our macroeconomic projections but also because Chinese stockpiles may prevent significant restocking in Q4. On the upside, stimulus from central banks could boost speculative activity and thereby provide some support for prices.
0
20
40
60
80
100
120
140
160
2005 2006 2007 2008 2009 2010 2011 2012
UK Brent oilUS $/Barrel
Source : Oxford Economics/Haver Analytics
monthly data
1500
2000
2500
3000
3500
Oct2011
Nov2011
Dec2011
Jan2012
Feb2012
Mar2012
Apr2012
May2012
Jun2012
Jul2012
Aug2012
Sep2012
3000
4000
5000
6000
7000
8000
9000
10000
11000
Commodity market prices - base metalsUS $/tonne
Source : Oxford Economics/Haver Analytics
Copper (HG)(RHS)
Zinc(LHS)
Aluminium (alloy) (LHS)
Aluminium (HG) (LHS)
daily data
US $/tonne
0
50
100
150
200
250
300
350
400
2005 2006 2007 2008 2009 2010 2011 2012
Commodities price index - base metals2005 = 100
Source : Oxford Economics/Haver Analytics
Aluminium
Copper
Nickel
monthly data
5
Commodity Price Forecasts
0
250
500
750
1000
1250
1500
1750
2000
2250
2005 2006 2007 2008 2009 2010 2011 2012
Commodity market prices - precious metalsUS $/troy oz
Source : Oxford Economics/Haver Analytics
Platinum
Gold
Palladium
monthly data
0
50
100
150
200
250
300
2005 2006 2007 2008 2009 2010 2011 2012
The Economist commodity price index - aggregates2005 = 100
Source : The Economist
Food
All items
IndustrialMetals
monthly data
0
500
1000
1500
2000
2500
Oct-2011
Nov-2011
Dec-2011
Jan-2012
Feb-2012
Mar-2012
Apr-2012
May-2012
Jun-2012
Jul-2012
Aug-2012
Sep-2012
Commodity market prices - precious metalsUS $/troy oz
Source : Oxford Economics/Haver Analytics
Platinum
Gold
Palladium
daily data
0
50
100
150
200
250
2005 2006 2007 2008 2009 2010 2011 2012
The Economist commodity price index - aggregates2005 = 100
Source : The Economist
Metals FoodIndustrial
weekly data
All items
Commodity Price Forecasts
Commodity Price Forecasts: September 20126
UK Brent % y-o-y Stock- Bunker(US$/barrel) building demand
(mtoe) (b/d) % y-o-y (mtoe) (b/d) % y-o-y (mtoe) (mtoe)
2008 97.2 34.0 4088 87 0.8 3729 76.3 -0.5 20.0 339.12009 61.5 -36.7 3994 86 -2.3 3659 74.8 -1.9 7.1 328.82010 79.5 29.1 4062 88 1.7 3779 77.3 3.3 -56.6 339.62011 111.3 40.1 4112 89 1.2 3815 78.0 1.0 -46.8 342.82012 110.8 -0.5 4213 90 2.5 3836 78.4 0.5 31.1 346.12013 101.3 -8.6 4221 90 0.2 3866 79.1 0.8 10.0 345.32014 106.4 5.0 4250 91 0.7 3901 79.8 0.9 -2.6 352.1
2008 Q1 96.9 67.8 4125 87.8 1.7 3786 77.4 1.1 4.5 333.72008 Q2 121.7 77.4 4105 86.9 1.7 3743 76.5 1.2 23.6 338.52008 Q3 115.1 53.5 4072 86.2 0.9 3712 75.9 -0.7 10.1 349.22008 Q4 55.0 -38.0 4052 85.4 -0.9 3675 75.2 -3.4 42.0 335.02009 Q1 44.5 -54.1 3986 84.6 -3.4 3616 74.0 -4.5 39.4 330.42009 Q2 58.7 -51.8 3974 84.8 -3.2 3624 74.1 -3.2 23.7 325.92009 Q3 68.3 -40.6 3993 86.1 -1.9 3681 75.3 -0.8 -15.7 327.82009 Q4 74.7 35.7 4025 86.8 -0.7 3713 75.9 1.0 -19.1 331.02010 Q1 76.2 71.2 4051 86.8 1.6 3716 76.0 2.7 4.9 330.32010 Q2 78.4 33.6 4037 87.5 1.6 3744 76.6 3.3 -43.1 336.12010 Q3 76.7 12.3 4056 89.1 1.6 3809 77.9 3.5 -102.6 350.12010 Q4 86.6 16.0 4102 89.8 1.9 3846 78.7 3.6 -85.5 341.72011 Q1 104.8 37.5 4125 89.1 1.8 3819 78.1 2.8 -31.1 337.42011 Q2 117.6 50.0 4069 87.9 0.8 3765 77.0 0.6 -39.6 343.42011 Q3 113.3 47.7 4095 89.6 1.0 3831 78.3 0.6 -90.0 354.02011 Q4 109.5 26.5 4157 89.8 1.3 3847 78.7 0.0 -26.3 336.52012 Q1 118.4 13.0 4214 89.4 2.2 3837 78.5 0.5 38.6 339.02012 Q2 108.5 -7.7 4221 89.3 3.7 3820 78.1 1.5 54.6 346.12012 Q3 109.6 -3.2 4199 89.8 2.5 3838 78.5 0.2 1.9 358.22012 Q4 106.5 -2.8 4218 89.7 1.5 3847 78.7 0.0 29.5 341.02013 Q1 101.5 -14.3 4224 89.4 0.2 3832 78.4 -0.1 49.0 342.72013 Q2 100.5 -7.4 4219 90.0 -0.1 3862 79.0 1.1 12.2 344.52013 Q3 101.3 -7.6 4214 90.5 0.4 3885 79.5 1.2 -18.0 346.22013 Q4 101.8 -4.4 4227 90.5 0.2 3883 79.4 0.9 -3.4 347.92014 Q1 103.5 2.0 4212 90.2 -0.3 3866 79.1 0.9 -3.0 349.52014 Q2 105.4 4.9 4245 90.9 0.6 3896 79.7 0.9 -2.7 351.22014 Q3 107.3 5.9 4272 91.4 1.4 3921 80.2 0.9 -2.4 353.02014 Q4 109.2 7.3 4272 91.4 1.0 3919 80.1 0.9 -2.2 354.7
World final oil demandWorld Oil Supply(supply - stocks - bunker dem.)
Table 1: Oil Market Overview
7
Commodity Price Forecasts
Total Food Beverages Agriculture Metals Fertilizer
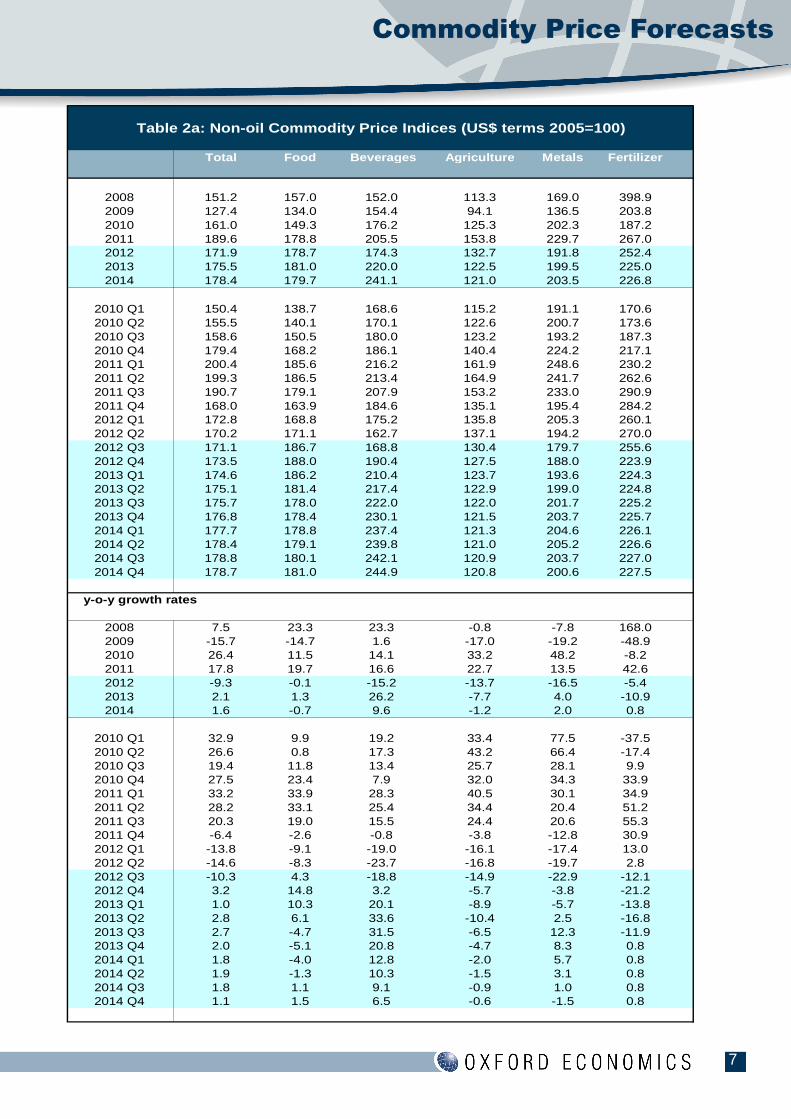
2008 151.2 157.0 152.0 113.3 169.0 398.92009 127.4 134.0 154.4 94.1 136.5 203.82010 161.0 149.3 176.2 125.3 202.3 187.22011 189.6 178.8 205.5 153.8 229.7 267.02012 171.9 178.7 174.3 132.7 191.8 252.42013 175.5 181.0 220.0 122.5 199.5 225.02014 178.4 179.7 241.1 121.0 203.5 226.8
2010 Q1 150.4 138.7 168.6 115.2 191.1 170.62010 Q2 155.5 140.1 170.1 122.6 200.7 173.62010 Q3 158.6 150.5 180.0 123.2 193.2 187.32010 Q4 179.4 168.2 186.1 140.4 224.2 217.12011 Q1 200.4 185.6 216.2 161.9 248.6 230.22011 Q2 199.3 186.5 213.4 164.9 241.7 262.62011 Q3 190.7 179.1 207.9 153.2 233.0 290.92011 Q4 168.0 163.9 184.6 135.1 195.4 284.22012 Q1 172.8 168.8 175.2 135.8 205.3 260.12012 Q2 170.2 171.1 162.7 137.1 194.2 270.02012 Q3 171.1 186.7 168.8 130.4 179.7 255.62012 Q4 173.5 188.0 190.4 127.5 188.0 223.92013 Q1 174.6 186.2 210.4 123.7 193.6 224.32013 Q2 175.1 181.4 217.4 122.9 199.0 224.82013 Q3 175.7 178.0 222.0 122.0 201.7 225.22013 Q4 176.8 178.4 230.1 121.5 203.7 225.72014 Q1 177.7 178.8 237.4 121.3 204.6 226.12014 Q2 178.4 179.1 239.8 121.0 205.2 226.62014 Q3 178.8 180.1 242.1 120.9 203.7 227.02014 Q4 178.7 181.0 244.9 120.8 200.6 227.5
y-o-y growth rates
2008 7.5 23.3 23.3 -0.8 -7.8 168.02009 -15.7 -14.7 1.6 -17.0 -19.2 -48.92010 26.4 11.5 14.1 33.2 48.2 -8.22011 17.8 19.7 16.6 22.7 13.5 42.62012 -9.3 -0.1 -15.2 -13.7 -16.5 -5.42013 2.1 1.3 26.2 -7.7 4.0 -10.92014 1.6 -0.7 9.6 -1.2 2.0 0.8
2010 Q1 32.9 9.9 19.2 33.4 77.5 -37.52010 Q2 26.6 0.8 17.3 43.2 66.4 -17.42010 Q3 19.4 11.8 13.4 25.7 28.1 9.92010 Q4 27.5 23.4 7.9 32.0 34.3 33.92011 Q1 33.2 33.9 28.3 40.5 30.1 34.92011 Q2 28.2 33.1 25.4 34.4 20.4 51.22011 Q3 20.3 19.0 15.5 24.4 20.6 55.32011 Q4 -6.4 -2.6 -0.8 -3.8 -12.8 30.92012 Q1 -13.8 -9.1 -19.0 -16.1 -17.4 13.02012 Q2 -14.6 -8.3 -23.7 -16.8 -19.7 2.82012 Q3 -10.3 4.3 -18.8 -14.9 -22.9 -12.12012 Q4 3.2 14.8 3.2 -5.7 -3.8 -21.22013 Q1 1.0 10.3 20.1 -8.9 -5.7 -13.82013 Q2 2.8 6.1 33.6 -10.4 2.5 -16.82013 Q3 2.7 -4.7 31.5 -6.5 12.3 -11.92013 Q4 2.0 -5.1 20.8 -4.7 8.3 0.82014 Q1 1.8 -4.0 12.8 -2.0 5.7 0.82014 Q2 1.9 -1.3 10.3 -1.5 3.1 0.82014 Q3 1.8 1.1 9.1 -0.9 1.0 0.82014 Q4 1.1 1.5 6.5 -0.6 -1.5 0.8
Table 2a: Non-oil Commodity Price Indices (US$ term s 2005=100)
Commodity Price Forecasts
Commodity Price Forecasts: September 20128
Total Food Beverages Agriculture Metals Fertilizer
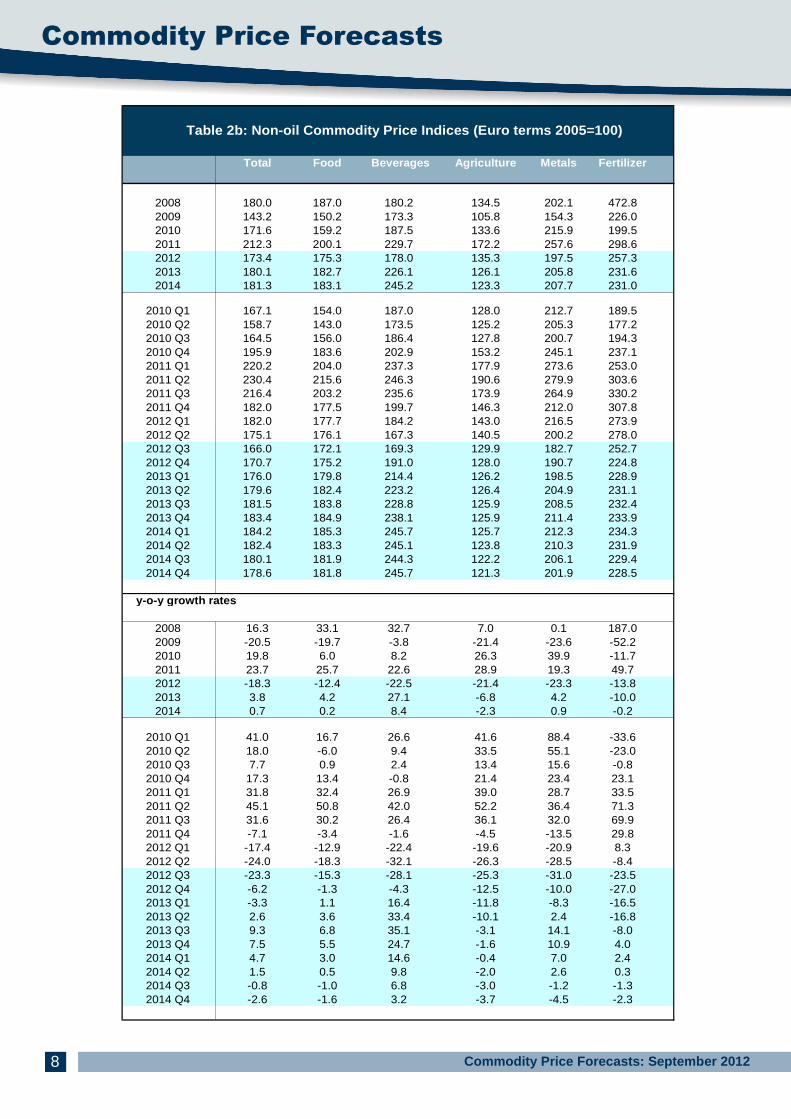
2008 180.0 187.0 180.2 134.5 202.1 472.82009 143.2 150.2 173.3 105.8 154.3 226.02010 171.6 159.2 187.5 133.6 215.9 199.52011 212.3 200.1 229.7 172.2 257.6 298.62012 173.4 175.3 178.0 135.3 197.5 257.32013 180.1 182.7 226.1 126.1 205.8 231.62014 181.3 183.1 245.2 123.3 207.7 231.0
2010 Q1 167.1 154.0 187.0 128.0 212.7 189.52010 Q2 158.7 143.0 173.5 125.2 205.3 177.22010 Q3 164.5 156.0 186.4 127.8 200.7 194.32010 Q4 195.9 183.6 202.9 153.2 245.1 237.12011 Q1 220.2 204.0 237.3 177.9 273.6 253.02011 Q2 230.4 215.6 246.3 190.6 279.9 303.62011 Q3 216.4 203.2 235.6 173.9 264.9 330.22011 Q4 182.0 177.5 199.7 146.3 212.0 307.82012 Q1 182.0 177.7 184.2 143.0 216.5 273.92012 Q2 175.1 176.1 167.3 140.5 200.2 278.02012 Q3 166.0 172.1 169.3 129.9 182.7 252.72012 Q4 170.7 175.2 191.0 128.0 190.7 224.82013 Q1 176.0 179.8 214.4 126.2 198.5 228.92013 Q2 179.6 182.4 223.2 126.4 204.9 231.12013 Q3 181.5 183.8 228.8 125.9 208.5 232.42013 Q4 183.4 184.9 238.1 125.9 211.4 233.92014 Q1 184.2 185.3 245.7 125.7 212.3 234.32014 Q2 182.4 183.3 245.1 123.8 210.3 231.92014 Q3 180.1 181.9 244.3 122.2 206.1 229.42014 Q4 178.6 181.8 245.7 121.3 201.9 228.5
y-o-y growth rates
2008 16.3 33.1 32.7 7.0 0.1 187.02009 -20.5 -19.7 -3.8 -21.4 -23.6 -52.22010 19.8 6.0 8.2 26.3 39.9 -11.72011 23.7 25.7 22.6 28.9 19.3 49.72012 -18.3 -12.4 -22.5 -21.4 -23.3 -13.82013 3.8 4.2 27.1 -6.8 4.2 -10.02014 0.7 0.2 8.4 -2.3 0.9 -0.2
2010 Q1 41.0 16.7 26.6 41.6 88.4 -33.62010 Q2 18.0 -6.0 9.4 33.5 55.1 -23.02010 Q3 7.7 0.9 2.4 13.4 15.6 -0.82010 Q4 17.3 13.4 -0.8 21.4 23.4 23.12011 Q1 31.8 32.4 26.9 39.0 28.7 33.52011 Q2 45.1 50.8 42.0 52.2 36.4 71.32011 Q3 31.6 30.2 26.4 36.1 32.0 69.92011 Q4 -7.1 -3.4 -1.6 -4.5 -13.5 29.82012 Q1 -17.4 -12.9 -22.4 -19.6 -20.9 8.32012 Q2 -24.0 -18.3 -32.1 -26.3 -28.5 -8.42012 Q3 -23.3 -15.3 -28.1 -25.3 -31.0 -23.52012 Q4 -6.2 -1.3 -4.3 -12.5 -10.0 -27.02013 Q1 -3.3 1.1 16.4 -11.8 -8.3 -16.52013 Q2 2.6 3.6 33.4 -10.1 2.4 -16.82013 Q3 9.3 6.8 35.1 -3.1 14.1 -8.02013 Q4 7.5 5.5 24.7 -1.6 10.9 4.02014 Q1 4.7 3.0 14.6 -0.4 7.0 2.42014 Q2 1.5 0.5 9.8 -2.0 2.6 0.32014 Q3 -0.8 -1.0 6.8 -3.0 -1.2 -1.32014 Q4 -2.6 -1.6 3.2 -3.7 -4.5 -2.3
Table 2b: Non-oil Commodity Price Indices (Euro ter ms 2005=100)
9
Commodity Price Forecasts
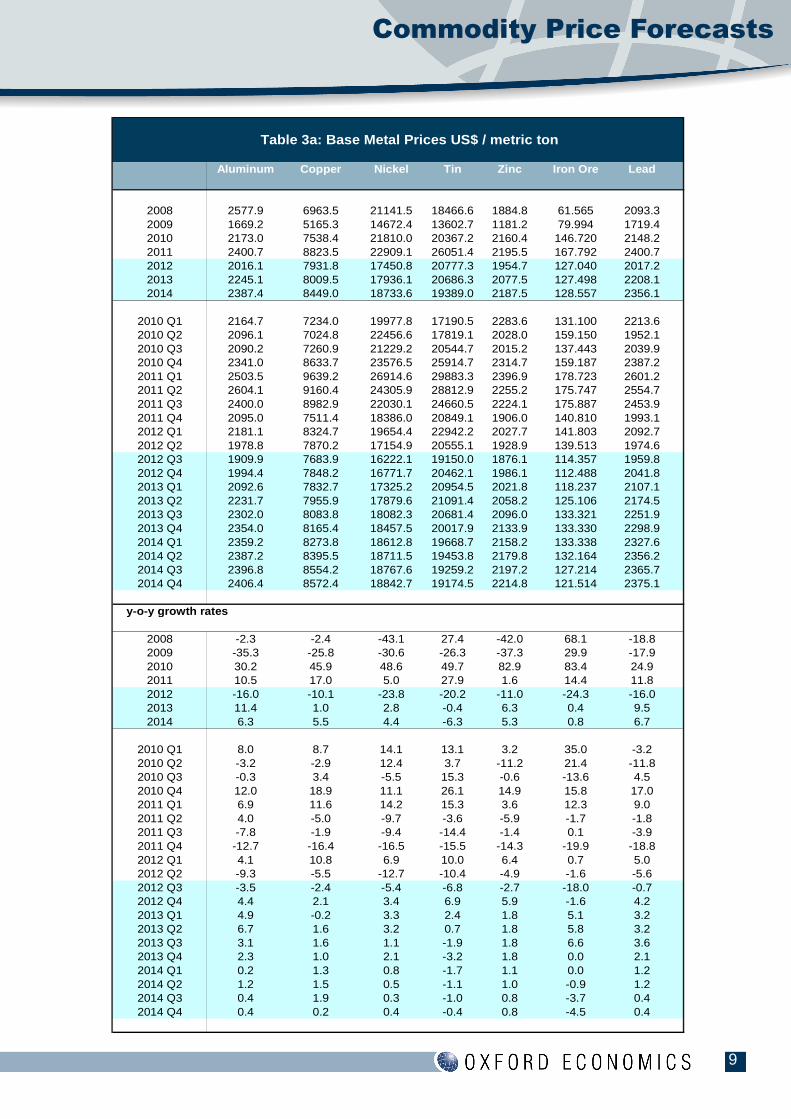
Table 3a: Base Metal Prices US$ / metric ton
Aluminum Copper Nickel Tin Zinc Iron Ore Lead
2008 2577.9 6963.5 21141.5 18466.6 1884.8 61.565 2093.32009 1669.2 5165.3 14672.4 13602.7 1181.2 79.994 1719.42010 2173.0 7538.4 21810.0 20367.2 2160.4 146.720 2148.22011 2400.7 8823.5 22909.1 26051.4 2195.5 167.792 2400.72012 2016.1 7931.8 17450.8 20777.3 1954.7 127.040 2017.22013 2245.1 8009.5 17936.1 20686.3 2077.5 127.498 2208.12014 2387.4 8449.0 18733.6 19389.0 2187.5 128.557 2356.1
2010 Q1 2164.7 7234.0 19977.8 17190.5 2283.6 131.100 2213.62010 Q2 2096.1 7024.8 22456.6 17819.1 2028.0 159.150 1952.12010 Q3 2090.2 7260.9 21229.2 20544.7 2015.2 137.443 2039.92010 Q4 2341.0 8633.7 23576.5 25914.7 2314.7 159.187 2387.22011 Q1 2503.5 9639.2 26914.6 29883.3 2396.9 178.723 2601.22011 Q2 2604.1 9160.4 24305.9 28812.9 2255.2 175.747 2554.72011 Q3 2400.0 8982.9 22030.1 24660.5 2224.1 175.887 2453.92011 Q4 2095.0 7511.4 18386.0 20849.1 1906.0 140.810 1993.12012 Q1 2181.1 8324.7 19654.4 22942.2 2027.7 141.803 2092.72012 Q2 1978.8 7870.2 17154.9 20555.1 1928.9 139.513 1974.62012 Q3 1909.9 7683.9 16222.1 19150.0 1876.1 114.357 1959.82012 Q4 1994.4 7848.2 16771.7 20462.1 1986.1 112.488 2041.82013 Q1 2092.6 7832.7 17325.2 20954.5 2021.8 118.237 2107.12013 Q2 2231.7 7955.9 17879.6 21091.4 2058.2 125.106 2174.52013 Q3 2302.0 8083.8 18082.3 20681.4 2096.0 133.321 2251.92013 Q4 2354.0 8165.4 18457.5 20017.9 2133.9 133.330 2298.92014 Q1 2359.2 8273.8 18612.8 19668.7 2158.2 133.338 2327.62014 Q2 2387.2 8395.5 18711.5 19453.8 2179.8 132.164 2356.22014 Q3 2396.8 8554.2 18767.6 19259.2 2197.2 127.214 2365.72014 Q4 2406.4 8572.4 18842.7 19174.5 2214.8 121.514 2375.1
y-o-y growth rates
2008 -2.3 -2.4 -43.1 27.4 -42.0 68.1 -18.82009 -35.3 -25.8 -30.6 -26.3 -37.3 29.9 -17.92010 30.2 45.9 48.6 49.7 82.9 83.4 24.92011 10.5 17.0 5.0 27.9 1.6 14.4 11.82012 -16.0 -10.1 -23.8 -20.2 -11.0 -24.3 -16.02013 11.4 1.0 2.8 -0.4 6.3 0.4 9.52014 6.3 5.5 4.4 -6.3 5.3 0.8 6.7
2010 Q1 8.0 8.7 14.1 13.1 3.2 35.0 -3.22010 Q2 -3.2 -2.9 12.4 3.7 -11.2 21.4 -11.82010 Q3 -0.3 3.4 -5.5 15.3 -0.6 -13.6 4.52010 Q4 12.0 18.9 11.1 26.1 14.9 15.8 17.02011 Q1 6.9 11.6 14.2 15.3 3.6 12.3 9.02011 Q2 4.0 -5.0 -9.7 -3.6 -5.9 -1.7 -1.82011 Q3 -7.8 -1.9 -9.4 -14.4 -1.4 0.1 -3.92011 Q4 -12.7 -16.4 -16.5 -15.5 -14.3 -19.9 -18.82012 Q1 4.1 10.8 6.9 10.0 6.4 0.7 5.02012 Q2 -9.3 -5.5 -12.7 -10.4 -4.9 -1.6 -5.62012 Q3 -3.5 -2.4 -5.4 -6.8 -2.7 -18.0 -0.72012 Q4 4.4 2.1 3.4 6.9 5.9 -1.6 4.22013 Q1 4.9 -0.2 3.3 2.4 1.8 5.1 3.22013 Q2 6.7 1.6 3.2 0.7 1.8 5.8 3.22013 Q3 3.1 1.6 1.1 -1.9 1.8 6.6 3.62013 Q4 2.3 1.0 2.1 -3.2 1.8 0.0 2.12014 Q1 0.2 1.3 0.8 -1.7 1.1 0.0 1.22014 Q2 1.2 1.5 0.5 -1.1 1.0 -0.9 1.22014 Q3 0.4 1.9 0.3 -1.0 0.8 -3.7 0.42014 Q4 0.4 0.2 0.4 -0.4 0.8 -4.5 0.4
Commodity Price Forecasts
Commodity Price Forecasts: September 201210
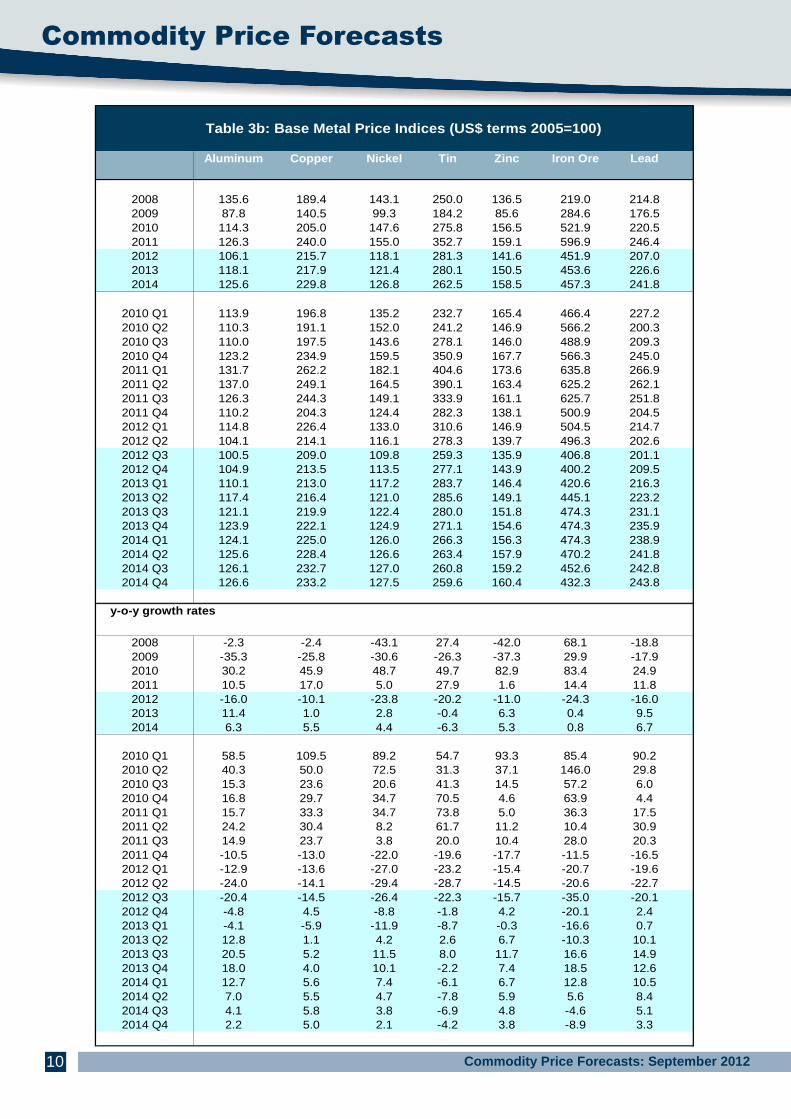
Table 3b: Base Metal Price Indices (US$ terms 2005=1 00)
Aluminum Copper Nickel Tin Zinc Iron Ore Lead
2008 135.6 189.4 143.1 250.0 136.5 219.0 214.82009 87.8 140.5 99.3 184.2 85.6 284.6 176.52010 114.3 205.0 147.6 275.8 156.5 521.9 220.52011 126.3 240.0 155.0 352.7 159.1 596.9 246.42012 106.1 215.7 118.1 281.3 141.6 451.9 207.02013 118.1 217.9 121.4 280.1 150.5 453.6 226.62014 125.6 229.8 126.8 262.5 158.5 457.3 241.8
2010 Q1 113.9 196.8 135.2 232.7 165.4 466.4 227.22010 Q2 110.3 191.1 152.0 241.2 146.9 566.2 200.32010 Q3 110.0 197.5 143.6 278.1 146.0 488.9 209.32010 Q4 123.2 234.9 159.5 350.9 167.7 566.3 245.02011 Q1 131.7 262.2 182.1 404.6 173.6 635.8 266.92011 Q2 137.0 249.1 164.5 390.1 163.4 625.2 262.12011 Q3 126.3 244.3 149.1 333.9 161.1 625.7 251.82011 Q4 110.2 204.3 124.4 282.3 138.1 500.9 204.52012 Q1 114.8 226.4 133.0 310.6 146.9 504.5 214.72012 Q2 104.1 214.1 116.1 278.3 139.7 496.3 202.62012 Q3 100.5 209.0 109.8 259.3 135.9 406.8 201.12012 Q4 104.9 213.5 113.5 277.1 143.9 400.2 209.52013 Q1 110.1 213.0 117.2 283.7 146.4 420.6 216.32013 Q2 117.4 216.4 121.0 285.6 149.1 445.1 223.22013 Q3 121.1 219.9 122.4 280.0 151.8 474.3 231.12013 Q4 123.9 222.1 124.9 271.1 154.6 474.3 235.92014 Q1 124.1 225.0 126.0 266.3 156.3 474.3 238.92014 Q2 125.6 228.4 126.6 263.4 157.9 470.2 241.82014 Q3 126.1 232.7 127.0 260.8 159.2 452.6 242.82014 Q4 126.6 233.2 127.5 259.6 160.4 432.3 243.8
y-o-y growth rates
2008 -2.3 -2.4 -43.1 27.4 -42.0 68.1 -18.82009 -35.3 -25.8 -30.6 -26.3 -37.3 29.9 -17.92010 30.2 45.9 48.7 49.7 82.9 83.4 24.92011 10.5 17.0 5.0 27.9 1.6 14.4 11.82012 -16.0 -10.1 -23.8 -20.2 -11.0 -24.3 -16.02013 11.4 1.0 2.8 -0.4 6.3 0.4 9.52014 6.3 5.5 4.4 -6.3 5.3 0.8 6.7
2010 Q1 58.5 109.5 89.2 54.7 93.3 85.4 90.22010 Q2 40.3 50.0 72.5 31.3 37.1 146.0 29.82010 Q3 15.3 23.6 20.6 41.3 14.5 57.2 6.02010 Q4 16.8 29.7 34.7 70.5 4.6 63.9 4.42011 Q1 15.7 33.3 34.7 73.8 5.0 36.3 17.52011 Q2 24.2 30.4 8.2 61.7 11.2 10.4 30.92011 Q3 14.9 23.7 3.8 20.0 10.4 28.0 20.32011 Q4 -10.5 -13.0 -22.0 -19.6 -17.7 -11.5 -16.52012 Q1 -12.9 -13.6 -27.0 -23.2 -15.4 -20.7 -19.62012 Q2 -24.0 -14.1 -29.4 -28.7 -14.5 -20.6 -22.72012 Q3 -20.4 -14.5 -26.4 -22.3 -15.7 -35.0 -20.12012 Q4 -4.8 4.5 -8.8 -1.8 4.2 -20.1 2.42013 Q1 -4.1 -5.9 -11.9 -8.7 -0.3 -16.6 0.72013 Q2 12.8 1.1 4.2 2.6 6.7 -10.3 10.12013 Q3 20.5 5.2 11.5 8.0 11.7 16.6 14.92013 Q4 18.0 4.0 10.1 -2.2 7.4 18.5 12.62014 Q1 12.7 5.6 7.4 -6.1 6.7 12.8 10.52014 Q2 7.0 5.5 4.7 -7.8 5.9 5.6 8.42014 Q3 4.1 5.8 3.8 -6.9 4.8 -4.6 5.12014 Q4 2.2 5.0 2.1 -4.2 3.8 -8.9 3.3
11
Commodity Price Forecasts
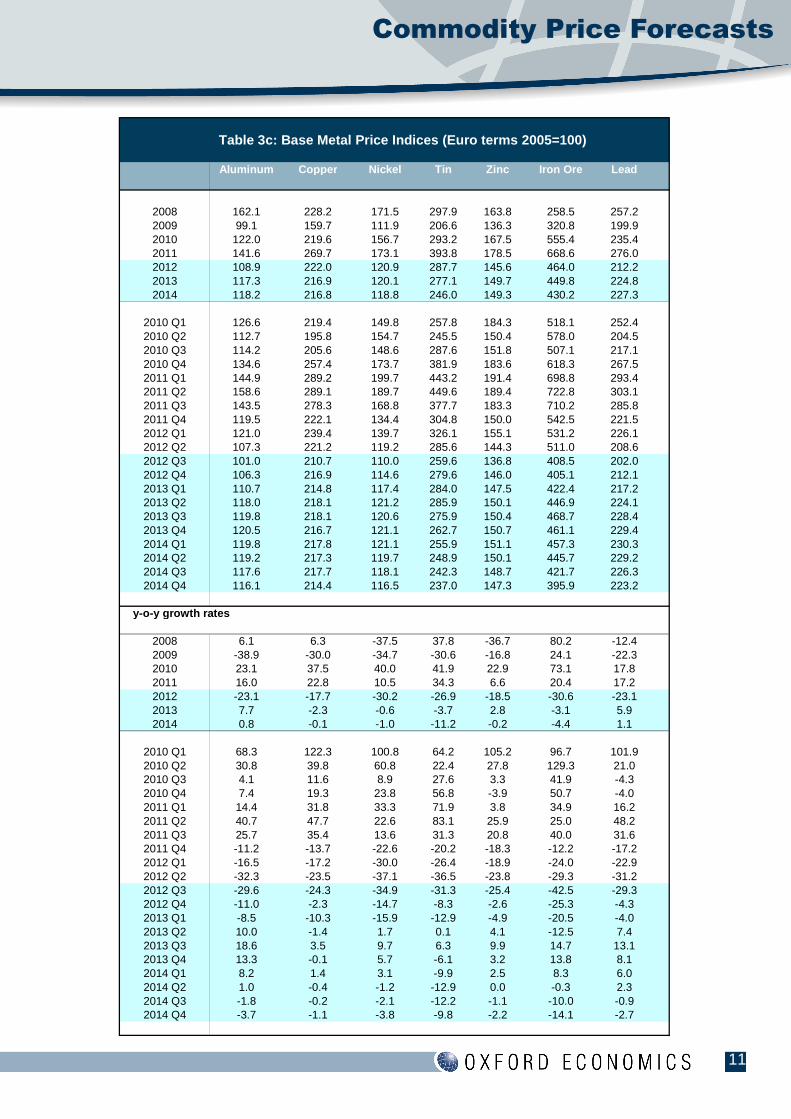
Table 3c: Base Metal Price Indices (Euro terms 2005 =100)
Aluminum Copper Nickel Tin Zinc Iron Ore Lead
2008 162.1 228.2 171.5 297.9 163.8 258.5 257.22009 99.1 159.7 111.9 206.6 136.3 320.8 199.92010 122.0 219.6 156.7 293.2 167.5 555.4 235.42011 141.6 269.7 173.1 393.8 178.5 668.6 276.02012 108.9 222.0 120.9 287.7 145.6 464.0 212.22013 117.3 216.9 120.1 277.1 149.7 449.8 224.82014 118.2 216.8 118.8 246.0 149.3 430.2 227.3
2010 Q1 126.6 219.4 149.8 257.8 184.3 518.1 252.42010 Q2 112.7 195.8 154.7 245.5 150.4 578.0 204.52010 Q3 114.2 205.6 148.6 287.6 151.8 507.1 217.12010 Q4 134.6 257.4 173.7 381.9 183.6 618.3 267.52011 Q1 144.9 289.2 199.7 443.2 191.4 698.8 293.42011 Q2 158.6 289.1 189.7 449.6 189.4 722.8 303.12011 Q3 143.5 278.3 168.8 377.7 183.3 710.2 285.82011 Q4 119.5 222.1 134.4 304.8 150.0 542.5 221.52012 Q1 121.0 239.4 139.7 326.1 155.1 531.2 226.12012 Q2 107.3 221.2 119.2 285.6 144.3 511.0 208.62012 Q3 101.0 210.7 110.0 259.6 136.8 408.5 202.02012 Q4 106.3 216.9 114.6 279.6 146.0 405.1 212.12013 Q1 110.7 214.8 117.4 284.0 147.5 422.4 217.22013 Q2 118.0 218.1 121.2 285.9 150.1 446.9 224.12013 Q3 119.8 218.1 120.6 275.9 150.4 468.7 228.42013 Q4 120.5 216.7 121.1 262.7 150.7 461.1 229.42014 Q1 119.8 217.8 121.1 255.9 151.1 457.3 230.32014 Q2 119.2 217.3 119.7 248.9 150.1 445.7 229.22014 Q3 117.6 217.7 118.1 242.3 148.7 421.7 226.32014 Q4 116.1 214.4 116.5 237.0 147.3 395.9 223.2
y-o-y growth rates
2008 6.1 6.3 -37.5 37.8 -36.7 80.2 -12.42009 -38.9 -30.0 -34.7 -30.6 -16.8 24.1 -22.32010 23.1 37.5 40.0 41.9 22.9 73.1 17.82011 16.0 22.8 10.5 34.3 6.6 20.4 17.22012 -23.1 -17.7 -30.2 -26.9 -18.5 -30.6 -23.12013 7.7 -2.3 -0.6 -3.7 2.8 -3.1 5.92014 0.8 -0.1 -1.0 -11.2 -0.2 -4.4 1.1
2010 Q1 68.3 122.3 100.8 64.2 105.2 96.7 101.92010 Q2 30.8 39.8 60.8 22.4 27.8 129.3 21.02010 Q3 4.1 11.6 8.9 27.6 3.3 41.9 -4.32010 Q4 7.4 19.3 23.8 56.8 -3.9 50.7 -4.02011 Q1 14.4 31.8 33.3 71.9 3.8 34.9 16.22011 Q2 40.7 47.7 22.6 83.1 25.9 25.0 48.22011 Q3 25.7 35.4 13.6 31.3 20.8 40.0 31.62011 Q4 -11.2 -13.7 -22.6 -20.2 -18.3 -12.2 -17.22012 Q1 -16.5 -17.2 -30.0 -26.4 -18.9 -24.0 -22.92012 Q2 -32.3 -23.5 -37.1 -36.5 -23.8 -29.3 -31.22012 Q3 -29.6 -24.3 -34.9 -31.3 -25.4 -42.5 -29.32012 Q4 -11.0 -2.3 -14.7 -8.3 -2.6 -25.3 -4.32013 Q1 -8.5 -10.3 -15.9 -12.9 -4.9 -20.5 -4.02013 Q2 10.0 -1.4 1.7 0.1 4.1 -12.5 7.42013 Q3 18.6 3.5 9.7 6.3 9.9 14.7 13.12013 Q4 13.3 -0.1 5.7 -6.1 3.2 13.8 8.12014 Q1 8.2 1.4 3.1 -9.9 2.5 8.3 6.02014 Q2 1.0 -0.4 -1.2 -12.9 0.0 -0.3 2.32014 Q3 -1.8 -0.2 -2.1 -12.2 -1.1 -10.0 -0.92014 Q4 -3.7 -1.1 -3.8 -9.8 -2.2 -14.1 -2.7
Commodity Price Forecasts
Commodity Price Forecasts: September 201212
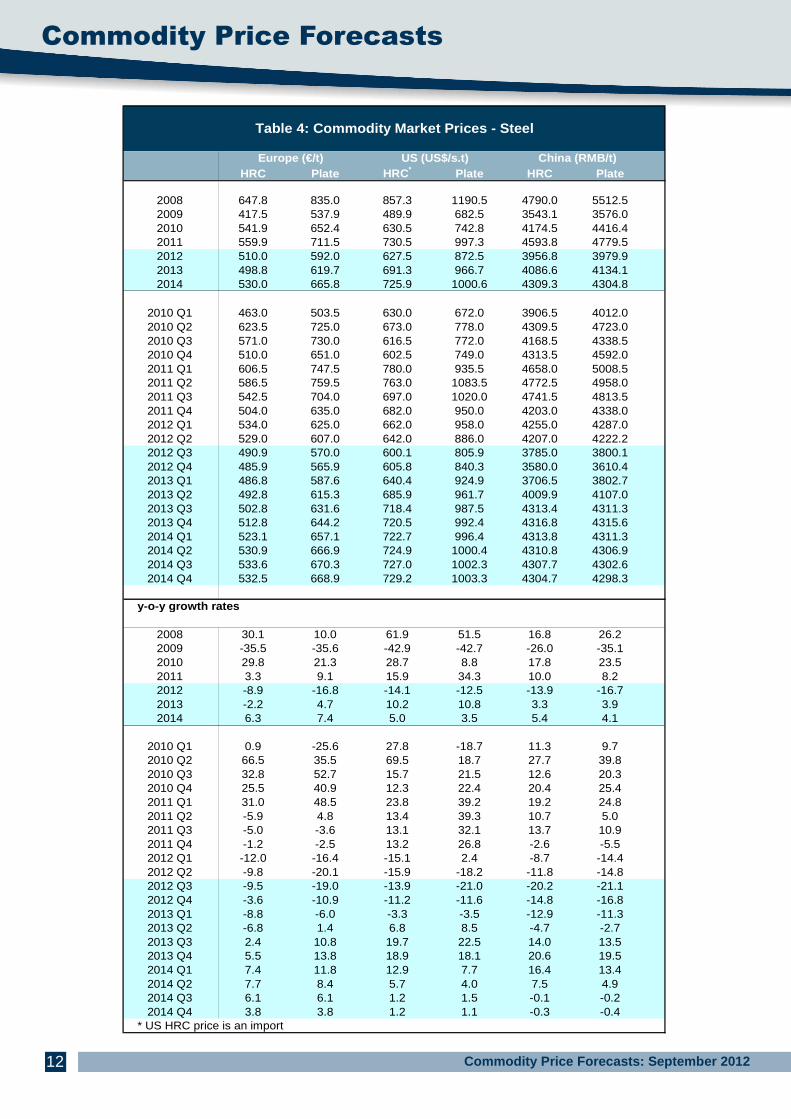
HRC Plate HRC* Plate HRC Plate
2008 647.8 835.0 857.3 1190.5 4790.0 5512.52009 417.5 537.9 489.9 682.5 3543.1 3576.02010 541.9 652.4 630.5 742.8 4174.5 4416.42011 559.9 711.5 730.5 997.3 4593.8 4779.52012 510.0 592.0 627.5 872.5 3956.8 3979.92013 498.8 619.7 691.3 966.7 4086.6 4134.12014 530.0 665.8 725.9 1000.6 4309.3 4304.8
2010 Q1 463.0 503.5 630.0 672.0 3906.5 4012.02010 Q2 623.5 725.0 673.0 778.0 4309.5 4723.02010 Q3 571.0 730.0 616.5 772.0 4168.5 4338.52010 Q4 510.0 651.0 602.5 749.0 4313.5 4592.02011 Q1 606.5 747.5 780.0 935.5 4658.0 5008.52011 Q2 586.5 759.5 763.0 1083.5 4772.5 4958.02011 Q3 542.5 704.0 697.0 1020.0 4741.5 4813.52011 Q4 504.0 635.0 682.0 950.0 4203.0 4338.02012 Q1 534.0 625.0 662.0 958.0 4255.0 4287.02012 Q2 529.0 607.0 642.0 886.0 4207.0 4222.22012 Q3 490.9 570.0 600.1 805.9 3785.0 3800.12012 Q4 485.9 565.9 605.8 840.3 3580.0 3610.42013 Q1 486.8 587.6 640.4 924.9 3706.5 3802.72013 Q2 492.8 615.3 685.9 961.7 4009.9 4107.02013 Q3 502.8 631.6 718.4 987.5 4313.4 4311.32013 Q4 512.8 644.2 720.5 992.4 4316.8 4315.62014 Q1 523.1 657.1 722.7 996.4 4313.8 4311.32014 Q2 530.9 666.9 724.9 1000.4 4310.8 4306.92014 Q3 533.6 670.3 727.0 1002.3 4307.7 4302.62014 Q4 532.5 668.9 729.2 1003.3 4304.7 4298.3
y-o-y growth rates
2008 30.1 10.0 61.9 51.5 16.8 26.22009 -35.5 -35.6 -42.9 -42.7 -26.0 -35.12010 29.8 21.3 28.7 8.8 17.8 23.52011 3.3 9.1 15.9 34.3 10.0 8.22012 -8.9 -16.8 -14.1 -12.5 -13.9 -16.72013 -2.2 4.7 10.2 10.8 3.3 3.92014 6.3 7.4 5.0 3.5 5.4 4.1
2010 Q1 0.9 -25.6 27.8 -18.7 11.3 9.72010 Q2 66.5 35.5 69.5 18.7 27.7 39.82010 Q3 32.8 52.7 15.7 21.5 12.6 20.32010 Q4 25.5 40.9 12.3 22.4 20.4 25.42011 Q1 31.0 48.5 23.8 39.2 19.2 24.82011 Q2 -5.9 4.8 13.4 39.3 10.7 5.02011 Q3 -5.0 -3.6 13.1 32.1 13.7 10.92011 Q4 -1.2 -2.5 13.2 26.8 -2.6 -5.52012 Q1 -12.0 -16.4 -15.1 2.4 -8.7 -14.42012 Q2 -9.8 -20.1 -15.9 -18.2 -11.8 -14.82012 Q3 -9.5 -19.0 -13.9 -21.0 -20.2 -21.12012 Q4 -3.6 -10.9 -11.2 -11.6 -14.8 -16.82013 Q1 -8.8 -6.0 -3.3 -3.5 -12.9 -11.32013 Q2 -6.8 1.4 6.8 8.5 -4.7 -2.72013 Q3 2.4 10.8 19.7 22.5 14.0 13.52013 Q4 5.5 13.8 18.9 18.1 20.6 19.52014 Q1 7.4 11.8 12.9 7.7 16.4 13.42014 Q2 7.7 8.4 5.7 4.0 7.5 4.92014 Q3 6.1 6.1 1.2 1.5 -0.1 -0.22014 Q4 3.8 3.8 1.2 1.1 -0.3 -0.4
* US HRC price is an import
Table 4: Commodity Market Prices - Steel
Europe (€/t) US (US$/s.t) China (RMB/t)
13
Commodity Price Forecasts
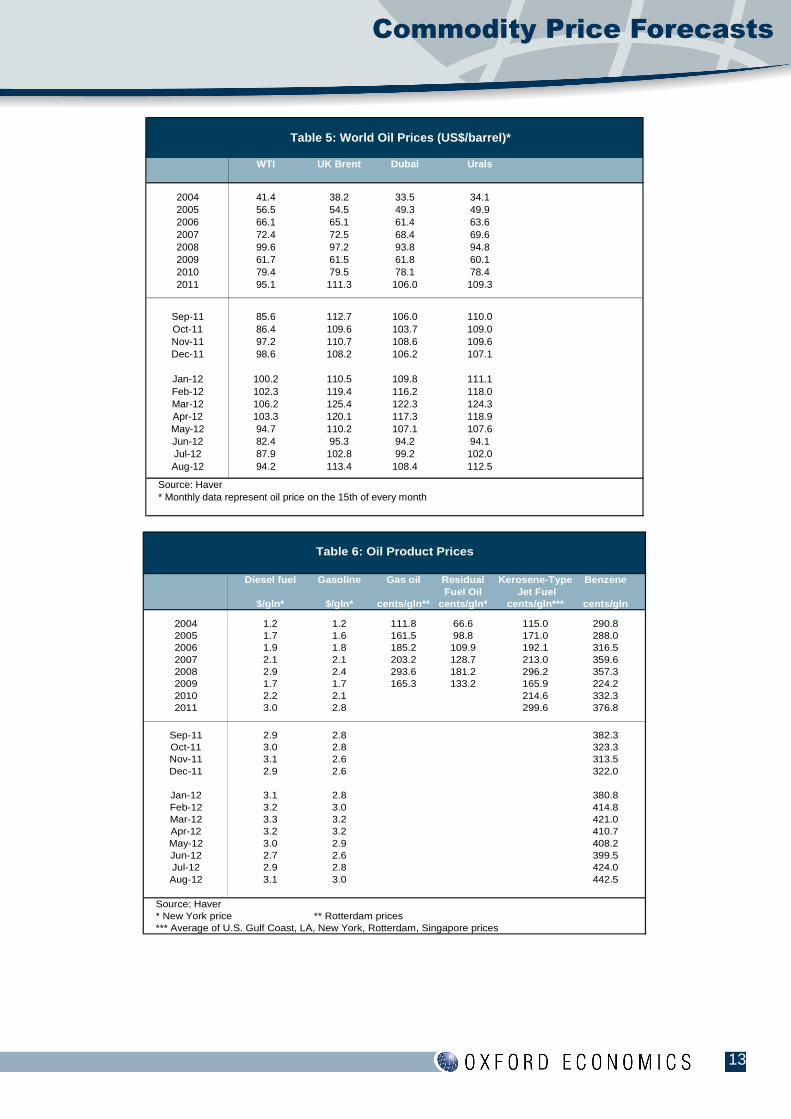
Table 5: World Oil Prices (US$/barrel)*
WTI UK Brent Dubai Urals
2004 41.4 38.2 33.5 34.1 26.8 30.12005 56.5 54.5 49.3 49.9 34.4 38.42006 66.1 65.1 61.4 63.6 50.3 56.02007 72.4 72.5 68.4 69.6 - -2008 99.6 97.2 93.8 94.82009 61.7 61.5 61.8 60.12010 79.4 79.5 78.1 78.42011 95.1 111.3 106.0 109.3
- --
Sep-11 85.6 112.7 106.0 110.0Oct-11 86.4 109.6 103.7 109.0Nov-11 97.2 110.7 108.6 109.6Dec-11 98.6 108.2 106.2 107.1
Jan-12 100.2 110.5 109.8 111.1Feb-12 102.3 119.4 116.2 118.0Mar-12 106.2 125.4 122.3 124.3Apr-12 103.3 120.1 117.3 118.9May-12 94.7 110.2 107.1 107.6Jun-12 82.4 95.3 94.2 94.1Jul-12 87.9 102.8 99.2 102.0Aug-12 94.2 113.4 108.4 112.5
Source: Haver* Monthly data represent oil price on the 15th of every month
Diesel fuel Gasoline Gas oil Residual Kerosene-Type BenzeneFuel Oil Jet Fuel
$/gln* $/gln* cents/gln** cents/gln* cents/gln*** cents/gln
2004 1.2 1.2 111.8 66.6 115.0 290.82005 1.7 1.6 161.5 98.8 171.0 288.02006 1.9 1.8 185.2 109.9 192.1 316.52007 2.1 2.1 203.2 128.7 213.0 359.62008 2.9 2.4 293.6 181.2 296.2 357.32009 1.7 1.7 165.3 133.2 165.9 224.22010 2.2 2.1 #N/A #N/A 214.6 332.32011 3.0 2.8 #N/A #N/A 299.6 376.8
Sep-11 2.9 2.8 294.8 382.3Oct-11 3.0 2.8 296.6 323.3Nov-11 3.1 2.6 304.6 313.5Dec-11 2.9 2.6 287.3 322.0
Jan-12 3.1 2.8 308.7 380.8Feb-12 3.2 3.0 320.7 414.8Mar-12 3.3 3.2 325.6 421.0Apr-12 3.2 3.2 322.6 410.7May-12 3.0 2.9 297.4 408.2Jun-12 2.7 2.6 267.8 399.5Jul-12 2.9 2.8 289.2 424.0Aug-12 3.1 3.0 315.6 442.5
Source: Haver* New York price ** Rotterdam prices*** Average of U.S. Gulf Coast, LA, New York, Rotterdam, Singapore prices
Table 6: Oil Product Prices
Commodity Price Forecasts
Commodity Price Forecasts: September 201214
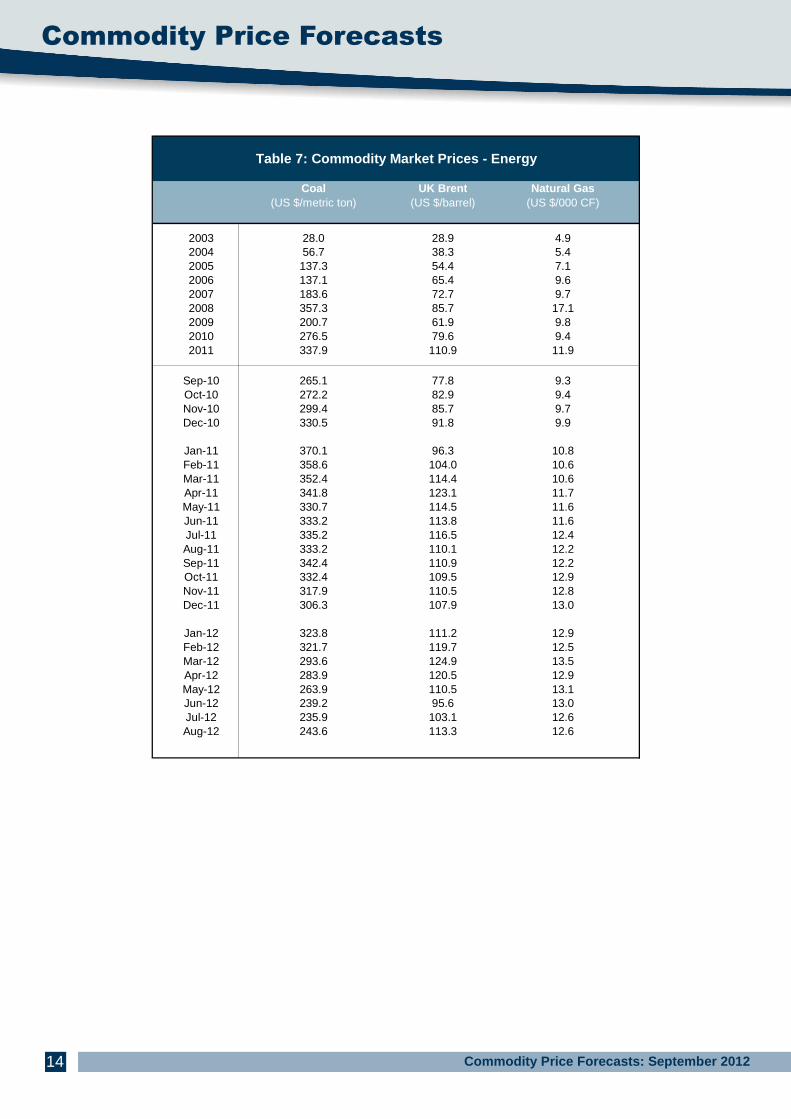
Coal UK Brent Natural Gas(US $/metric ton) (US $/barrel) (US $/000 CF)
2003 28.0 28.9 4.92004 56.7 38.3 5.42005 137.3 54.4 7.12006 137.1 65.4 9.62007 183.6 72.7 9.72008 357.3 85.7 17.12009 200.7 61.9 9.82010 276.5 79.6 9.42011 337.9 110.9 11.9
Sep-10 265.1 77.8 9.3Oct-10 272.2 82.9 9.4Nov-10 299.4 85.7 9.7Dec-10 330.5 91.8 9.9
Jan-11 370.1 96.3 10.8Feb-11 358.6 104.0 10.6Mar-11 352.4 114.4 10.6Apr-11 341.8 123.1 11.7May-11 330.7 114.5 11.6Jun-11 333.2 113.8 11.6Jul-11 335.2 116.5 12.4Aug-11 333.2 110.1 12.2Sep-11 342.4 110.9 12.2Oct-11 332.4 109.5 12.9Nov-11 317.9 110.5 12.8Dec-11 306.3 107.9 13.0
Jan-12 323.8 111.2 12.9Feb-12 321.7 119.7 12.5Mar-12 293.6 124.9 13.5Apr-12 283.9 120.5 12.9May-12 263.9 110.5 13.1Jun-12 239.2 95.6 13.0Jul-12 235.9 103.1 12.6Aug-12 243.6 113.3 12.6
Table 7: Commodity Market Prices - Energy
15
Commodity Price Forecasts
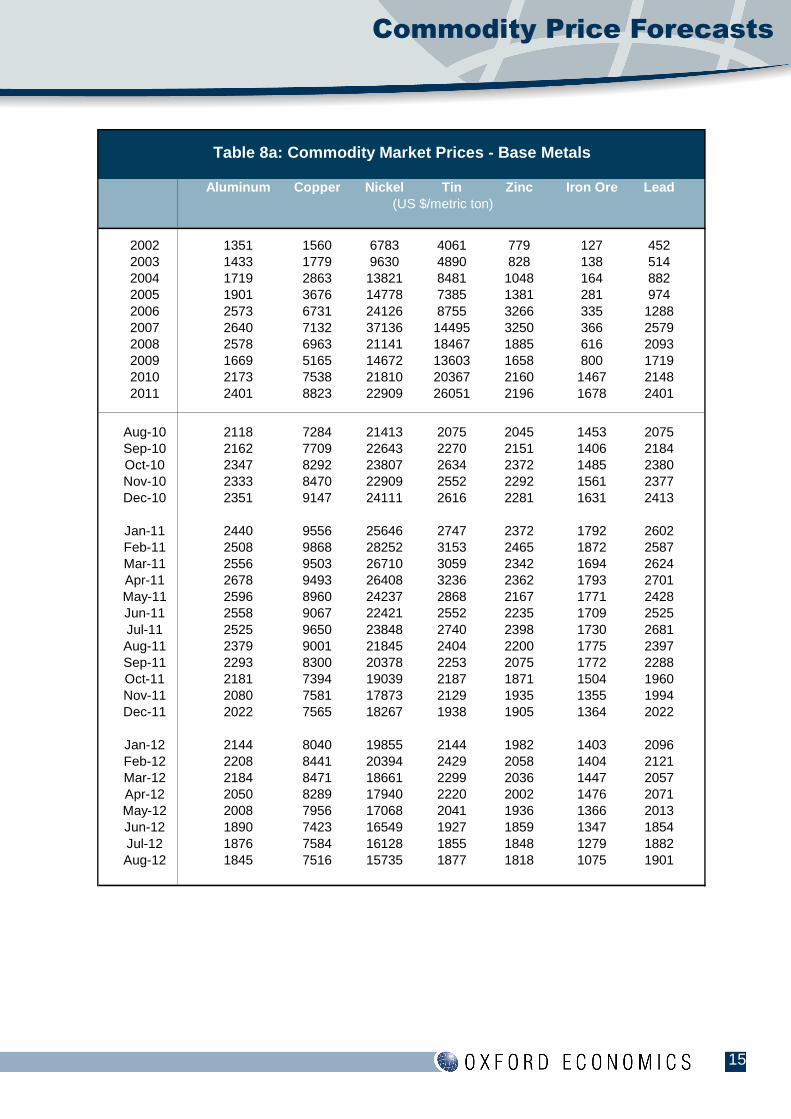
Aluminum Copper Nickel Tin Zinc Iron Ore Lead
2002 1351 1560 6783 4061 779 127 4522003 1433 1779 9630 4890 828 138 5142004 1719 2863 13821 8481 1048 164 8822005 1901 3676 14778 7385 1381 281 9742006 2573 6731 24126 8755 3266 335 12882007 2640 7132 37136 14495 3250 366 25792008 2578 6963 21141 18467 1885 616 20932009 1669 5165 14672 13603 1658 800 17192010 2173 7538 21810 20367 2160 1467 21482011 2401 8823 22909 26051 2196 1678 2401
Aug-10 2118 7284 21413 2075 2045 1453 2075Sep-10 2162 7709 22643 2270 2151 1406 2184Oct-10 2347 8292 23807 2634 2372 1485 2380Nov-10 2333 8470 22909 2552 2292 1561 2377Dec-10 2351 9147 24111 2616 2281 1631 2413
Jan-11 2440 9556 25646 2747 2372 1792 2602Feb-11 2508 9868 28252 3153 2465 1872 2587Mar-11 2556 9503 26710 3059 2342 1694 2624Apr-11 2678 9493 26408 3236 2362 1793 2701May-11 2596 8960 24237 2868 2167 1771 2428Jun-11 2558 9067 22421 2552 2235 1709 2525Jul-11 2525 9650 23848 2740 2398 1730 2681Aug-11 2379 9001 21845 2404 2200 1775 2397Sep-11 2293 8300 20378 2253 2075 1772 2288Oct-11 2181 7394 19039 2187 1871 1504 1960Nov-11 2080 7581 17873 2129 1935 1355 1994Dec-11 2022 7565 18267 1938 1905 1364 2022
Jan-12 2144 8040 19855 2144 1982 1403 2096Feb-12 2208 8441 20394 2429 2058 1404 2121Mar-12 2184 8471 18661 2299 2036 1447 2057Apr-12 2050 8289 17940 2220 2002 1476 2071May-12 2008 7956 17068 2041 1936 1366 2013Jun-12 1890 7423 16549 1927 1859 1347 1854Jul-12 1876 7584 16128 1855 1848 1279 1882Aug-12 1845 7516 15735 1877 1818 1075 1901
(US $/metric ton)
Table 8a: Commodity Market Prices - Base Metals
Commodity Price Forecasts
Commodity Price Forecasts: September 201216
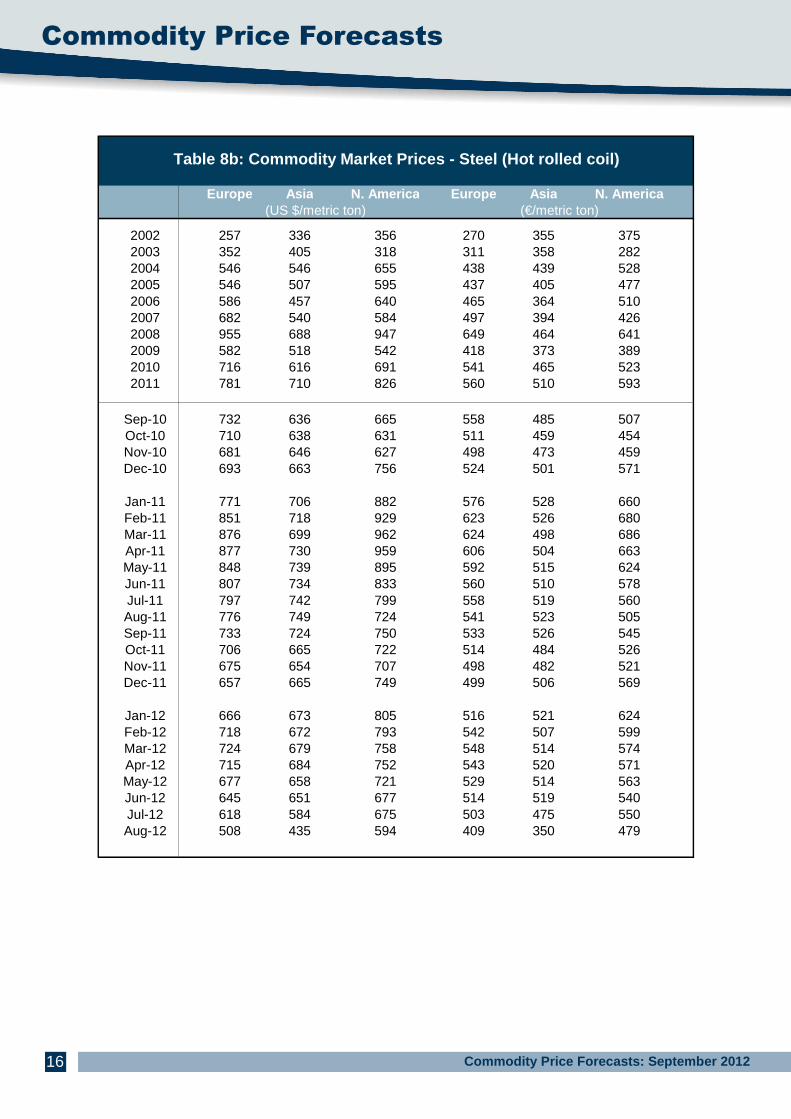
Europe Asia N. America Europe Asia N. America
2002 257 336 356 270 355 3752003 352 405 318 311 358 2822004 546 546 655 438 439 5282005 546 507 595 437 405 4772006 586 457 640 465 364 5102007 682 540 584 497 394 4262008 955 688 947 649 464 6412009 582 518 542 418 373 3892010 716 616 691 541 465 5232011 781 710 826 560 510 593
Sep-10 732 636 665 558 485 507Oct-10 710 638 631 511 459 454Nov-10 681 646 627 498 473 459Dec-10 693 663 756 524 501 571
Jan-11 771 706 882 576 528 660Feb-11 851 718 929 623 526 680Mar-11 876 699 962 624 498 686Apr-11 877 730 959 606 504 663May-11 848 739 895 592 515 624Jun-11 807 734 833 560 510 578Jul-11 797 742 799 558 519 560Aug-11 776 749 724 541 523 505Sep-11 733 724 750 533 526 545Oct-11 706 665 722 514 484 526Nov-11 675 654 707 498 482 521Dec-11 657 665 749 499 506 569
Jan-12 666 673 805 516 521 624Feb-12 718 672 793 542 507 599Mar-12 724 679 758 548 514 574Apr-12 715 684 752 543 520 571May-12 677 658 721 529 514 563Jun-12 645 651 677 514 519 540Jul-12 618 584 675 503 475 550Aug-12 508 435 594 409 350 479
(US $/metric ton) (€/metric ton)
Table 8b: Commodity Market Prices - Steel (Hot roll ed coil)
17
Commodity Price Forecasts
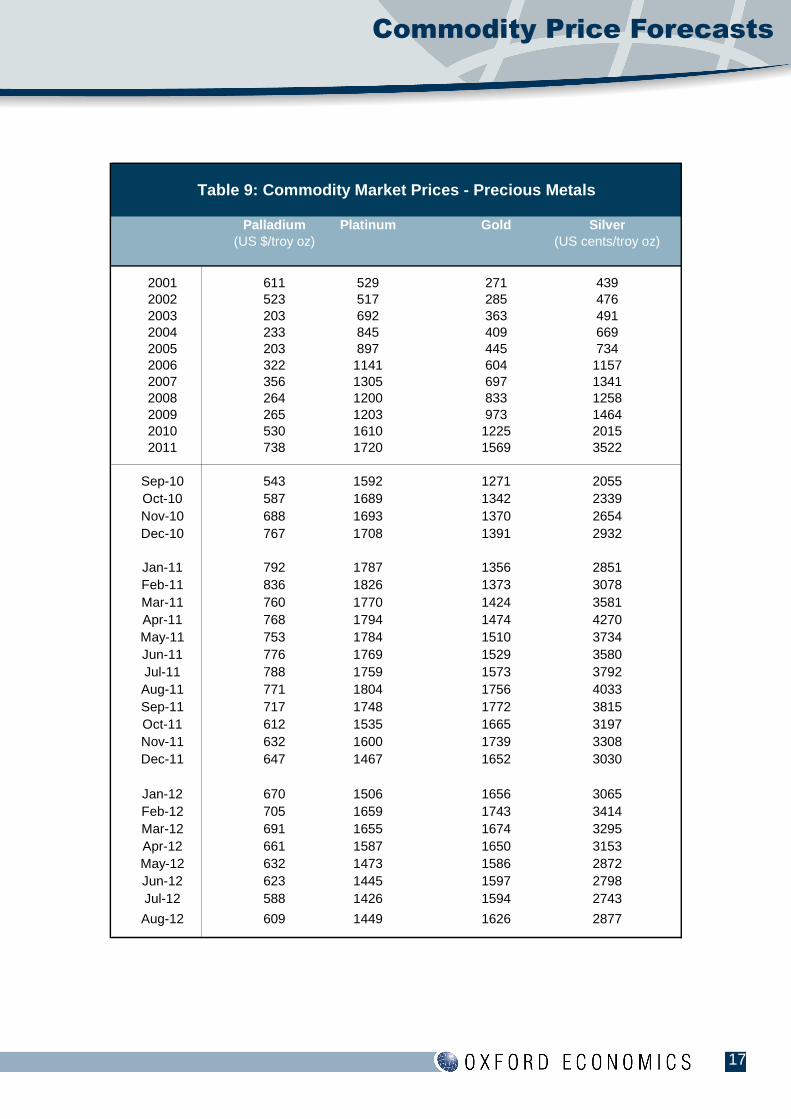
Palladium Platinum Gold Silver(US $/troy oz) (US cents/troy oz)
2001 611 529 271 4392002 523 517 285 4762003 203 692 363 4912004 233 845 409 6692005 203 897 445 7342006 322 1141 604 11572007 356 1305 697 13412008 264 1200 833 12582009 265 1203 973 14642010 530 1610 1225 20152011 738 1720 1569 3522
Sep-10 543 1592 1271 2055Oct-10 587 1689 1342 2339Nov-10 688 1693 1370 2654Dec-10 767 1708 1391 2932
Jan-11 792 1787 1356 2851Feb-11 836 1826 1373 3078Mar-11 760 1770 1424 3581Apr-11 768 1794 1474 4270May-11 753 1784 1510 3734Jun-11 776 1769 1529 3580Jul-11 788 1759 1573 3792Aug-11 771 1804 1756 4033Sep-11 717 1748 1772 3815Oct-11 612 1535 1665 3197Nov-11 632 1600 1739 3308Dec-11 647 1467 1652 3030
Jan-12 670 1506 1656 3065Feb-12 705 1659 1743 3414Mar-12 691 1655 1674 3295Apr-12 661 1587 1650 3153May-12 632 1473 1586 2872Jun-12 623 1445 1597 2798Jul-12 588 1426 1594 2743
Aug-12 609 1449 1626 2877
Table 9: Commodity Market Prices - Precious Metals
Commodity Price Forecasts
Commodity Price Forecasts: September 201218
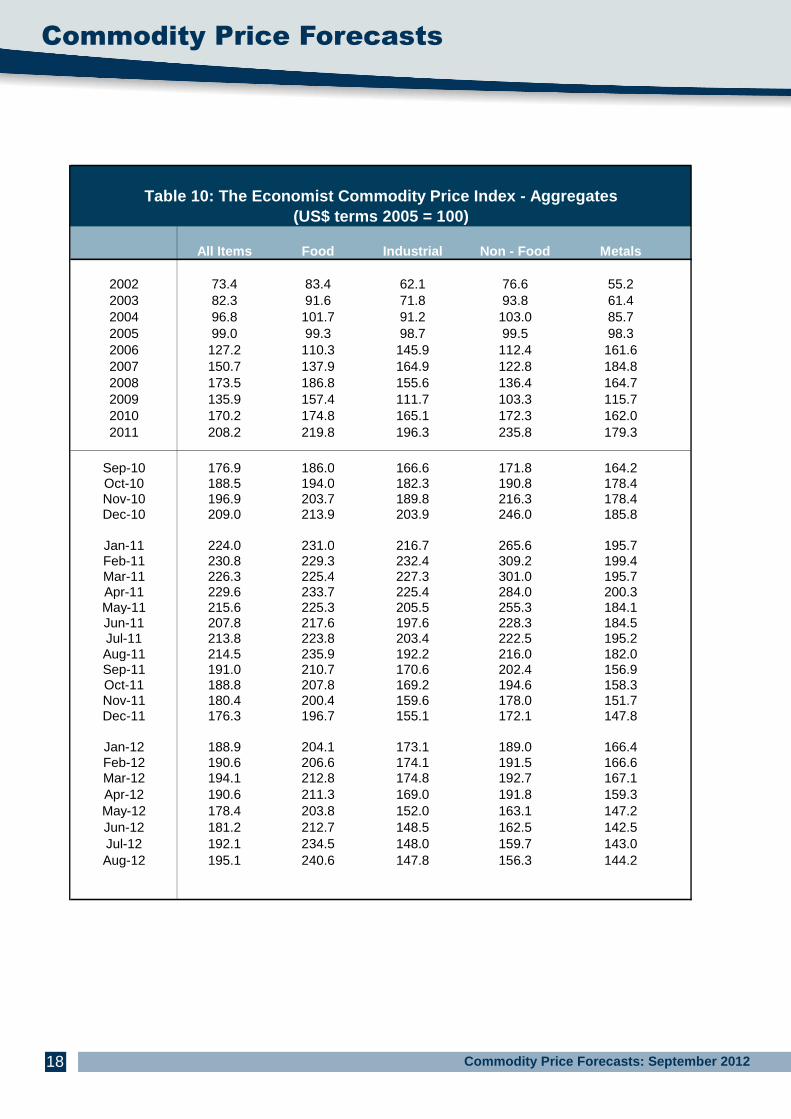
All Items Food Industrial Non - Food Metals
2002 73.4 83.4 62.1 76.6 55.22003 82.3 91.6 71.8 93.8 61.42004 96.8 101.7 91.2 103.0 85.72005 99.0 99.3 98.7 99.5 98.32006 127.2 110.3 145.9 112.4 161.62007 150.7 137.9 164.9 122.8 184.82008 173.5 186.8 155.6 136.4 164.72009 135.9 157.4 111.7 103.3 115.72010 170.2 174.8 165.1 172.3 162.02011 208.2 219.8 196.3 235.8 179.3
Sep-10 176.9 186.0 166.6 171.8 164.2Oct-10 188.5 194.0 182.3 190.8 178.4Nov-10 196.9 203.7 189.8 216.3 178.4Dec-10 209.0 213.9 203.9 246.0 185.8
Jan-11 224.0 231.0 216.7 265.6 195.7Feb-11 230.8 229.3 232.4 309.2 199.4Mar-11 226.3 225.4 227.3 301.0 195.7Apr-11 229.6 233.7 225.4 284.0 200.3May-11 215.6 225.3 205.5 255.3 184.1Jun-11 207.8 217.6 197.6 228.3 184.5Jul-11 213.8 223.8 203.4 222.5 195.2Aug-11 214.5 235.9 192.2 216.0 182.0Sep-11 191.0 210.7 170.6 202.4 156.9Oct-11 188.8 207.8 169.2 194.6 158.3Nov-11 180.4 200.4 159.6 178.0 151.7Dec-11 176.3 196.7 155.1 172.1 147.8
Jan-12 188.9 204.1 173.1 189.0 166.4Feb-12 190.6 206.6 174.1 191.5 166.6Mar-12 194.1 212.8 174.8 192.7 167.1Apr-12 190.6 211.3 169.0 191.8 159.3May-12 178.4 203.8 152.0 163.1 147.2Jun-12 181.2 212.7 148.5 162.5 142.5Jul-12 192.1 234.5 148.0 159.7 143.0Aug-12 195.1 240.6 147.8 156.3 144.2
Table 10: The Economist Commodity Price Index - Agg regates(US$ terms 2005 = 100)