Commodity Dependence and Human Development€¦ · Commodity Dependence and Human Development...
27
Commodity Dependence and Human Development Work-in-progress, please do not quote! Janvier D. Nkurunziza and Sofia Cazzaniga Special Unit on Commodities United Nations Conference on Trade and Development This version: 29 July 2015 Abstract: This paper explores the relationship between commodity dependence and human development measured as the human development index (HDI). Commodity dependence negatively affects human development through several channels, including the negative secular terms of trade affecting commodity-dependent developing countries (CDDCs), slow economic growth, high macroeconomic instability, and political instability. The paper finds that although the effect of commodity dependence on human development is negative, on average, this relationship is complex. It could differ depending on the level of dependence as well as the type of commodity a country depends on. This negative effect is strongest in countries where commodities account for more than 60 per cent of total merchandise exports.
Transcript of Commodity Dependence and Human Development€¦ · Commodity Dependence and Human Development...

Commodity Dependence and Human Development
Work-in-progress, please do not quote!
Janvier D. Nkurunziza and Sofia Cazzaniga
Special Unit on Commodities United Nations Conference on Trade and Development
This version: 29 July 2015
Abstract: This paper explores the relationship between commodity dependence and human development measured as the human development index (HDI). Commodity dependence negatively affects human development through several channels, including the negative secular terms of trade affecting commodity-dependent developing countries (CDDCs), slow economic growth, high macroeconomic instability, and political instability. The paper finds that although the effect of commodity dependence on human development is negative, on average, this relationship is complex. It could differ depending on the level of dependence as well as the type of commodity a country depends on. This negative effect is strongest in countries where commodities account for more than 60 per cent of total merchandise exports.

2
1. Introduction In 2012-2013 the number of countries deriving at least 60 per cent of their
merchandise export earnings from commodities stood at 94 out of 135 countries
studies.1 Commodity dependence, measured by the ratio of commodities exports to
total merchandise exports, is even stronger in Africa. Ninety-four per cent of African
countries were considered as commodity-dependent developing countries (CDDCs) in
2012-2013. This is the group of countries where primary commodities represent at
least 60 per cent of total merchandise exports.
High commodity dependence might not appear as an issue during periods of high
commodities prices. Indeed, commodity exporters derive important rents from their
commodity sectors during periods of price booms such as the one experienced over
the last decade. For most CDDCs, high prices usually imply higher export revenues
and faster economic growth. However, due to their failure to smooth the spending of
commodity windfalls over periods of price booms and busts and use these resources to
invest in economic structural transformation,2 most CDDCs experience periods of
economic growth during booms and long depressions afterwards (Bevan et al., 1993).
For example, in Africa, the commodities price boom of the 1970s was followed by a
period of low rates of economic growth in the 1980s and 1990s before the beginning
of a new period of high growth rates corresponding with the new boom starting in the
early 2000s.
Over the long term, high dependence on primary commodities is associated with poor
development outcomes, including unfavourable terms of trade, slow growth,
macroeconomic instability, as well as political instability. As price takers, CDDCs
have also been exposed to the negative consequences of commodity price volatility
that has characterized commodities markets in recent history. In this regard, a number
of empirical studies find that natural-resource dependent economies have generally
fared worse than other economies in terms of economic performance (van der Ploeg,
2011; Hausmann et al., 2007; Rodriguez and Sachs, 1999). The main channel though
1 Unless otherwise specified, data used is from UNCTADStat, UNCTAD's database. 2 For the definition of structural transformation and its implications, see for example AfDB et al. (2013)

3
which commodity dependence negatively affects economic performance is the so-
called "resource curse" discussed in the next section. This concept refers to the
inability of resource-rich countries to transform their natural resource wealth into
socio-economic benefits.
The main objective of this paper is to empirically explore the effect of commodity
dependence on human development using a disaggregated dataset covering the period
from 1995 to 2012. The choice of the sample period is motivated not only by data
availability but also the need to explore the extent to which the most recent
commodity boom might have altered the traditional negative relationship between
commodity dependence and an indicator of development such as the human
development index, contributing to the literature on commodity dependence,
development and structural transformation. A negative association between
commodity dependence and human development despite the recent commodity boom,
combined with a decline in manufacturing prices due to the delocalization of
manufacturing in low-cost countries such as China, would suggest that these major
events have not altered the long-term view that commodity dependence is indeed a
curse.
The paper proceeds as follows. The next section briefly discusses the three main
channels through which commodity dependence may affect development. The third
section uses recent disaggregated data to revisit the negative relation between
commodity dependence and human development. Section 4 is an empirical
econometric analysis of the relationship between human development and commodity
dependence in a multivariate framework. Section 5 concludes and suggests some
policy suggestions.
2. Commodity dependence and development: channels
Commodity dependence affects economic performance through the so-called
"Resource Curse" (Humphreys et al., 2007) via three different channels. The first is
the commodities' negative terms of trade channel. This argument is developed in the

4
Prebisch-Singer hypothesis, which posits that primary commodity exporters are
penalized by the secular negative terms of trade (Prebisch, 1950; Singer, 1950).3
The last decade experienced two opposed developments that could have altered the
trend in developing countries' terms of trade. On the one hand, since the late 1990s,
there has been a generalized global decline in manufacturing export prices particularly
as a result of cheap exports from China and their effect on the prices of competitors
(Kaplinsky, 2006). On the other hand, primary commodities export prices increased
across all commodity families since the early 2000s in the context of the recent
commodity boom (UNCTAD, 2015). Has the combination of low manufacturing
prices and high commodities prices altered the long-term trajectory of terms of trade
and hence the commodity dependence argument in favour of CDDCs?
A recent econometric study covering 25 commodities, half of which spanning the
period from 1650 to 20054 found that over the long run, a large number of primary
commodities are characterized by deteriorating terms of trade even when part of the
recent commodity boom period is included in the analysis.5 More specifically, twelve
out of 25 commodities analyzed display a significant negative trend whereas the
remaining commodities are zero-trending. There is no evidence of positive trending
terms of trade for any commodity, supporting the Prebisch-Singer hypothesis (Harvey
et al, 2010). A more recent study by Ertern and Ocampo (2013, p.14) proposes a
refinement to the interpretation of the Prebisch-Singer hypothesis. It finds that over
the 20th century, non-oil primary commodity prices display a "sequential decline in
mean prices through super-cycles" suggesting that the price trends do not necessarily
follow a stochastic trend as often hypothesized.
The second channel relates to the Dutch Disease phenomenon. It refers to the
appreciation of CDDC's currencies due to large inflows of foreign currency, following
the discovery of natural resources such as oil, or an important increase in commodities
3 This hypothesis has been tested econometrically and found to hold despite the occurrence of relatively short periods of high commodity prices (Lutz, 1999). 4 Three more commodities price series begin in the 18th century, eight in the 19th century and two in 1900 (Harvey et al, 2010). 5 Generally, although the results from some studies are mixed, many of them are based on questionable assumptions about the order of integration of the price variable and they fail to account for structural breaks in their modeling strategies, leading to erroneous conclusions.

5
export prices during commodity booms. The appreciation of the domestic currency
makes traditional exports less competitive on international markets while making
imports cheaper. This hampers economic diversification and could lead to de-
industrialization (Agénor and Montiel, 1996). Moreover, given that commodities price
booms are usually followed by periods of busts characterized by low prices, exchange
rates fluctuate with commodities price fluctuations. And exchange rate fluctuations
are detrimental for local commodity producers who are generally paid in local
currency. Furthermore, global commodities price fluctuations increase country-
specific macroeconomic volatility (Andrews and Rees, 2009; Ferreira, 2012). In
addition, commodities price fluctuations spread economic shocks among commodities
exporting countries leading to economic slowdown in these countries.
The third channel is political instability that often results from fights for the control of
rents associated with commodities windfalls in natural resource-rich countries (Caselli
and Tesei, 2011). Economic analyses of political instability have shown a close
relationship between natural resource dependence, poor governance and conflict. For
example, the risk of civil war increases with the ratio of primary commodities' exports
to GDP. The relationship is nonlinear, with the risk of civil war peaking at 0.33 when
primary commodities represent 25 per cent of GDP (Bannon and Collier, 2003, p.3).
Controlling the rents associated with primary commodities not only helps to explain
why wars start, particularly in societies where there are political grievances, but also
contributes to prolonging the conflict. In turn, civil wars affect the economy through
the destruction of productive resources, disruptions to economic activity, diversion of
resources from productive to un-productive sectors, dissaving, and portfolio
substitution, as agents tend to move their financial assets outside the country
concerned (Collier, 1999). These effects outlast the conflict so political instability
affects the economy for several years after the end of the conflict.
It would be misleading to conclude from this discussion that commodity dependence
is systematically associated with poor human development. There are countries that
have not become victims of the resource course despite having high ratios of primary
commodities to total merchandise exports. In these countries, the dependence on
primary commodities has not compromised their economic performance. In fact, some
of these countries, including Australia, Canada and Norway are among the world's

6
most developed nations. This suggests that many other factors, including the level of
institutional development, interact with commodity dependence to produce the
negative relationship between commodity dependence and development in CDDCs. In
most developing countries, commodity dependence goes hand in hand with under-
development as the rest of this paper will show.
3. Descriptive analysis In this paper, country i's commodity dependence at time t is defined by the ratio of its
commodities (primary commodities, precious stones and non monetary gold, that is:
SITC 0 +1+2+3+4+68+667+971) exports to total merchandise exports. It is given as:
𝐶𝐷!" =!"##"$%&' !"#$%&'!"
!"#$% !"#$!!"#$%& !"#$%&'!" (1)
𝑤𝑖𝑡ℎ 𝐶𝐷!" ≤ 1. High values imply that a country is highly dependent on primary
commodities exports, thus is more vulnerable to exogenous shocks both to
commodities prices and to supply of and demand for such commodities.
Note that the values assumed by 𝐶𝐷!" depend not only on the volume of exports but
also prices. Therefore, with the same volume of commodities, the index of commodity
dependence may increase or decline depending on the change in commodities prices
relative to the change in the prices of other merchandise exports. Commodity
dependence can also change due to the composition of exports. Even at the same price
and with the same volume of commodity exports, a country's commodity dependence
could change if the composition of its total merchandise exports (the denominator in
Equation 1) changes. For example, structural transformation in a commodity-
dependent country would normally increase non-commodity merchandise exports,
reducing dependence even as the country exports the same value of commodities. In
fact, this is what structural transformation is implicitly expected to achieve.
3.1. Commodity exports and human development A number of studies have investigated the deleterious effect of commodity
dependence or resource intensity on per-capita income and aggregate long run

7
economic growth (van der Ploeg, 2011; Hausmann et al., 2007; Rodriguez and Sachs,
1999). However, the study by Carmignani and Avom (2010) appears to be among the
first to investigate the effect of commodity dependence on development by shedding
light on the interaction between commodity dependence and non-monetary aspects of
development. The study finds that "non-monetary" indicators of development (e.g.
health and education) are negatively correlated with commodity dependence through
macroeconomic volatility and distributional inequalities.
This section builds on Carmignani and Avom (2010) and uses the most recent
disaggregated data to determine the effect of commodity dependence on human
development, measured by the Human Development Index (HDI). HDI combines
three different aspects of development: health, education (non-monetary aspects) and
living standards (monetary aspect) as measured by Gross National Income (GNI) per
capita.6
Using yearly data over the period from 1995 to 2012 covering a global sample of
countries, a measure of commodity dependence is constructed as in equation (1). In
order to show the differentiated effect of commodity dependence in developing
countries relative to developed countries, a dummy variable capturing the two groups
is introduced in the equation relating HDI to commodity dependence.
𝐻𝐷𝐼!" = 𝛼 + 𝛽𝐶𝐷!" + 𝛿 𝐶𝐷!" ⊗ 𝐷!" +∈!" (2)
where DDE is a dummy variable that takes a value of 1 if a country is developed and
zero otherwise.7 Note that in estimating equation (2) data is clustered on the basis of
the countries' main export category, as it is expected that different HDI observations
within each group may not be independent. Five merchandise export groups are
considered: agricultural products (food and non-food items); fuels; fabrics and
6 See UNDP's Human Development Reports for more details on HDI and its components. 7 Developed countries in the sample are Australia, Austria, Belgium, Bulgaria, Canada, Czech Republic, Denmark, Estonia, Finland, France, Germany, Hungary, Iceland, Ireland, Israel, Italy, Japan, Latvia, Lithuania, Luxembourg, Malta, Netherlands, New Zealand, Poland, Portugal, Romania, Slovakia, Slovenia, Spain, Sweden, Switzerland, United Kingdom, and United States. Note that for robustness checks we performed the same analysis eliminating Eastern Europe countries (former eastern bloc countries), but the results do not change significantly.

8
apparels; precious stones, metals and ores; and other manufactures. In equation (2),
the coefficient β captures the effect of commodity dependence on HDI in developing
countries, while (β+δ) captured the effect on developed countries.
Table 1: Commodity dependence and HDI: naïve pooled regression Dependent variable is HDI
Parameters Coefficients β -0.23**
(0.10) δ 0.51***
(0.07) α 0.74***
(0.07) (β+δ) 0.28**
(0.14)
R-Squared 0.40
Observations 2743
Figure 1 is a scatter plot of HDI and the ratio of commodity dependence with the
green points representing countries that are major oil exporters. The fitted regression
line is based on the results in Table 1.
Figure 1: Scatter plot of HDI and commodity dependence
9
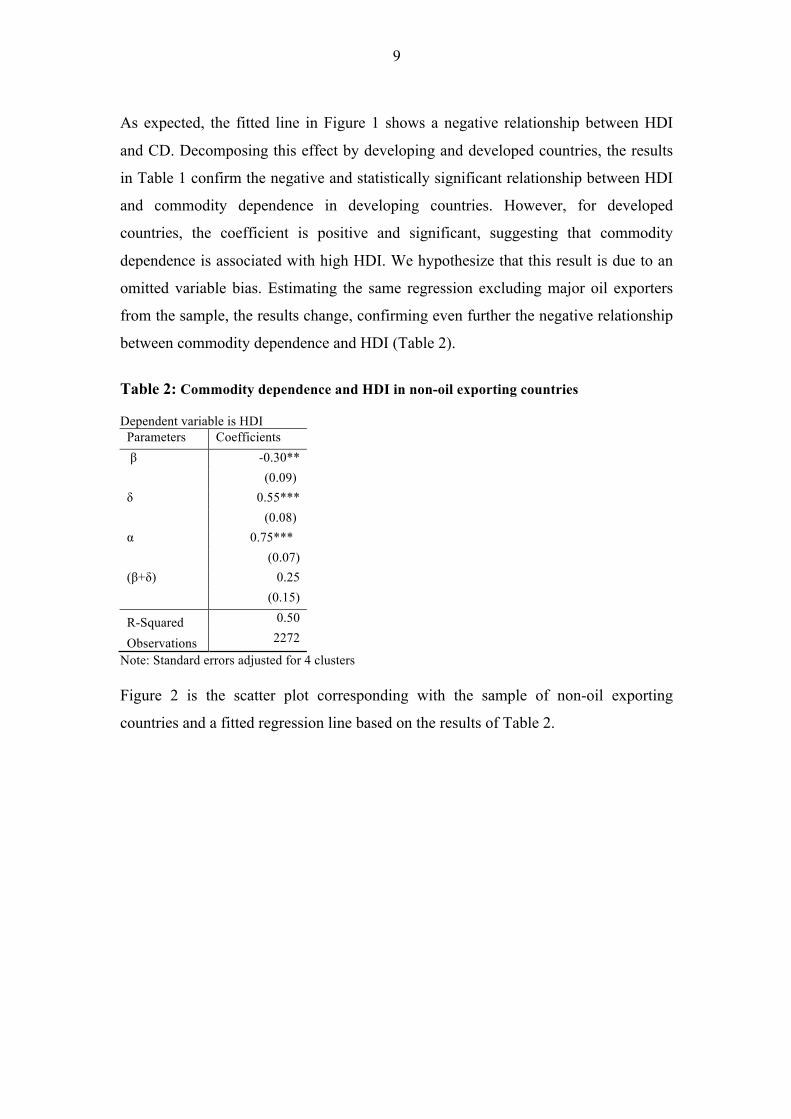
As expected, the fitted line in Figure 1 shows a negative relationship between HDI
and CD. Decomposing this effect by developing and developed countries, the results
in Table 1 confirm the negative and statistically significant relationship between HDI
and commodity dependence in developing countries. However, for developed
countries, the coefficient is positive and significant, suggesting that commodity
dependence is associated with high HDI. We hypothesize that this result is due to an
omitted variable bias. Estimating the same regression excluding major oil exporters
from the sample, the results change, confirming even further the negative relationship
between commodity dependence and HDI (Table 2).
Table 2: Commodity dependence and HDI in non-oil exporting countries Dependent variable is HDI
Parameters Coefficients β -0.30**
(0.09) δ 0.55***
(0.08) α 0.75***
(0.07) (β+δ) 0.25
(0.15)
R-Squared 0.50
Observations 2272
Note: Standard errors adjusted for 4 clusters Figure 2 is the scatter plot corresponding with the sample of non-oil exporting
countries and a fitted regression line based on the results of Table 2.

10
Figure 2: HDI and commodity dependence in non-oil exporting countries
The effect of commodity dependence on HDI is still negative and even stronger
(looking at the slope of the fitted line) than in the previous case, denoting a more
detrimental effect of commodity dependence on human development in this group of
countries. Interestingly, once oil-exporting countries are removed from the sample,
the effect of commodity dependence in developed countries becomes statistically non-
significant. These results suggest that oil exporting countries share the atypical pattern
of combining high levels of commodity dependence with high HDIs. This may result
from the fact that oil is a particular commodity which, unlike other typical primary
commodities, tends to sustainably generate high export revenues which in turn
increase GNI per capita, a component of HDI.
Whether or not high HDI in this group of oil-dependent countries also reflects high
education and health standards depends on the way in which oil export revenues are
spent by governments to promote welfare and development. A number of these
countries have relatively high HDIs which are driven by GNI per capita, with
relatively high GNI per capita coexisting with relatively low education and/or health
standards. These countries display HDIs that are higher than their non-income HDIs.
This group includes Chad, Angola, Equatorial Guinea, and Gabon (UNDP, 2011).

11
The preceding discussion suggests that the extent of the effect of commodity
dependence on human development might differ according to the type of commodities
exported by a specific country. In order to explore this hypothesis, we re-estimate
equation (2), focusing on the group of developing countries, by dropping countries
categorized in each of the five export groups previously described.8 This is a test of
the sensitivity of HDI to specific commodity groups.
Table 3 below reports the β-coefficients which represent the sensitivity of HDI to CD
in developing countries. The entries read as "countries major exporters of …." Values
in the diagonal report β-coefficients of regressions when observations (country-years)
referring to one group are dropped. For example, β in position (2,2) with the first
number referring to row and the second to column, that is fuel, is derived after
dropping all country-years referring to fuel exporters. The value of the coefficient is -
0.30, the same as the one computed earlier. Outside the diagonal, the coefficients
show the effect of dropping two groups of commodities. For example, coefficient (4,
3) is the β-coefficient when country-years representing mining and apparel are
dropped. The coefficient is -0.28, which is slightly stronger than the average full-
sample coefficient of -0.23.
Table 3: HDI Sensitivity to dependence on different commodity export groups
Food Fuel Apparel Mining Food -0.17 -0.27** -0.24** -0.11 Fuel -0.30** -0.37** -0.32** Apparel -0.29*** -0.28** Mining -0.22
Figure 3 highlights with different colors country-years for each of the five export
groups. It visually helps to interpret the results of table 3 above.
8 If a country’s main export in a specific year t falls in the mining group, for example, it is categorized as a mainly mining exporter in that year. Hence countries’ export groups might change over time. ** and *** represent statistical significance at 95 per cent and 99 per cent, respectively.

12
Figure 3: HDI and commodity export groups
Figure 3 could be easily divided into four quadrants with a vertical line at CD of 0.5
and a horizontal line at HDI of 0.6 (as the minimum value is about 0.2). Countries in
the lower-right quadrant are characterized by high commodity dependence and low
HDI. This group of countries appears to be dominated by agricultural exporters and,
to some extent, mining exporters. Indeed, among the countries in this group are very
poor countries such as Benin, Burundi, Ethiopia, Gambia, Guatemala, Malawi, Mali,
Paraguay, and Uganda. The group of agricultural exporters is so important that
excluding them from the sample used to estimate the effect of CD on HDI changes the
β-coefficient from a statistically significant coefficient of -0.23 to a statistically non-
significant coefficient of -0.17. In contrast, the upper-left quadrant is dominated by
manufactures exporters with low commodity dependence and high HDI.
Countries in the lower-left quadrant are not commodity dependent but display low
levels of human development. These are exporters of low-skilled manufactures,
namely countries whose main exports are in the textile, apparel and garment group.
This category includes countries such as Cambodia, Bangladesh, Pakistan, Sri Lanka,
Lesotho, Madagascar, Mauritius, Haiti, Macao, and Tunisia. Textile and clothing
industries can theoretically offer an opportunity for poor countries to add value to
primary commodities in order to help escape the natural resource curse. However, as
Keane and te Velde (2008) explain, adequate policies, appropriate institutions and a

13
properly functioning private sector are important pre-requisites for a successful
management of the benefits accruing from the clothing and textile industry. Without
these pre-requisites, developing countries lack the capacity of moving up from simple
textile manufacturing to other associated high-value activities like design, marketing
or branding.
Therefore, even though the textile industry can potentially be the "first step up the
value-added manufacturing ladder" (Keane and te Velde, 2008), it is not always the
case that local government and private sector can or have interest in harnessing this
potential. Among the countries that have successfully taken advantage of the textile
industry are Costa Rica, Mauritius, and the Asian Tigers, a group of countries
characterized by high HDIs. From a statistical point of view, dropping these countries
from the sample does not substantially affect the general result, as the β-coefficient
slightly increases from -0.23 to -0.29.
The empirical results discussed in this section are not particular to the dependent
variable used. Substituting HDI with an income variable, namely GNI per capita and
executing the estimations presented above leads to comparable results.9
3.2. Dynamics of the effect of commodity dependence on human development So far, the analysis of the effect of commodity dependence on human development
has focused on the average effect over the sample period (1995-2012). However, there
is no theoretical justification for a constant β-coefficient. Indeed, the relationship
between commodity dependence could depend on commodity cycles, strengthening or
weakening, depending on the extent to which an increase or reduction in commodity
dependence is transmitted to human development through a change in income,
education or health standards. For example, during commodity booms, commodity
dependence increases but at the same time high prices generate additional resources
that can be used to improve human development through investments in education
and health services.
9 These empirical results could be provided upon request.

14
We investigate the differential effect of CD on human development over time by
performing cross-sectional regressions of HDI on commodity dependence for each
year in the sample period. Figure 4 plots the empirical β-coefficients for the 18 years
of the sample.
Figure 4: Changes in β-coefficients over the sample period
Figure 4 shows that the negative effect of commodity dependence on human
development declines (in absolute value) over time, from about 0.26 in the mid-1990s
to 0.22 in the late 2000s. The interpretation is that a change in commodity dependence
in the mid-1990s was associated with a stronger effect on human development relative
to the late 2000s. Even though these results are just descriptive, they suggest some
marginal reduction in the effect of commodity dependence on human development
over time.
3.3 Commodity dependence and volatility
What is the relationship between commodity dependence and economic vulnerability?
Section 2 has argued that commodity exporting countries are exposed to the vagaries
of terms of trade shocks which are transmitted to the economy and create
macroeconomic instability. Indeed, limited diversification both in production and

15
export markets exposes CDDCs to supply and demand shocks associated with the
commodity economy. Over the last few years, supply shocks have included weather
conditions for agricultural commodities, domestic policies in major exporting
countries such as export bans, and low investments in new sources of supply
particularly when prices are low. Demand shocks have included the health of the
global economy, economic growth in major importing economies such as China,
interest rates in major economies such as the United States and the Euro area, and
economic restructuring in large commodity consumers, particularly China (UNCTAD,
2015). Supply and demand shocks create economic uncertainty which is detrimental
to economic growth and human development as Figure 5 illustrates.
Figure 5: Macroeconomic instability and human development
Figure 5 is a scatter plot of each country’s average commodity dependence and the
log standard deviation of the annual growth rate of per-capita GDP over the sample
period.10 As expected, commodity dependence seems to be positively correlated with
macroeconomic instability.
10 Growth of GDP per capita is from World Development Indicators of the World Bank.

16
4. Econometric analysis In the previous section the effect of commodity dependence on human development is
explored in a bivariate model which does not control for other potential determinants
of human development. This section explores the same relationship but within a
multivariate model. We first discuss the variables other than commodity dependence
that might explain human development. Secondly, we estimate multivariate models of
HDI in which commodity dependence is one among other explanatory variables.
4.1. Discussion of the variables used in the model
Our choice of covariates, in agreement with the literature (e.g. Carmignani and Avom,
2010; Gupta et al. 2002; Carmignani, 2008) consists in the following variables:
(i) Trade: as explained by Carmignani and Avom (2010), openness to trade
captures the positive effect of globalization on social outcomes,
particularly human capital formation. This implies a positive relationship
between trade and human development. The variable is measured as the
total of imports and exports over GDP (Source: WDI);
(ii) (ii) Government expenditure: this variable is measured as the sum of
government spending on goods and services over GDP. It is expected to
capture spending on social sectors with high expenses expected to increase
human development. Hence, a positive relationship with human
development is expected (Source: WDI);
(iii) Institutional quality: inefficiencies in government spending and corruption
may reduce or even cancel the positive effect of government spending on
human development. In order to control for this effect, we include a
variable on institutional quality. It is an index constructed by considering
the first principal component of six individual indicators, namely voice and
accountability, political stability and absence of violence/terrorism,
government effectiveness, regulatory quality, rule of law, and control of
corruption (Source: World Governance Indicators, WGI11).
(iv) Latitude: is a variable measuring the distance separating a country and the
Equator. This variable has been used in the literature to capture the effect 11 www.govindicators.org

17
of being in the tropical zone, which is associated with challenges such as
malaria prevalence (Source: La Porta et al., 1999). Hence, the longer the
distance, the higher the human development, implying a positive sign
between this variable and human development
(v) Dummy variables: we include dummy variables for undeveloped countries
(UNDE), major apparel exporters (APPAREL), major fuel exporters
(FUEL), major mining (MINING) and major agricultural exporters
(AGRICULTURAL).
The effect of commodity dependence on human development is expected to be non-
linear. At low levels of dependence, the effect should be limited. For example, in
diversified economies, commodity dependence is low and; these economies tend to be
developed hence with high HDIs. In order to take into account these hypotheses, we
first estimate a quantile regression which allows the effect of commodity dependence
to vary over the distribution of the dependent variable, namely human development.
4.2. Quantile regression
The classical least-square regression assumes that the conditional mean function of
the dependent variable y can be modeled as a linear combination of the covariates, i.e.
[ ] ∑=
+=k
iiik xxxyE
11,..., βα . In other words, the conditional mean summarizes all the
relevant information on the relationship between y and xi, i=1, …,k. However, it might
be the case that the estimated βs are not good estimates as the magnitude of the effect
of covariates might be different at different levels of the dependent variable. In this
case, it is relevant to investigate the impact of the covariates on the whole distribution
of the dependent variable: they may increase its dispersion (increase
heteroskedasticity), induce multimodality, or compress or stretch a tail of its
distribution. Conditional quantile regression models are used in this case: the p-th
quantile of a random variable y is assumed to be a linear function of the independent
variables, i.e. [ ] ∑=
+=k
ii
pi
pky xxxpQ
1
)()(1 ,..., βα . The factor loadings βi
(p) represent the
effect of the xi on the p-th quantile of y; they reveal more information than the OLS
loadings, especially if the distribution of the dependent variable y is not symmetric.
Figure 1 shows the results of the quantile regression.

18
Figure 6: Empirical results of the quantile regression

19
Commodity dependence has a negative effect on human development and the effect is
strongest at relatively low levels of HDI. The elasticity of commodity dependence
relative to human development is about -0.20 for HDI below 0.6, implying that for
every percentage increase in commodity dependence, human development declines by
0.20 percentage points. As Figure 6 shows, beyond an HDI of 0.6-0.7, the effect of
commodity dependence weakens dramatically, reaching -0.04 when HDI is close to
1.0. This result establishes the fact that the analysis of the effect of commodity
dependence on human development must differentiate between high human
development countries where this effect is not strong and low human development
countries where the effect is strong.
Going one step further, we identified the level of commodity dependence of the
countries with an index of human development below 0.6. The finding is that on
average commodity exports represent 63 per cent of these countries total merchandise
exports. As a result, with some simplification, we draw from this finding that the ratio
of commodity dependence where the phenomenon starts to strongly affect human
development appears to be around 0.6. Hence, we conclude that the category of
commodity-dependent developing countries includes countries where commodity
exports represent at least 60 per cent of their total merchandise exports.
What about the effect of other variables used as controls? Trade, government
expenses and institutional quality seem to have a positive effect on human
development. However, the coefficients are so small that this effect is weak. For
example, the effect of trade is strongest when HDI is 0.5 but the coefficient is equal to
0.0006. For institutional quality, the effect is almost zero from an HDI value of 0.1.
Nevertheless, the concavity of the trade and government expenditure effects suggests
that as the population of a country enjoys a high level of human development, a
marginal increase in government spending or trade does not have much effect on HDI.
Up to the median level of HDI, increases in government expenditure and trade have a
positive albeit weak effect on human development.
The variable measuring the geographical position of a country which captures climatic
and geographic conditions appears to be a strong determinant of human development.
All the factor loadings β(p) are positive, implying that the longer the distance from the

20
Equator, the higher the HDI. The steep decline of β(p)s along the distribution of HDIs
implies that the effect of the geographical variable quickly weakens as HDI increases.
In other words, geographical conditions weakly impact human development when the
latter is already high.
With respect to the effects of the dummy variables, we focus on two. First, exporting
apparels is negatively associated with human development and this effect is stronger
in low HDI countries, weakening from -0.14 in the first decile to -0.09 at the median.
This is in line with the argument of Keane and te Velde (2008) discussed earlier.
Secondly, fuel exporters are associated with high HDI but this effect is complex. This
effect declines from the first to the second deciles before increasing to reach its
maximum at the 4th decile. Thereafter, it declines steadily, from 0.15 at the 4th decile
to 0.06 in the 9th decile. The implication is that the benefits to human development
from oil exports are more important in low HDI countries which are generally more
dependent on this export than higher-HDI countries which are more economically
diversified.
It should be acknowledged that some regressors are potentially endogenous; the
quantile regression does not control for endogeneity. For example, commodity
dependence might be endogenous to HDI as arguably, countries with low human
development might lack the technology, expertise and institutions that would help
them to diversify their economies and escape the commodity dependence syndrome.
Indeed, despite the negative effect of commodity dependence on human development,
many CDDCs remain commodity-dependent even after enjoying important
commodity windfalls during commodity booms such as the one experienced in the
2000s. We attempt to control for endogeneity using a dynamic panel data model.
First, the index of human development is expected to change slowly given the nature
of the variables composing it. This suggests an inclusion of the lagged value of HDI
in the model.12Secondly, as suggested by the quantile regression results, the effect of
12 A country's current HDI is reasonably similar to its previous HDI. So we might suspect that HDI is non-stationary. Yet HDI is bounded between zero and one, thus from a theoretical point of view we expect it to be stationary. Moreover the hypothesis of stationarity is supported by unit root panel data tests. We perform two types of tests: the first test has a null hypothesis of a common unit root across all

21
commodity dependence on human development is non-linear. One could think of the
relationship as looking like an inverted U-shape: at low levels of commodity
dependence (that is the case of an advanced economy with developed manufacturing
and/or services sector such as Norway and Canada), an increase in commodity
dependence might have a positive effect on human development as it might increase
export revenues (see Carmignani and Chowdhury, 2007).
On the other hand, at high levels of commodity dependence a further increase in CD
reduces HDI as a result of factors associated with the natural resource curse. This
could be the case with many oil exporters in Africa which are highly commodity-
dependent. For example, Angola's ratio of commodity dependence is almost one and
the country is among the countries with a low human development index. Other oil
exporters such as Chad, Republic of Congo and Equatorial Guinea share this pattern
(United Nations, 2015). Therefore, we account for the non-linearity of commodity
dependence by entering in the HDI equation the variable and its squared term.
Table 4: Results of dynamic system GMM models
Model 1 Model 2 Model 3 Model 4
Lagged HDI
Commodity dependence
Square commodity dependence
Commodity boom dummy
Trade openness
Government consumption
Institutional quality
Fuel dummy
Agriculture dummy
Mining dummy
Apparel dummy
Upper middle income economies
Lower middle-income economies
Low-income economies
0.980**
-0.059**
0.045**
0.002**
0.987**
-0.049**
0.038**
0.001**
-0.001
0.000
0.002 **
0.979**
-0.042**
0.024**
0.002**
-0.000
0.000
0.001**
0.014**
0.004
-0.000
0.006
0.961**
-0.043**
0.032**
0.002**
-0.001
-0.000
0.001**
0.003
-0.008*
-0.014**
panels; the second test is based on the Augmented Dickey Fuller and Phillips-Perron Fisher Chi-square statistics (we consider all the versions with and without time trend and drift).

22
Constant 0.031** 0.027**
0.024**
0.046**
Number of observations 2033 2028 2028 2028
Arell.-Bond test for AR(1) (pval) 0.000 0.000 0.000 0.000
Arell.-Bond test for AR(2) (pval) 0.367 0.364 0.302 0.332
Hansen test of overid. Restrictions 0.826 0.792 0.726 0.745 ** and * represent statistical significance at 5 per cent and 10 per cent, respectively
In all models in Table 4, the results of the tests for first and second-order
autocorrelation are as expected. The test for identifying restrictions also confirms that
we cannot reject the null hypothesis that the set of instruments used to account for
endogeneity are appropriate.
The positive sign and strong coefficient of the lagged value of HDI suggests that the
current value of the variable is a good predictor of its future value, confirming that the
process of human development improves slowly. The signs and statistical significance
of the other key variables are qualitatively similar to the previous ones based on a
quantile regression. Taken together, the statistical significance and negative sign of
commodity dependence and the positive sign of its squared term illustrate the non-
linearity of the relationship between commodity dependence and human development.
This confirms the U-shaped relationship. However, as these are average regression
coefficients giving the average trend over the distribution of the variable, they do not
provide an accurate description of the relationship.
The convex shape of the relationship between commodity dependence and human
development does not necessarily mean that it is perfectly U-shaped. It might have an
asymptotic trend towards infinity, in this case towards CD=1; there might even be
inflection points or shape changes that cannot be detected by regression coefficients.
In order to investigate more closely this relationship, we fit a non-parametric curve
(see Figure 7) which best fits the data.

23
Figure 7: Commodity dependence and human development
Although there is a generally downward-trending relationship between commodity
dependence and human development, the relationship is complex. The fitted curve
seems to have inflection points, first at low levels of commodity dependence where
the relationship changes from positive to negative. There is also a dramatic increase in
the negative slope of the curve in the last two deciles of the commodity dependence
variable, suggesting a very strong negative effect of commodity dependence on
human development when commodity dependence is very high. Moreover, before
CD~0.65, the curve appear convex, then turns concave thereafter. Where a country
falls on this curve could help to determine the policies needed in order to reduce the
negative effect of commodity dependence and the country's human development.
4. Conclusion and policy suggestions The analysis in this paper has focused on the relationship between commodity
dependence and human development, using UNDP’s HDI which combines three
aspects of human development, namely income per capita, education and health
standards. The findings confirm that generally, there is a negative relationship
between commodity dependence and human development, but this relationship is not
linear. At very low levels of commodity dependence, it seems to be positively

24
associated with human development. This is due to an income effect where a marginal
increase in commodity dependence implies higher export revenues that are used to
raise the level of human development as would be the case in countries such as
Norway and Canada.
In contrast, the analysis has shown that in commodity-dependent developing countries,
where commodity exports represent more than 60 per cent of total merchandise
exports, commodity dependence is associated with low human development. These
countries might benefit from higher export revenues during commodity booms, as
experienced in Africa during the 2000s, and post high levels of economic growth, but
they may lack the human capital and institutions needed to transform these
commodity windfalls into human development improvements. In fact, regression
results have shown that improvement in human development is very slow, suggesting
that deliberate policies to improve it could be needed to speed up progress. The
analysis has also shown that not all commodities affect human development the same
way. Countries relying on agricultural exports seem to suffer more from their
dependence on commodities relative to fuel exporters, for example, which seem to
benefit.
One policy implication of this analysis is that CDDCs have every reason to diversify
away from commodities in order to improve their human development. It is surprising
that despite the rhetoric about the need for economic diversification and structural
transformation over the past decades (e.g. AfDB, 2013), countries have not, generally,
reduced their commodity dependence. If anything, commodity dependence has
increased over time, suggesting that this issue probably needs to be revisited in a
different light in order to come up with new more successful approaches.
For example, it is important to understand the major risks facing a country’s
commodity exports before crafting a diversification strategy. Recent research shows
that agricultural commodities exports are more prone to idiosyncratic risk-based
factors whereas minerals are generally more sensitive to global risk (Nkurunziza and
Tsowou, 2015). This implies that to reduce commodity dependence and its negative
effect on human development, exporters of agricultural commodities could diversify
towards other unrelated commodities within the same sector. In contrast, minerals

25
exporters would benefit by diversifying vertically given that adding new mineral
products to their export basket would expose them to the same market risk.
It is also important to note that successful diversification requires a long term vision
and the setting up of an appropriate policy environment which fosters its
implementation. For example, the analysis in this paper has shown that diversifying
away from raw cotton exports into manufacturing of textiles and apparels would not
take a country very far in terms of setting off an export diversification process which
improves human development; these manufactured products are also associated with
low human development. Therefore, addressing commodity dependence in a way that
improves human development requires leadership and human capital capable of
developing the right strategy, and put in place a policy environment and a set of
institutions that help the process of diversification. Technological and financial
resource mobilization strategies must be an integral part of the process.

26
References AfDB, OECD, UNDP and UNECA (2013). African Economic Outlook. Structural Transformation and Natural Resources. OECD Publishing. Agénor, P-R and Montiel, P (1996). Development Macroeconomics. Princeton: Princeton University Press. Andrews R., Rees D., 2009, Macroeconomic volatility and terms of trade shocks, Research Discussion Paper, Reserve Bank of Australia. Bannon, I and Collier, P, eds. (2003). Natural resources and violent conflict: options and actions. Washington, D.C., The World Bank. Bevan, D., Collier, P. and Gunning, JW (1993). Controlled Open Economies: A Neoclassical Approach to Structuralism. Journal of Development Economics. 41 (1), 209-211 Carmignani, F., 2008, The impact of fiscal policy on private consumption and social outcomes in Europe and the CIS. Journal of Macroeconomics, 30, 575-598. Carmignani F., Avom D., 2010, The social development effects of primary commodity export dependence, Ecological Economics, 70, 317-330. Caselli, F and Tesei, A (2011). Resource Windfalls, Political Regimes and Political Stability. Working Paper 17601. National Bureau of Economic Research, Cambridge, MA. Chaban M., 2009, Commodity Currencies and Equity Flows, Journal of International Money and Finance, 28, 836-852. Cleveland, W. S. 1993. Visualizing Data, Hobart Press, NJ. Cleveland, W, S, 1994, The Elements of Graphing Data, Hobart Press, NJ. Collier, P (1999). "On the economic consequences of civil war" Oxford Economic Papers, 51, 168-183. Erten, B. and Ocampo, J. A (2013). "Super Cycles of Commodity Prices Since the Mid-Nineteenth Century" World Development, 44, 14-30. Ferreira Filipe S., 2012, Equity Order Flow and Exchange Rate Dynamics, Journal of Empirical Finance, 19, 359-381. Gupta, S., Verhoven, M., Tiongosn, E., 2002, The effectiveness of government spending on education and health care in developing and transition economies. European Journal of Political Economy, 18, 717-737.

27
Harvey, D., Kellard, N., Madsen, J and Wohar, M (2010). "The Prebisch-Singer hypothesis: four centuries of evidence" Review of Economics and Statistics, 92 (2), 367-377. Hausmann, R, Hwang, J and Rodrik, D (2007). "What you export matters" Journal of Economic Growth, 12, 1-25 Humphreys, M, Sachs, J D, and Stiglitz, J E (2007). Escaping the Resource Curse. New York: Columbia University Press. Kaplinsky, R (2006). "Revisiting the revisited terms of trade: will China make a difference?" World Development, 34 (6), 981-995 Keane J., Willem te Velde D., 2008, The role of textile and clothing industries in growth and development strategies, Overseas Development Institute. La Porta, R., Lopez-de-Silanes, F., Shleifer, A., Vishny, R., 1999, The quality of the government, Journal of Law, Economics and Organizations, 15, 222-279. Lutz, M (1999). "A general test of the Prebisch-Singer hypothesis" Review of Development Economics, 3 (1), 44-57. Nkurunziza, J. D and Tsowou, K (2015). Volatility in global commodities markets and implications for diversification policies. Mimeo. UNCTAD. Prebisch, R (1950). "The Economic Development of Latin America and Its Principal Problems" Economic Bulletin for Latin America, 7, 1-12 Rodriguez, F and Sachs, J (1999). "Why do resource-abundant economies grow more slowly?" Journal of Economic Growth, 4 (3), 277-303 Singer, H., (1950). "The Distribution of Gains between Investing and Borrowing Countries" American Economic Review, Papers and Proceedings, 40, 473-485 UNCTAD (2015). Recent developments and new challenges in commodity markets and policy options for commodity-based inclusive growth and sustainable development. Paper presented at the Multi-year Expert Meeting on Commodities and Development, UNCTAD. Geneva. UNDP (2011). Human Development Report 2011--Sustainability and Equity: A Better Future for All. New York. United Nations (2015). State of Commodity Dependence 2014. UNCTAD, New York and Geneva. Van der Ploeg, F (2011). "Natural resources: curse or blessing?" Journal of Economic Literature, 49 (2), 366–420