Commodities Weekly Tracker 5th March 2012
20
Commodities & Currencies Weekly Tracker www.angelcommodities.com
Transcript of Commodities Weekly Tracker 5th March 2012

7/28/2019 Commodities Weekly Tracker 5th March 2012
http://slidepdf.com/reader/full/commodities-weekly-tracker-5th-march-2012 1/20
Commodities & Currencies
Weekly Tracker
www.angelcommodities.com
7/28/2019 Commodities Weekly Tracker 5th March 2012
http://slidepdf.com/reader/full/commodities-weekly-tracker-5th-march-2012 2/20
Commodities Weekly Tracker
ContentsReturns
• Non Agri Commodities
• Currencies
• Agri Commodities
Non-Agri Commodities
• Gold
• Silver
• Copper
Monday | March 05 2012
Currencies – DX, Euro, INR
Agri Commodities
• Chana
• Black Pepper
• Turmeric• Jeera
• Soybean
• Refine Soy Oil & CPO
• Sugar
•Potato
www.angelcommodities.com

7/28/2019 Commodities Weekly Tracker 5th March 2012
http://slidepdf.com/reader/full/commodities-weekly-tracker-5th-march-2012 3/20
Commodities Weekly TrackerMonday | March 05 2012
1.9
0.9
0.00.3
1.3
2.3
Non-Agri Commodities Weekly Performance
www.angelcommodities.com
(0.7)
(1.8)
(2.7) (3.0) (3.2)
(3.4)(3.7)
(2.7)
(1.7)
.

7/28/2019 Commodities Weekly Tracker 5th March 2012
http://slidepdf.com/reader/full/commodities-weekly-tracker-5th-march-2012 4/20
Monday | March 05 2012
Commodities Weekly Tracker
1.4
1.0 1.0
0.7
0.1
0.0
0.5
1.0
1.5
Currencies Weekly Performance
www.angelcommodities.com
(0.3)
(0.9)
(1.9)(2.0)
(1.5)
(1.0)
(0.5)

7/28/2019 Commodities Weekly Tracker 5th March 2012
http://slidepdf.com/reader/full/commodities-weekly-tracker-5th-march-2012 5/20
Commodities Weekly TrackerMonday | March 05 2012
19.4 18.6
10.59.5
6.78.0
10.0
12.0
14.0
16.0
18.0
20.0
22.0
Agri Commodities- Weekly Performance
www.angelcommodities.com
*Weekly Performance for March contract
3.6
1.00.2
(0.4) (0.5) (0.6) (0.9) (1.3)(1.8)
(1.9) (2.5)(4.0)
(2.0)
0.0
2.0
4.0
6.0
7/28/2019 Commodities Weekly Tracker 5th March 2012
http://slidepdf.com/reader/full/commodities-weekly-tracker-5th-march-2012 6/20
GoldWeekly Price Performance
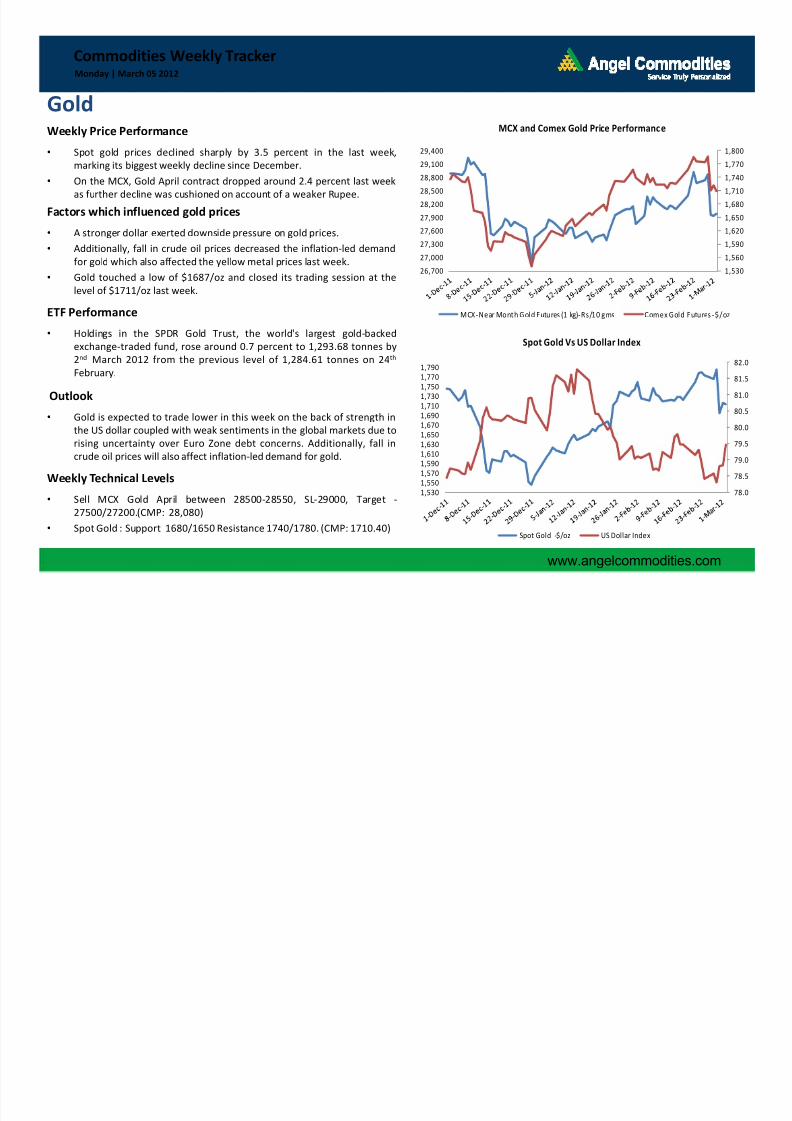
• Spot gold prices declined sharply by 3.5 percent in the last week,
marking its biggest weekly decline since December.
• On the MCX, Gold April contract dropped around 2.4 percent last week
as further decline was cushioned on account of a weaker Rupee.
Factors which influenced gold prices• A stronger dollar exerted downside pressure on gold prices.
• Additionally, fall in crude oil prices decreased the inflation-led demand
for gold which also affected the yellow metal prices last week.
• Gold touched a low of $1687/oz and closed its trading session at the
level of $1711/oz last week.
Commodities Weekly TrackerMonday | March 05 2012
1,530
1,560
1,590
1,620
1,650
1,680
1,710
1,740
1,770
1,800
26,700
27,000
27,300
27,600
27,900
28,200
28,500
28,800
29,100
29,400
MCX and Comex Gold Price Performance
ETF Performance
• Holdings in the SPDR Gold Trust, the world's largest gold-backed
exchange-traded fund, rose around 0.7 percent to 1,293.68 tonnes by
2nd March 2012 from the previous level of 1,284.61 tonnes on 24th
February.
Outlook
• Gold is expected to trade lower in this week on the back of strength in
the US dollar coupled with weak sentiments in the global markets due torising uncertainty over Euro Zone debt concerns. Additionally, fall in
crude oil prices will also affect inflation-led demand for gold.
Weekly Technical Levels
• Sell MCX Gold April between 28500-28550, SL-29000, Target -
27500/27200.(CMP: 28,080)
• Spot Gold : Support 1680/1650 Resistance 1740/1780. (CMP: 1710.40)
www.angelcommodities.com
MCX-Near Month Gold Futures (1 kg)-Rs/10 gms Comex Gold Futures -$/oz
78.0
78.5
79.0
79.5
80.0
80.5
81.0
81.5
82.0
1,5301,5501,5701,5901,6101,6301,6501,670
1,6901,7101,7301,7501,7701,790
Spot Gold Vs US Dollar Index
Spot Gold -$/oz US Dollar Index
7/28/2019 Commodities Weekly Tracker 5th March 2012
http://slidepdf.com/reader/full/commodities-weekly-tracker-5th-march-2012 7/20
SilverWeekly Price Performance
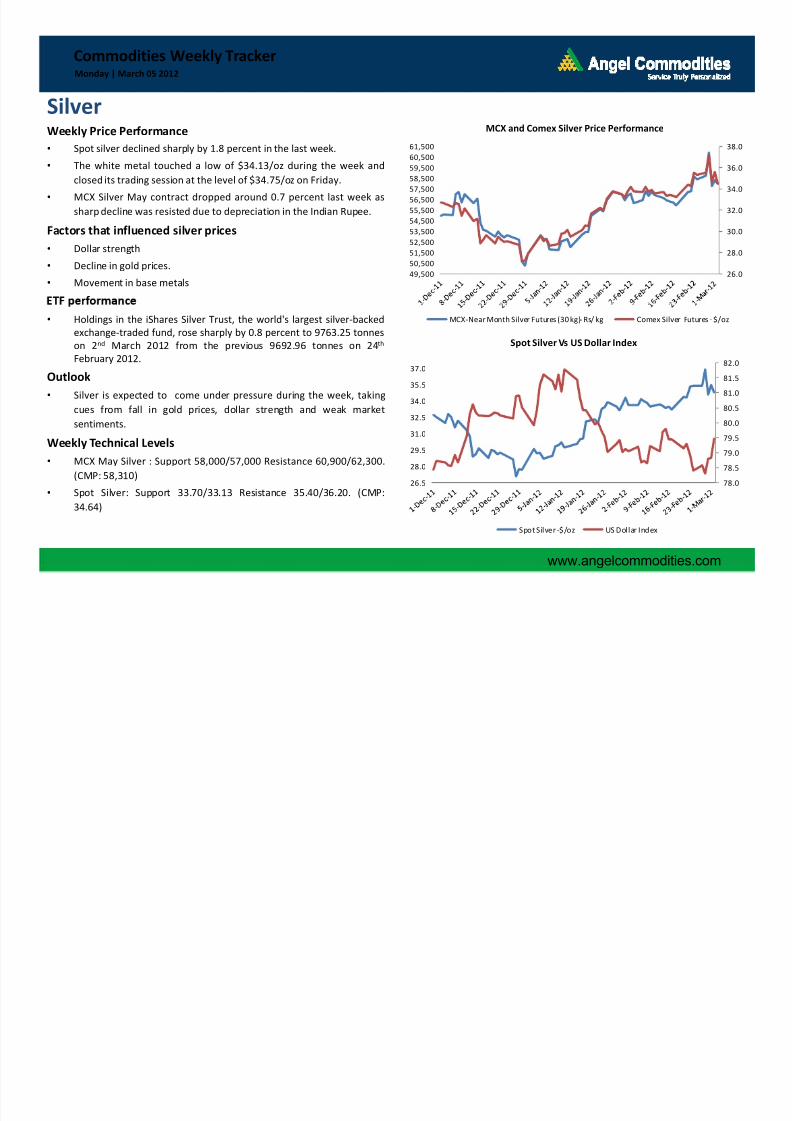
• Spot silver declined sharply by 1.8 percent in the last week.
• The white metal touched a low of $34.13/oz during the week and
closed its trading session at the level of $34.75/oz on Friday.
• MCX Silver May contract dropped around 0.7 percent last week as
sharp decline was resisted due to depreciation in the Indian Rupee.Factors that influenced silver prices
• Dollar strength
• Decline in gold prices.
• Movement in base metals
Commodities Weekly TrackerMonday | March 05 2012
26.0
28.0
30.0
32.0
34.0
36.0
38.0
49,500
50,500
51,500
52,500
53,500
54,500
55,500
56,500
57,500
58,500
59,500
60,500
61,500
MCX and Comex Silver Price Performance
• Holdings in the iShares Silver Trust, the world's largest silver-backedexchange-traded fund, rose sharply by 0.8 percent to 9763.25 tonnes
on 2nd March 2012 from the previous 9692.96 tonnes on 24th
February 2012.
Outlook
• Silver is expected to come under pressure during the week, taking
cues from fall in gold prices, dollar strength and weak market
sentiments.Weekly Technical Levels
• MCX May Silver : Support 58,000/57,000 Resistance 60,900/62,300.
(CMP: 58,310)
• Spot Silver: Support 33.70/33.13 Resistance 35.40/36.20. (CMP:
34.64)
www.angelcommodities.com
MCX-Near Month Silver Futures (30 kg)- Rs/ kg Comex Silver Futures - $/oz
78.0
78.5
79.0
79.5
80.0
80.5
81.0
81.5
82.0
26.5
28.0
29.5
31.0
32.5
34.0
35.5
37.0
Spot Silver Vs US Dollar Index
Spot Silver -$/oz US Dollar Index

7/28/2019 Commodities Weekly Tracker 5th March 2012
http://slidepdf.com/reader/full/commodities-weekly-tracker-5th-march-2012 8/20
CopperWeekly Price Performance
• On a w-o-w basis, copper traded higher by almost 1 percent on the
LME last week and hit a high of $8695/tonne.
• MCX Copper April contract gained around 3.3 percent in the last week
as depreciation in the Indian Rupee supported sharp gains on the
domestic platform.
Copper Inventories
• On a weekly basis, copper inventories on the LME warehouses declined
sharply by almost 5 percent to 289,000 tonnes on 2nd March 2012 from
the previous level of 303,500 tonnes on 24th February 2012.
• Weekly copper inventories in warehouses monitored by the Shanghai
Futures Exchange increased around 2.5 percent to 221,487 tonnes in
Commodities Weekly TrackerMonday | March 05 2012
385
390
395
400
405410
415
420
425
430
435
440
7,100
7,300
7,500
7,7007,900
8,100
8,300
8,500
8,700
8,900
LME and MCX Copper Price Performance
e as wee .
Factors that influenced copper prices• Fall in copper LME inventories.
• However, sharp gains were capped due to demand concerns from
China and a stronger dollar.
Outlook
• Copper is expected to trade lower this week on the back of rising
concerns over growth of global economy which could affect demand
for the industrial metals. Additionally, a stronger dollar will also act asa negative factor for the red metal prices.
Weekly Technical Levels
• MCX April Copper : Support 427/422 Resistance 435/443 (CMP:
430.95).
• LME Copper: Support 8488/8385 Resistance 8640/8800. (CMP: 8540)
www.angelcommodities.com
LME Copper Future ($/tonne) MCX Near Month Copper Contract (Rs/kg)
7,100
7,300
7,500
7,700
7,900
8,100
8,300
8,500
8,700
8,900
280,000
290,000
300,000
310,000
320,000
330,000
340,000
350,000
360,000
370,000
380,000
390,000
400,000
LME Copper Price Movement Vs Inventory
Co pp er LME I nve nt ory (t onn es) L ME C op pe r Fu tu re ($ /t on ne )

7/28/2019 Commodities Weekly Tracker 5th March 2012
http://slidepdf.com/reader/full/commodities-weekly-tracker-5th-march-2012 9/20
Crude OilWeekly Price Performance
• On a weekly basis, Nymex crude oil prices declined sharply by 3 percent.
• However, MCX Crude oil March contract dropped around 1.5 percent last
week, as Rupee depreciation resisted further decline.
US Energy Department Inventory
• As per the US Energy Department (EIA) report released last week, crudeoil inventories increased sharply by 4.2 million barrels to 344.9 million
barrels for the week ending on 24th February, 2012.
• Gasoline stocks fell by 1.6 million barrels to 229.9 million barrels and
whereas distillate stockpiles also declined by 2.07 million barrels to 141.4
million barrels for the same week.
Commodities Weekly TrackerMonday | March 05 2012
92.0
94.0
96.0
98.0
100.0
102.0
104.0
106.0
108.0
110.0
4700
4800
4900
5000
5100
5200
5300
5400
5500
Nymex and MCX Crude Oil Price Performance
• Strength in the dollar.• Sharp rise in US crude oil inventories.
• News that Saudi Arabia has denied a reported pipeline explosion in the
country’s eastern province also affected oil prices at the end of the week.
Outlook
• We expect crude oil prices to trade with a sideways bias during the week,
taking mixed cues from dollar strength, weak sentiments in the global
markets and supply worries from Iran.Weekly Technical Levels
• MCX March Crude: Support 5180/5120 Resistance 5460/5550 (CMP:
5341)
• Nymex Crude Oil: Support 104.0/102.40 Resistance 109.60/111.50 (CMP:
106.85)
www.angelcommodities.com
MCX crude oi l (Rs/bbl ) NYMEX Crude Oi l ($ /bbl)
320
330
340
350
360
370
380
Crude Oil Inventories (mn barrels)

7/28/2019 Commodities Weekly Tracker 5th March 2012
http://slidepdf.com/reader/full/commodities-weekly-tracker-5th-march-2012 10/20
DX/ INRWeekly Price Performance
• On a weekly basis, the US Dollar Index (DX) traded higher by 1.3 percent.
• The Indian Rupee (INR) witnessed depreciation of around 1 percent last week.
Factors that influenced movement in the DX
• Mixed sentiments in the global markets boosted demand for the low-yielding
dollar.
• Rising uncertainty with respect to Euro Zone led to sharp decline in the Eurolast week and this also acted as a further supportive factor for dollar.
• The index touched a high of 79.52 and ended at the level of 79.46 on Friday.
Factors that influenced movement in the Rupee
• Strength in the US dollar.
• Weak sentiments in the domestic markets. (Nifty -1.3% Sensex -1.6%)
Commodities Weekly TrackerMonday | March 05 2012
76.5
77.0
77.5
78.0
78.5
79.0
79.5
80.0
80.5
81.0
81.5
82.0
US Dollar In dex
• However, continuously increasing capital inflows in the country resisted sharp
depreciation in the currency.
FII Inflows
• For the current month, FII inflows totaled at Rs 926.40 crores till 2nd March
2012. While on a year to date basis, net capital inflows stood at Rs 36496.10
crores till 2nd March.
Outlook
• The US dollar is expected to strengthen this week, on the back of rising
uncertainty over Euro Zone debt concerns which will increase demand for thelow-yielding dollar. On account of this, coupled with mixed market sentiments,
we expect the Indian Rupee to trade with a depreciation bias during the week.
However, continuously rising capital inflows in the country may cushion sharp
depreciation in the Indian currency.
Weekly Technical Levels
• USD/INR MCX Mar: Support 49.60/49.13 Resistance 50.32/ 51.0 (CMP: 49.79)
• US Dollar Index: Support 78.50/77.60 Resistance 79.90/ 80.35(CMP: 79.30)
www.angelcommodities.com
48.0
49.0
50.0
51.0
52.0
53.0
54.0
$/INR - Spot
7/28/2019 Commodities Weekly Tracker 5th March 2012
http://slidepdf.com/reader/full/commodities-weekly-tracker-5th-march-2012 11/20
EuroWeekly Price Performance
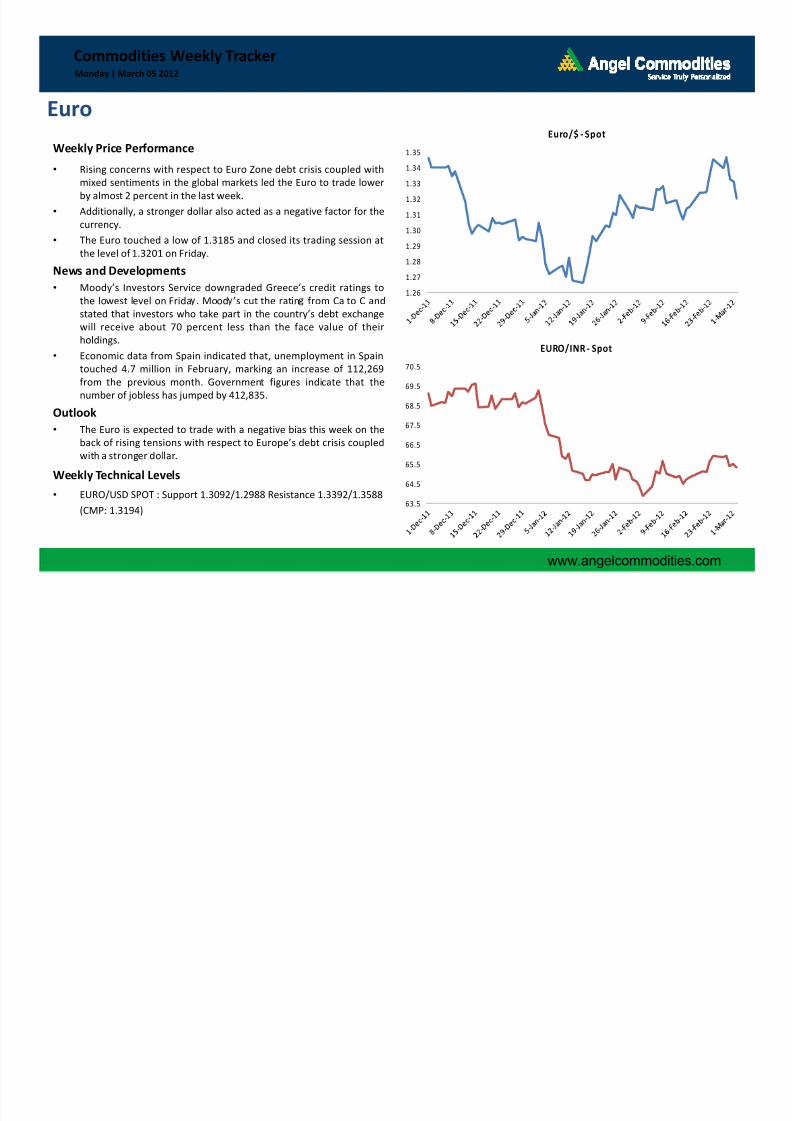
• Rising concerns with respect to Euro Zone debt crisis coupled with
mixed sentiments in the global markets led the Euro to trade lower
by almost 2 percent in the last week.
• Additionally, a stronger dollar also acted as a negative factor for thecurrency.
• The Euro touched a low of 1.3185 and closed its trading session at
the level of 1.3201 on Friday.
News and Developments
• Moody’s Investors Service downgraded Greece’s credit ratings to
the lowest level on Frida . Mood ’s cut the ratin from Ca to C and
Commodities Weekly TrackerMonday | March 05 2012
1.26
1.27
1.28
1.29
1.30
1.31
1.32
1.33
1.34
1.35
Euro/$ - Spot
stated that investors who take part in the country’s debt exchange
will receive about 70 percent less than the face value of their
holdings.
• Economic data from Spain indicated that, unemployment in Spain
touched 4.7 million in February, marking an increase of 112,269
from the previous month. Government figures indicate that the
number of jobless has jumped by 412,835.
Outlook
• The Euro is expected to trade with a negative bias this week on theback of rising tensions with respect to Europe’s debt crisis coupled
with a stronger dollar.
Weekly Technical Levels
• EURO/USD SPOT : Support 1.3092/1.2988 Resistance 1.3392/1.3588
(CMP: 1.3194)
www.angelcommodities.com
63.5
64.5
65.5
66.5
67.5
68.5
69.5
70.5
EURO/INR - Spot

7/28/2019 Commodities Weekly Tracker 5th March 2012
http://slidepdf.com/reader/full/commodities-weekly-tracker-5th-march-2012 12/20
Chana
Commodities Weekly TrackerMonday | March 05 2012
Weekly Price Performance
• After gaining sharply during the last week, Chana futures settled 1.9% lower w-o-w
on expectations arrivals might gain momentum owing to harvesting in MP.
Harvesting of Chana commenced in MP
• Arrivals of early sown Chana starts in Karnataka, Maharashtra and AP in January.
However, Maharashtra witnessed 42% drop in output and thus failed to cap
upside in the prices in January and February.
• However, harvesting has commenced in MP, the Chana producing state & thus
arrival pressure would built up gradually. MP markets have started receiving fresh
arrivals in small quantities. Arrivals' in Rajasthan would commence by mid March.
Chana output may fall even below government's estimates of 7.6 mn tn
• Decline in area by 4.3% and unfavorable climate has led to a fall in Chana output
by 6.8 at 7.6 mn tn compared to 8.2 mn tn in 2010-11 Major drop is output is
estimated in the state of Maharashtra by 42% followed by Karnataka by 19%.• However, some of the trade participants are expected Chana output to fall much
below government's expectations.
Despite seasonal pressure prices no major down side expected
• Chana prices follow a seasonality pattern, wherein they decline sharply with the
commence ment of fresh arrivals in Jan, bottom out during the peak arrival period
(March – April) & then gradually starts rising thereafter. However, in the current
season, demand supply fundamentals point towards upward pressure on the priceseven during the peak arrival period.
Outlook
• Chana prices may decline in the current week owing to commencement of fresh
arrivals. However, sharp downside may be capped on lower output of Chana in the
2011-12 season.
Weekly Strategy
• Sell NCDEX March Chana between 3680-3690, SL-3790, target 3500/3450.
www.angelcommodities.com

7/28/2019 Commodities Weekly Tracker 5th March 2012
http://slidepdf.com/reader/full/commodities-weekly-tracker-5th-march-2012 13/20
Black PepperWeekly Price Performance
• Lower fresh arrivals along with demand from the domestic buyers continued to
provide support to the Pepper prices for the third consecutive week. Pepper Spot
prices and Futures settled 6.67% and 8.4% higher respectively w-o-w.
• Prices at the Futures touched historical high of Rs.39,610/qtl in the last week.
Global Scenario
• According to International Pepper Community, global Pepper output is projected
to grow by 7 % in 2012 to 3.20 lakh tonnes as against 2.98 lakh tonnes in 2011.
• Import of Pepper into U.S during April to November 2011 surged marginally
by1.58 % to 64276 tonnes as compared to 63274 tonnes during the same period
in 2010-11.
• Indonesia remained the largest supplier, supplying 37% to U.S.
Commodities Weekly TrackerMonday | March 05 2012
• Exports of Pepper from Indonesia and Vietnam fell by 56% and 2% respectively
while exports from Brazil, India and Malaysia rose by 6%,32% and 10%respectively in 2011. Exports from major suppliers fell owing to lower availability.
Domestic Scenario
• Production in India is expected to decline by 10.4% to 43000 tonnes in 2012 from
48000 tonnes in 2011. Output of Pepper in India is lowest in a decade .
• Average arrivals in the domestic markets are still lower at around 7-8 MT daily
against offtakes of 12-15MT.
Outlook• Demand from the local stockists amidst lower arrivals are expected to keep
Pepper prices firm in the week.
Weekly Strategy• Buy NCDEX March Pepper betw 39100/39200, SL-37900, Target 41500/42000
Source :Spices Board

7/28/2019 Commodities Weekly Tracker 5th March 2012
http://slidepdf.com/reader/full/commodities-weekly-tracker-5th-march-2012 14/20
TurmericWeekly Price Performance
• Ample supplies in the domestic resulting from fresh arrivals led Spot prices to
remain bearish and settled 2.59% lower w-o-w. Futures traced the Spot prices
and settled 0.80% down w-o-w.
• Demand from the overseas and domestic buyers remained lower lending support
to the bears in the market.
Turmeric production to touch historical high in 2012• Production of Turmeric is expected to touch historical level of 82 lakh bags in
2011-12 season.
• Production of turmeric in Erode in 2011-12 is expected to rise 29% to 45 lakh
bags as compared to 35 lakh bags in 2010-11.
Ex orts of Turmeric at historical hi h of 58 000 tonnes
Commodities Weekly TrackerMonday | March 05 2012
•Exports of turmeric during April to November rose 63% to 58,000 tonnes as
compared to 35,500 tonnes in the same period previous year. However, exports
for the month of November 2011 declined by 5.9 percent.
• The target set by the Spices board have already been achieved and has touched
new historical high of 58,000 tonnes in the eight months of the FY 2011-12.
Outlook
• With arrivals in the domestic market to gain sharply prices may remain bearish in
the coming weeks. Demand also continues to remain lacklustre. This will also
support bearish market sentiments.
Weekly Strategy• Sell NCDEX April Turmeric between 4850-4900, SL-5010, Target 4680/4600
www.angelcommodities.com
Source: Spot market sources
7/28/2019 Commodities Weekly Tracker 5th March 2012
http://slidepdf.com/reader/full/commodities-weekly-tracker-5th-march-2012 15/20
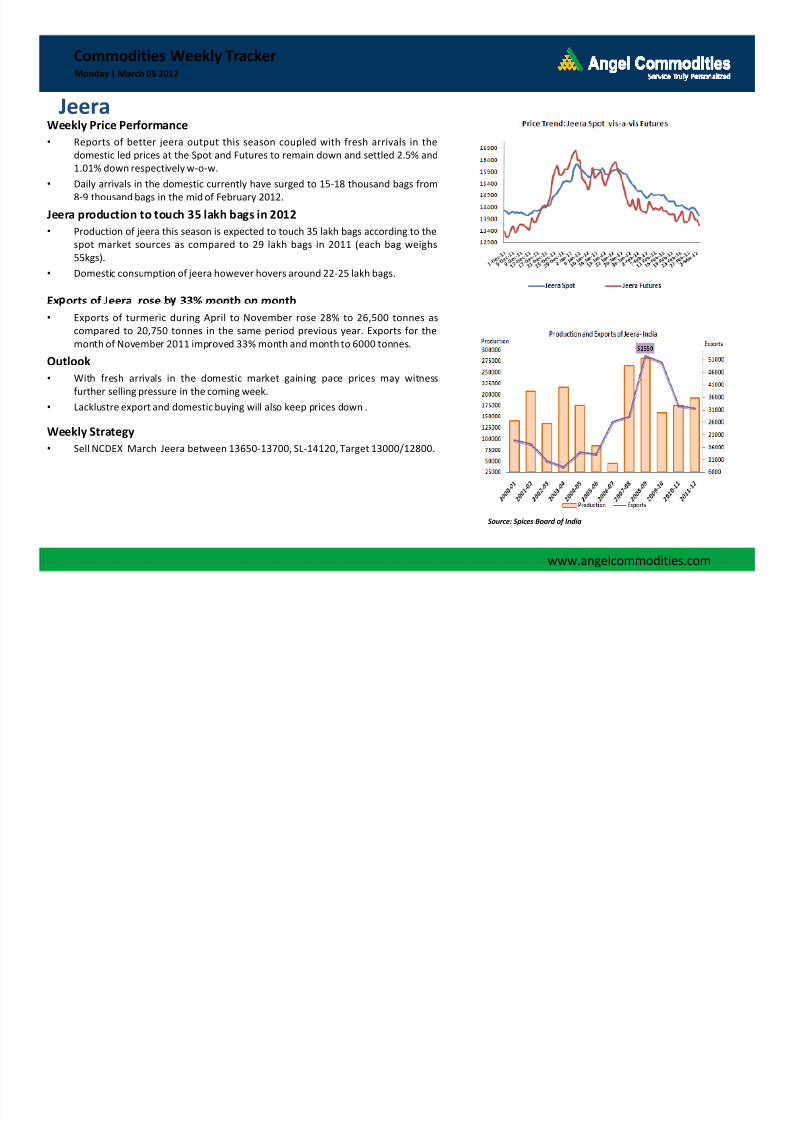
JeeraWeekly Price Performance
• Reports of better jeera output this season coupled with fresh arrivals in the
domestic led prices at the Spot and Futures to remain down and settled 2.5% and
1.01% down respectively w-o-w.
• Daily arrivals in the domestic currently have surged to 15-18 thousand bags from
8-9 thousand bags in the mid of February 2012.
Jeera production to touch 35 lakh bags in 2012• Production of jeera this season is expected to touch 35 lakh bags according to the
spot market sources as compared to 29 lakh bags in 2011 (each bag weighs
55kgs).
• Domestic consumption of jeera however hovers around 22-25 lakh bags.
Ex orts of Jeera rose b 33% month on month
Commodities Weekly TrackerMonday | March 05 2012
• Exports of turmeric during April to November rose 28% to 26,500 tonnes as
compared to 20,750 tonnes in the same period previous year. Exports for the
month of November 2011 improved 33% month and month to 6000 tonnes.
Outlook
• With fresh arrivals in the domestic market gaining pace prices may witness
further selling pressure in the coming week.
• Lacklustre export and domestic buying will also keep prices down .
Weekly Strategy• Sell NCDEX March Jeera between 13650-13700, SL-14120, Target 13000/12800.
www.angelcommodities.com
Source: Spices Board of India

7/28/2019 Commodities Weekly Tracker 5th March 2012
http://slidepdf.com/reader/full/commodities-weekly-tracker-5th-march-2012 16/20
Soybean
Commodities Weekly TrackerMonday | March 05 2012
Weekly price performance
• Lower crop expectations in Brazil and Argentina coupled with improved demand
from China for the protein seed led uptrend in the CBOT prices intact in the
week ended 3rd March 2012. Prices at the CBOT and NCDEX Futures therefore
settled 3.85% and 3.75% higher respectively w-o-w.
U.S. Soybean weekly sales down
• U.S. weekly export sales for soybeans in the week ended 23 rd February 2012almost halved to 5.49 lakh tonnes from 11.59 lakh tn in week ended 16th
February 2012.
Global Soybean updates
• Brazilian consultancy Agrural and Agro consult cut its Soybean estimate for
2011/12 to around 68 million tonnes, from last month estimate of 70.2-71
.
•According to. the USDA annual agricultural outlook forum held on Thursday, 23rd
February and Friday 24th February U.S. Soybean inventories are forecasted to
fall by 25% to 205 million bushels in marketing year 2012-13
• Further according to International Grains Council World Soybean output is
expected to decline by 8% to 246.5 million tonnes as compared to last year.
World Soy meal trade is expected to surge by 3% to 58.4 million tonnes as
compared to last year.
Indian Scenario
• Indian Soy meal exports during Apr 2011 to January 2012 of surged 4.8% to30.24 MT as compared to 28.87 MT. However, month on month exports fell by
40.5 percent.
Outlook
• Lower global ending stocks of Soybean and rising demand for the Soybean is
expected to keep Soybean prices firm in the coming week.
Strategy
• Buy NCDEX March Soybean between 2690-2700, SL-2650, target 2800/2830.
www.angelcommodities.com
Source: USDA and Ministry of Agriculture India
7/28/2019 Commodities Weekly Tracker 5th March 2012
http://slidepdf.com/reader/full/commodities-weekly-tracker-5th-march-2012 17/20
Refine Soy Oil and Crude Palm Oil
Commodities Weekly TrackerMonday | March 05 2012
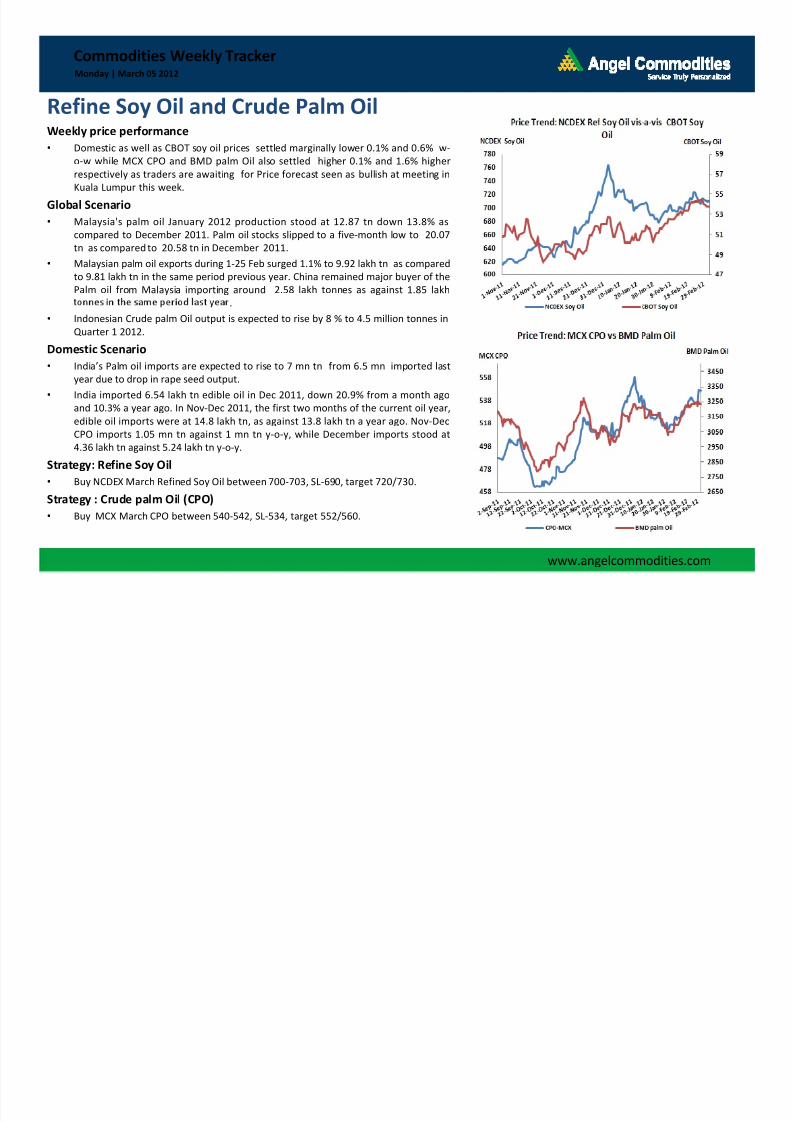
Weekly price performance
• Domestic as well as CBOT soy oil prices settled marginally lower 0.1% and 0.6% w-
o-w while MCX CPO and BMD palm Oil also settled higher 0.1% and 1.6% higher
respectively as traders are awaiting for Price forecast seen as bullish at meeting in
Kuala Lumpur this week.
Global Scenario
• Malaysia's palm oil January 2012 production stood at 12.87 tn down 13.8% as
compared to December 2011. Palm oil stocks slipped to a five-month low to 20.07
tn as compared to 20.58 tn in December 2011.
• Malaysian palm oil exports during 1-25 Feb surged 1.1% to 9.92 lakh tn as compared
to 9.81 lakh tn in the same period previous year. China remained major buyer of the
Palm oil from Malaysia importing around 2.58 lakh tonnes as against 1.85 lakh
.
•Indonesian Crude palm Oil output is expected to rise by 8 % to 4.5 million tonnes in
Quarter 1 2012.
Domestic Scenario
• India’s Palm oil imports are expected to rise to 7 mn tn from 6.5 mn imported last
year due to drop in rape seed output.
• India imported 6.54 lakh tn edible oil in Dec 2011, down 20.9% from a month ago
and 10.3% a year ago. In Nov-Dec 2011, the first two months of the current oil year,
edible oil imports were at 14.8 lakh tn, as against 13.8 lakh tn a year ago. Nov-Dec
CPO imports 1.05 mn tn against 1 mn tn y-o-y, while December imports stood at4.36 lakh tn against 5.24 lakh tn y-o-y.
Strategy: Refine Soy Oil
• Buy NCDEX March Refined Soy Oil between 700-703, SL-690, target 720/730.
Strategy : Crude palm Oil (CPO)
• Buy MCX March CPO between 540-542, SL-534, target 552/560.
www.angelcommodities.com

7/28/2019 Commodities Weekly Tracker 5th March 2012
http://slidepdf.com/reader/full/commodities-weekly-tracker-5th-march-2012 18/20
Sugar
Commodities Weekly TrackerMonday | March 05 2012
Weekly Price Performance
• Sugar futures declined marginally 0.5% despite lower monthly quota owing to
reports of 15% rise in Sugar output during the first four months of the year 2011-
12. Liffe sugar futures gained sharply ahead of march expiry, however, price
declined after the expiry on comfortable supplies.
Lower monthly quota released for the month of March 2012
• Government released 15.6 lakh tn quota for the month of march compared 16.12lakh tn released in February. 15.6 lk tn includes 2.1 lakh tonnes of Levy quota.
India s sugar Output up 15% to 18.65 mn tons till February 2012
• Sugar output during Oct 01 till Feb 2012 is up 15% at 18.6 mn tn on higher cane
area and recovery. Maharashtra produced 6.49 million tons for the year till date
followed by UP (5.27 mn tn) Karnataka and Tamil Nadu at 2.87 mn tn and 8.20
-.
season, followed by UP at 6.8 mn tn and Karnataka at 3.8 mn tn.
Buying from bulk manufactures to improve ahead of summer season
• Demand from the bulk ice cream and cold drink manufactures increase as they
star accumulating the stocks ahead to fulfill summer season demand.
Global Sugar surplus to shrink 43% in 2011-12- Kingsman
• In Quarterly Market Outlook, the International Sugar Organization has increased
its forecast for the global surplus in 2011/12 to 5.17 million tn , compared with its
projection of 4.46 mn tn made in November 2012.
Outlook
• Given the lower quota for March and expected surge in demand during April and
May amidst summer season demand, sugar prices may recover gradually in the
coming weeks
Strategy
• Buy NCDEX March Sugar between 2830-2840, SL-2795, target 2900/2930.
www.angelcommodities.com

7/28/2019 Commodities Weekly Tracker 5th March 2012
http://slidepdf.com/reader/full/commodities-weekly-tracker-5th-march-2012 19/20
Potato
Commodities Weekly TrackerMonday | March 05 2012
Weekly Price Performance
• Potato prices at NCDEX settled 10.4% higher on reports of 10-15% decline in
production owing to lower yield amidst reports of late blight disease to the crop.
Output may be revised lower than the previous estimates of 43 mn tn
• According to National Horticultural Research and Development Foundation
(NHRDF), Potato output in the season 2011-12, is estimated higher at 43.6 mn tn
compared to 40 mn tn last year.• However, there are reports of late blight disease which may hamper output to
the extent of 10-15% and thus revised output may be around 36 mn tn. However,
even if output is lower by 10-15% it is compare to last year’s bumper output of 40
mn tn. Thus revised 36 mn tn output is sufficient to cater the domestic
consumption demand.
• Even though India witnessed bumper potato output in 2010-11 season at 40 mn
tn , more than 20% was just thrown away .
The potatoes will be stored during March and April in cold storages
• Demand from the cold storages is on full swing and have already started stocking
the same. Buying by the cold storages would continue till Mid April.
Outlook
• Potato prices have already factored in the impact of 10-15% drop in output and
thus we expect prices to consolidate or may even start declining by the later part
of the week. This is because although output is revised lower it is much higher
compared to the consumption demand of around 28-30 mn tn.
Strategy
• Buy NCDEX/MCX March Potato between 850-860, SL-795, target 950/1000.
www.angelcommodities.com

7/28/2019 Commodities Weekly Tracker 5th March 2012
http://slidepdf.com/reader/full/commodities-weekly-tracker-5th-march-2012 20/20
Thank You!
Commodities Weekly TrackerMonday | March 05 2012
Angel Commodities Broking Pvt. Ltd.
Registered Office: G-1, Ackruti Trade Centre, Rd. No. 7, MIDC, Andheri (E), Mumbai - 400 093.
Corporate Office: 6th Floor, Ackruti Star, MIDC, Andheri (E), Mumbai - 400 093. Tel: (022) 2921 2000
MCX Member ID: 12685 / FMC Regn No: MCX / TCM / CORP / 0037 NCDEX : Member ID 00220 / FMC Regn No: NCDEX / TCM / CORP / 0302
Disclaimer: The information and opinions contained in the document have been compiled from sources believed to be reliable. The company does not warrant its accuracy, completeness and correctness.
The document is not, and should not be construed as an offer to sell or solicitation to buy any commodities. This document may not be reproduced, distributed or published, in whole or in part, by any
recipient hereof for any purpose without prior permission from “Angel Commodities Broking (P) Ltd”. Your feedback is appreciated on [email protected]
www.angelcommodities.com
