Commodities at a Glance: Special issue on strategic ...
74
UNITED NATIONS CONFERENCE ON TRADE AND DEVELOPMENT No. 13 COMMODITIES AT A GLANCE Special issue on strategic battery raw materials
Transcript of Commodities at a Glance: Special issue on strategic ...

U N I T E D N AT I O N S C O N F E R E N C E O N T R A D E A N D D E V E L O P M E N T
No. 13
COMMODITIES AT A GLANCESpecial issue on strategic battery raw materials
Layout and Printing at United Nations, Geneva – 1922587 (E) – February 2020 – 430 – UNCTAD/DITC/COM/2019/5

Geneva, 2020
U N I T E D N AT I O N S C O N F E R E N C E O N T R A D E A N D D E V E L O P M E N T
No. 13
COMMODITIES AT A GLANCESpecial issue on strategic battery raw materials
© 2020, United Nations
This work is available open access by complying with the Creative Commons licence created for intergovernmental organizations, available at http://creativecommons.org/licenses/by/3.0/igo/.
The findings, interpretations and conclusions expressed herein are those of the authors and do not necessarily reflect the views of the United Nations or its officials or Member States.
The designation employed and the presentation of material on any map in this work do not imply the expression of any opinion whatsoever on the part of the United Nations concerning the legal status of any country, territory, city or area or of its authorities, or concerning the delimitation of its frontiers or boundaries.
Photocopies and reproductions of excerpts are allowed with proper credits.
This publication has not been formally edited.
United Nations publication issued by the United Nations Conference on Trade and Development.
UNCTAD/DITC/COM/2019/5
eISSN: 2522-7866
eISBN 978-92-1-004829-3

iii
ACKNOWLEDGMENTS
The series Commodities at a Glance aims to collect, present and disseminate accurate and relevant statistical information linked to international primary commodity markets in a clear, concise and reader-friendly format.
This edition of Commodities at a Glance was prepared by Rachid Amui, Economic Affairs Officer at the Commodities Branch, Division on International Trade and Commodities, UNCTAD, under the overall guidance of Janvier Nkurunziza, Chief, Commodity Research and Analysis Section, Commodities Branch.
The cover of this publication was created by Magali Studer, UNCTAD. Photo credit © Adobe Photo Stock.
CONTACTS
For further information about this publication, please contact the Division on International Trade and Commodities, Commodities Branch, UNCTAD, Palais des Nations, CH-1211 Geneva 10, Switzerland, email: [email protected], tel. +4122 917 6286/1648
NOTE
Reference to “dollars”, or use of the dollar symbol ($), signifies United States dollars, unless otherwise specified.
The term “tons” refers to metric tons.
Unless otherwise stated, all prices in this report are in nominal terms.
Data sources are indicated under each table and figure.

iv COMMODITIES AT A GLANCE - Special issue on strategic battery raw materials
ACRONYMS AND ABBREVIATIONS
BC before Christ
C carbon
CAGR Compound Annual Growth Rate
CE circular economy
CH4 methane
Co cobalt
CO2 carbon dioxide
CTL coal-to liquid
GHG greenhouse gas
GTL gas-to liquid
EV electric vehicle
IEA International Energy Agency
IPCC Intergovernmental Panel on Climate Change
LCE lithium carbonate equivalent
LCO lithium cobalt oxide
LED light-emitting diode
LFP lithium Iron Phosphate
Li lithium
LiAlSI4O10 Lithium silicate (petalite)
LIB lithium-ion battery
LiBF4 lithium tetrafluoroborate
LiClO4 lithium perchlorate
Li-ion Lithium-ion
LiPF6 lithium hexafluorophosphate
LMO Lithium Manganese Oxide
m million
Mn manganese
N2O nitrous oxide
NCA Lithium Nickel Cobalt Aluminum Oxide
NiCd Nickel-Cadmium
NiMH Nickel-Metal Hydride
NMC Lithium Nickel Manganese Cobalt
UNEP United Nations Environmental Programme
UNFCC United Nations Framework Convention on Climate Change
USGS United States Geological Survey

v
CONTENTS
Acronyms and Abbreviations ....................................................................................... iv
Introduction .............................................................................................................. viii
CHAPTER 1 RECHARGEABLE BATTERIES ................................................................ 1
1.1. Rechargeable batteries and climate change ................................................................ 2
1.2. Types of rechargeable batteries and performance ..................................................... 2
1.3. Battery components and battery chemistries .............................................................. 2
CHAPTER 2 OVERVIEW OF LITHIUM ION BATTERY RAW MATERIALS ........................ 5
2.1. Historical Background ................................................................................................... 6
Cobalt .............................................................................................................................. 6
Lithium ............................................................................................................................. 8
Natural graphite ............................................................................................................... 10
Manganese ...................................................................................................................... 11
CHAPTER 3 THE VALUE CHAIN .............................................................................. 15
3.1. The mining value chain .................................................................................................. 16
Cobalt value chain ........................................................................................................... 16
Lithium value chain .......................................................................................................... 19
Graphite value chain ........................................................................................................ 19
Manganese value chain.................................................................................................... 20
3.2. Recycling of raw materials used in lithium ion batteries ............................................. 20
3.3. Advantages and disadvantages of recycling ............................................................... 21
3.4. The Lithium ion battery manufacturing chain ............................................................... 21
3.5. Economic implications of the lithium ion battery value chains ................................... 22
CHAPTER 4 SUPPLY, DEMAND AND PRICES .......................................................... 25
4.1. Production of raw materials used in lithium ion batteries ........................................... 26
4.2. Drivers of production ..................................................................................................... 31
4.3. Demand for raw materials used in lithium ion batteries .............................................. 31
4.4. International trade ......................................................................................................... 32
International trade in cobalt .............................................................................................. 32
International trade in lithium ............................................................................................. 35
International trade in natural graphite ............................................................................... 39
International trade in manganese ..................................................................................... 40
4.5. Price evolution of raw materials used in lithium ion batteries ..................................... 41
CHAPTER 5 SOCIAL AND ENVIRONMENTAL CHALLENGES ...................................... 45
5.1. Challenges related to exploitation of battery metals and minerals ............................. 46
CONCLUSION ........................................................................................................ 47
Annex - Statistical data: Exports, Imports, Production, Reserves .................................... 49
Contents

vi COMMODITIES AT A GLANCE - Special issue on strategic battery raw materials
FIGURES
Figure 1. Schematic of a lithium ion battery ........................................................................................... 4
Figure 2. Cobalt reserves, 2018 (Percentage) ........................................................................................ 7
Figure 3. Lithium reserves, 2018 (Percentage) ....................................................................................... 9
Figure 4. Graphite reserves, 2018 (Percentage) ..................................................................................... 11
Figure 5. Manganese reserves, 2018 (Percentage) ................................................................................ 12
Figure 6. Refined cobalt - chemicals, 2017 (Tons) ................................................................................. 17
Figure 7. Refined cobalt - powder, 2017 (Tons) ..................................................................................... 18
Figure 8. Refined cobalt - metal, 2017 (Tons) ....................................................................................... 18
Figure 9. Cobalt production, 2010 to 2018* (Tons) ............................................................................... 26
Figure 10. Cobalt production, 2018* (Percentage) ................................................................................... 27
Figure 11. Lithium production, 2010 to 2018* (Tons) ............................................................................... 27
Figure 12. Lithium production, 2018* (Percentage) .................................................................................. 28
Figure 13. Global manganese production, 2010 to 2018* (Tons) ............................................................. 29
Figure 14. Manganese production, 2018* (Percentage) ........................................................................... 29
Figure 15. Natural graphite production, 2010 to 2018* (Tons) .................................................................. 30
Figure 16. Natural graphite production, 2018* (Percentage) .................................................................... 30
Figure 17. Top 5 importers of cobalt ores and concentrates, 2018 (Percentage) ..................................... 33
Figure 18. Top 5 exporters of cobalt ores and concentrates, 2018* (Percentage) .................................... 33
Figure 19. Top 5 importers of cobalt oxides and hydroxides, 2018 (Percentage) ..................................... 34
Figure 20. Top 5 exporters of cobalt oxides and hydroxides, 2018 (Percentage) ..................................... 35
Figure 21. Top 5 importers of lithium oxides and hydroxides, 2018 (Percentage) ..................................... 36
Figure 22. Top 5 exporters of lithium oxide and hydroxide, 2018 (Percentage)......................................... 37
Figure 23. Top 5 importers of lithium carbonate, 2018 (Percentage) ........................................................ 37
Figure 24. Top 5 exporters of lithium carbonate, 2018 (Percentage) ........................................................ 38
Figure 25. Top 5 importers of Natural Graphite in powder or flakes, 2018 (Percentage) ........................... 39
Figure 26. Top 5 exporters of Natural Graphite, 2018 (Percentage) ......................................................... 40
Figure 27. Top 5 importers of manganese ores and concentrates, 2018 (Percentage) ............................. 41
Figure 28. Top 5 exporters of manganese ores and concentrates, 2018 (Percentage) ............................. 42
Figure 29. Battery raw materials prices, 2010 to 2019 (Dollars) ............................................................... 43

viiContents
TABLES
Table 1. Types of lithium-ion battery chemistries .................................................................................... 3
Table 2. Components of a lithium ion battery, functions and materials ................................................... 4
Table 3. Summary of main cobalt deposit types ..................................................................................... 7
Table 4. Major trading partners of leading importers of cobalt ores and concentrates, 2018 (Millions of dollars) .................................................................................................................... 33
Table 5. Major trading partners of leading exporters of cobalt ores and concentrates, 2018 (Millions of dollars) .................................................................................................................... 34
Table 6. Major trading partners of leading importers of cobalt oxides and hydroxides, 2018 (Millions of dollars) .................................................................................................................... 34
Table 7. Major trading partners of leading exporters of cobalt oxides and hydroxides, 2018 (Millions of dollars) .................................................................................................................... 35
Table 8. Major trading partners of leading importers of lithium oxides and hydroxides, 2018 (Millions of dollars) .................................................................................................................... 36
Table 9. Major trading partners of leading exporters of lithium oxides and hydroxides, 2018 (Millions of dollars) .................................................................................................................... 37
Table 10. Major trading partners of leading importers of lithium carbonate, 2018 (Millions of dollars) ........ 38
Table 11. Major trading partners of leading exporters of lithium carbonate, 2018 (Millions of dollars) ........ 38
Table 12. Major trading partners of leading importers of natural graphite, 2018 (Millions of dollars)........... 39
Table 13. Major trading partners of leading exporters of natural graphite, 2018 (Millions of dollars) ........... 40
Table 14. Major trading partners of leading importers of manganese ores and concentrates, 2018 (Millions of dollars) .................................................................................................................... 41
Table 15. Major trading partners of leading exporters of manganese ores and concentrates, 2018 (Millions of dollars) .................................................................................................................... 42
Table 16. Leading importers of cobalt ores and concentrates by value (Dollars) ....................................... 49
Table 17. Leading exporters of cobalt ores and concentrates by value (Dollars) ....................................... 50
Table 18. Leading exporters of lithium oxide and Hydroxide by value (Dollars) .......................................... 51
Table 19. Leading importers of lithium oxide and Hydroxide by value (Dollars) .......................................... 52
Table 20. Leading Importers of Natural Graphite by value (Dollars) ........................................................... 53
Table 21. Leading Exporters of Natural Graphite by value (Dollars) ........................................................... 54
Table 22. Leading importers of manganese ores and concentrates by value (Dollars) ............................... 55
Table 23. Leading exporters of manganese ores and concentrates by value (Dollars) ............................... 56
Table 24. World cobalt reserves (Tons) ..................................................................................................... 57
Table 25. Lithium reserves (Tons of Lithium content) ................................................................................ 57
Table 26. Graphite reserves (Tons) ........................................................................................................... 58
Table 27. Manganese reserves (Thousands of tons) ................................................................................. 58
Table 28. World Lithium mine production (Tons of Lithium content) .......................................................... 59
Table 29. World Manganese mine production (Thousands of tons) ........................................................... 59
Table 30. World Cobalt mine production (Tons) ........................................................................................ 60
Table 31. World Graphite mine production (Tons) ..................................................................................... 61

viii COMMODITIES AT A GLANCE - Special issue on strategic battery raw materials
INTRODUCTION
Anthropogenic greenhouse gas (GHG) emissions since the industrial revolution have driven large increases in the atmospheric concentrations of carbon dioxide (CO²), methane (CH4) and nitrous oxide (N2O). According to scientists, these gases along with other sources of GHG emissions, are extremely likely to have been the dominant cause of the observed warming of the climate system since the mid-19th century.1 In response to the rising temperature, parties to the United Nations Framework Convention on Climate Change (UNFCCC) reached a landmark agreement in 2015 (The Paris Agreement) to combat climate change and to accelerate and intensify the actions and investments needed for a sustainable low carbon future. Some estimates show that failure to stabilize or reduce global emissions of CO² and other greenhouse gases will lead to economic losses amounting to at least US$2 billion per day by 2030.2 Moreover extreme weather events and patterns associated with the warming climate system are likely to impact the achievement of the Sustainable Development Goals, particularly Goal 13 –“Take urgent action to combat climate change and its impacts.”
Fossil fuel use is the primary source of anthropogenic GHG emissions. The Intergovernmental Panel on Climate Change (IPCC) estimated that CO² emissions from fossil fuel combustion and industrial processes contributed about 65 per cent to total GHG emissions in 2010.3 Therefore, attempts to reduce fossil fuel-based energy emissions and mitigate effects on the climate will require, inter alia, transformation of energy consumption by drastically reducing fossil-based energies to greener sources of energy. A transition to decarbonization of energy consumption is already underway with the introduction of renewable energy systems such as photovoltaic and wind turbine systems and more recently rechargeable energy storage batteries that are used to produce energy for household use and to power electric vehicles.
Some of the raw materials used in these renewable energy systems as well as in key industry sectors
1 https://www.ipcc.ch/site/assets/uploads/2018/02/AR5_SYR_FINAL_SPM.pdf
2 https://www.nationalgeographic.com/science/2019/11/nations-miss-paris-targets-climate-driven-weather-events-cost-billions/
3 https://unctad.org/en/PublicationsLibrary/ditccom2019d3_en.pdf
such as aerospace, defense, health, automotive and consumer electronics currently have few substitutes and are not widely globally distributed. They are defined as strategic and critical raw materials because they serve an essential function in the manufacturing of a product, the absence of which would have substantial consequences for a country’s economy or national security.4 Since there are few or no substitutes to these raw materials, strict measures are employed to control their conservation and distribution. The term strategic and critical raw materials is relative to their importance for major importing countries because what is critical to one country may not be critical for another. Moreover, the list of these raw materials is not static. It evolves depending on technology advances, changes occurring in their global supply and demand, concentration of production, as well as current policy priorities.
A broad array of minerals and metals are classified as strategic and critical. These raw materials are making a contribution towards reducing greenhouse gas emissions and achieving a low carbon future. For example, rare earth metals such as the Platinum Group of Metals are mostly mined in a few countries (South Africa and Russia) and there are few or no good substitutes to them. Thus supply disruption could constrain the production of critical components in the catalytic converters found in most vehicles that reduce harmful emissions or disrupt key industrial processes that use these metals as catalysts in petroleum refining; high-temperature processing of abrasive materials such as glass; disc drives and electronic components; medical and dental implants and devices; and electrochemistry.5 Similarly, metals such as cobalt, lithium, manganese, copper, and minerals like graphite play a significant role in energy-related technologies such as rechargeable batteries that are used in a variety of applications ranging from electronics to electric vehicles as well as in renewable energies such as nuclear, wind, and solar power.
The market for rechargeable batteries, particularly for lithium-ion batteries (LIBs), is growing rapidly owing to its cost and efficiency advantages over other rechargeable battery types. It has been largely driven by environmental concerns, a growing market
4 https://pubs.usgs.gov/of/2018/1021/ofr20181021.pdf5 http://www.thintri.com/platinum-group-metals-report-2018.htm

ixIntroduction
for electric vehicles and support from governments. Rechargeable batteries open opportunities to boost supplies for the raw materials used in manufacturing them lithium, nickel, manganese, cobalt and natural graphite, but they also present challenges in ensuring that the raw materials are sustainably sourced given that their exploitation is often associated with undesirable environmental footprints, poor human rights and worker protection. It also raises questions on whether there is enough supply of these raw materials to meet rising demand given that available quantities are low for some of the raw materials, they are not widely geographically distributed in high concentrations and they have low substitutability.
The aim of this report is to provide information on the critical raw materials used in LIBs with respect to production, consumption, trade and prices. The report also analyses the influence of supply and demand of these battery raw materials on market prices in view of the growing role of LIBs in energy storage and electric vehicles. Furthermore, the study examines the varying stages of transformation from ores/brines into value added products and their
implications for producing countries. The scope of the report will be limited to a few battery raw materials that are considered as strategic and critical: Cobalt (Co), lithium (Li), manganese (Mn) and natural graphite (C), given that these materials are essential to the production of rechargeable batteries, which are expected to have a high market growth and will play an important role in mitigating GHG emissions from the use of fossil fuels.
The report is divided into six chapters. The first chapter discusses the different types of rechargeable batteries, their performance and chemistries. The second chapter presents an overview of the selected battery raw materials considered in this report. The third chapter discusses the upstream and downstream value chains of the LIB. The fourth chapter discusses supply, demand with respect to production and consumption, and price evolution of the selected raw materials used in LIBs. The fifth chapter discusses the social and environment effects related to exploitation of the selected battery raw materials discussed in this report. The final chapter draws some policy implications from the report.

CHAPTER 1
RECHARGEABLE BATTERIES
CHAPTER 1
RECHARGEABLE BATTERIES

2 COMMODITIES AT A GLANCE - Special issue on strategic battery raw materials
1.1. RECHARGEABLE BATTERIES AND CLIMATE CHANGE
Rechargeable batteries are energy storage devices that allow for recharging after the store charge has been drained – i.e. the chemical reactions that produce the charge can be reversed to store a new charge.6 They offer a reliable source of electricity which can be used when renewable sources of power such as wind and solar are not available due to their variable nature. Rechargeable battery technology is also very important for the transport sector because it can contribute to reducing GHGs that are emitted from burning fossil fuels in internal combustion engines. In 2010, the transport sector accounted for 14 per cent of global greenhouse gas emissions7 and is expected to almost double by 2050 due to increasing transport demand per capita in developing and emerging economies.8 Scientists warn that without mitigating these transport emissions, the increasing concentrations of GHGs in the atmosphere will have a profound effect on the climate. In this regard, rechargeable batteries are likely to make a significant contribution to mitigating transport emissions.
1.2. TYPES OF RECHARGEABLE BATTERIES AND PERFORMANCE
There are different types of rechargeable batteries available on the market for different purposes (eg. lead acid, Lithium-ion (Li-ion), Nickel-Metal Hydride (NiMH), Nickel-Cadmium (NiCd) batteries), but Lithium ion batteries are the most commonly used because they have the highest technical performance (i.e. the highest energy and power density).9 LIBs are lighter and smaller than other rechargeable batteries10 allowing them to be most suitable for use in the fast-growing market of electric vehicles (EVs). In addition, the LIB offers a higher number of charge and
6 https://courses.lumenlearning.com/introchem/chapter/other-rechargeable-batteries/
7 https://www.epa.gov/ghgemissions/global-greenhouse-gas-emissions-data
8 https://www.ipcc.ch/site/assets/uploads/2018/02/ipcc_wg3_ar5_chapter8.pdf
9 Energy density is the amount of energy the battery can store per unit mass; A device with a higher energy density can supply an electronic load for longer than one with a low energy density and the same mass/volume. Power density is the amount of power that can be generated by the battery with respect to its mass. See https://www.energy.gov/eere/articles/how-does-lithium-ion-battery-work
10 Lowe M., Tokuoka S., Trigg T., Gereffi G. (2010). Lithium-ion batteries for electric vehicles: the U.S. value chain, Technical report, DOI: 10.13140/RG.2.1.1421.0324
discharge cycles in the battery’s life than the NiCd and Ni-MH batteries. By contrast, lead acid batteries have superior cycles but they are less efficient compared to LIBs.11 Lithium ion batteries also have the potential for further improvement in costs and performance with respect to battery chemistry, energy storage capacity, manufacturing scale and charging speeds, suggesting that they are likely to remain dominant in EVs into the next decade (IEA, 2018).12
1.3. BATTERY COMPONENTS AND BATTERY CHEMISTRIES
There are four principal components of a lithium-ion battery: cathode and anode active materials, electrolytes, and separators. Each plays a different role to generate repeated energy outputs. Their functions are detailed as follows:
The cathode is the positive electrode of a rechargeable battery. It plays an essential role in providing the chemical reactions that generate the electric current. Within the lithium ion battery technology, various cathode chemistries exist at commercial level such as Lithium Cobalt Oxide (LCO), Lithium Manganese Oxide (LMO), Lithium Iron Phosphate (LFP), Lithium Nickel Manganese Cobalt (or NMC) and Lithium Nickel Cobalt Aluminum Oxide (or NCA) (see table 1).13 Owing to the high cost and limited availability of the principal materials used in LIBs such as cobalt, research is ongoing for different cathode chemistries that have less reliance on the critical materials currently used in manufacturing cathodes. Furthermore, improvement has been made to the materials currently used in cathodes which has led to increased battery life through some combination of NMC. The improvements to cathode combinations enable lithium ions to be stored more efficiently and facilitates movement of ions through the cathode to the anode easier than other materials.14 The NMC takes different forms based on the amount of the three elements’ atoms: (eg. NMC 111, NMC532/622, NMC 811).15 The NMC chemistries is favoured by battery makers because of its high performance and relatively
11 https://news.energysage.com/lithium-ion-vs-lead-acid-batteries/
12 IEA (2018), Global EV outlook 2018 – Towards cross-modal electrification.
13 Azevedo M., Campagnol N., Hagenbruch T., Lala A., Ramsbottom O. (2018). Lithium and Cobalt – A tale of two commodities, McKinsey & Company.
14 https://qz.com/1360234/a-silicon-valley-startup-is-giving-lithium-ion-batteries-a-much-needed-silicon-boost/
15 The NMC 811 combination is a cathode composition with 80 per cent nickel, 10 per cent manganese and 10 per cent cobalt.

CHAPTER I - Rechargeable batteries 3
low cost. In 2018, NMC batteries accounted for nearly 28 per cent of global EV sales and the market share is expected to grow to 63 per cent by 2027.17
The anode’s role is to store and release lithium ions to the cathode thus allowing current to pass through an electrical circuit. The common anode material used is graphite, either synthetically produced (artificial graphite) or mined from the earth’s crust (natural graphite). The extracted graphite is heavily processed to serve as anodes. Both types of graphite are used for Li-ion anode material with 55 per cent gravitating towards synthetic and the balance to natural graphite.18 Synthetic graphite is preferred to natural graphite because of its superior consistency but this is changing because modern chemical purification processes and thermal treatment have made it possible to achieve a purity of 99.9 per cent from natural graphite compared to 99.0 per cent for the synthetic equivalent.19 Purified natural graphite has a higher crystalline structure and offers better electrical and thermal conductivity than the synthetic material. Switching to unprocessed natural graphite, which is a much cheaper graphite, not only lowers production cost with same or better Li-ion performance but is also more environmentally friendly than the synthetic type.20
The electrolyte is a core component of the lithium ion battery. It provides a suitable medium for the conduction of ions (flow of lithium ions between the cathode and anode), adequate thermal and chemical stability and compatibility with electrode materials.21
16 https://publications.jrc.ec.europa.eu/repository/bitstream/JRC112285/jrc112285_cobalt.pdf
17 https://www.mining.com/nmc-batteries-dominating-ev-sales-reach-63-global-market/
18 https://batteryuniversity.com/learn/article/bu_309_graphite19 Ibid20 Ibid21 Mosa J., Vélez J.F., Aparicio M. (2019). Blend hybrid solid
electrolytes based on LiTFSI doped silica-polyethylene oxide for lithium-ion batteries.
The most commonly used electrolyte is lithium salts such as a combination of lithium hexafluorophosphate (LiPF6), lithium tetrafluoroborate (LiBF4) or lithium Perchlorate (LiCIO4) in an organic solvent such as ether.22 Solid electrolytes have been investigated but challenges such as low conductivity have limited their commercial viability.
The separators are permeable membranes that provide a barrier between the anode and cathode while enabling the exchange of lithium ions from one side to the other. Table 2 presents a summary of components and materials used in the manufacture of the Lithium ion battery and their functions.
All lithium ion batteries comprise of the four main components discussed and they work broadly in the same way. When the battery is discharging, lithium ions tied to electrons within the structure of the anode are released. These lithium ions travel through the electrolyte to be absorbed in the cathode and the free electrons created at the anode flow through an external wire to provide the electric current used to do work.23 This process is reversed during the charging phase. An external electric charge applied to the LIB initiates an oxidation reaction at the cathode that pushes lithium ions through the electrolyte back into the anode. Negatively charged electrons are also released from the cathode to tie up the lithium ions absorbed by the anode.24 Figure 1 presents a schematic view of the LIB. The four principal elements (Cobalt, lithium, manganese and natural graphite) used in the manufacturing of compounds for anodes, cathodes and electrolytes in an NMC battery are discussed in the next section.
22 Lowe M., Tokuoka S., Trigg T., Gereffi G. (2010). Lithium-ion batteries for electric vehicles: the U.S. value chain, Technical report, DOI: 10.13140/RG.2.1.1421.0324
23 https://www.science.org.au/curious/technology-future/lithium-ion-batteries
24 Ibid
Name Abbreviation Chemical Formula Cobalt content Properties and applications
Lithium Cobalt Oxide LCO LiCoO2 60% High capacity. Mobile phones, tablets, laptops, cameras
Lithium Manganese Oxide LMO LiMn2O4 0 Safest; lower capacity than LCO but high specific power and long life. Power tools, e-bikes, EVs, medical devicesLithium Iron Phosphate LFP LiFePO4 0
Lithium Nickel Manganese Cobalt Oxide NMC LiNiMnCoO2 10 – 30%
Lithium Nickel Cobalt Aluminium Oxide NCA LiNiCoAlO2 10 – 15% High capacity; gaining importance in electric power train and grid storage; industrial applications, medical devices
Table 1. Types of lithium-ion battery chemistries
Source: Dias et al (2018)16

4 COMMODITIES AT A GLANCE - Special issue on strategic battery raw materials
Components Functions Materials
Cathode Emit lithium-ion to anode during chargingReceive lithium-ion during discharging
Lithium metal oxide powder
Anode Receive lithium-ion from anode during chargingEmit lithium-ion during discharging
Graphite powder
Electrolyte Pass lithium-ions between cathode and anode Lithium salts and organic solvents
Separator Prevent short circuit between cathode and anodePass lithium ions through pores in separator
Micro-porous membranes
Table 2. Components of a lithium ion battery, functions and materials
Source: Lowe et al (2010) 25
Source: Huang P. et al (2015)26
25 Lowe M., Tokuoka S., Trigg T., Gereffi G. (2010). Lithium-ion batteries for electric vehicles: the U.S. value chain, Technical report, DOI: 10.13140/RG.2.1.1421.0324
26 Huang P., Wang Q., Ping P., Sun J. (2015). The combustion behavior of large-scale lithium titanate battery.
Figure 1. Schematic of a lithium ion battery
e-
e-
Charge
DischargeSeparator
Li+
Li+Li+
Li+
Li+
Li+
Li+
Li+
Li+
Li+
Li+
Li+
Li+
Electrolyte
AnodeCathode
CHAPTER 2
OVERVIEW OF LITHIUM ION BATTERY RAW MATERIALS

CHAPTER 2
OVERVIEW OF LITHIUM ION BATTERY RAW MATERIALS

6 COMMODITIES AT A GLANCE - Special issue on strategic battery raw materials
2.1. HISTORICAL BACKGROUND
The principal materials used in LIBs are cobalt, lithium, manganese and graphite (allotrope of carbon). These chemical elements are among 118 known chemical elements, metals and minerals, listed in the periodic table. They were discovered either independently or by two or more scientists working independently of each other at different periods in history. A synopsis of the principal materials used in LIBs with respect to their origins, properties, formation, reserves and geographical distribution, and uses is presented in this section.
Cobalt
Cobalt was first used in the production of pigments in Egypt during the late Bronze age around the 16th century BC. Between 770 - 475 BC, it was used in China as a colouring agent in glazed beads, then later in low-firing glazes on Tang sancai and blue glazed earthenware’s. There are many instances of cobalt used as a pigment in ceramic technology during the Han and Yuan dynasties. (Giannini et al, 2017). The distinctive blue hue to porcelain represents one of the most successful and influential developments in the history of ceramic technology.27 In the form of metal, Cobalt was first isolated in 1735 by Swedish chemist G Brandt but its metallic uses became more common towards the end of the century when fellow Swedish scientist confirmed Brandt’s findings, and in the 1930s due to studies and patents by Elwood Haynes (Boland and Kropshot, 2011).28
Cobalt is the 27th element of the periodic table with an atomic mass of 58.9332 grammes per molecule. It is a brittle silvery grey coloured metal with a high melting point that is valued for its wear resistance and ability to retain its strength at high temperatures. It also has naturally occurring magnetic metals that maintain its permanent magnetic properties at temperatures up to 2012 Fahrenheit (1100 degrees Celsius).29 Iron and nickel are the only naturally occurring metals that exhibit similar properties.
27 http://discovery.ucl.ac.uk/1540125/1/Freestone_European %20cobalt%20sources.pdf
28 Giannini R., Freestone I.C. and Shortland A.J. (2017). European cobalt sources identified in the production of Chinese famille rose porcelain, Journal of Archaeological Science, Volume 80, pp 27-36.
29 https://www.thebalance.com/metal-profile-cobalt-2340131
Cobalt also has valuable catalytic properties30 so it finds use in several industrial applications. Cobalt, iron and nickel are described as transition elements because of their remarkable ability to combine with several other atoms and molecules at the same time to form coordination compounds. Cobalt’s electrons can participate in the formation of chemical bonds in two shells instead of one allowing it to form several different oxidation states.31
Cobalt occurs in the earth crust or sometimes relatively near the surface, mostly in combination with nickel and/or copper. There are several principal cobalt bearing minerals but the most common cobalt minerals are cobaltite (cobalt sulfoarsenide mineral), linnaeite (sulfide mineral), skutterudite (series of cobalt and nickel mineral), and smaltite (cobalt, nickel arsenide).32 Large quantities of cobalt also occur on the sea floor, contained within manganese nodules and cobalt-rich crusts, although they are not economically viable with current technology and economic conditions.33 See Table 3.
The world terrestrial cobalt resources34 are estimated to be about 25 million tons. Most of these resources are in sediment-hosted stratiform copper deposits in the Democratic Republic of the Congo and Zambia (Africa’s copper belt); nickel-bearing laterite deposits in Australia and nearby island countries and Cuba; and magmatic nickel-copper sulfide deposits hosted in mafic and ultramafic rocks in Australia, Canada, Russia, and the United States.35 In 2018, the world total reserves were estimated at 6.9 million tons (United States Geological Survey (USGS, 2019)
30 Ibid31 https://www.britannica.com/science/transition-element32 https://periodic-table.com/cobalt/33 https://www.cobaltinstitute.org/ores-containing-cobalt.html34 The terms resources and reserves have different meanings.
Resources are a concentration of naturally occurring solid, liquid, or gaseous material in or on the Earth’s crust in such form and amount that economic extraction of a commodity from the concentration is currently or potentially feasible. Resources are sometimes classified as ‘identified resources’. This refers to resources whose location, grade, quality, and quantity are known or estimated from specific geologic evidence. Identified resources include economic, marginally economic, and sub economic components. Reserves refer to that part of an identified resource, which could be economically extracted or produced at the time of determination. USGS (2019), Mineral commodity summaries
35 https://www.cia.gov/library/publications/the-world-factbook/appendix/print_appendixh.html

CHAPTER II - Overview of LIB raw materials 7
Deposit type Genetic process of formation Typical economic grades Major examples
Sediment hosted Diagenetic processes in near-shore or saline lagoon environment convert sea water sulphates to sulphides and concentrate metallic elements sourced from sediments.
0.1-0.4 per cent Tenke Fungurume, Democratic Republic of the Congo; Mt Isa, Australia
Hydrothermal and volcanogenic
Precipitation of minerals from hydrothermal fluids passing through the host rock.
0.1 per cent Bou Azzer, Morroco; Keretti, Finland
Magmatic Sulphide An immiscible liquid sulphide phase is concentrated in magmas. This phase preferentially collects and concentrates metallic elements such as cobalt.
0.1 per cent Norilsk, Russia; Sudbury, Ontario, Canada; Kambalda, Australia
Laterite Tropical weathering causes the breakdown of cobalt silicates and sulphides in ultramafic bodies causing cobalt to become enriched in residual weathered rocks.
0.05 – 0.15 per cent Koniambo Massif, New Caledonia
Manganese nodules and cobalt rich crusts
Ferromanganese oxide concretions on the sea floor become enriched in cobalt by extraction from sea water and pore fluids from muds
Up to 2.5 per cent None currently economic
Table 3. Summary of main cobalt deposit types
Source: The Cobalt Institute36
See Appendix 1. The Democratic Republic of the Congo has the largest reserves of cobalt in the world (3.4 million tons). Australia and Cuba have the second and third largest cobalt reserves, estimated at 1.2 million and 0.5 million tons respectively, followed by the Philippines, and Canada with approximately 0.3 million tons each. (see figure 2). More than 120 million tons of cobalt
36 Ibid
resources have been identified in manganese nodules and crusts on the floor of the Atlantic, Indian, and Pacific Oceans (USGS Statistics, 2019) at water depths of up to 6,000 meters. However, legal, technological and environmental challenges as well as the economic viability of such projects makes it difficult to exploit these resources (Slack et al, 2017).
DemocraticRepublic
of Congo 50
Australia17
Cuba7
Philippines4
Canada4
Other countries18
Source: USGS National Minerals Information Center (2018)
Figure 2. Cobalt reserves, 2018 (Percentage)

8 COMMODITIES AT A GLANCE - Special issue on strategic battery raw materials
Cobalt has diverse commercial and industrial uses as well as military applications. It is widely used in the manufacture of superalloys, which have a wide range of aviation and industrial uses because of their resistance to corrosion at very high temperatures. For example, cobalt is used to make parts for gas turbines, aircraft engines, and other components used in aircraft and space vehicles, chemical and petroleum plants, and power plants that depend on the high-temperature strength of superalloys.37 Cobalt’s magnetic properties makes it a valuable component in a range of applications that use hard magnets38 such as electric motors or soft magnets such as transformer cores. Cobalt is also the key element in several forms of clean energy production technology applications including gas-to liquid (GTL) and oil desulfurization, coal-to liquid (CTL), clean coal, solar panels, wind and gas turbines, and fuel cells (Rufe, 2010)39. about half of the world’s cobalt production is consumed in the manufacture of cathode material in the fast-growing market of rechargeable LIBs commonly used in electronic devices such as laptops, smart telephones, camcorders, toys, power tools and other technology devices, and in hybrid and electric vehicles (EVs) (Felter, 2018).40 The use of cobalt in EV batteries supports the climate change initiatives for mitigating greenhouse gases. However, due consideration must be given to minimizing GHG emissions during the extraction of battery raw materials, the electricity consumed in manufacturing the battery, and the type of electricity that is used to charge the battery.41
Lithium
The origins of lithium are traced to the discovery of the mineral petalite (LiAlSi4O10) at a mine on an island in Sweden in 1800 by a Brazilian chemist, José Bonifácio de Andrade de Silva. The presence of lithium in petalite was later detected by the Swedish chemist Johan August Arfwedson in 1817. It had similar properties to
37 https://pubs.usgs.gov/fs/2011/3081/pdf/fs2011-3081.pdf38 Hard magnets materials are difficult to magnetize, but once
magnetized are difficult to demagnetize while soft magnetic materials are easily magnetized and demagnetized. https://astarmathsandphysics.com/o-level-physics-notes/292-uses-of-hard-and-soft-magnetic-materials.html
39 Rufe P.F. (2010). Testimony for the United States Senate on Energy and Natural Resources. https://www.energy.senate.gov/public/index.cfm/files/serve?File_id=6308A3D0-E21E-442A-445C-9F0803776F80
40 Felter C. (2018), The Cobalt Boom, Council on foreign relations.
41 https://www.weforum.org/agenda/2017/11/battery-batteries-electric-cars-carbon-sustainable-power-energy/
sodium and potassium metals discovered in 1807, but its carbonate and hydroxide were less soluble in water and more alkaline. Further studies by Arfwedson on various minerals showed that lithium was contained in minerals such as spodumene and lepidolite but it could not be separated until 1821 when an English Chemist, William Brande, obtained a tiny amount by electrolysis. In 1855, German chemist Robert Bunsen and the British chemist Augustus Matthiessen obtained lithium in bulk by the electrolysis of molten lithium chloride.42
Lithium is the third element of the periodic table with an atomic number of 3 and atomic weight 6.941 grammes per molecule. It is a soft silvery metal with a low melting point and the lowest density of all metals.43 Lithium is highly reactive with water and forms strong hydroxide solutions, yielding lithium hydroxide and hydrogen gas. Lithium hydroxide is used in the production of cathode materials for lithium ion batteries.
Lithium does not occur as a metal in nature but is found in hard rock forms in crystals that are hosted in Pegmatites which form when mineral rich magma is cooled in fissures in continental plates.44 The lithium found within the pegmatite formations is in the mineral forms of spodumene, petalite, lepidolite, and amblygonite.45 Because of the high reactivity of lithium with water, it is always found bound with one or more other elements or compounds. Lithium is also formed in brine deposits as lithium chloride salts. The main type of brine deposit mined for lithium is found in interior saline drainage basins. These basins originally contained water, but high rates of evaporation that exceed precipitation leave behind concentrates of minerals containing lithium washed from rock by floods discharging into the basin. The dry saline lake beds are commonly referred to as salt pans, salt flats, salt marsh, alkali flats, playas or, most commonly, salars.46 Other types of brine deposits containing lithium include liquid brine reservoirs located beneath salt flats, which are a principal source of lithium extracted today; geothermal brines originating from volcanic
42 http://www.rsc.org/periodic-table/element/3/lithium43 http://www.rsc.org/periodic-table/element/3/lithium44 https://tsxmedia.com/2018/07/17/not-all-lithium-mining-is-
equal-hard-rock-pegmatites-vs-lithium-brine/45 https://www.sciencedirect.com/topics/materials-science/
spodumene46 Kavanagh L., Keohane J., Cabellos G.C., Llyod A. and Cleary J.
(2018). Global lithium sources – Industrial use and future on the electric vehicle industry: A review., Resources volume 7 issue 3.
CHAPTER II - Overview of LIB raw materials 9
activity, weathering of silicates, and leaching from lake sediments such as found in the Reykanes geothermal field in Iceland, the Hatchobaru and Ogoni geothermal fields in Japan and the Wairakei in New Zealand (Kavanagh et al, 2018).47 Brines produced as a waste product of some oil extraction processes may also possess economic resources of lithium. In seawater, the low concentrations of lithium, approximately 0.1 part per million (ppm), makes it difficult to extract the metal efficiently and economically (Kavanagh et al, 2018).48 Although lithium is found in many rocks and several natural brines, commercial exploitation is only possible in a few deposits with high concentration that make exploitation feasible.49
Lithium resources are mainly concentrated in Chile, Bolivia and Argentina, also known as the lithium triangle. Over 50 per cent of lithium resources are believed to be located in the lithium triangle.50 Total world resources are estimated to be about 62 million tons.51 Lithium brine deposits represent about 66 per cent of global lithium resources. Pegmatites account for approximately 26 per cent and hectorites in the
47 Ibid48 Ibid49 https://www.sciencedirect.com/topics/engineering/lithium-
deposits50 https://resourceworld.com/lithium-triangle/51 https://prd-wret.s3-us-west-2.amazonaws.com/assets/
palladium/production/atoms/files/mcs-2019-lithi.pdf
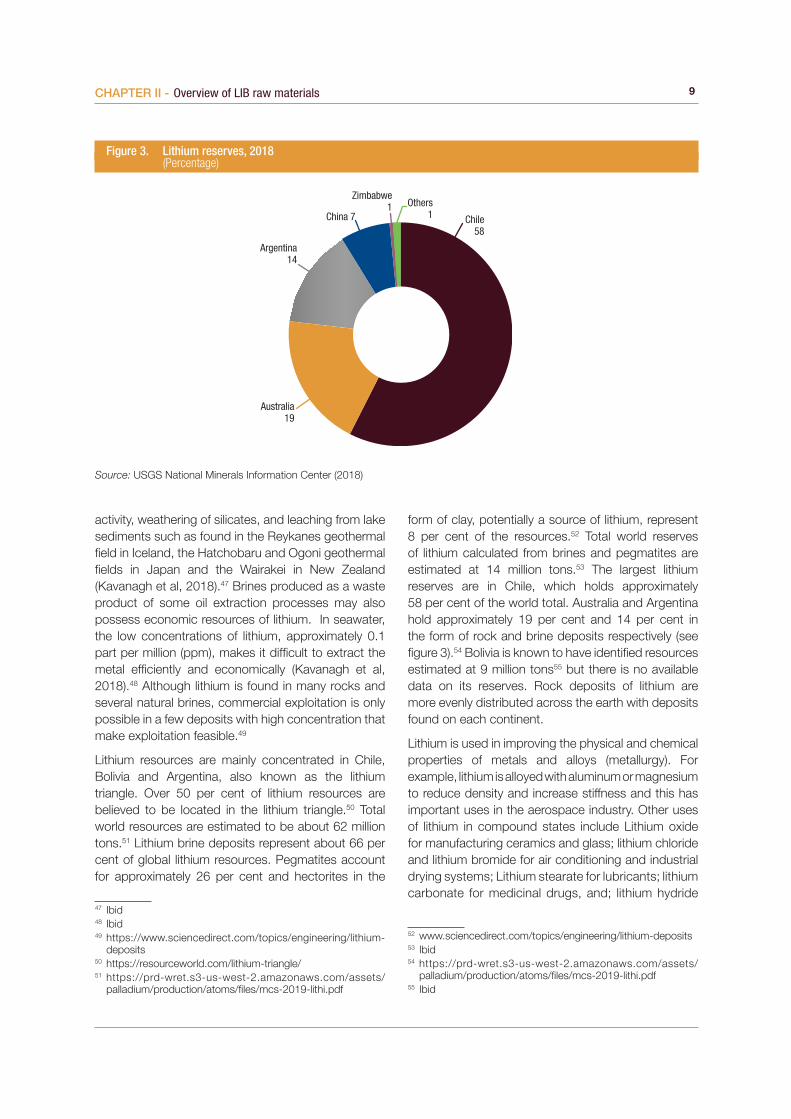
form of clay, potentially a source of lithium, represent 8 per cent of the resources.52 Total world reserves of lithium calculated from brines and pegmatites are estimated at 14 million tons.53 The largest lithium reserves are in Chile, which holds approximately 58 per cent of the world total. Australia and Argentina hold approximately 19 per cent and 14 per cent in the form of rock and brine deposits respectively (see figure 3).54 Bolivia is known to have identified resources estimated at 9 million tons55 but there is no available data on its reserves. Rock deposits of lithium are more evenly distributed across the earth with deposits found on each continent.
Lithium is used in improving the physical and chemical properties of metals and alloys (metallurgy). For example, lithium is alloyed with aluminum or magnesium to reduce density and increase stiffness and this has important uses in the aerospace industry. Other uses of lithium in compound states include Lithium oxide for manufacturing ceramics and glass; lithium chloride and lithium bromide for air conditioning and industrial drying systems; Lithium stearate for lubricants; lithium carbonate for medicinal drugs, and; lithium hydride
52 www.sciencedirect.com/topics/engineering/lithium-deposits53 Ibid54 https://prd-wret.s3-us-west-2.amazonaws.com/assets/
palladium/production/atoms/files/mcs-2019-lithi.pdf55 Ibid
Figure 3. Lithium reserves, 2018 (Percentage)
Chile58
Australia19
Argentina14
China 7
Zimbabwe1 Others
1
Source: USGS National Minerals Information Center (2018)

10 COMMODITIES AT A GLANCE - Special issue on strategic battery raw materials
as a means of storing hydrogen for use as a fuel.56 A substantial part of lithium is used in the fast-growing sector of rechargeable batteries. For example, lithium salt, such as LiPF6 in an organic solution, is used as an electrolyte57 in lithium-ion battery technology. The application of lithium in batteries ranges from small rechargeable batteries used for electronic devices such as mobile phones, laptops, cameras to high power rechargeable lithium storage batteries for electric vehicles and power storage. The important role lithium plays in the manufacture of rechargeable batteries makes the element critical in supporting the climate change initiatives for reduction of greenhouse gases, but as in other battery raw materials used in these batteries, due consideration must be given to minimizing GHG emissions during their production (see discussions on environmental impacts).58
Natural graphite
Natural Graphite was first discovered in Cumbria in North England at the beginning of the sixteenth century. It was initially used as a pigment for marking sheep, but gradually its application for writing developed. By the end of the sixteenth century, graphite was well known throughout Europe for its superior line-making qualities, its eraseability, and the ability to re-draw on top of it with ink, which is not possible with lead or charcoal.59 In 1855, English chemist Sir Benjamin Brodie proved that graphite was made of carbon. By the end of the century, Canadian miners began exploring deposits and became important graphite producers.60 In 1893, Charles Street, an engineer working for Le Carbone (now Mersen), discovered and patented a process for converting carbon to artificial graphite of high purity. In the mid-1890s, American chemist Edward Goodrich Acheson manufactured graphite by high-temperature heat treatment of carborundum61, a compound of silicon and carbide that he had discovered earlier.62
56 http://www.rsc.org/periodic-table/element/3/lithium57 The electrolyte plays a key role in transporting the positive
lithium ions between the cathode and anode.58 https://www.weforum.org/agenda/2017/11/battery-
batteries-electric-cars-carbon-sustainable-power-energy/59 http://museumofeverydaylife.org/exhibitions-collections/
current-exhibitions/visual-history-of-the-pencil60 https://www.internationalgraphite.technology/graphite/61 Carborunum is a highly effective abrasive in manufacturing,
which played an important role in advancing the industrial era.62 https://www.invent.org/inductees/edward-goodrich-acheson
Natural Graphite is a naturally occurring allotrope of Carbon63 (C) which is the sixth element of the periodic table. It is grey to black in color, soft and crystalline, opaque, and has a metallic luster.64 Graphite cleaves with very light pressure, has a very low specific gravity65 and exhibits properties of a metal and a non-metal, which make it suitable for many industrial applications. Its metallic properties include thermal and electrical conductivity and the non-metallic properties comprise of inertness, high thermal resistance, and lubricity.66 Graphite ores are classified as microcrystalline and crystalline based on the ore’s crystallinity, grain-size, and morphology.67 The unique physical and chemical properties of graphite, particularly coarse crystalline graphite, make it difficult to find suitable substitutes for some industrial applications. The higher-grade natural graphite has lower processing costs but lower grades can also be attractive even though they have higher processing costs when they contain a low level of impurities that makes it possible to obtain good quality material.68
Natural Graphite is formed when carbon is subjected to heat and pressure in the earth’s crust and in the upper mantle. Pressures and temperatures needed to produce graphite are in the range of 75,000 pounds per square inch and 750 degrees Celsius respectively.69
Natural graphite comes in three different forms: amorphous, flake and vein. The amorphous type is the most abundant form of naturally occurring graphite making up about 60 per cent of the market. It is formed from metamorphism of carbonaceous sedimentary rocks and has a carbon content of 70 to 80 per cent.70 Amorphous carbon consists of micro graphite flakes that are a result of low-grade metamorphism of coal. Flake graphite is a less common form of graphite, which is characterized by its coarse flakes and crystallinity form usually mined from carbonaceous metamorphic rocks. It is formed as a result of medium to high grade metamorphism of carbonaceous metamorphic rocks and has a carbon content of
63 Three naturally occurring allotropes of carbon known to exist are: Amorphous, Diamond and Graphite.
64 https://www.usgs.gov/centers/nmic/graphite-statistics-and-information
65 https://geology.com/minerals/graphite.shtml66 https://www.usgs.gov/centers/nmic/graphite-statistics-and-
information67 https://pubs.usgs.gov/pp/1802/j/pp1802j.pdf68 Ibid69 https://geology.com/minerals/graphite.shtml70 http://www.focusgraphite.com/technology/
CHAPTER II - Overview of LIB raw materials 11
85 to 98 per cent.71 The vein or lump type of graphite is the rarest and most valuable form of graphite. It is formed in the veins of high-grade metamorphic rock72
resulting from deposits from carbon bearing fluids.73 The veins are a few millimeters to over a meter thick in places, although usually less than 0.3 meter thick. Vein graphite has a carbon content of 90 to 99 per cent carbon74 and it appears as large lumps of solid graphite. Sri Lanka is the only country that produces commercially viable vein graphite.75 Vein graphite is highly sought after by both miners and suppliers because the higher the grade, the lower the milling and refining cost. Synthetic graphite is made by high temperature treatment of amorphous carbon from feedstock such as petroleum coke, and coal tar pitch. It is more expensive to produce than natural graphite76 but it is a more consistent and predictable product than processed natural flake.
The total identified world graphite resources are estimated to be approximately 1.5 billion tons77 of
71 Ibid72 https://pubs.usgs.gov/pp/1802/j/pp1802j.pdf73 https://eprints.ucm.es/45150/2/art_10.1007_s00126-013-
0489-912.pdf74 http://www.focusgraphite.com/technology/75 https://www.gk-graphite.com/en/products-services/vein-
graphite/76 https://www.gk-graphite.com/en/products-services/vein-
graphite/77 https://pubs.usgs.gov/pp/1802/j/pp1802j.pdf
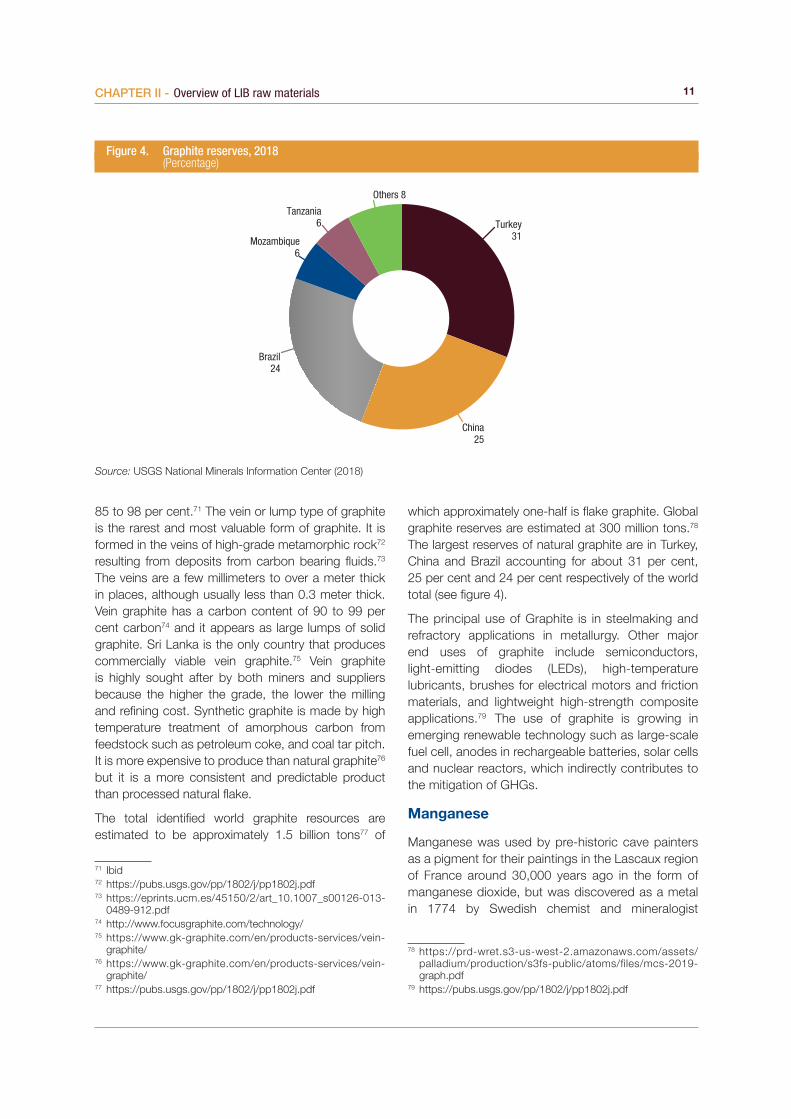
Figure 4. Graphite reserves, 2018 (Percentage)
Turkey31
China25
Brazil24
Mozambique6
Tanzania6
Others 8
Source: USGS National Minerals Information Center (2018)
which approximately one-half is flake graphite. Global graphite reserves are estimated at 300 million tons.78
The largest reserves of natural graphite are in Turkey, China and Brazil accounting for about 31 per cent, 25 per cent and 24 per cent respectively of the world total (see figure 4).
The principal use of Graphite is in steelmaking and refractory applications in metallurgy. Other major end uses of graphite include semiconductors, light-emitting diodes (LEDs), high-temperature lubricants, brushes for electrical motors and friction materials, and lightweight high-strength composite applications.79 The use of graphite is growing in emerging renewable technology such as large-scale fuel cell, anodes in rechargeable batteries, solar cells and nuclear reactors, which indirectly contributes to the mitigation of GHGs.
Manganese
Manganese was used by pre-historic cave painters as a pigment for their paintings in the Lascaux region of France around 30,000 years ago in the form of manganese dioxide, but was discovered as a metal in 1774 by Swedish chemist and mineralogist
78 https://prd-wret.s3-us-west-2.amazonaws.com/assets/palladium/production/s3fs-public/atoms/files/mcs-2019-graph.pdf
79 https://pubs.usgs.gov/pp/1802/j/pp1802j.pdf

12 COMMODITIES AT A GLANCE - Special issue on strategic battery raw materials
Johan Gottlieb Gahn.80 In the 19th century, scientists established its usefulness in increasing the hardness of iron, without reducing its malleability or toughness. By the end of the century, the demand for manganese dioxide increased because of the invention of the “Leclanché cell” in 1866 and the subsequent improvement of batteries containing manganese dioxide as a cathodic depolarizer.81 A wide range of metallurgical and chemical applications were developed in the 20th century. At present, nearly 90 per cent of all the manganese produced each year is used in the production of steel, and the rest is mainly used in the production of batteries and chemicals.82
Manganese is the 25th element of the periodic table with an atomic mass of 54.938 grammes per molecule. It is a hard and brittle metal with similar chemical and physical properties to iron. It is silvery in colour with a high melting point of 1246 degrees Celsius. Manganese is reactive in its pure form and the metal oxidizes in air and corrodes in moist air. Like iron, manganese burns in oxygen/air at increased temperatures, and decomposes water gradually when cold but quickly on heating.83
80 http://www.rsc.org/periodic-table/element/25/manganese81 http://metalpedia.asianmetal.com/metal/manganese/history.
shtml82 Ibid83 https://www.azom.com/article.aspx?ArticleID=13027
Manganese is not found as an element in nature. It occurs in many minerals such as manganite, purpurite, rhodonite, rhodochrosite, and pyrolusite. It is also found in many mineraloids such as psilomelane and wad.84 Manganese rocks and ores are formed in basins of sedimentation of various types and are represented by carbonates as well as various types of oxides and hydroxides of manganese.85 The formation of manganese ores requires specialized geologic conditions that concentrate manganese at several hundred times its average crustal abundance.86 The dominant processes in forming the world’s principal deposits take place in the oceans. As a result, most important manganese deposits occur in ancient marine sedimentary rocks that are now exposed on continents as a result of subsequent tectonic uplift and erosion.87 Modern seabed resources of ferromanganese nodules cover vast areas of the present ocean floor and are still forming by complex interactions of marine microorganisms, manganese dissolved in seawater, and chemical processes on the seabed.88
84 https://geology.com/usgs/manganese/85 https://pubs.usgs.gov/pp/1802/l/pp1802l.pdf86 Ibid87 Ibid88 Ibid
Figure 5. Manganese reserves, 2018 (Percentage)
South Africa30
Ukraine18
Brazil15
Australia13
Gabon9
Others15
Source: USGS National Minerals Information Center (2018)

CHAPTER II - Overview of LIB raw materials 13
The total world land-based manganese resources including reserves and rocks sufficiently enriched in manganese to be ores in the future are large but unevenly distributed across the earth.89 The largest resources of land based manganese are in South Africa accounting for about 74 per cent of the world total, and Ukraine accounts for about 10 per cent.90 The total identified world land based manganese resources are estimated to be approximately 17 billion tons. Manganese resources in seabed deposits of ferromanganese nodules and crusts are larger than those on land and have not been fully quantified. Land-based world manganese reserves are estimated at 760 million tons, with South Africa, Ukraine and Brazil accounting for almost 63 per cent of the total (see figure 5).91 Manganese is rarely found in high enough concentrations to form an ore
89 https://pubs.usgs.gov/pp/1802/l/pp1802l.pdf90 https://prd-wret.s3-us-west-2.amazonaws.com/assets/
palladium/production/atoms/files/mcs2019_all.pdf91 https://prd-wret.s3-us-west-2.amazonaws.com/assets/
palladium/production/atoms/files/mcs-2019-manga.pdf
deposit. Only about ten out of hundreds of minerals containing manganese are of mining significance.92
Manganese is mainly used as a purifying agent in iron-ore refining and as an alloy that converts iron into steel. Although the quantity consumed to make a ton of steel is small (about 6 to 9 kilograms), it has no satisfactory substitute.93 It is also used in alloys to improve resistance to corrosion, as a pigment in paint and for decolourizing glass.94 The most important non-metallurgical application of manganese is in disposable and rechargeable batteries. It is favoured in cathode chemistries in the LIB because it offers energy density, power output, thermal stability, faster charging time, and shelf life. More recently manganese is increasingly being used in making cathode materials in NMC lithium ion batteries.
92 https://www.theassay.com/technology-metals-edition-insight/manganese-no-longer-just-an-input-on-steel/
93 https://pubs.er.usgs.gov/publication/pp1802L94 https://byjus.com/chemistry/manganese/

CHAPTER 3
THE VALUE CHAIN

CHAPTER 3
THE VALUE CHAIN
16 COMMODITIES AT A GLANCE - Special issue on strategic battery raw materials
3.1. THE MINING VALUE CHAIN
The generic mining value chain essentially consists of three segments: mine initiation activities, mineral extraction and beneficiation, refining and recycling. It involves multiple players, some of which are vertically integrated firms, in a chain of activities that is linked to each other to deliver intermediate and final products.
At the mine initiation segment, the first activities consist of exploration and mine development. The exploration activities require a variety of technical skills and feasibility studies to identify economic deposits. This is followed by planning and development of the mine.
The mineral extraction and beneficiation segment include activities that lead to liberating ores from surrounding rock, usually by employing a range of high and low-level technologies. For example, scrapers and explosives are used to break up rock overburden when the deposits lie close to the surface. More sophisticated technology processes are used to mine deep underground ores. Sometimes surface ore deposits are identified and mined by artisanal miners using low technology equipment and hand sorting, with the high-grade ore sold to local cooperatives, who proceed to sell to local merchants and traders, to be part of the supply chains of companies producing concentrates for refining companies.95 The extracted ores are processed by crushing, grinding and separating grains of ore minerals from the gangue minerals to form more concentrated saleable intermediate products of the raw metal. This is achieved by combining ground raw materials with chemical reactants and converting into slurry, followed by filtering and evaporation (hydrometallurgy) or using high temperature processes that stimulate chemical reactions to separate metals from ores (pyrometallurgy).
The refining and recycling segment involve refining concentrates (at local or foreign depots) into high quality mineral/metallic compounds or pure forms of the mineral or metal, which finds its use in a variety of applications. High quality compounds used as active cathode and anode materials in LIBs are derived from concentrates at this stage of the value chain. Activities in this segment of the value chain may include recycling of waste materials and transforming
95 http://www.mining.com/congo-miners-buying-cobalt-artisanal-operators-balance-market/
the recycled materials (secondary raw materials) to produce high quality new metals. Recycling involves different stakeholders (collectors, dismantlers, metal merchants, shredders, transport-related organizations etc.) linked to each other to create value for the final recycled product. The recycling process begins with recovering the metal from scrap or waste and re-melting the metal, then refining to ensure the final product is free of contaminants. Recycling can be less expensive and less energy intensive than creating a new metal from mining deposits, but challenges remain with respect to recovering sufficient material for recycling followed by processing and then refining.
In general, the transformation from ores to intermediate products and to pure metals and minerals, or from scrap to recyclable metals can be a laborious process where countries are not well equipped to participate in all activities. Therefore, some activities are located across different countries wherever the necessary skills and materials are available at competitive cost and quality.96 This fragmented process has been enhanced largely due to improved information and communication technologies, trade liberalization and lower transports costs.
The value chain specific to raw materials used in manufacturing the LIB, namely cobalt, lithium, graphite and manganese, is discussed in the following section. The scope of analysis in this section will be limited to specific segments of the LIB value chain due to lack of supporting data on distribution of value at every node of the chain.
Cobalt value chain
Most of cobalt production around the world comes from copper/nickel ore bodies. The ores are extracted and processed domestically into intermediate products in the form of cobalt oxides and hydroxides and cobalt carbonates to lower the high cost of shipping bulky, low value ores/concentrates. A typical cobalt extraction process may include pressure acid leaching97 to separate nickel or copper from the laterite ore and then followed by hydrometallurgical
96 https://www.oecd.org/sti/ind/global-value-chains.htm97 In pressure acid leaching, slurred ore is preheated and
mixed with a sulfuric acid solution in high temperature and pressure for 90 min. After this, primary and secondary metals are converted into sulfate salts. These sulfate salts are then washed using a counter-current decantation circuit (CCD) which produces a clear nickel and cobalt solution, and residue; https://www.sciencedirect.com/science/article/pii/S2300396018301836

17CHAPTER III - The Value Chain
or pyrometallurgical processing, to separate the metals. The copper-associated cobalt ores found in the Democratic Republic of the Congo and Zambia are processed in this conventional way to produce a copper-cobalt concentrate. Processing of cobalt mined by artisanal workers is sometimes done locally by operating mines in the country to support their own mined supply.98
The top 5 cobalt mining companies in 2017 were Glencore (27,400 tons), China Molybdenum (16,419 tons), Fleurette Group (7,595 tons), Vale (5,811 tons), and Gecamines (4,167 tons), which is a state controlled cobalt mining company in the Democratic Republic of the Congo.99
Major refineries purchase intermediate products of cobalt from various mines and ship them to their own
98 http://www.mining.com/congo-miners-buying-cobalt-artisanal-operators-balance-market/
99 https://investingnews.com/daily/resource-investing/battery-metals-investing/cobalt-investing/top-cobalt-producing-companies/
Figure 6. Refined cobalt - chemicals, 2017 (Tons)
0 2000 4000 6000 8000 10000 12000 14000 16000 18000
Eramet (France)
Gecamines (DRC)
Impala Platinum (South Africa)
Norilsk (Russian Federation)
Umicore-Olen (Belgium)
Ganzhou Tengyuan*
Jiana Energy*
Umicore (Guangzhou)*
Freeport Cobalt (Finland)
Various other China*
Shenzhen GEM*
Jinchuan Group*
Zhejiang Huayou Cobalt*
*Refineries based in ChinaSource: Bloomberg102
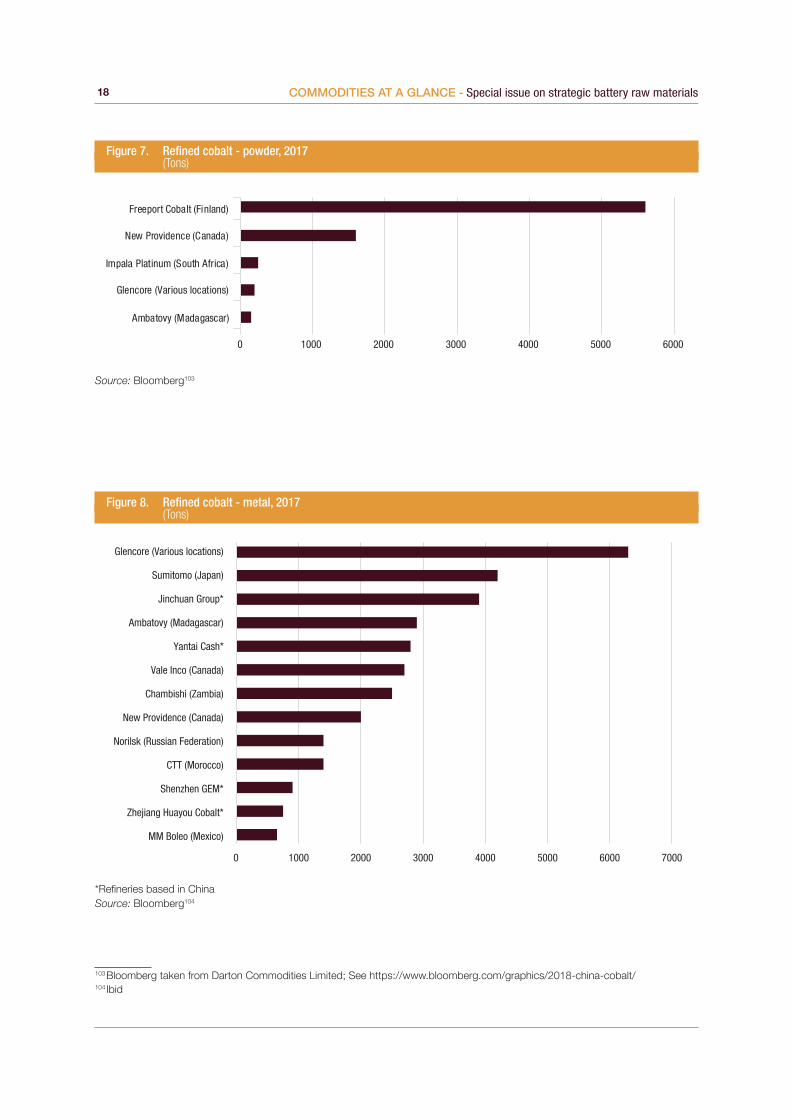
locations to produce value added compounds of cobalt for use in a variety of applications.100 Because there are different feed materials (intermediates) used in refining the ores, the processes to recover cobalt differ and produce a range of cobalt products including metals such as cathodes, ingots, briquettes, powder and chemicals such as sulfate, chloride, carbonate, oxalate, oxide, tetroxide. Cobalt chemicals are used to combine with other metals like nickel and manganese to make the cathode element of LIBs while cobalt metal and powder are mostly used to make superalloys used in jet engines.101 As EVs become more integrated into global transportation, refineries will grow proportionally to avoid supply bottlenecks in the LIB supply chain. The top cobalt chemical refineries are in China (see figure 6).102
100 Refineries are rarely located near cobalt mines, instead, major refiners purchase cobalt concentrate from various mines and ship to their own locations https://www.thebalance.com/the-biggest-cobalt-producers-2339726
101 https://www.bloomberg.com/graphics/2018-china-cobalt/102 Bloomberg taken from Darton Commodities Limited; See
https://www.bloomberg.com/graphics/2018-china-cobalt/
18 COMMODITIES AT A GLANCE - Special issue on strategic battery raw materials
Source: Bloomberg103
*Refineries based in ChinaSource: Bloomberg104
103 Bloomberg taken from Darton Commodities Limited; See https://www.bloomberg.com/graphics/2018-china-cobalt/104 Ibid
Figure 7. Refined cobalt - powder, 2017 (Tons)
0 1000 2000 3000 4000 5000 6000
Ambatovy (Madagascar)
Glencore (Various locations)
Impala Platinum (South Africa)
New Providence (Canada)
Freeport Cobalt (Finland)
Figure 8. Refined cobalt - metal, 2017 (Tons)
0 1000 2000 3000 4000 5000 6000 7000
MM Boleo (Mexico)
Zhejiang Huayou Cobalt*
Shenzhen GEM*
CTT (Morocco)
Norilsk (Russian Federation)
New Providence (Canada)
Chambishi (Zambia)
Vale Inco (Canada)
Yantai Cash*
Ambatovy (Madagascar)
Jinchuan Group*
Sumitomo (Japan)
Glencore (Various locations)

19CHAPTER III - The Value Chain
Lithium value chain
Lithium is mined from petalite/pegmatite rock deposits at open pits or underground mines. In open pits, it generally involves stripping overburden with scrapers, digging the ore or blasting with explosives then transporting the ore to designated areas for processing.105 Underground mining methods are used when economic open pit mines are depleted, and it becomes efficient to access deposits through shafts. The recovered ores are crushed, and the lithium minerals are separated on the basis of their physical, electrical and magnetic properties to form a concentrate.106 Further concentration is achieved by froth floatation,107 followed by hydrometallurgy and precipitation from an aqueous solution.108 Depending on the end use, the producer will typically create either lithium hydroxide or lithium carbonate, which is sent to refineries to be purified and manufactured into its final form. Lithium is also mined from salt lakes or from underground brine water. In underground mining, boreholes are drilled into saline aquifers and the brine is pumped into evaporation ponds at the surface. The brine is kept in the ponds to evaporate until an optimum level of concentration is attained, then it is pumped to a lithium recovery facility where it is pretreated to remove contaminants or unwanted constituents. The concentrates from mines or lithium-rich saline solution from underground lakes in South America is concentrated into a silvery-gray powder that is purified and refined into lithium hydroxide and lithium carbonate. Lithium extraction from rock is more exhausting than extracting the metal from brines and the cost is double than that extracted from brines containing the metal.109
At refineries, the lithium content (the value of lithium) in the concentrates is enhanced to battery grade lithium hydroxide or lithium carbonate, which is used to make cathode material for lithium-ion batteries and lithium chemicals. These chemicals are subsequently processed with materials such as nickel or cobalt to produce battery electrodes, or with solvents to
105 BGS, 2016, Lithium; MineralsUK, Centre for sustainable mineral development (www.MineralsUK.com)
106 Ibid 107 Froth flotation is a process that selectively separates materials
based upon whether they are water repelling (hydrophobic) or have an affinity for water (hydrophilic).; https://www.sciencedirect.com/topics/earth-and-planetary-sciences/flotation-froth
108 http://www.mining.com/web/lithium-supply-demand-story/109 https://www.thebalance.com/lithium-production-2340123
make electrolytes.110 The type of ore mined may yield profitable by-products of the refining process such as tantalum, beryllium and caesium.111 The pure metallic Lithium is produced by the electrolysis of molten lithium chloride and potassium chloride but its use in batteries is limited due to potential dangers of exploding.
The top 5 lithium mining companies in terms of global market share are Albemarle (18 per cent); Jiangxi Ganfeng Lithium (17 per cent); Sociedad Quimica y Minera S.A. (14 per cent); Tianqi Lithium Industries Inc. (12 per cent) and FMC/Livent (5 per cent).112 These companies are engaged in either rock or brine lithium projects, or both. For example, Albemarle has lithium projects in Chile and Argentina (brine), and in Australia (rock). Livent has extracted lithium brine at its operations in Argentinian salars for more than 20 years and has been producing lithium compounds for more than 60 years.113
The top producers of refined lithium are in Chile, where the world’s largest lithium sources are located. The U.S. Argentina and China are also major producers of refined lithium. Four companies dominate the market for refined lithium: Sociedad Química y Minera de Chile, Australia’s Talison, Chemetall in Germany and FMC in the United States. Lithium carbonate is generally sold on three- to five-year contracts from miners to refiners — including those listed above — that produce and market downstream chemicals and lithium metal.
Graphite value chain
Graphite occurring naturally as flakes and veins within rock fractures or as amorphous lumps is extracted through open pit mining by breaking rocks either with explosives or drilling (also referred to as quarrying) when the ore is near to the surface. When the graphite ore is located deep underground, more sophisticated methods such as underground mining is used to liberate the ore (eg. vein/lump graphite). The extracted ore is sorted, crushed and ground into fine particles, and then immersed in flotation tanks so that gangue minerals and impurities can be separated. As crystalline flake graphite has the best floatability,
110 https://www.bloomberg.com/news/features/2019-06-03/lithium-miners-australia-chile-see-riches-as-ev-battery-makers
111 http://www.mining.com/web/lithium-supply-demand-story/112 https://seekingalpha.com/article/4241060-top-5-lithium-
producers-growing-producers-consider113 https://seekingalpha.com/article/4241060-top-5-lithium-
producers-growing-producers-consider

20 COMMODITIES AT A GLANCE - Special issue on strategic battery raw materials
followed by vein graphite (amorphous graphite has the poorest floatability), flotation is the most commonly used method in graphite beneficiation.114 However, the purity levels that can be achieved for flake graphite after flotation ranges from 80 to 98 per cent, therefore further purification is required.
At the refineries, the concentrates are treated using chemical and thermal based methods to reach 99.9 per cent purity needed to generate battery-grade spherical graphite used as anodes in LIBs. The leading producers of refined graphite are in China, Mexico and Canada.
Manganese value chain
Manganese is mostly extracted from open pits and then transferred to a processing plant where it is treated. The ores may contain different physical characteristics and mineral associations. For example, in some ores the manganese minerals occur as relatively large aggregates whereas in others, impurities are distributed throughout the manganese minerals. Low grade ores are transformed into concentrates by methods such as washing, screening, separation, pyrometallurgy enrichment and chemical mineral processing.115. The concentrates are sent to refineries to produce pure manganese. The ores may also be sent directly to refineries for smelting.
At the refineries, pure manganese is produced by hydrometallurgical and electrolytic processes, while ferromanganese and silicomanganese, which are materials used in making steel alloys, are produced by the smelting of ores in a blast furnace or, more commonly, in an electric furnace.116 The important chemical compounds that are derived from refining concentrates is manganese dioxide, which is used in non-metallic applications such as battery cathodes in rechargeable batteries and in dry cell batteries.
The leading manganese ore companies, manufacturers/players are: BHP Billiton, Eramet Comilog, Vale, OM Holdings, Braken International Mining, MOIL Ltd, Dharni Sampda Private Ltd, Kaboko, and Gulf Minerals Corp.117
114 https://pdfs.semanticscholar.org/3e06/e260f32a1933562 facc4846de118fd6b3f58.pdf
115 Grigorova I. (2011), Studies and possibilities of low grade manganese ore beneficiation
116 https://www.britannica.com/technology/manganese-processing117 https://www.marketwatch.com/press-release/manganese-
ore-market-2018-global-industry-size-demand-growth-analysis-share-revenue-and-forecast-2023-2019-04-10
3.2. RECYCLING OF RAW MATERIALS USED IN LITHIUM ION BATTERIES
Recycling of raw materials used in LIBs is increasing in importance because it reduces waste and impact on the environment. Furthermore, valuable scrap metals can be recovered from end of life products because their physical properties do not degrade over time.
Currently cobalt and manganese are the major raw materials that are of most interest to metal recyclers. The end of life recycling rate for cobalt is above 68 per cent and for manganese is 53 per cent.118 Cobalt can be recovered from end-of-life products such as spent rechargeable batteries (the lithium ion battery cell comprises of between 5 to 20 per cent cobalt 119), petrochemical catalysts and alloys used in aerospace applications. Depending on the type and quality of the scrap, it might be recycled within the industry sector that generated it, processed to reclaim the cobalt as a cobalt chemical or metal powder, downgraded by using it as a substitute for nickel or iron in an alloy with a lower cobalt content, or processed to an intermediate form that would then either be further refined or downgraded. The products of recycled cobalt scrap include alloys, mixed metal residues, pure cobalt metal, metal powder, or chemicals; and tungsten carbide-cobalt powders.120 Manganese is mainly recovered from scrap of iron and steel. The quantity of manganese used in batteries is relatively small in comparison to metallurgical applications, but as the EV market continues to expand, it raises the potential for recycling spent LIBs.
Depending on the battery manufacturer, spent LIBs could contain between 5 to 10 per cent of lithium as well as other metals such as copper, aluminum and iron.121 Both pyrometallurgical and hydrometallurgical processes122 can be employed to recycle LIB waste into lithium. Lithium can also be recycled an unlimited number of times, but no recycling technology exists
118 UNEP, 2011, Recycling rates of metals – A status report119 ht tps://www.sciencedirect.com/science/art ic le/pi i /
S2095809917308226120 https:// investingnews.com/dai ly/resource-investing/
battery-metals-investing/cobalt-investing/recycling-cobalt-sustainable-and-affordable/
121 ht tps://www.sciencedirect.com/science/art ic le/pi i /S2095809917308226
122 Pyrometallurgical processes involves smelting in furnaces, incineration, combustion and pyrolysis; In hydrometallurgy involves using strong inorganic/organic acids or caustic watery solutions to effectively dissolve and precipitate metals.

21CHAPTER III - The Value Chain
today that can produce pure enough lithium for a second use in batteries.123 The end of life recycling rate for lithium is estimated at less than 1 per cent.124 Similarly, not much recycling of natural graphite (flake) is done due to limitations in current technologies even though the potential exists to recover waste resources from, inter alia, LIBs, steel furnace refractories, casting processes, and brake lining. The challenge in graphite recycling is to segregate the used graphite from other materials and ensure they are not contaminated. The end of life recycling rate for lithium and natural graphite is estimated at less than 1 per cent.125
3.3. ADVANTAGES AND DISADVANTAGES OF RECYCLING
All metals can be recycled without degrading their properties; but choosing to recycle and the success of such initiatives may depend on a variety of factors, inter alia, the geographical location in relation to markets for reprocessing materials, volume of recyclable materials and efficiency of the collection methods.126
Many components of rechargeable batteries end up in dump sites at the end of their life cycles. It has been estimated that today’s typical passenger vehicle car manufactured with an NMC 622 cathode 55kWh battery pack will contain 7.4 kg Lithium Carbonate Equivalent (LCE)127 and 12kg refined cobalt. In the future a similar car with a 77kwh battery pack equipped with an NMC 811 cathode will contain 8.4 kg LCE and 6.6 kg refined cobalt.128 Although the potential recoverable quantity of metals in the LIB is relatively high and could present recycling business opportunities, they are often combined with several different elements in a complex mix making recycling extremely difficult. Furthermore, not all retrieved materials may reach battery-grade quality when recycled but the recovered resources can be used for less demanding purposes.129
The recycling of raw materials used in LIBs has significant advantages. For example, it contributes to
123 https://batteryuniversity.com/learn/article/availability_of_lithium
124 UNEP. (2011). Recycling rates of metals – A status report125 UNEP, (2011). Recycling rates of metals – A status report126 https://www.sustainabilityexchange.ac.uk/factors_affecting_
recycling127 Lithium Carbonate Equivalent refers to the different lithium
compounds and production quantities used in the battery128 Azevedo M., Campagnol N., Hagenbruch T., Hoffman K., Lala
A., Ramsbottom O. (2018). Lithium and cobalt – a tale of two commodities, Mckinsey & Company.
129 https://batteryuniversity.com/learn/article/recycling_batteries
reducing waste destined for landfill sites and as a result helps to reduce land and groundwater pollution, since landfills contribute to environmental degradation. In addition, using secondary raw materials means less use of energy to develop primary raw materials, a reduction in GHG emissions, conservation of resources and environmental protection.130 Furthermore, recycling contributes to the Circular Economy (CE) model, which entails a gradual decoupling of economic activity from the consumption of finite sources and designing waste out of the system.131 Recycling also contributes to the creation of jobs ranging from collection and delivery of recyclable materials to setting up recycling plants. The constraints to recycling are the high upfront capital costs such as building the recycling plant. Recycling may make a small contribution to conserving the resource but if the growth rate of global production of the raw material is greater than consumption, recycling may not be able to delay the inevitable depletion of deposits.132
3.4. THE LITHIUM ION BATTERY MANUFACTURING CHAIN
The manufacture of rechargeable batteries involves three main steps: Electrode manufacturing, cell assembly and cell finishing. The different segments are either part of a vertically integrated company or a manufacturing supply chain where the different components are supplied for the manufacture of the final product.
In electrode manufacturing, the active components are mixed with some additives and transformed by a series of different processes into cathodes or anodes. The cathode is the positive electrode of the LIB. The worldwide Lithium Ion Battery cathode market was estimated at US$7 billion in 2018 and is expected to reach US$58.8 billion by 2024.133 The manufacture of cathode active materials is dominated by Asia. In 2015, China manufactured approximately 39 per cent (by weight) of the total amount of cathode materials, followed by Japan (19 per cent) and Republic of Korea
130 https://www.conserve-energy-future.com/advantages-and-disadvantages-of-recycling.php
131 https://www.ellenmacarthurfoundation.org/circular-economy/concept
132 https://www.conserve-energy-future.com/advantages-and-disadvantages-of-recycling.php
133 h t t ps : / /www.g lobenewsw i re . com/news- re l ease / 2019/03/14/1752966/0/en/Worldwide-Lithium-Ion-Battery- Cathodes-Market-Report-2019-Market-is-a-7-Billion-Market-in-2018-and-is-Expected-to-Reach-58-8-Billion-by-2024.html

22 COMMODITIES AT A GLANCE - Special issue on strategic battery raw materials
(7 per cent).134 Leading manufacturers of cathode materials for lithium-ion battery includes Umicore, BASF, and Johnson Matthey, among others.135
The anode is the negative electrode of the LIB. The worldwide market for Lithium-ion Battery Anode Materials is expected to grow at a Compound Annual Growth Rate (CAGR) of roughly 13.6 per cent over the next five years, reaching US$ 2.99 billion in 2024, from US$ 1.39 billion in 2019.136 Anode materials are mostly manufactured in Asia by manufacturers including Hitachi Chemical, BTR, Shanshan Technology, JFE, Mitsubishi Chemical Holdings, and Nippon Carbon.137 In 2016, the market share of the top six manufacturers was estimated at about 41 per cent.138
In the cell assembly segment, the process is usually highly automated but manual assembly methods may be used by smaller manufacturers. This stage involves building the power-generating compartments called cells. Each cell is essentially made of a positive electrode (connected to the battery’s positive or + terminal), a negative electrode (connected to the negative or − terminal), and an electrolyte in between them. The cells are built by first making the electrode sub-assembly in which the separator is sandwiched between the anode and the cathode.139 This is followed by connecting the electrode structure to the terminals together with any safety devices and to insert this sub-assembly into a can. The can is then sealed in a laser welding or heating process, depending on the case material, leaving an opening for injecting the electrolyte into the can. The last stage involves filling the cell with the electrolyte and then sealing.140
At the cell finishing stage, the cells are tested, graded and sorted. The finished and sorted cells are supplied to battery assembly pack manufacturers where they are assembled into battery pack products that are cost effective, environmentally safe and meet specifications demanded by the end user. In 2018, the battery pack market was estimated at US$20.6 billion
134 https://ec.europa.eu/jrc/sites/jrcsh/files/jrc105010_161214_li-ion_battery_value_chain_jrc105010.pdf
135 https://www.batterypoweronline.com/news/embracing-l i thium-ion-battery-euphoria-innovations-in-cathode-materials/
136 https://www.reuters.com/brandfeatures/venture-capital/article?id=87198
137 Ibid138 Ibid139 https://www.mpoweruk.com/battery_manufacturing.htm140 Ibid
and is forecast to reach US$36.2 billion by 2023, at CAGR of 12 per cent.141
Manufacturers from three countries in Asia, China, Japan and Republic of Korea dominate the rechargeable battery market. In 2018, less than 3 per cent of the total global demand for EV batteries was supplied by companies outside these three countries, and only approximately 1 per cent was supplied by European companies.142
3.5. ECONOMIC IMPLICATIONS OF THE LITHIUM ION BATTERY VALUE CHAINS
The various stages outlined in the LIB value chain and the value chains of raw materials used in LIBs highlight various activities that are conducted to transform ores into finished products. Very often, the largest producers of the raw materials used in manufacturing LIBs exit the value chain at a very early stage, focusing on the first saleable product that is extracted from the deposits (ores). Due to the relatively low price of ores per ton and fixed shipping charges per unit weight, ore undergoes at least some processing at or near the extraction site in order to increase its value per unit weight prior to shipment.143 For example, the battery raw materials discussed in this report are sometimes transformed into intermediate products through chemical and physical transformations before being traded.
The largest producer of cobalt, the Democratic Republic of the Congo, exports most of its cobalt in ores, oxides and hydroxides. In 2017, cobalt exports comprised of 26.2 per cent of total exports from the DRC: The value of Cobalt oxides and hydroxide exported was estimated at US$721m and cobalt ore at US$512m.144 The ores are produced by both artisanal and large-scale mining activities. Ores originating from artisanal miners in the DRC contribute to the livelihood of about 100,000 miners145 Including diggers, sorters and washers, many of whom include child workers. Artisanal miners sell most of their ore to middlemen who
141 https://www.businesswire.com/news/home/2018111400 5414/en/Global-Battery-Packaging-Market-Type-Battery-Level
142 https://www.mckinsey.com/industries/oil-and-gas/our-insights/recharging-economies-the-ev-battery-manufacturing-outlook-for-europe
143 https://pdfs.semanticscholar.org/930e/841dc74df2736184a16f7bbec98dbd07e03d.pdf
144 https://oec.world/en/profile/country/cod/145 https://www.mining.com/congo-miners-buying-cobalt-
artisanal-operators-balance-market/

23CHAPTER III - The Value Chain
sell the raw material to operators for semi processing. Artisanal miners accounted for between 14 to 16 per cent of the country’s annual production in 2017.146 The value added to cobalt ores by the Democratic Republic of the Congo is limited to intermediate products or concentrates, mainly composed of hydroxide with a cobalt content of between 20 and 40 per cent.147 End products that require further processing/refining for use in rechargeable batteries as well for other uses are mostly produced from refineries in China, Finland, Norway, Belgium and Zambia.148
Unlike other metals that can be used with limited processing after they are extracted, raw lithium must undergo extensive chemical treatment to be used in batteries.149 For example, lithium carbonates from Australian spodumene deposits and from brine are processed further to produce lithium chloride and lithium hydroxide and lithium carbonates, then processed further to produce lithium metal. In 2018, the revenues earned by the top exporters of lithium oxide and hydroxide were as follows: China (US$398m), the United States (US$102m), Chile (US$95m), the Russian Federation (US$67.3m) and Belgium (US$38m). The main exporters of lithium carbonates were Chile (US$948m), China (US$164m), Belgium (US$104m), Germany (US$45m), and the United States (US$23m) (see discussion on international trade).
Manganese is mostly exported as ores and concentrates, and natural graphite is exported in the form of powder or flakes. The bulk of manganese ores is processed into ferromanganese and silicomanganese. Only a small fraction of manganese ores and concentrates is refined into high purity manganese metal and high purity manganese sulphate for use in the battery industry. The revenues earned from the top exporters of manganese ores and concentrates, in 2018 was: South Africa (US$3.5bn), Brazil (US$406m), Ghana (US$288m), Kazakhstan (US$33m) and Malaysia (US$23m). The revenues from
146 https://phys.org/news/2018-02-cobalt-prices-soar-congo-small.html
147 Ibid148 h t tps : / /www.theba lance.com/the-b iggest-coba l t -
producers-2339726149 https://cdn2.hubspot.net/hubfs/4518141/Risks%20and%20
Opportunities%20in%20the%20Battery%20Supply%20Chain.pdf
top exporters of Natural graphite in powder or flakes were: China (US$315m), Brazil (US$31.2m), Germany (US$29.5m), United States (US$21.1m) and Canada (US$17m).
The global electric car fleet is growing rapidly. In 2018, it exceeded 5.1 million, up by 2 million (65 per cent) from the previous year and almost doubling the number of new electric car sales.150 According to IEA projections, global electric car sales are expected to reach 23 million in 2030 with a stock exceeding 130 million vehicles (excluding two/three wheelers).151 The IEA forecast has implications for suppliers of raw materials and value added intermediate products used in rechargeable batteries. Some forecasts indicate that average annual global cobalt consumption will reach about 220 000 tons in 2025 and increase to 390 000 tons in 2030 if not alleviated by substitution mechanisms with the adoption of alternative battery chemistries requiring less cobalt.152 One area in which there is opportunity for resource owners is therefore in boosting supplies to meet rising demand as well as in refining to produce battery grade materials usable in rechargeable batteries. Their increased production could also meet consumption needs in the varied applications for cobalt highlighted in this report. The potential exists to increase domestic value addition in host countries where raw materials originate and processing is not advanced. However, lack of infrastructure (eg. electricity, communications), forward linkages (mineral beneficiation and manufacturing), backward linkages (local capabilities and suppliers), financing, and policies that encourage local value addition has made it difficult to maximize the economic benefits of moving further up the value chain. Other factors that have contributed to stifling value-added manufacturing include, low access to advanced materials technology, stringent environmental regulations, and elaborate product specifications in the fabrication of semi-finished and finished products.
150 https://www.iea.org/publications/reports/globalevoutlook2019/151 Ibid152 Dias A, Blagoeva D. Pavel C. Arvanitidis N. (2018). Cobalt:
demand-supply balances in the transition to electric mobility, JRC Science for Policy Report.


CHAPTER 4
SUPPLY, DEMAND AND PRICES

26 COMMODITIES AT A GLANCE - Special issue on strategic battery raw materials
4.1. PRODUCTION OF RAW MATERIALS USED IN LITHIUM ION BATTERIES
A few countries dominate production of the raw materials used in LIBs: cobalt is mainly produced in the Democratic Republic of the Congo, lithium in Australia and Chile, graphite in China and Brazil, and manganese in South Africa and Australia.
Given that cobalt is mostly mined as a by-product of either copper or nickel, the decisions made from exploration for and production of copper or nickel may affect the supply of cobalt on the market. For example, a period of low copper and nickel prices may discourage exploration activities and investment decisions and impact the expansion of cobalt production in the medium term. Currently, the only primary cobalt operation is from the Brou-Azzer mine in Morocco153 where production over the last two years is estimated to be on average 2,250 tons per annum.154
From 2010 to 2018, global production of mined cobalt increased from 89,500 tons to 140,000 tons. Most of the cobalt mined during this period came from copper cobalt
153 https://www.proactiveinvestors.co.uk/companies/news/ 212832/cobalt-set-for-bearish-2019-but-demand-fundamen-tals-remain-strong-212832.html
154 https://www.usgs.gov/centers/nmic/mineral-commodity-summaries
operations in the Democratic Republic of the Congo, with the bulk of the rest being attributed to nickel-cobalt operations. During this period, other leading producers had varied production patterns. For example, production volumes in Russia, the second largest producer of cobalt, remained relatively stable at around 6,000 tonnes, while production from Cuba, Australia and the Philippines followed a volatile path of rising and falling volumes. Between 2010 and 2013, production in Australia increased by 66 per cent largely due to rising demand, before falling by 27 per cent in 2018. The fall was due in part to the influence of declining nickel prices which led to a shutdown of nickel mines at a time when demand for cobalt was growing. Cobalt production in the Philippines also declined from 2014 to 2016 due in part to low nickel prices causing mines to be closed or suspended155 but a combination of strong demand and increasing prices contributed to reversing the downward trend and pushed production upwards. In 2018, the Democratic Republic of the Congo increased production by approximately 23 per cent over the previous year to 90,000 tons and it has almost doubled since 2010 (an increase by 90 per cent over the period) largely due to rising demand (see figure 9).
155 http://mgb.gov.ph/2015-05-13-02-02-11/mgb-news/181-metallic-production-value-suffers-deficit-in-q3-2015
Figure 9. Cobalt production, 2010 to 2018* (Tons)
Australia Cuba Philippines Russia Congo DR, right axis World Total, right axis
0
20000
40000
60000
80000
100000
120000
140000
160000
0
1000
2000
3000
4000
5000
6000
7000
8000
2010 2011 2012 2013 2014 2015 2016 2017 2018*
* Estimates for year 2018Data Source: USGS National Minerals Information Center (2018)

27CHAPTER IV - Supply, Demand and Prices
In 2018, the Democratic Republic of the Congo accounted for approximately 66 per cent of global production, with Russia, Cuba, Australia and the Philippines as the next largest producers, accounting together for 16 per cent of global production (see figure 10).
Lithium production comes mainly from rock and brine. Australia is the largest producer of lithium from rocks, while Chile and Argentina dominate
Figure 11. Lithium production, 2010 to 2018* (Tons)
Democratic Republicof Congo
66
Russia4
Cuba4
Australia4
Philippines3
Others19
Figure 10. Cobalt production, 2018* (Percentage)
*Estimates for year 2018Source: USGS National Minerals Information Center (2018)
supplies originating from brines. From 2010 to 2018, global production of lithium increased from 28,100 tonnes in 2010 to 85,000 tonnes in 2018. Most of the increase occurred between 2015 to 2018 where production jumped by almost 170 per cent due in part to soaring demand for lithium compounds such as lithium hydroxide and lithium carbonate used in LIBs (see figure 11).
0
10000
20000
30000
40000
50000
60000
70000
80000
90000
0
2000
4000
6000
8000
10000
12000
14000
16000
18000
2010 2011 2012 2013 2014 2015 2016 2017 2018*
Argentina Chile China Zimbabwe Australia, right axis World Total, right axis
*Estimates for year 2018Data source: USGS
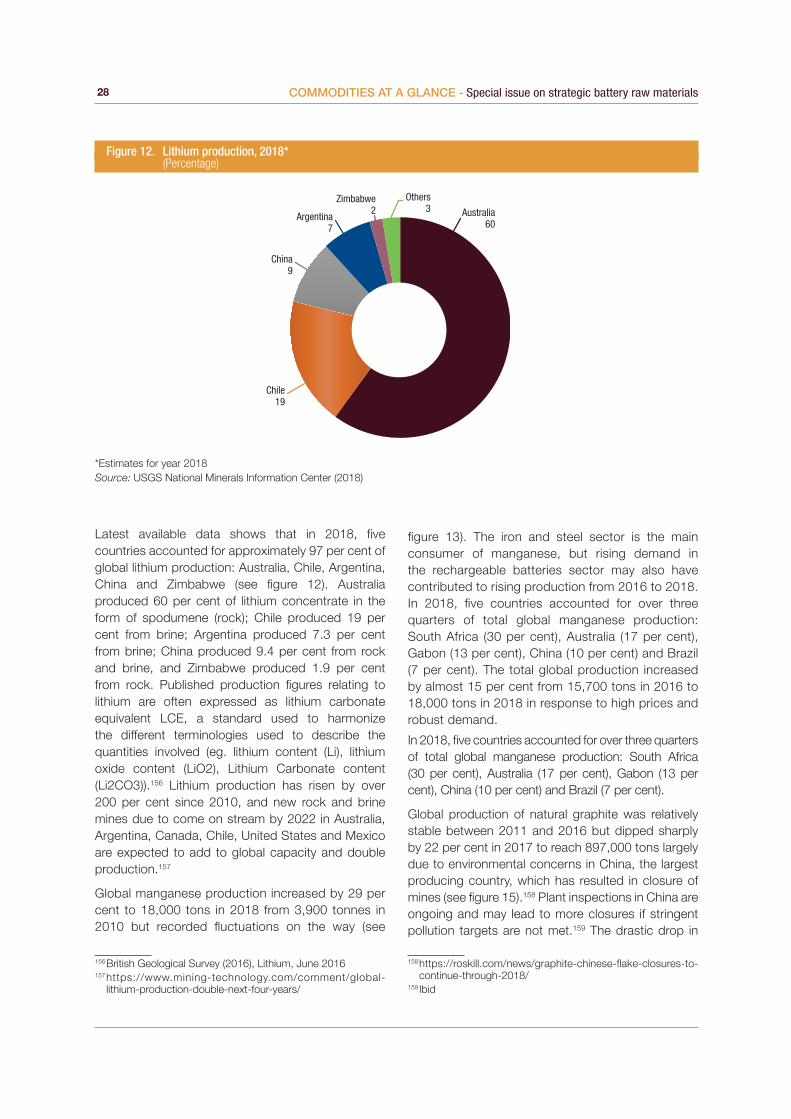
28 COMMODITIES AT A GLANCE - Special issue on strategic battery raw materials
Figure 12. Lithium production, 2018* (Percentage)
China9
Argentina7
Zimbabwe2
Others3
Chile19
Australia60
*Estimates for year 2018Source: USGS National Minerals Information Center (2018)
Latest available data shows that in 2018, five countries accounted for approximately 97 per cent of global lithium production: Australia, Chile, Argentina, China and Zimbabwe (see figure 12). Australia produced 60 per cent of lithium concentrate in the form of spodumene (rock); Chile produced 19 per cent from brine; Argentina produced 7.3 per cent from brine; China produced 9.4 per cent from rock and brine, and Zimbabwe produced 1.9 per cent from rock. Published production figures relating to lithium are often expressed as lithium carbonate equivalent LCE, a standard used to harmonize the different terminologies used to describe the quantities involved (eg. lithium content (Li), lithium oxide content (LiO2), Lithium Carbonate content (Li2CO3)).156 Lithium production has risen by over 200 per cent since 2010, and new rock and brine mines due to come on stream by 2022 in Australia, Argentina, Canada, Chile, United States and Mexico are expected to add to global capacity and double production.157
Global manganese production increased by 29 per cent to 18,000 tons in 2018 from 3,900 tonnes in 2010 but recorded fluctuations on the way (see
156 British Geological Survey (2016), Lithium, June 2016157 https://www.mining-technology.com/comment/global-
lithium-production-double-next-four-years/
figure 13). The iron and steel sector is the main consumer of manganese, but rising demand in the rechargeable batteries sector may also have contributed to rising production from 2016 to 2018. In 2018, five countries accounted for over three quarters of total global manganese production: South Africa (30 per cent), Australia (17 per cent), Gabon (13 per cent), China (10 per cent) and Brazil (7 per cent). The total global production increased by almost 15 per cent from 15,700 tons in 2016 to 18,000 tons in 2018 in response to high prices and robust demand.
In 2018, five countries accounted for over three quarters of total global manganese production: South Africa (30 per cent), Australia (17 per cent), Gabon (13 per cent), China (10 per cent) and Brazil (7 per cent).
Global production of natural graphite was relatively stable between 2011 and 2016 but dipped sharply by 22 per cent in 2017 to reach 897,000 tons largely due to environmental concerns in China, the largest producing country, which has resulted in closure of mines (see figure 15).158 Plant inspections in China are ongoing and may lead to more closures if stringent pollution targets are not met.159 The drastic drop in
158 https://roskill.com/news/graphite-chinese-flake-closures-to-continue-through-2018/
159 Ibid

29CHAPTER IV - Supply, Demand and Prices
Figure 13. Global manganese production, 2010 to 2018* (Tons)
Figure 14. Manganese production, 2018* (Percentage)
0
3000
6000
9000
12000
15000
18000
21000
0
1000
2000
3000
4000
5000
6000
7000
2010 2011 2012 2013 2014 2015 2016 2017 2018*
Australia Brazil China Gabon South Africa World total, right axis
South Africa30
Australia17
Gabon13
China10
Brazil7
Others23
*Estimates for year 2018Source: USGS National Minerals Information Center (2018)
*Estimates for year 2018Source: USGS National Minerals Information Center (2018)

30 COMMODITIES AT A GLANCE - Special issue on strategic battery raw materials
India’s production from 2016 to 2017 is documented by different sources (USGS, British Geological Survey) even though no explanation is provided.
In 2018, China produced almost 70 per cent of the world’s total graphite production of which approximately 44 per cent was amorphous graphite and about 56 per
Figure 15. Natural graphite production, 2010 to 2018* (Tons)
Figure 16. Natural graphite production, 2018* (Percentage)
0
20000
40000
60000
80000
100000
120000
140000
160000
180000
2010 2011 2012 2013 2014 2015 2016 2017 2018*
Brazil Canada India Ukraine China, right axis World total, right axis
0
150000
300000
450000
600000
750000
900000
1050000
1200000
1350000
China68
Brazil10
Canada4
India4
Ukraine2
Others 12
*Estimates for year 2018Data source: USGS
*Estimates for year 2018Source: USGS National Minerals Information Center (2018)
cent was flake.160 Other major producers were Brazil (10 per cent), Canada (4 per cent), India (4 per cent), Ukraine (2 per cent) (see figure 16).
160 https://prd-wret.s3-us-west-2.amazonaws.com/assets/palladium/production/s3fs-public/atoms/files/mcs-2019-graph.pdf

31CHAPTER IV - Supply, Demand and Prices
4.2. DRIVERS OF PRODUCTION
The underlying factor influencing the increasing production of cobalt, lithium manganese and natural graphite is the rising demand for electric vehicles. The latter, in turn, is largely driven by policies that encourage the mitigation of greenhouse gases coupled with incentives for zero-and low-emissions vehicles, economic instruments that help bridge the cost gap between electric and conventional vehicles and support for the deployment of charging infrastructure (IEA, 2019).161 It is also being driven by policies that target banning future sales of internal combustion engines (e.g. in Norway and France) which are influencing the expansion of the EV market. Furthermore, technology advances are delivering more compact batteries that are able to cover longer distances, extra durability (the capacity to withstand many charge/discharge cycles without performance being affected) and substantial cost savings, thereby influencing EV adoption.162 This trend in policy actions, cost savings and higher efficiency batteries is contributing to escalating demand and supply of raw materials used in rechargeable batteries. Growth in consumer electronics, renewable based energy sources and energy storage systems are also expected to positively impact demand for rechargeable batteries163 and in turn, drive growth in the extraction of raw materials for rechargeable batteries. The global rechargeable battery market size is expected to grow at a Compound Annual Growth Rate (CAGR) of around 7 per cent during 2019-2024.164
Technology for raw materials production from deep ocean mineral deposits is still evolving but it has significant potential to expand supply to meet growth forecasts. It is driven by growing demand, potential supply disruptions and depletion of land-based resources. The International Seabed Authority (ISA), charged with regulating human activities on the deep-sea floor beyond the
161 IEA (2019). Global EV Outlook 2019, IEA, Paris. See https://www.iea.org/publications/reports/globalevoutlook2019/
162 https://www.iea.org/topics/innovation/transport/gaps/ advancing-technologies-and-reducing-battery-costs.html
163 IEA (2019), Global EV Outlook 2019, IEA, Paris; https://www.iea.org/publications/reports/globalevoutlook2019/
164 https://www.prnewswire.com/news-releases/world-rechargea-ble-battery-market-research-report-2019-2024---segmented-by-battery-type-capacity-application-and-region-300879849.html
continental shelf, has issued 27 contracts since its inception in 1982 for mineral exploration, encompassing a combined area of more than 1.4 million km2, and continues to develop rules for commercial mining.165 At the same time, some seabed mining operations are already taking place within continental shelf areas of nation states, generally at relatively shallow depths, while others are at advanced stages of planning. The first commercial enterprise expected to target mineral-rich sulfides in deep waters, at depths between 1,500 and 2,000m on the continental shelf of Papua New Guinea, is scheduled to begin in early 2019.166
4.3. DEMAND FOR RAW MATERIALS USED IN LITHIUM ION BATTERIES
Demand for cobalt, lithium, natural graphite and manganese falls largely within two main categories: metallurgical and chemicals. The metallurgical category is dominated by the superalloys segment associated with, inter alia, power generation, hard metals and high-tech industries such as aerospace and defence.167 The chemicals category is dominated by the rechargeable batteries segment.
As more automotive manufacturers are rolling out electric vehicles, the demand for raw materials used in rechargeable batteries is also rising. In recent years, the cobalt market expanded rapidly, with demand rising above 100,000 tonnes for the first time in 2017. In 2018, demand surged by 25 per cent from the previous year to 125,000 tonnes with about 9 per cent accounted for by the EV battery sector.168 Some forecasts estimate that cobalt demand will reach 185,000 tonnes by 2023 with about 35 percent accounting for the EV battery sector.169 The rechargeable battery market is the fastest growing sector for cobalt demand largely due to expansion of electric mobility. The emergence of China as a major producer and consumer of refined cobalt since
165 Miller K.A., Thompson K.F., Johnston P., Santillo D. (2018). An overview of seabed mining including the current state of devel-opment, environmental impacts, and knowledge gaps, frontiers in marine science; https://doi.org/10.3389/fmars.2017.00418.
166 Ibid.167 https://www.globalenergymetals.com/cobalt/cobalt-demand/168 http://publications.jrc.ec.europa.eu/repository/bitstream/
JRC112285/jrc112285_cobalt.pdf169 https://www.reuters.com/article/us-cobalt-prices-electric/
cobalts-price-crash-bottoming-out-stocks-to-hinder-quick-rally-idUSKCN1Q11EP

32 COMMODITIES AT A GLANCE - Special issue on strategic battery raw materials
2007 has influenced the pattern of demand for mined cobalt (cobalt ores and concentrates). More cobalt is sourced from the largest producer, Democratic Republic of the Congo. Eight of the largest mines in the Democratic Republic of the Congo are Chinese owned, accounting for almost half of global cobalt supplies.170. Other major importers of cobalt ores and concentrates include Zambia, Morocco, Finland, Republic of Korea and Belgium.
Lithium has also benefitted from the growth of the global EV market and other battery applications such as portable electronic and energy storage applications. Demand growth for lithium has been significant since 2015, increasing by 13 per cent per year. Demand from rechargeable batteries exceeded 144,000 tons LCE in 2018 and is forecast to increase more than six-fold by 2028 if demand for EVs persists. A shift to higher nickel cathode materials in lithium-ion batteries is likely to accelerate demand for lithium hydroxide, as opposed to lithium carbonate, with battery-grade hydroxide demand forecast to grow by 35 per cent per year through to 2028, compared to 14 per cent per year for battery grade carbonate.171
Demand for manganese is usually associated with steel making but manganese is also becoming an important component in the manufacture of LIBs. Since 2019, global output has increased largely due to iron and steel demand as well as the demand created in the battery market, as more automotive manufacturers are rolling out electric vehicles that require manganese and lithium compounds to create batteries.
Demand for natural graphite is rising slowly largely due to its cost advantages and its environmental friendliness compared to synthetic graphite. Natural graphite also forms the base for graphene, which promises to hold energy better than graphite anodes and also deliver faster charging times.172 Although no commercial products of graphene are currently available, it is a potential substitute to the LIB graphite anode. Graphite for batteries currently accounts to only 5 per cent of global demand.173
170 https://www.bloomberg.com/graphics/2018-china-cobalt/171 h t t ps : / /www.g lobenewsw i re . com/news- re l ease /
2019/07/17/1883820/0/en/Roskill-Lithium-prices-to-con-tinue-slide-despite-forecast-supply-disruptions-and-strong-demand-growth.html
172 https://batteryuniversity.com/learn/article/bu_309_graphite173 Ibid
4.4. INTERNATIONAL TRADE174
International trade in cobalt
Raw materials and intermediate products across the LIB value chain are traded internationally for further processing and use in downstream industries. The major upstream product categories of cobalt traded are ores and concentrates, oxides and hydroxides, as well as chlorides. In 2018, the top 5 importers of cobalt ores and concentrates in terms of value were China (US$601.6m), Zambia (US$198.4m), Morocco (US$73.4m), Finland (US$23m), and Republic of Korea (US$19.9m) (figure 17).175
The major trading partners by value of the top 5 importers of cobalt ores and concentrates are the Democratic Republic of the Congo, Zambia, Republic of Korea, Belgium, China, Austria and Congo (see table 4). Most of the ores and concentrates imported to China originated from the Democratic Republic of the Congo and were destined for domestic consumption in the rechargeable battery industry. Nearly all of Zambia’s imports of cobalt ores and concentrates are also from the Democratic Republic of the Congo. The imported ores and concentrates are refined to produce metals at the Chambishi at the Chambishi Metals plant and then exported to other markets.176
Based on available data, the top 5 exporters of cobalt ores and concentrates by value in 2018 were Germany (US$2.6m), Belgium (US$1.5m), Zambia (US$1.3m), Ireland (US$0.7m) and South Africa (US$0.6m) (see figure 18). Mirroring import data of cobalt ores and concentrates from China suggests that the Democratic Republic of the Congo is also a major exporter but export data is not available.
174 The data used in this section is taken from United Nations Comtrade Database, SITC Rev. 4 and HS 17 when it is not reported under SITC.
175 United Nations Comtrade Database, SITC Rev. 4176 The Chambishi plant is the only plant in Zambia producing
cobalt metal and is one of the largest cobalt metal produc-ers in the world. It is also unique as it is the only operation in the world which produces both LME registered cobalt and copper metal; https://www.ergafrica.com/cobalt-copper-division/chambishi-metals/

33CHAPTER IV - Supply, Demand and Prices
Figure 17. Top 5 importers of cobalt ores and concentrates, 2018 (Percentage)
Source: United Nations Comtrade Database SITC Rev. 4, 28793
China61
Zambia20
Morocco8
Finland 2
Republic of Korea 2 Others 7
Importers Dem. Rep. of Congo Zambia Republic of
Korea Belgium China Austria Congo
China 595.5 3.9 1.3 0.8 0 0 0
Zambia 198.3 0 0 0 0 0 0
Morocco 56.0 0.7 0 0 0 0 14.6
Finland 0 0 0 0 0 22.7 0
Rep of Korea 10.1 0.6 0 0 8.9 0 0
Data Source: United Nations Comtrade Database SITC Rev. 4, 28793
Table 4. Major trading partners of leading importers of cobalt ores and concentrates, 2018 (Millions of dollars)
Figure 18. Top 5 exporters of cobalt ores and concentrates, 2018* (Percentage)
* Data not available for Democratic Republic of the CongoSource: United Nations Comtrade Database SITC Rev. 4 - 28793
Germany26
Belgium16
Zambia14
Ireland7
SouthAfrica
7
Others30

34 COMMODITIES AT A GLANCE - Special issue on strategic battery raw materials
Figure 19. Top 5 importers of cobalt oxides and hydroxides, 2018 (Percentage)
Source: United Nations Comtrade Database SITC Rev. 4 -52255
Republic ofKorea
57
Spain9
UnitedStates
6
Japan5
China4
Others19
Exporters Belgium Republic of Korea China Brazil United Kingdom United States
Germany 2.6 0 0 0 0 0
Belgium 0 0 0.9 0.5 0 0
Zambia 0 0.3 0.1 0 0 0.9
Ireland 0 0 0 0 0.7 0
South Africa 0 0 0.6 0 0 0
Source: UN Comtrade Database SITC Rev. 4 - 28793
Table 5. Major trading partners of leading exporters of cobalt ores and concentrates, 2018 (Millions of dollars)
The major trading partners of the top 5 cobalt ores and concentrates exporters are Belgium, Republic of Korea, China, Brazil, United Kingdom and the United States (see table 5).
Importers Finland Japan China United Kingdom Italy Belgium Other Asia,
nes
Republic of Korea 201.6 0.5 444.7 0 0 180 a
Spain 10.9 0 36.9 9.6 56.1 8.9 0
United States 15.0 0 18.9 20.3 0 35.7 0
Japan 0 0 16.4 0 0 24.4 9.9
China 48.0 2.6 5.8 0 0 0 0
Source: United Nations Comtrade Database SITC Rev. 4, 52255a: Stands for amounts of less than 0.05 m
Table 6. Major trading partners of leading importers of cobalt oxides and hydroxides, 2018 (Millions of dollars)
With respect to cobalt oxides and hydroxides, the top 5 importers are the Republic of Korea (US$837.2 million), Spain (US$125.4 million), United States (US$92.5 million), Japan (US$70 million), and China (US$64.5 million).

35CHAPTER IV - Supply, Demand and Prices
Figure 20. Top 5 exporters of cobalt oxides and hydroxides, 2018 (Percentage)
Source: United Nations Comtrade Database SITC Rev. 4 - 52255
China55
Belgium32
UnitedKingdom
5
Other Asia,nes 2
Italy2
Others4
Trades in cobalt oxides and hydroxides were also largely driven by rechargeable battery demand. The Republic of Korea alone accounted for 57 per cent of total global imports in 2018 (see figure 19).
The major trading partners by value of the leading importers of cobalt oxides and hydroxides in 2018 are Finland, Japan, China, United Kingdom, Italy, Belgium and Other countries in Asia-not elsewhere specified (nes) (see table 6).
The major exporters of cobalt oxides and hydroxides in 2018 were China, Belgium, United Kingdom, Other Asia, nes (not elsewhere specified), and Italy. China and Belgium supplied 55 per cent and 32 per cent respectively of total global supplies by value (see figure 20).
Exporters Turkey Thailand China Italy Japan Republic of Korea Spain United
States
China 0.5 0 0 0 14.8 486.7 37 9.7
Belgium 3.6 0 10.7 13.1 26.2 167.6 57.9 35.2
United Kingdom ~ 0 0.1 1.6 1.0 0.5 9.2 20.0
Other Asia, nes 0 8.9 7.2 0 9.7 a 0 0
Italy 6.2 0 0 0 0 0 4.7 0
Source: United Nations Comtrade Database SITC Rev. 4, 52255a: Stands for amounts of less than 0.05 m
Table 7. Major trading partners of leading exporters of cobalt oxides and hydroxides, 2018 (Millions of dollars)
The major trading partners of the top leading exporters of cobalt oxides and hydroxides are Turkey, Thailand, China, Italy, Japan, Republic of Korea, Spain and the United States (see Table 7).
International trade in lithium
Lithium products traded globally are mainly in the form of oxides and hydroxides, lithium carbonates and lithium metal. The principal material used in rechargeable batteries is high purity lithium carbonate, but developments in battery technology is increasing demand for lithium hydroxide.177 In 2018, the top five importers of Lithium oxide and
177 https://www.argusmedia.com/en/news/1836977-lithium-hydroxide-demand-to-overtake-carbonate-aabc
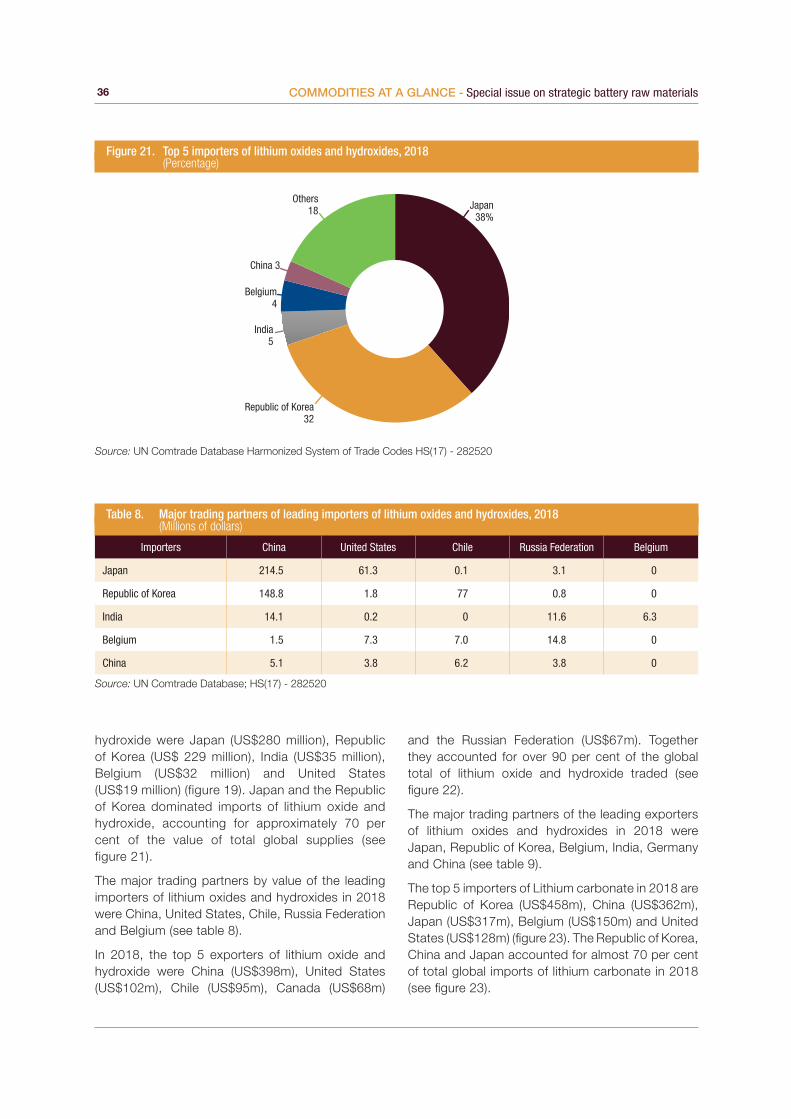
36 COMMODITIES AT A GLANCE - Special issue on strategic battery raw materials
hydroxide were Japan (US$280 million), Republic of Korea (US$ 229 million), India (US$35 million), Belgium (US$32 million) and United States (US$19 million) (figure 19). Japan and the Republic of Korea dominated imports of lithium oxide and hydroxide, accounting for approximately 70 per cent of the value of total global supplies (see figure 21).
The major trading partners by value of the leading importers of lithium oxides and hydroxides in 2018 were China, United States, Chile, Russia Federation and Belgium (see table 8).
In 2018, the top 5 exporters of lithium oxide and hydroxide were China (US$398m), United States (US$102m), Chile (US$95m), Canada (US$68m)
Table 8. Major trading partners of leading importers of lithium oxides and hydroxides, 2018 (Millions of dollars)
and the Russian Federation (US$67m). Together they accounted for over 90 per cent of the global total of lithium oxide and hydroxide traded (see figure 22).
The major trading partners of the leading exporters of lithium oxides and hydroxides in 2018 were Japan, Republic of Korea, Belgium, India, Germany and China (see table 9).
The top 5 importers of Lithium carbonate in 2018 are Republic of Korea (US$458m), China (US$362m), Japan (US$317m), Belgium (US$150m) and United States (US$128m) (figure 23). The Republic of Korea, China and Japan accounted for almost 70 per cent of total global imports of lithium carbonate in 2018 (see figure 23).
Figure 21. Top 5 importers of lithium oxides and hydroxides, 2018 (Percentage)
Source: UN Comtrade Database Harmonized System of Trade Codes HS(17) - 282520
Japan38%
Republic of Korea32
India5
Belgium4
China 3
Others18
Importers China United States Chile Russia Federation Belgium
Japan 214.5 61.3 0.1 3.1 0
Republic of Korea 148.8 1.8 77 0.8 0
India 14.1 0.2 0 11.6 6.3
Belgium 1.5 7.3 7.0 14.8 0
China 5.1 3.8 6.2 3.8 0
Source: UN Comtrade Database; HS(17) - 282520

37CHAPTER IV - Supply, Demand and Prices
Table 9. Major trading partners of leading exporters of lithium oxides and hydroxides, 2018 (Millions of dollars)
Figure 22. Top 5 exporters of lithium oxide and hydroxide, 2018 (Percentage)
Source: UN Comtrade Database; HS(17) - 282520
China50
USA13
Chile12
Canada8
RussianFederation
8
Others 9
Exporters Japan Republic of Korea Belgium India Germany China
China 208.4 143.3 1.4 15.5 1.5 0
United States 62.9 1.1 6.5 0.2 10.0 3.8
Chile 0.1 69.8 6.7 0 0 4.6
Canada 0 0 0 0 0 68.1
Russian Federation 0.7 0.1 40 3.5 17.5 a
Source: UN Comtrade Database; HS(17) - 282520a: Stands for amounts of less than 0.05 m
Figure 23. Top 5 importers of lithium carbonate, 2018 (Percentage)
Source: UN Comtrade Database HS(17) - 282520
Republicof Korea
27
China22Japan
19
Belgium9
UnitedStates
8
Others15

38 COMMODITIES AT A GLANCE - Special issue on strategic battery raw materials
Importers Chile China Argentina Japan United States
Rep. of Korea United Kingdom
Republic of Korea 346 72 38.5 0.8 0.2 0 0.5
China 159.8 0,1 188.8 5.2 0.5 3.4 3.6
Japan 224.5 31.7 55 0 2.4 0 0.7
Belgium 139.3 0.3 7.4 0.2 0.4 0 a
United States 63.3 9.3 52.8 0.3 0 1.7 0.5
Source: UN COMTRADE HS(17) - 283691a: Stands for amounts of less than 0.05 m
Figure 24. Top 5 exporters of lithium carbonate, 2018 (Percentage)
Source: UN Comtrade Database HS(17) - 283691
Chile70
China12
Belgium8
Germany3
United States 2 Others 5
Table 10. Major trading partners of leading importers of lithium carbonate, 2018 (Millions of dollars)
Exporters Republic of Korea Japan Russian
Federation Belgium China Germany France United States
United Kingdom
Chile 340.0 223.4 0 135.3 136 32.8 0 56.1 0
China 96.8 32.8 15.2 0.3 0 1.8 1.2 9.1 0
Belgium a ~ 31.1 0 ~ 20.3 21.3 ~ 15.6
Germany ~ 1.7 2.1 3.3 ~ 0 4.8 0.1 4.0
United States 0.6 1.5 0 0.4 ~ 12.1 ~ 0 0
Source: UN Comtrade Database HS(17) -283691a: Stands for amounts of less than 0.05 m
Table 11. Major trading partners of leading exporters of lithium carbonate, 2018 (Millions of dollars)

39CHAPTER IV - Supply, Demand and Prices
The major trading partners of the leading importers of Lithium Carbonate in 2018 are Chile, China, Argentina, Japan, United States, Republic of Korea and United Kingdom (See table 10).
The top 5 exporters of Lithium carbonate in 2018 are Chile (US$948m), China (US$165m), Belgium (US$104m), Germany (US$46m), and the United States (US$23m). Approximately 70 per cent of lithium carbonate exports originated from Chile in 2018. (see figure 24).
The major trading partners of the leading exporters of Lithium Carbonate in 2018 include the Republic of Korea, Japan, Russian Federation, Belgium, China, Germany, France, United States and the United Kingdom. China is a major importer and exporter of lithium carbonate (see table 11). Local battery makers purify the imports into battery grade lithium carbonate
for domestic use. However, surging supply of good quality lithium carbonate and competitive prices offered by China has contributed to expanding exports between China and its trading partners.
International trade in natural graphite
Natural graphite is used in steel making and metal transformations, but demand is growing for anode materials in LIBs. Natural graphite traded globally is in the form of powder or flakes. The top 5 importers of natural graphite in 2018 are Japan (US$128m), Republic of Korea (US$81m) United States (US$68m), Germany (US$58m) and China (US$55m). The largest importer was Japan, accounting for about one fifth of total global imports (see figure 25).
Figure 25. Top 5 importers of Natural Graphite in powder or flakes, 2018 (Percentage)
Source: UN Comtrade Database HS(17) - 250410
Japan21
Republic of Korea13
UnitedStates
11
Germany10
China9
Others36
Importers Mozambique Madagascar Japan China Brazil United States Germany Canada
Japan 0.1 0.2 0 112 0.9 2.6 0.5 0.8
Republic of Korea 0 0 1.0 68 0.1 5.5 5.8 0.2
USA 0.7 3.5 2.0 24 6.8 0 0.8 13.7
Germany 5.2 4.3 0.6 23.6 11.7 0.8 0 0.8
China 12.2 16.1 13.7 0.5 0.4 0.5 1.9 a
Source: UN Comtrade Database HS(17) - 250410 a: Stands for amounts of less than 0.05 m
Table 12. Major trading partners of leading importers of natural graphite, 2018 (Millions of dollars)

40 COMMODITIES AT A GLANCE - Special issue on strategic battery raw materials
The major trading partners by value of the leading importers of natural graphite in 2018 are Mozambique, Madagascar, Japan, China, Brazil, United States, Germany and Canada (see Table 12).
The top 5 exporters of natural graphite in the form of powder or flakes in 2018 are China (US$314.9), Brazil (US$31.2), Germany (US$29.5), United States (US$21.1) and Canada (US$17). China dominated exports of natural graphite accounting for almost 65 per cent of total global graphite exports (see figure 26).
The major trading partners of the leading exporters of natural graphite are Germany, Belgium, Poland,
United States, India, United Kingdom, Canada, Iran (Islamic Republic of), Japan and the Republic of Korea (see table 13).
International trade in manganese
Manganese is widely traded in ores and concentrates as well as in manganese oxides and dioxides. The top 5 importers of manganese ores and concentrates are China (US$6bn), India (US$744m), Republic of Korea (US$417m), Japan (US$349m), and Norway (US$330m). China dominated imports of manganese ores and concentrates accounting for 65 per cent of total global imports in 2018 (see figure 27).
Figure 26. Top 5 exporters of Natural Graphite, 2018 (Percentage)
Source: UN Comtrade Database HS(17) - 250410
China64
Brazil6
Germany6
UnitedStates 5
Canada3
Others16
Table 13. Major trading partners of leading exporters of natural graphite, 2018 (Millions of dollars)
Exporters Germany Belgium Poland United States India Canada Iran (Islamic
Republic of) Japan Republic of Korea
China 15.6 2.8 6.7 29.5 19.0 1.5 3.8 111.5 92.9
Brazil 9.7 3.0 3.3 5.5 1.4 0.2 0 0.8 a
Germany 0 1.0 1.1 0.4 0 0 0 0.3 4.8
United States 1.1 0.6 0 0 0.8 3.1 0 2.5 3.7
Canada 1.0 ~ 0 13.8 ~ 0 0 0.8 0.2
Source: UN Comtrade Database HS(17) - 250410a: Stands for amounts of less than 0.05 m
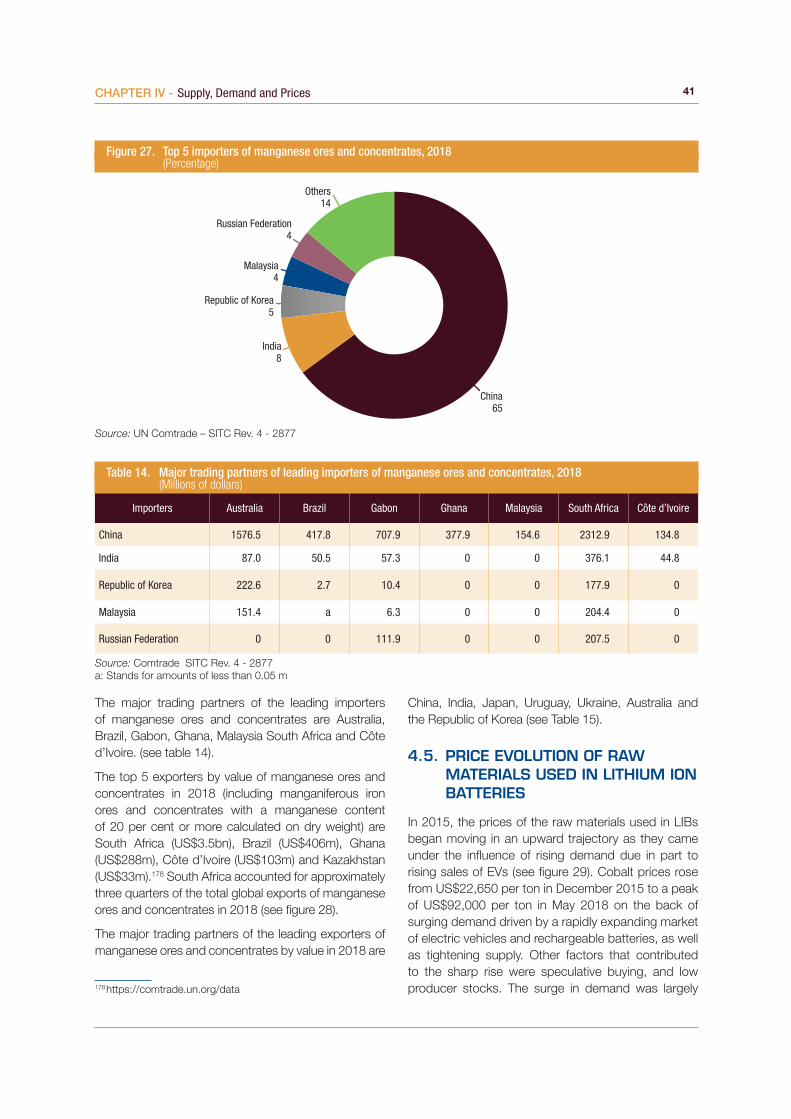
41CHAPTER IV - Supply, Demand and Prices
Importers Australia Brazil Gabon Ghana Malaysia South Africa Côte d’Ivoire
China 1576.5 417.8 707.9 377.9 154.6 2312.9 134.8
India 87.0 50.5 57.3 0 0 376.1 44.8
Republic of Korea 222.6 2.7 10.4 0 0 177.9 0
Malaysia 151.4 a 6.3 0 0 204.4 0
Russian Federation 0 0 111.9 0 0 207.5 0
Source: Comtrade SITC Rev. 4 - 2877a: Stands for amounts of less than 0.05 m
Table 14. Major trading partners of leading importers of manganese ores and concentrates, 2018 (Millions of dollars)
Figure 27. Top 5 importers of manganese ores and concentrates, 2018 (Percentage)
Source: UN Comtrade – SITC Rev. 4 - 2877
China65
India8
Republic of Korea5
Malaysia4
Russian Federation4
Others14
The major trading partners of the leading importers of manganese ores and concentrates are Australia, Brazil, Gabon, Ghana, Malaysia South Africa and Côte d’Ivoire. (see table 14).
The top 5 exporters by value of manganese ores and concentrates in 2018 (including manganiferous iron ores and concentrates with a manganese content of 20 per cent or more calculated on dry weight) are South Africa (US$3.5bn), Brazil (US$406m), Ghana (US$288m), Côte d’Ivoire (US$103m) and Kazakhstan (US$33m).178 South Africa accounted for approximately three quarters of the total global exports of manganese ores and concentrates in 2018 (see figure 28).
The major trading partners of the leading exporters of manganese ores and concentrates by value in 2018 are
178 https://comtrade.un.org/data
China, India, Japan, Uruguay, Ukraine, Australia and the Republic of Korea (see Table 15).
4.5. PRICE EVOLUTION OF RAW MATERIALS USED IN LITHIUM ION BATTERIES
In 2015, the prices of the raw materials used in LIBs began moving in an upward trajectory as they came under the influence of rising demand due in part to rising sales of EVs (see figure 29). Cobalt prices rose from US$22,650 per ton in December 2015 to a peak of US$92,000 per ton in May 2018 on the back of surging demand driven by a rapidly expanding market of electric vehicles and rechargeable batteries, as well as tightening supply. Other factors that contributed to the sharp rise were speculative buying, and low producer stocks. The surge in demand was largely

42 COMMODITIES AT A GLANCE - Special issue on strategic battery raw materials
driven by Chinese consumption and EVs, but more broadly by the strength of high-tech industries such as aerospace for which cobalt is a non-substitutable material. The use of cobalt in gas turbines for power generation also played an important role in boosting demand.179 From May 2018 to July 2019, cobalt prices declined by 71 per cent, largely due to slowing growth rates for the EV sector and abundant supply in the market triggered by increased mining activity as miners sought to capitalize on high prices.180 Furthermore, slowing down industrial activity in China in 2018 contributed to a buildup of cobalt stocks and added to depressing the price.181 The collapse of cobalt prices was in line with other
179 https://agmetalminer.com/2008/01/16/can-cobalt-maintain-its-meteoritic-rise-in-2008/
180 https://internationalbanker.com/brokerage/why-have-cobalt-prices-crashed/
181 https://www.ft.com/content/98c7d136-ba8f-11dd-aecd-0000779fd18c
Exporters China India Japan Uruguay Ukraine Australia Republic of Korea
South Africa 2045.3 285.7 226.9 0 54.6 28.8 134.1
Brazil 266.5 20.6 0 82.7 0 0 2.2
Ghana 237.7 0 0 0 50.4 0 0
Côte d’Ivoire 73.9 15.5 0 0 0 0 0
Data Source: Comtrade – SITC Rev. 4 - 2877
Table 15. Major trading partners of leading exporters of manganese ores and concentrates, 2018 (Millions of dollars)
industrial metals such as aluminum, zinc, nickel and copper.182 The downwards trend in cobalt prices reversed in August 2019 after Glencore announced plans to transition its operation at the world’s largest mine in the Democratic Republic of Congo (Mutanda) to temporary care and maintenance by the end of 2019, reflecting its reduced economic viability in the current market environment, primarily in response to low cobalt prices.183
Prices of lithium metal also rose sharply from US$62,498 per tonne in February 2015 to reach US$145,973 per tonne in June 2018, as demand rose. But prices declined thereafter, reaching US$90,996 per tonne in September 2019. The fall in lithium metal prices has been largely due to
182 https://www.ft.com/content/98c7d136-ba8f-11dd-aecd-0000779fd18c
183 https://www.glencore.com/media-and-insights/news/2019-Half-Year-Report-release
Figure 28. Top 5 exporters of manganese ores and concentrates, 2018 (Percentage)
Source: Comtrade –SITC Rev. 4 - 2877
South Africa77
Brazil9
Côte d’Ivoire 2Kazakhstan 1 Others 5
Ghana 6

43CHAPTER IV - Supply, Demand and Prices
oversupply and a slowdown in EV growth.184 The use of lithium metal in rechargeable batteries is limited because it poses safety risks.185 Lithium carbonate, which is the most widely produced and consumed lithium compound, came under pressure largely due to slowing demand driven by global trade tensions, slowing growth and the scaling back of Chinese electric vehicle (EV) subsidies, oversupply in the market186 caused by high levels of production and destocking by Chinese market players due to tightening in credit.187 Prices fell from US$14.35 per tonne in June 2018 to US$9.55 per tonne in September 2019, largely due to oversupply in the market driven by high production growth rates and weak demand due to global trade tensions,
184 https://www.spglobal.com/en/research-insights/articles/lithium-supply-is-set-to-triple-by-2025-will-it-be-enough
185 https://batteryuniversity.com/learn/article/experimental_rechargeable_batteries
186 https://www.reuters.com/article/us-metals-lmeweek-lithium/stung-by-sliding-prices-lithium-industry-pares-back-expansions-idUSKBN1X71DG
187 https://www.reuters.com/article/us-lithium-chemicals-prices/solid-demand-to-underpin-lithium-as-price-slides-in-2018-idUSKCN1LX1PF
slowing growth and the scaling back of Chinese electric vehicle (EV) subsidies.188
Manganese prices trended downwards prior to 2016, but growing demand driven by Chinese traders accumulating large volumes of ore,189 and demand for steel products contributed to tightening the market and reversing the downward trend. Prices rose from US$2.91 per tonne in January to US$6.81 per tonne in December 2016, but the rising trend came under downward pressure from excess supply on the market and prices declined by almost 40 per cent in the first quarter of 2017 to US$4.27. Prices rallied thereafter to US$6.57 per tonne in September 2018 due in part to production cuts, before returning to a declining path in 2019. The influence of rising demand from rechargeable batteries on prices is not pronounced because most consumption is attributed to iron and steel manufacturing. Nonetheless, the impact of rising
188 https://www.reuters.com/article/us-metals-lmeweek-lithium/stung-by-sliding-prices-lithium-industry-pares-back-expansions-idUSKBN1X71DG
189 https://www.metalbulletin.com/Article/3839025/Year-end-manganese-ore-rally-unlikely-in-2018-sources-say.html
Source: Reuters Datastream
0,00
2,00
4,00
6,00
8,00
10,00
12,00
14,00
16,00
0
20000
40000
60000
80000
100000
120000
140000
160000
01.0
6.20
12
01.1
0.20
12
01.0
2.20
13
01.0
6.20
13
01.1
0.20
13
01.0
2.20
14
01.0
6.20
14
01.1
0.20
14
01.0
2.20
15
01.0
6.20
15
01.1
0.20
15
01.0
2.20
16
01.0
6.20
16
01.1
0.20
16
01.0
2.20
17
01.0
6.20
17
01.1
0.20
17
01.0
2.20
18
01.0
6.20
18
01.1
0.20
18
01.0
2.20
19
01.0
6.20
19
LME Cobalt Cash ($ per tonne)
Lithium metal, 99 per cent, Battery Grade ($ per tonne)
Natural Graphite ($ per tonne)
Manganese ore Mn 32 per cent, Fe 20 per cent,Guangxi-SA ($ per tonne) - right axis
Li Carbonate 99.5 per cent min ($ per tonne) - right axis
Figure 29. Battery raw materials prices, 2010 to 2019 (Dollars)

44 COMMODITIES AT A GLANCE - Special issue on strategic battery raw materials
CHAPTER 5
SOCIAL AND ENVIRONMENTAL CHALLENGES
demand for rechargeable batteries cannot be overlooked and it may well have a stronger impact as projections for EV production continue to be upbeat.
Natural graphite prices also reversed a downward and volatile path in 2017, then followed an upward and volatile path in 2018 to reach a peak of US$36,201 per tonne in January 2019. As it is for manganese, natural graphite’s primary consumer remains the steel industry, while batteries only account for only about 13 per cent of total natural graphite demand.190 Similar to manganese prices, the upward trend in natural graphite prices was largely driven by steel production. LIBs are only beginning to have an impact on demand and consumption. Prices for natural graphite are negotiated bilaterally between buyers and sellers because of the wide range of graphite qualities and purity (figure 29).
190 https://www2.argusmedia.com/-/media/Files/white-papers/getting-graphite-prices-right.ashx

CHAPTER 5
SOCIAL AND ENVIRONMENTAL CHALLENGES

46 COMMODITIES AT A GLANCE - Special issue on strategic battery raw materials
5.1. CHALLENGES RELATED TO EXPLOITATION OF BATTERY METALS AND MINERALS
The exploitation of raw materials discussed in this report can have social and environmental implications. For example, most of the cobalt supplied to global markets originates from the Democratic Republic of the Congo, of which 20 per cent comes from artisanal mines where child labour and human rights issues have been identified. Up to 40,000 children are estimated to be working in extremely dangerous conditions, with inadequate safety equipment, for very little money in the mines in Southern Katanga.191 The children are exposed to multiple physical risks and psychological violations and abuse, only to earn a meagre income to support their families. The widespread use of child labour in cobalt mining can have global supply implications as supply of minerals extracted using child labour is becoming increasingly unacceptable to manufacturers of products derived from raw materials. The government of the Democratic Republic of the Congo recognizes the issue of child labour in mines and has adopted policies that promote free primary school education and forbids the use of children for dangerous work. It is expected that by 2025 child labour will be eliminated from the mines.
There are also several environmental challenges associated with the exploitation of the battery raw materials. For example, abandoned mine sites and tailings resulting from exploited cobalt-copper mines in DRC may contain sulphur minerals that undergo various reactions to generate sulfuric acid when exposed to air and water, allowing the dissolution of the metal elements. This behaviour known as Acid mine drainage (AMD) causes pollution or contamination of surface water by increasing the toxicity of water.192 It pollutes rivers and drinking water. Another environmental challenge at cobalt mines is associated with dust released from mechanical excavation, digging or breaking of rocks by hand, as in artisanal mining and pulverized rock. Dust from some of these cobalt mines may contain toxic metals including uranium which is linked to health impacts such as respiration and birth defects. The mines in Southern Congo hold vast deposits of cobalt, copper and uranium. In 2018, excessive traces of uranium found in cobalt caused Glencore exports from the Kamoto mine to stop so that an ion exchange
191 https://www.unicef.org/childsurvival/drcongo_62627.html192 https://meetingorganizer.copernicus.org/EGU2018/EGU2018-
45-1.pdf
facility could be built to remove contaminants. Interim operational solutions were introduced in January 2019 so that production could resume at the mine.
The two forms of lithium mining (brine and rock extraction) also present social and environmental risks. For example, indigenous communities that have lived in the Andean region of Chile, Bolivia and Argentina (which holds more than half the world’s supply of lithium beneath its salt flats) for centuries must contend with miners for access to communal land and water. The mining industry depends on a large amount of groundwater in one of the driest desert regions in the world to pump out brines from drilled wells. Some estimates show that approximately 1.9 million litres of water is needed to produce a tonne of lithium.193 In Chile’s Salar de Atacama, lithium and other mining activities consumed 65 per cent of the region’s water. That is having a big impact on local farmers – who grow quinoa and herd llamas – in an area where some communities already must get water driven in from elsewhere.194
As the mining sites overlap with nature conservation areas, mining activities have been responsible for ecosystem degradation and landscape damage. The process of forced migration of populations from villages and the abandonment of ancestral settlements has been precipitated by water scarcity and an increasingly erratic water supply.195 Lithium rock mining also presents significant environmental risks. Breathing lithium dust or alkaline lithium compounds irritates respiratory tracts and prolonged exposure to lithium can cause fluid to build-up in the lungs, leading to pulmonary oedema. As demand for lithium increases and production is tapped from deeper rock mines and brines, the challenges of mitigating environmental risk will also increase.
The environmental impacts of graphite mining are very similar to those associated with cobalt mining. The use of explosives to open rocks to expose graphite can lead to the release of dust and fine particles into the atmosphere which can result in health issues when inhaled. The dust released in the production of natural graphite also has a significant impact on the communities that are located close to factory sites. In addition, soils may become contaminated as a result of graphite powder spillages and this may have harmful effects on fauna and flora.
193 https://www.wired.co.uk/article/lithium-batteries-environment-impact
194 Ibid195 https://iopscience.iop.org/article/10.1088/1748-9326/
aae9b1/pdf

CONCLUSION

48 COMMODITIES AT A GLANCE - Special issue on strategic battery raw materials
better-informed decisions regarding investment to expand capacity to meet demand growth. Occasionally, disruption to supply occurs from environmental problems along production lines or the effect of production activities on the surrounding environment. Employing scientific and technologically advanced processes that prevent or control undesired environmental impacts may contribute to mitigating supply disruptions arising from the negative environmental impacts. For example, at Glencore’s Katanga cobalt mine in DRC, an ion exchange system is being implemented to treat uranium material found in cobalt ores on a long-term basis.
Recycling of raw materials recovered from spent LIBs can make an important contribution to transforming economies of raw materials host countries into circular economies and alleviate security of supply concerns as demand increases due to a rapidly expanding EVs market. An improved rate of recycling of raw materials can contribute to lower costs of production and less impacts on the environment. It can also contribute to opening the door to new businesses. The task is to design products that allow for better recyclability; ensure better information is provided from manufacturers to recyclers; develop high-efficiency recycling standards linked to a certification scheme; and promote the recovery of critical raw materials from mining waste and landfills.198
Expanding infrastructure at existing mines or establishing new production lines to boost production can also mitigate supply risk.
Policymakers can have a direct influence on the options highlighted to mitigate risks to supplies by facilitating research into new battery chemistries that rely less on critical raw materials, adopting recycling policies and providing a conducive environment to attract investment to establish new mines or expand existing ones. Alleviating the vulnerabilities of consumers to supply disruptions while ensuring sustainable mining practices can contribute to mitigating GHG emissions. By fuelling the transition towards cleaner sources of energy, the production and use of the strategic metals discussed in this report can contribute to efforts to keep global temperature rise well below 2 degrees Celsius above pre-industrial levels and to pursue efforts to limit temperature increase even further to 1.5 degrees Celsius as enshrined in the Paris Agreement.
198 https://ec.europa.eu/growth/content/turning-recycled-raw-materials-business-opportunities-0_fi
Lithium, natural graphite and manganese have been highlighted in this report as critical raw materials for the manufacture of rechargeable batteries such as LIBs. These batteries can play a huge role in the transition to a low carbon energy system and they can also contribute to the implementation of the 2015 Paris Climate Change Agreement if the raw materials are sourced and produced in a sustainable manner. As demand for rechargeable batteries is forecast to grow rapidly due to EVs becoming more integrated into global transportation, the quantity of the raw materials used in manufacturing them is also expected to increase rapidly. This raises concerns about security of supplies, in particular for cobalt, lithium and natural graphite, given that production is concentrated in a few countries, and substitutability is low with the preferred battery chemistries of EV manufacturers. Over 60 per cent of cobalt is mined in the Democratic Republic of the Congo, while over 75 per cent of the global lithium production is mined in Australia and Chile, thus disruption to supply may lead to tighter markets, higher prices and increased costs of LIBs.
There are several options that can be considered to reduce vulnerabilities of consumers to supply shortfalls. For example, one option would be to facilitating research into battery technologies that depend less on critical raw materials and with potential to provide higher energy density. For example, silicon used as anode material instead of graphite Lithium-ion batteries has the potential to absorb more charge, which translates into longer battery life and smaller batteries.196 Silicon in the form of silicates constitutes more than 25 per cent of the Earth’s crust. However, there are challenges that still need to be overcome such as controlling the physical expansion of the silicon when charging.197
Another option worth considering is employing strategies that allow for dynamic monitoring of the raw material cycles, from mining through processing, refining, and manufacturing to recycling. This would facilitate early detection of supply risks. It also would enable development of mitigation strategies at either company or national level. For example, actions could consist of building strategic stockpiles to alleviate shortages, improving forecasting, and instituting
196 https://www.sciencedaily.com/releases/2019/02/1902211 30302.htm
197 https://www.sciencedaily.com/releases/2019/02/1902211 30302.htm

49CHAPTER V - Social and Environmental Challenges
ANNEX - STATISTICAL DATA: EXPORTS, IMPORTS,
PRODUCTION, RESERVES
Table 16. Leading importers of cobalt ores and concentrates by value (Dollars)
Country 2011 2012 2013 2014 2015 2016 2017 2018
China 850’265’891 370’298’756 338’152’198 393’143’105 447’564’240 214’618’918 342’770’008 601’630’320
Zambia 119’262’698 190’458’586 167’388’159 203’429’771 232’492’856 .. 180’808’056 198’376’641
Finland 55’161’351 39’927’193 25’204’438 19’714’936 9’083’971 7’223’565 17’537’609 22’655’183
India 28’211’094 12’894’714 612’652 4’217’890 1’809’833 553’573 .. 3’323
Morocco .. .. .. .. 378’440 146 10’311’141 73’396’300
Republic of Korea 19’217’981 6’836’847 3’191’913 6’468’403 6’733’090 362’079 1’512 19’915’346
South Africa 1’307’149 732’540 6’763’549 29’453’461 21’924’036 440’018 98’442 41’084
United States 17’467’858 6’291’916 815’051 401’049 1’093’128 519’907 665’180 668’919
Belgium 3’713’515 4’266’529 1’343’173 1’201’492 4’649’713 2’522’008 1’700’073 1’031’068
Spain 50’339 56’359 6’083 31’053 1’572’850 2’693’499 5’902’731 6’048’551
Luxembourg 490’570 273’847 1’621’823 1’983’857 1’234’721 2’251’381 7’969 876’360
China, Hong Kong SAR 1’911’455 4’754’695 .. .. 838’630 .. 111’742 783’876
Germany 2’490’057 916’551 189’773 714’605 30’154 1’370 1’678 12’732
United Kingdom 606’040 374’022 395’537 443’030 482’141 217’887 137’024 140’474
Australia .. .. 52’652 59’447 .. 46’475 1’644’679 2’739
Malaysia 2’039 3’845 1’312’600 4’001 286’399 2’205 .. 80’888
France 162’048 84’181 378’787 118’796 180’674 95’342 133’913 101’965
Sweden .. 591 .. .. .. .. 196’798 971’095
Brazil 20’852 103’045 68’065 294 49’660 22’458 553’467 8’221
Italy 243’561 107’189 210’393 57’999 65’088 19’923 100’488 ..
.. missing dataSource: UN Comtrade (SITC 28793 Rev. 4)
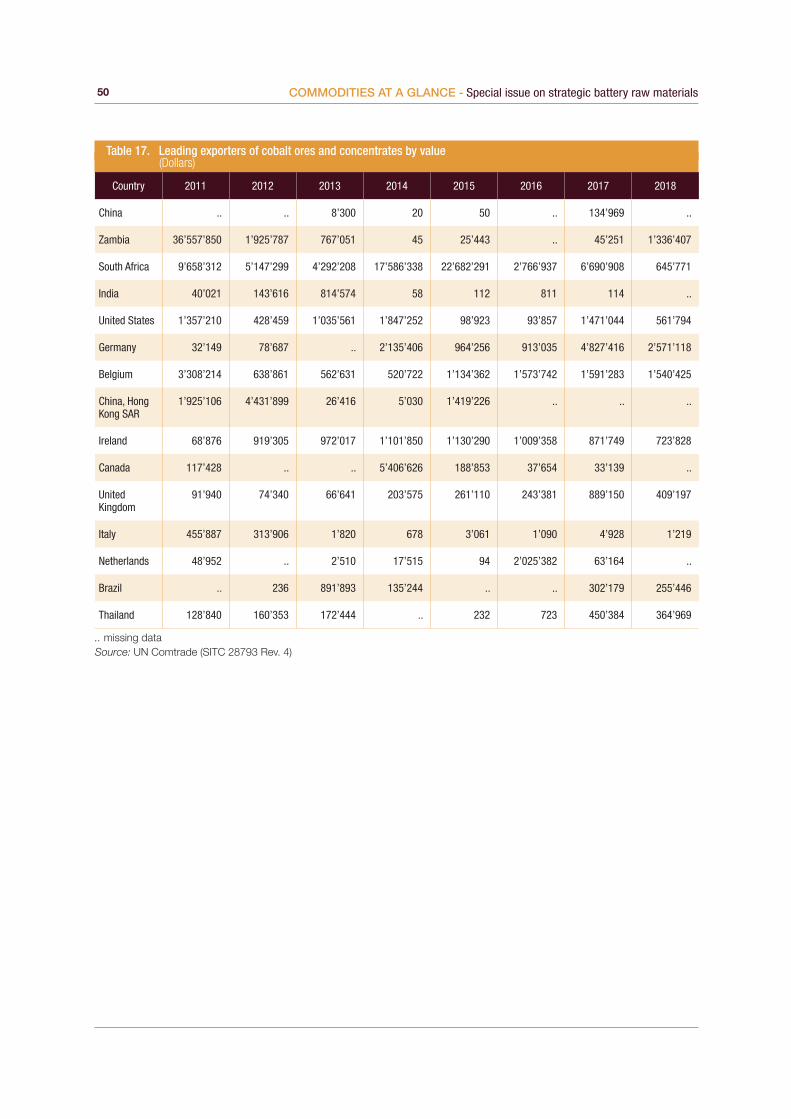
50 COMMODITIES AT A GLANCE - Special issue on strategic battery raw materials
Table 17. Leading exporters of cobalt ores and concentrates by value (Dollars)
Country 2011 2012 2013 2014 2015 2016 2017 2018
China .. .. 8’300 20 50 .. 134’969 ..
Zambia 36’557’850 1’925’787 767’051 45 25’443 .. 45’251 1’336’407
South Africa 9’658’312 5’147’299 4’292’208 17’586’338 22’682’291 2’766’937 6’690’908 645’771
India 40’021 143’616 814’574 58 112 811 114 ..
United States 1’357’210 428’459 1’035’561 1’847’252 98’923 93’857 1’471’044 561’794
Germany 32’149 78’687 .. 2’135’406 964’256 913’035 4’827’416 2’571’118
Belgium 3’308’214 638’861 562’631 520’722 1’134’362 1’573’742 1’591’283 1’540’425
China, Hong Kong SAR
1’925’106 4’431’899 26’416 5’030 1’419’226 .. .. ..
Ireland 68’876 919’305 972’017 1’101’850 1’130’290 1’009’358 871’749 723’828
Canada 117’428 .. .. 5’406’626 188’853 37’654 33’139 ..
United Kingdom
91’940 74’340 66’641 203’575 261’110 243’381 889’150 409’197
Italy 455’887 313’906 1’820 678 3’061 1’090 4’928 1’219
Netherlands 48’952 .. 2’510 17’515 94 2’025’382 63’164 ..
Brazil .. 236 891’893 135’244 .. .. 302’179 255’446
Thailand 128’840 160’353 172’444 .. 232 723 450’384 364’969
.. missing dataSource: UN Comtrade (SITC 28793 Rev. 4)

51Annex
Country 2017 2018
China 237’940’317 398’037’853
United States 112’015’998 101’966’815
Chile 99’171’292 95’454’632
Russian Federation 62’751’826 67’276’467
Belgium 42’483’567 38’001’878
Canada 5’385’377 68’053’619
Netherlands 14’413’289 17’667’344
United Kingdom 3’922’287 4’750’848
India 2’072’645 2’566’532
France 2’117’133 2’467’298
United Arab Emirates 2’134’120 1’606’936
Japan 984’986 805’178
Slovenia 1’357’007 429’579
Switzerland 515’118 846’535
Spain 965’340 319’669
Singapore 964’734
Poland 495’393 270’255
Latvia 712’531
Turkey 163’303 546’903
China, Hong Kong SAR 683’317 796
.. missing dataSource: UN Comtrade (HS code 17 - 282520)
Table 18. Leading exporters of lithium oxide and Hydroxide by value (Dollars)
..
..

52 COMMODITIES AT A GLANCE - Special issue on strategic battery raw materials
Table 19. Leading importers of lithium oxide and Hydroxide by value (Dollars)
Country 2017 2018
Japan 218’603’702 279’701’381
Republic of Korea 132’536’916 229’292’522
Belgium 38’689’575 32’246’548
India 35’928’954 34’747’879
United States 28’562’739 18’534’248
China 15’379’272 20’498’745
France 10’880’953 13’555’752
Canada 8’013’530 11’138’739
Thailand 11’035’617 6’807’673
United Kingdom 7’717’008 6’938’174
Other Asia, nes 9’945’444 4’051’262
Spain 5’870’154 7’725’644
United Arab Emirates 4’995’876 7’419’569
Turkey 5’657’267 4’877’051
Singapore .. 9’038’735
Slovenia 5’174’532 3’540’761
Sweden 3’943’114 4’642’451
South Africa 4’476’130 3’935’566
Netherlands 5’163’908 3’072’664
Russian Federation 2’114’239 4’382’582
.. missing dataSource: UN Comtrade (HS code 17 - 260500)

53
Country 2015 2016 2017 2018
Japan 82’423’111 81’631’043 89’728’795 127’916’382
USA 61’649’538 49’766’371 61’384’583 67’653’412
Germany 41’971’835 45’920’641 43’533’597 58’048’004
Republic of Korea 29’403’990 30’085’488 43’862’236 81’360’807
China 20’517’203 18’321’647 29’367’408 55’373’535
India 21’318’498 19’282’833 22’086’541 30’417’231
Austria 15’928’249 14’785’814 15’686’076 23’335’993
Poland 7’227’568 8’109’305 12’909’736 15’721’386
Turkey 8’302’168 8’824’929 11’330’838 11’839’649
Belgium 8’445’944 8’990’198 9’175’285 12’462’631
Netherlands 9’895’090 9’083’738 12’015’428 6’648’787
Malaysia 14’375’028 15’303’250 4’472’738 2’795’605
Other Asia, nes 6’510’876 7’967’696 10’197’591 10’021’027
Italy 7’657’256 6’930’810 7’899’748 8’535’326
United Kingdom 5’934’534 5’974’958 7’051’431 7’903’329
France 5’235’469 5’589’575 7’668’518 7’202’765
Spain 6’341’650 4’220’009 5’972’535 6’926’688
Russian Federation 8’995’061 4’702’622 4’854’494 4’814’038
Canada 4’798’044 5’526’762 7’319’020 5’489’831
Czechia 5’525’687 4’903’706 4’578’374 6’239’446
Source: UN Comtrade SITC Rev.4, 27822
Table 20. Leading Importers of Natural Graphite by value (Dollars)
Annex

54 COMMODITIES AT A GLANCE - Special issue on strategic battery raw materials
Country 2015 2016 2017 2018
China 246’369’345 228’474’530 265’570’428 351’663’809
Brazil 29’406’397 28’270’006 29’590’823 32’926’686
Germany 24’849’271 26’716’892 27’138’619 30’398’611
United States 21’649’862 21’131’438 24’831’072 25’108’685
Canada 13’942’603 13’802’097 18’028’373 17’556’753
Japan 18’340’956 15’165’967 13’624’995 9’541’147
Netherlands 8’733’117 5’855’277 14’887’228 9’013’012
Madagascar 5’980’617 7’367’925 7’093’749 13’003’394
Austria 6’252’042 4’233’485 4’450’271 6’541’660
Ukraine 4’151’802 4’176’666 7’106’896 4’825’386
Mexico 4’952’617 4’005’520 5’615’335 5’645’631
Czechia 5’378’768 4’704’125 4’624’302 4’490’219
United Kingdom 4’604’951 4’690’090 4’374’787 4’206’134
Slovakia 12’204’731 358’271 1’098’054 1’532’133
Belgium 1’136’865 3’168’073 4’272’983 6’549’040
Sri Lanka 3’904’090 4’587’526 4’733’557 ..
Zimbabwe 3’720’853 3’444’387 626’139 103’806
Russian Federation 2’292’253 1’105’044 1’431’724 2’530’812
Republic of Korea 1’122’674 1’281’918 1’150’018 1’446’380
Sweden 812’741 1’007’282 1’471’588 1’583’732
.. missing dataSource: UN Comtrade SITC Rev.4, 27822
Table 21. Leading Exporters of Natural Graphite by value (Dollars)

55
Country 2012 2013 2014 2015 2016 2017 2018
China 2’185’743’661 3’192’360’765 2’718’871’323 1’994’855’380 2’074’642’896 4’005’516’223 5’827’259’479
India 486’729’752 423’690’720 610’768’585 318’159’311 241’533’719 776’563’641 744’386’917
Republic of Korea 292’562’232 364’891’025 301’209’832 220’278’548 168’004’375 324’614’568 416’574’708
Japan 273’180’095 262’983’457 234’248’366 198’179’959 145’255’080 310’953’767 349’308’695
Norway 215’333’985 218’863’299 210’133’784 188’214’854 132’520’301 290’403’939 330’289’993
Ukraine 314’061’261 127’378’850 160’282’026 186’121’196 132’005’788 223’440’049 182’796’197
Russian Federation 137’642’140 172’953’958 141’794’127 103’539’862 107’680’885 212’932’870 364’822’332
United States 115’081’680 138’114’299 91’831’690 98’985’367 45’825’296 78’594’907 131’998’710
Spain 78’242’719 117’083’629 111’505’026 65’585’570 58’904’353 148’275’148 122’713’170
France 90’425’005 88’693’210 49’377’546 52’634’246 51’996’240 86’776’376 106’946’941
Malaysia 775’398 90’890 324’708 14’310’396 44’374’512 242’773’175 377’733’760
Georgia 51’564’749 51’291’453 42’692’621 24’188’617 11’845’549 18’024’373 31’237’966
Mexico 34’912’180 10’853’699 25’806’192 20’374’562 21’695’482 40’223’487 78’866’225
Saudi Arabia 31’676’840 30’415’771 43’717’711 13’173’075 12’105’348 42’370’412 40’463’083
Viet Nam 19’631’465 24’229’040 47’761’595 25’843’911 27’386’366 44’308’712 ..
Australia 13’242’966 18’602’156 25’664’882 19’934’290 825’826 43’286’594 30’551’926
Slovakia 37’443’373 21’225’729 7’724’925 3’511’112 1’883’754 8’710’652 4’741’488
Germany 15’393’571 14’763’295 13’577’713 11’742’216 11’020’367 14’282’625 14’676’613
Belgium 13’013’018 13’112’535 12’589’842 11’370’469 11’339’481 14’734’516 18’269’473
Poland 2’260’168 2’717’284 16’783’087 16’945’707 12’046’298 26’799’018 26’921’579
.. missing dataSource: UN Comtrade SITC Rev.4, 2877
Table 22. Leading importers of manganese ores and concentrates by value (Dollars)
Annex

56 COMMODITIES AT A GLANCE - Special issue on strategic battery raw materials
Country 2012 2013 2014 2015 2016 2017 2018
South Africa 1’199’259’481 1’567’249’267 1’643’561’400 1’128’108’357 1’401’222’018 2’527’612’962 3’507’438’383
Australia 1’245’713’484 1’489’629’154 1’287’859’750 792’386’799 524’321’442 .. ..
Brazil 201’122’925 262’463’140 229’453’494 149’146’661 201’815’071 365’636’402 406’305’644
Ghana 104’310’245 134’562’488 .. .. 100’662’700 155’381’119 288’074’846
United-Republic of Tanzania 83’526’388 181’082 59’567 .. 25 52 5’690
Kazakhstan 79’797’730 103’003’452 80’053’982 20’091’092 20’869’168 49’139’570 33’436’417
Malaysia 45’720’478 55’189’758 40’773’875 28’900’040 34’097’909 23’192’848 23’070’582
Côte d’Ivoire 14’098’584 20’133’257 29’601’048 20’114’717 12’846’083 51’386’230 103’107’842
France 36’182’057 37’691’673 11’238’504 9’041’706 21’756’685 40’227’601 20’385’275
Zambia 15’137’856 27’871’268 13’766’576 907’752 .. 31’270’750 26’967’243
Netherlands 18’229’920 22’661’834 21’267’818 11’301’620 3’677’033 15’037’083 14’784’138
China 23’931’584 9’503’096 2’181’729 4’800’537 7’096’775 7’991’302 12’363’905
Turkey 16’255’851 46’755’090 13’704’492 1’449’261 3’217’449 4’812’582 6’616’246
Mexico 3’592’455 11’065’299 15’269’908 12’045’462 21’733’254 16’160’946 9’975’085
Morocco .. .. .. 13’374’246 21’154’986 17’298’239 20’563’654
India 8’695’303 3’290’347 2’047’510 205’187 229’068 249’006 8’275’045
Indonesia 3’054’255 1’006’245 .. .. .. 1’953’750 2’325’264
Ukraine 3’036’469 6’356’970 4’163’996 11’362’175 2’804’580 4’729’873 3’828’887
Georgia 3’764’951 2’592’788 2’569’999 3’162’932 19’853’406 3’219’160 9’826’900
Namibia 3’277’567 5’813’883 13’845’625 1’983’810 755’107 1’976’390 1’557’898
.. missing dataSource: UN Comtrade SITC Rev.4, 2877
Table 23. Leading exporters of manganese ores and concentrates by value (Dollars)

57
2010 2011 2012 2013 2014 2015 2016 2017 2018
United States 33’000 33’000 33’000 33’000 37’000 23’000 21’000 23’000 38’000
Australia 1’400’000 1’400’000 1’200’000 1’200’000 1’100’000 1’100’000 1’000’000 1’200’000 1’200’000
Brazil 89’000 87’000 89’000 89’000 85’000 78’000 .. .. ..
Canada 150’000 130’000 140’000 140’000 250’000 240’000 270’000 250’000 250’000
China 80’000 80’000 80’000 80’000 80’000 80’000 80’000 .. 80’000
Democratic Republic of the Congo 3’400’000 3’400’000 3’400’000 3’400’000 3’400’000 3’400’000 3’400’000 3’500’000 3’400’000
Cuba 500’000 500’000 500’000 500’000 500’000 500’000 500’000 500’000 500’000
Morocco 20’000 20’000 20’000 20’000 .. .. .. .. ..
New Caledonia 370’000 370’000 370’000 370’000 200’000 200’000 130’000 .. ..
Papua New Guinea .. ... .. .. .. .. .. 51’000 56’000
Philippines .. .. .. .. 270’000 250’000 290’000 280’000 280’000
Russia 250’000 250’000 250’000 250’000 250’000 250’000 250’000 250’000 250’000
South Africa .. .. .. .. 32’000 31’000 29’000 29’000 24’000
Zambia 270’000 270’000 270’000 270’000 270’000 270’000 270’000 270’000 ..
Other Countries 740’000 990’000 1’100’000 1’100’000 750’000 610’000 690’000 560’000 640’000
.. missing dataSource: USGS
Table 24. World cobalt reserves (Tons)
Table 25. Lithium reserves (Tons of Lithium content)
2010 2011 2012 2013 2014 2015 2016 2017 2018
United States 38’000 38’000 38’000 38’000 38’000 38’000 38’000 35’000 35’000
Argentina 850’000 850’000 850’000 850’000 850’000 2’000’000 2’000’000 2’000’000 2’000’000
Australia 580’000 970’000 1’000’000 1’000’000 1’500’000 1’500’000 1’600’000 2’700’000 2’700’000
Brazil 64’000 64’000 46’000 46’000 48’000 48’000 48’000 48’000 54’000
Chile 7’500’000 7’500’000 7’500’000 7’500’000 7’500’000 7’500’000 7’500’000 7’500’000 8’000’000
China 3’500’000 3’500’000 3’500’000 3’500’000 3’500’000 3’200’000 3’200’000 3’200’000 1’000’000
Portugal 10’000 10’000 10’000 60’000 60’000 60’000 60’000 60’000 60’000
Zimbabwe 23’000 23’000 23’000 23’000 23’000 23’000 23’000 23’000 70’000
Source: USGS
Annex

58 COMMODITIES AT A GLANCE - Special issue on strategic battery raw materials
2010 2011 2012 2013 2014 2015 2016 2017 2018
Brazil 360’000 360’000 360’000 58’000’000 40’000’000 72’000’000 72’000’000 70’000’000 72’000’000
China 55’000’000 55’000’000 55’000’000 55’000’000 55’000’000 55’000’000 55’000’000 55’000’000 73’000’000
India 5’200’000 11’000’000 11’000’000 11’000’000 11’000’000 8’000’000 8’000’000 8’000’000 8’000’000
Madagascar 940’000 940’000 940’000 940’000 940’000 940’000 1’600’000 1’600’000 1’600’000
Mexico 3’100’000 3’100’000 3’100’000 3’100’000 3’100’000 3’100’000 3’100’000 3’100’000 3’100’000
Mozambique .. .. .. .. .. .. 13’000’000 17’000’000 17’000’000
Tanzania .. .. .. .. .. .. .. 17’000’000 17’000’000
Turkey .. .. .. .. .. 90’000’000 90’000’000 90’000’000 90’000’000
Vietnam .. .. .. .. .. .. .. .. 7’600’000
.. missing dataSource: USGS
Table 26. Graphite reserves (Tons)
Table 27. Manganese reserves (Thousands of tons)
2010 2011 2012 2013 2014 2015 2016 2017 2018
Australia 93’000 93’000 97’000 97’000 97’000 91’000 91’000 94’000 99’000
Brazil 110’000 110’000 110’000 54000 54’000 50’000 116’000 120’000 110’000
China 44’000 44’000 44’000 44’000 44’000 44’000 43’000 48’000 54’000
Gabon 52’000 21’000 27’000 24’000 24’000 22’000 22’000 20’000 65’000
Ghana .. .. .. .. .. 13’000 12’000 13’000 13’000
India 56’000 56’000 49’000 49’000 52’000 52’000 52’000 34’000 33’000
Kazakhstan, concentrate .. .. 5’000 5’000 5’000 5’000 5’000 5’000 5’000
Mexico 4’000 4’000 5’000 5’000 5’000 5’000 5’000 5’000 5’’000
South Africa 120’000 150’000 150’000 150’000 150’000 200’000 200’000 200’000 230’000
Ukraine, concentrate 140’000 140’000 140’000 140’000 140’000 140’000 140000 140’000 140’000
.. missing data
Source: USGS

59
2010 2011 2012 2013 2014 2015 2016 2017 2018*
Argentina 2’950 2’950 2’700 2’500 3’200 3’600 5’800 5’700 6’200
Australia 9’260 12’500 12’800 12’700 13’300 14’100 14’000 40’000 51’000
Brazil 160 320 150 400 160 200 200 200 600
Chile 10’510 12’900 13’200 11’200 11’500 10’500 14’300 14’200 16’000
China 3’950 4’140 4’500 4’700 2’300 2’000 2’300 6’800 8’000
Portugal 800 820 560 570 300 200 400 800 800
Zimbabwe 470 470 1’060 1’000 900 900 1’000 800 1’600
* Estimates for 2018 Source: USGS
Table 29. World Manganese mine production (Thousands of tons)
Table 28. World Lithium mine production (Tons of Lithium content)
2010 2011 2012 2013 2014 2015 2016 2017 2018*
Australia 3’100 3’200 3’080 2’980 3’050 2’450 2’240 2’820 3’100
Brazil 780 1’210 1’330 1’120 1’040 1’090 1’080 1’160 1’200
China 2’600 2’800 2’900 3’000 3’000 3’000 2’330 1’700 1’800
Gabon 1’420 1’860 1’650 1’970 1’860 2’020 1’620 2’190 2’300
Ghana .. .. .. 533 418 416 553 810 850
India 1’000 895 800 920 945 900 745 734 770
Kazakhstan, concentrate .. 390 380 390 385 222 212 168 170
Malaysia .. 225 429 430 378 201 266 478 510
Mexico 175 171 188 212 236 220 206 212 220
South Africa 2’900 3’400 3’600 4’300 5’200 5’900 5’300 5’400 5’500
Ukraine, concentrate 540 330 416 300 422 410 425 735 740
Other countries 1’340 1’740 920 597 740 678 681 898 940
.. missing data*Estimates for 2018Source: USGS
Annex

60 COMMODITIES AT A GLANCE - Special issue on strategic battery raw materials
2009 2010 2011 2012 2013 2014 2015 2016 2017 2018*
United States .. .. .. .. .. 120 760 690 640 500
Australia 4’600 3’850 3’900 5’880 6’400 5’980 6’000 5’500 5’030 4’700
Brazil 1’200 1’600 3’500 3’900 3’000 2’600 .. .. .. ..
Canada 4’100 4’600 7’100 6’630 6’920 6’570 6’900 4’250 3’800 3’800
China 6’000 6’500 6’800 7’000 7’200 7’200 7’700 .. 3’100 3’100
Democratic Republic of the Congo 35’500 47’400 60’000 51’000 54’000 63’000 6’3000 64’000 73’000 90’000
Cuba 3’500 3’600 4’000 4’900 4’200 3’700 4’300 4’200 5’000 4’900
Madagascar .. .. .. .. .. 3’100 3’700 3’800 3’500 3’500
New Caledonia 1’000 1’000 3’200 2’620 3’190 4’040 3’680 3’300 .. ..
Morocco 1’600 2’200 2’200 1’800 .. .. .. .. 2’200 2’300
Papua New Guinea .. .. .. .. .. .. .. .. 3’310 3’200
Philippines .. .. .. .. 3’000 4’600 4’300 3’500 4’600 4’600
Russia 6’100 6’200 6’300 6’300 6’300 6’300 6’200 6’200 5’900 5’900
South Africa .. .. .. .. 3000 3000 3’000 3’000 2’300 2’200
Zambia 5’000 5’700 5’400 4’200 5’200 5’500 4’600 4’600 .. ..
Other countries 3’700 6’800 6’700 8’820 8’000 7’080 11’600 8’300 7’650 7’000
.. missing dataSource: USGS
Table 30. World Cobalt mine production (Tons)

61
Table 31. World Graphite mine production (Tons)
2010 2011 2012 2013 2014 2015 2016 2017 2018*
Brazil 76’000 73’000 110’000 95’000 80’000 80’000 95’000 90’000 95’000
Canada 25’000 25’000 25’000 20’000 30’000 30’000 30’000 40’000 40’000
China 600’000 800’000 800’000 750’000 780’000 780’000 780’000 625’000 630’000
India 140’000 150’000 160’000 170’000 170’000 170’000 149’000 35’000 35’000
Korea, North 30’000 30’000 30’000 30’000 30’000 30’000 6’000 5’500 6’000
Madagascar 5’000 4’000 4’000 4’000 5’000 5’000 8’000 9’000 9’000
Mexico 7’000 7’000 8’000 7’000 22’000 22’000 4’000 9’000 9’000
Mozambique .. .. .. .. .. .. .. 300 20’000
Norway 2’000 2’000 2’000 2’000 8’000 8’000 8’000 15’500 16’000
Pakistan .. .. .. .. .. .. 14’000 14’000 14’000
Russia .. 14’000 14’000 14’000 15’000 15’000 19’000 17’000 17’000
Sri Lanka 8’000 4’000 4’000 4’000 4’000 4’000 4’000 3’500 4’000
Turkey .. 10’000 5’000 5’000 29’000 32’000 4’000 2’300 2’000
Ukraine 6’000 6’000 6’000 6’000 5’000 5’000 15’000 20’000 20’000
Vietnam .. .. .. .. .. .. 5’000 5’000 5’000
Zimbabwe .. .. 6’000 4’000 7’000 7’000 6’000 1’580 2’000
Other countries 6’000 7’000 2’000 1’000 1’000 .. 2’000 4’120 6’200
.. missing data*Estimates for 2018Source: USGS
Annex

62 COMMODITIES AT A GLANCE - Special issue on strategic battery raw materials
COMMODITIES AT A GLANCE
– N° 1: Historical evolution of primary commodity prices and indices and price indices
– N° 2: Special issue on cotton in Africa
– N° 3: Special issue on energy
– N° 4: Special issue on food security
– N° 5: Special issue on rare earths
– N° 6: Special issue on gold
– N° 7: Édition spéciale sur l’or (in French)
– N° 8: Special issue on gum arabic
– N° 9: Special issue on shale gas
– N° 10: Special issue on coffee in East Africa
– N° 11: Édition spéciale sur le café en Afrique de l’Ouest et du Centre (in French)
– N° 12: Édition spéciale sur la gomme arabique en Afrique centrale et occidentale (in French)
– N° 13: Special issue on strategic battery raw materials
All published reports are available on-line on UNCTAD website: https://unctad.org/en/Pages/SUC/Commodities/SUC-Commodities-at-a-Glance.aspx

U N I T E D N AT I O N S C O N F E R E N C E O N T R A D E A N D D E V E L O P M E N T
No. 13
COMMODITIES AT A GLANCESpecial issue on strategic battery raw materials
Layout and Printing at United Nations, Geneva – 1922587 (E) – February 2020 – 430 – UNCTAD/DITC/COM/2019/5