COMMITTEE, THE COMMITTEE OF THE REGIONS AND...
29
EN EN EUROPEAN COMMISSION Strasbourg, 24.10.2017 SWD(2017) 349 final PART 2/2 COMMISSION STAFF WORKING DOCUMENT Accompanying the document COMMUNICATION FROM THE COMMISSION TO THE EUROPEAN PARLIAMENT, THE COUNCIL, THE EUROPEAN ECONOMIC AND SOCIAL COMMITTEE, THE COMMITTEE OF THE REGIONS AND THE EUROPEAN INVESMENT BANK A stronger and renewed strategic partnership with the EU's outermost regions {COM(2017) 623 final}
-
Upload
nguyenduong -
Category
Documents
-
view
214 -
download
0
Transcript of COMMITTEE, THE COMMITTEE OF THE REGIONS AND...

EN EN
EUROPEAN COMMISSION
Strasbourg, 24.10.2017
SWD(2017) 349 final
PART 2/2
COMMISSION STAFF WORKING DOCUMENT
Accompanying the document
COMMUNICATION FROM THE COMMISSION TO THE EUROPEAN
PARLIAMENT, THE COUNCIL, THE EUROPEAN ECONOMIC AND SOCIAL
COMMITTEE, THE COMMITTEE OF THE REGIONS AND THE EUROPEAN
INVESMENT BANK
A stronger and renewed strategic partnership with the EU's outermost regions
{COM(2017) 623 final}

54
Annex III — Regional Factsheets
Content
This Annex includes a regional factsheet for each of the outermost regions which provides a brief description of
the region focusing on recent socioeconomic trends. Information such as demography, employment, education,
Gross Domestic Product (GDP) and Gross Added Value is featured. It also includes the Regional Competitiveness
Index (RCI), to compare the competitiveness of the regions. The EU funding for 2014 – 2020 in each region is also
presented.
Data source
Maps, RegioGIS maps
Socio-economic characteristics, EUROSTAT
Regional Competitiveness Index
(http://ec.europa.eu/regional_policy/en/information/maps/regional_competitiveness/)
EU Funding 2014 – 2020, Open Source data
Regional Competitiveness Index — definitions and concepts1
The RCI adapts and builds on the methodology developed by the Global Competitiveness Index -World Economic
Forum. In this context, regional competitiveness is defined as the ability of a region to offer an attractive and
sustainable environment for firms and residents to live and work and is based on the statistical NUTS 2
(Nomenclature of Units for Territorial Statistics)2.
The RCI builds on 11 pillars to assess the strengths and weaknesses of a region. The pillars, which describe
different aspects of competitiveness, are:
1) Institutions;
2) Macroeconomic stability;
3) Infrastructure;
4) Health;
5) Basic education;
6) Higher education, training and lifelong learning;
7) Labour market efficiency;
8) Market size;
9) Technological readiness;
10) Business sophistication;
11) Innovation.
These pillars are classified into three groups: Basic (1 to 5), Efficiency (6 to 8) and Innovation (9 to 11).
The scores of each indicator can be compared between regions in the EU or with the EU average. However, some
indicators are not well adapted to the specificities of the outermost regions and will not be considered in this
analysis (infrastructure, basic education). The table on the regional factsheets shows the score and the ranking of
1 http://ec.europa.eu/regional_policy/sources/docgener/work/201701_regional_competitiveness2016.pdf 2 NUTS 2 regions that are part of the same functional urban area are combined.

55
the region within the 263 European NUTS 2 regions for which the indicators were calculated3 (the indicator
'macroeconomic stability' is described at country level only). The spider graph positions the score obtained for
each indicator in the region in relation to the EU average.
The indicator 'stage of development' is based on the average 2012 - 2014 GDP per head in purchasing power
standard (PPS) expressed as an index (EU-28 = 100). The five development stages are defined by the following
thresholds: Stage 1: <50; Stage 2: 50-75; Stage 3: 75-90; Stage 4: 90-110; and Stage 5: >110.
European Union funding in the outermost regions 2014 - 2020
The values presented refer to the regional operational programmes. The funding contribution from the national
programmes, namely for the Canary Islands, is not included.
The YEI total budget includes the budget earmarked to the respective regions from the national YEI programme;
for Guadeloupe and Martinique, it also includes the YEI allocations in their regional programmes. The amount
includes the ESF matching part. The YEI budget is expected to be further increased for all eligible regions,
following the mid-term revision of the MFF in June 20174.
On the EMFF, the allocations for the classic measures are based on informal communication by the Member
States. The values presented are indicative and non-binding. Spain and France set up national measures, covering
also the outermost regions, which are not included.
3 http://ec.europa.eu/regional_policy/en/information/maps/regional_competitiveness/#2 4 Proposal for a Regulation of the European Parliament and of the Council amending Regulation (EU) No 1303/2013 as regards the
changes to the resources for economic, social and territorial cohesion and to the resources for the investment for growth and jobs goal
and for the European territorial cooperation goal, COM(2017) 565, 5.10.2017, extending the YEI to the years from 2017 to 2020 by a
total amount of EUR 1.2 billion in current prices for the specific allocation for the YEI, which needs to be complemented by at least
EUR 1.2 billion from targeted ESF investment.

56
Azores
Background
Socioeconomic characteristics
The GDP per capita in the Azores slightly declined (2013 – 2015), remaining lower than the national average. The population is also
decreasing (2013-2016), along with an increase in the share of people aged 65+ and a decrease in the share of young people. However,
the population remains younger than at national and EU level. The unemployment and long-term unemployment rates have significantly
decreased between 2013 and 2016. Although close to the national rates, they are still higher than the EU average. The rate of young
people not in employment, education or training was in decline between 2014 and 16. However it remains much higher than the national
and EU average. All the education indicators show that the situation has been improving since 2013 (fewer early school leavers, more
secondary and higher education graduates). However, it remains less favourable than at the national and EU level.
1 The GDP value for 2016 is not available. In 2015 for Portugal was 77 %. 2 Young people not in employment, education or training; 3 % of population aged 18-24
Basin Macaronesia
Islands Corvo, Faial, Flores, Graciosa, Pico, Santa Maria, São Jorge, São Miguel,
Terceira
Main cities
Ponta Delgada, Angra do Heroísmo, Horta
Area
2 322 km2
Population (2016)
245 766
Population density (N°/Km²)
105.9
Distance to Portuguese mainland (Lisbon)
1 500 km
Açores PT EU
2012 2013 2014 2015 2016 2016 2016
GDP (PPS per inhabitant in % of EU 28) 69 70 69 68 - 771 100
Population
Total population 247 194 247 549 247 440 246 353 245 766 10 341 330 510 284 430
Population aged ≥ 65 years (%) 12.9 13.0 13.0 13.2 13.5 20.7 19.2
Population aged — 25 years (%) 32.1 31.6 31.2 30.7 30.1 24.8 26.7
Unemployment
Unemployment rate 15-74 (%) 15.3 17.1 16.4 12.8 11.2 11.2 8.6
Long-term unemployment (% of active pop) 7.5 9.8 9.3 7.7 6.5 7.1 4.0
Unemployment rate 15-24 (%) 38.9 39.6 41.5 - - 28.0 18.7
Not in employment, education or training 2,3
22.1 24.0 24.1 20.1 19.2 10.6 11.5
Education
Early school leavers aged 18-24 years (%)3
34.1 35.8 32.8 28.8 26.9 14.0 10.7
Secondary education attainment 25-64 years (%)
12.3 13.2 13.7 16.0 17.4 23.1 46.3
Tertiary education attainment 25-64 years (%) 12.1 11.9 13.0 14.3 14.8 23.9 30.7

57
Regional Competitiveness Index (RCI)
Score (0-100)
Rank
GDP per capita (PPS)* 71 198/263
Stage of development (1-5) 2
Basic dimension - -
Institutions 53.5 142/263
Macroeconomic stability 37.9 26/28
Health 59.5 211/263
Efficiency dimension 27.1 255/263
Higher Education and lifelong learning 29.2 260/263
Labour Market Efficiency 40.4 220/263
Market Size 5.3 249/263
Innovation dimension 25.4 217/263
Technological Readiness 59 165/263
Business Sophistication 12 241/263
Innovation 15.1 235/263
10%
8%
4%
25% 20%
33%
Economic Structure in 2014 (% of total GVA)
Agriculture
Industry
Construction
Trade, transport (incl.Tourism)
Financial and otheractivities
Other services
14%
8%
6%
24% 7%
41%
% of employment by economic sector (2014)
Agriculture
Industry
Construction
Trade, transport (incl.Tourism)
Financial and otheractivities
Other services
*EU 28=100
0
25
50
75
100Institutions
Macroeconomicstability
Health
Higher Educationand lifelong
learning
Labour MarketEfficiency
Market Size
TechnologicalReadiness
BusinessSophistication
Innovation
Azores UE

58
European Union funding for 2014 - 2020
European Regional Development Fund
(ERDF) € 767.5
Specific additional allocation (ERDF) €
57.5
Youth Employment Initiative
€ 10.6
European Social Fund
€ 314.7
European Agricultural Fund
for Rural Development
€ 295.3
amounts in millions
€ 1.45 billion
Some of the expected results of the EU contribution are the following:
supporting around 1 045 businesses
directly creating 2 845 jobs
increasing by 15% the maritime traffic in the archipelago
170 000 citizens benefiting from improved health care services
2 200 persons benefiting from programmes tackling early school leaving
4 000 adults in school and/or professional certification courses
187 young farmers and 930 farms benefitting from modernisation aid
In addition:
- The European cooperation programme Spain-Portugal (Madeira, Canary Islands and Azores (MAC)) contributes with
EUR 126.5 million.
- The European Maritime Fisheries Fund contributes with EUR 56.9 million for Madeira and the Azores and a specific
envelope of EUR 30.7 million for the Azores to compensate for additional costs.
- The Programme of Options Specifically Relating to Remoteness and Insularity (POSEI), in the agricultural sector can
support the two Portuguese outermost regions up to an annual ceiling of EUR 106.2 million.

59
Canary Islands
Background
Socioeconomic characteristics
The GDP per capita decreased (2012 – 2015), remaining lower than the national rate. In the same period, the population slightly increased,
together with the share of people over 65+. The share of young people decreased (2012-2016); a share higher than the national average
but lower than the EU average. The trend for both unemployment and long-term unemployment rates is to decrease (2013 - 2016), after
reaching a peak in 2013 and 2014. However, in both cases the rates are significantly higher than the national and EU average. The youth
unemployment and the not in employment, education or training rates also decreased (2013-2016). However the rates remain higher than
the national rates. In the education sector, performance has been improving in the last years: fewer early school leavers, more secondary
and higher education graduates. On early school leavers and secondary education attainment, the situation is better than the national
level. That said, on the higher education attainment, the rate is lower than the national rate.
1 The value for 2016 is not available. For 2015, the GDP for Spain was 90 %. 2 Young people not in employment, education or training; 3 % of population aged 18-24
Basin
Macaronesia
Main islands El Hierro, La Gomera, La Palma, Tenerife, Gran
Canaria, Fuerteventura, Lanzarote
Main cities Santa Cruz de Tenerife, Las Palmas de Gran
Canaria
Area 7 447 km2
Population 2 135 722
Population density (N°/Km²)
282.25
Distance to Spanish mainland (Madrid)
2 000 km
ES EU
2012 2013 2014 2015 2016 2016 2016
GDP (PPS per inhabitant in % of EU 28) 78 76 75 74 - 90 1 100
Population
Total population 2 085 938 2 105 234 2 114 845 2 126 144 2 135 722 46 445 828 510 284 430
Population aged ≥ 65 years (%) 13.9 14.3 14.6 15.0 15.3 24.7 19.2
Population aged — 25 years (%) 25.8 25.4 25.0 24.6 24.3 18.7 26.7
Unemployment
Unemployment rate 15-74 (%) 32.6 33.7 32.4 29.1 26.1 19.6 8.6
Long-term unemployment (% of active pop)
15.1 18.7 19.4 17.4 14.2 9.5 4.0
Unemployment rate 15-24 (%) 62.3 65.3 57.4 53.5 51.3 44.4 18.7
Not in employment, education or training
2,3
23.3 24.2 19.8 17.8 16.0 14.6 11.5
Education
Early school leavers aged 18-24 years (%)
3
28.0 27.5 23.8 21.9 18.9 19.0 10.7
Secondary education attainment 25-64 years (%)
22.9 22.5 22.4 24.1 24.5 22.6 46.3
Tertiary education attainment 25-64 years (%)
26.0 27.3 27.0 26.6 29.4 35.7 30.7
60
Regional Competitiveness Index (RCI)
Score (0-100)
Rank
GDP per capita (PPS)* 79 174/263
Stage of development (1-5) 3
Basic dimension - -
Institutions 39.5 184/263
Macroeconomic stability 48.5 24/28
Health 89.6 23/263
Efficiency dimension 35.9 232/263
Higher Education and lifelong learning
49.7 219/263
Labour Market Efficiency 27.1 240/263
Market Size 12.4 219/263
Innovation dimension 29.9 201/263
Technological Readiness 57.2 169/263
Business Sophistication 26.2 192/263
Innovation 11.5 244/263
1% 8% 5%
36% 24%
26%
Economic Structure in 2014 (% of total GVA)
Agriculture
Industry
Construction
Trade, transport(incl. Tourism)
Financial and otheractivities
Other services
0
25
50
75
100Institutions
Macroeconomicstability
Health
Higher Educationand lifelong
learning
Labour MarketEfficiency
Market Size
TechnologicalReadiness
BusinessSophistication
Innovation
Canary Islands UE
3% 5% 5%
43% 13%
31%
% of total employment by economic sector (2014)
Agriculture
Industry
Construction
Trade, transport(incl. Tourism)
Financial andother activities
Other services

61
European Union funding for 2014 - 2020
European Regional Development Fund
(ERDF) € 513.6
Specific additional allocation (ERDF)
€ 484.1
European Social Fund
€ 162.4
Youth Employment Initiative € 117.2
European Agricultural Fund
for Rural Development
€ 157.5
amounts in millions
€ 1.43 billion
Some of the expected results of the EU contribution are the following:
doubling the number of businesses cooperating with research centres
covering the entire population by high-speed broadband
reduction of the delay of surgical interventions by up to 90 days
covering half of the school population by e-learning services
offering vocational training and guidance to 32 000 people
1480 MW (up from 349.1 MW) renewable energy generation power
240 young farmers and 792 farms benefiting from modernisation aid
In addition:
- The European cooperation programme Spain-Portugal (Madeira, Canary Islands and Azores) contributes with EUR
126.5 million.
- The European Maritime Fisheries Fund contributes with EUR 22 million and an additional specific envelope of EUR
60.9 million for the Canary Islands to compensate for additional costs.
- The Programme of Options Specifically Relating to Remoteness and Insularity (POSEI), in the agricultural sector can
support the Canary Islands up to an annual ceiling of EUR 268.4 million.
62
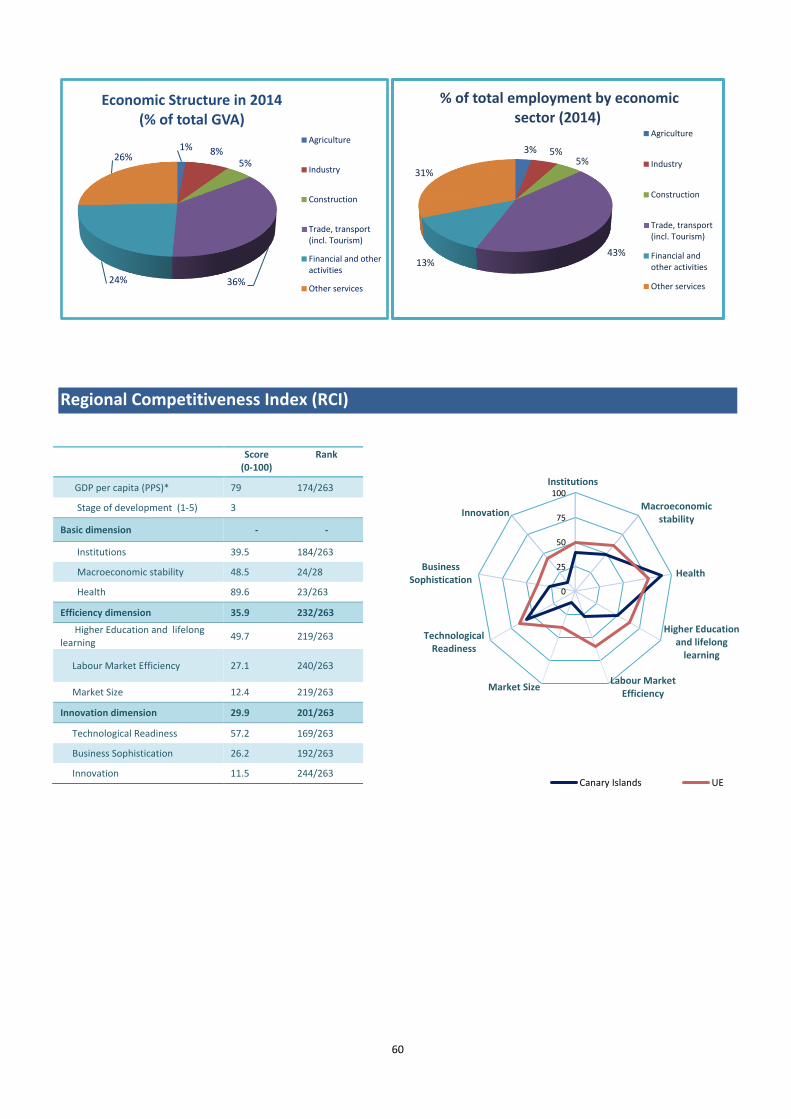
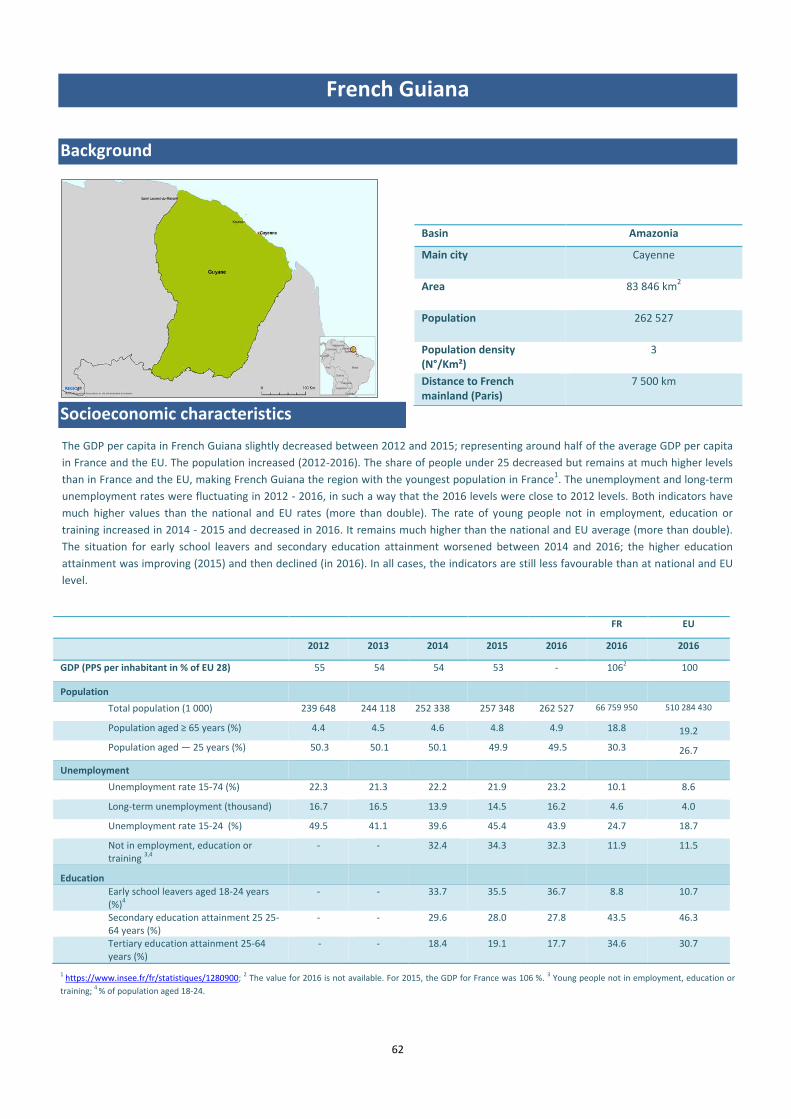
French Guiana
Background
Socioeconomic characteristics
1 https://www.insee.fr/fr/statistiques/1280900; 2 The value for 2016 is not available. For 2015, the GDP for France was 106 %. 3 Young people not in employment, education or
training; 4 % of population aged 18-24.
Basin Amazonia
Main city Cayenne
Area 83 846 km2
Population 262 527
Population density (N°/Km²)
3
Distance to French mainland (Paris)
7 500 km
FR EU
2012 2013 2014 2015 2016 2016 2016
GDP (PPS per inhabitant in % of EU 28) 55 54 54 53 - 1062 100
Population
Total population (1 000) 239 648 244 118 252 338 257 348 262 527 66 759 950 510 284 430
Population aged ≥ 65 years (%) 4.4 4.5 4.6 4.8 4.9 18.8 19.2
Population aged — 25 years (%) 50.3 50.1 50.1 49.9 49.5 30.3 26.7
Unemployment
Unemployment rate 15-74 (%) 22.3 21.3 22.2 21.9 23.2 10.1 8.6
Long-term unemployment (thousand) 16.7 16.5 13.9 14.5 16.2 4.6 4.0
Unemployment rate 15-24 (%) 49.5 41.1 39.6 45.4 43.9 24.7 18.7
Not in employment, education or training
3,4
- - 32.4 34.3 32.3 11.9 11.5
Education
Early school leavers aged 18-24 years (%)
4
- - 33.7 35.5 36.7 8.8 10.7
Secondary education attainment 25 25-64 years (%)
- - 29.6 28.0 27.8 43.5 46.3
Tertiary education attainment 25-64 years (%)
- - 18.4 19.1 17.7 34.6 30.7
The GDP per capita in French Guiana slightly decreased between 2012 and 2015; representing around half of the average GDP per capita
in France and the EU. The population increased (2012-2016). The share of people under 25 decreased but remains at much higher levels
than in France and the EU, making French Guiana the region with the youngest population in France1. The unemployment and long-term
unemployment rates were fluctuating in 2012 - 2016, in such a way that the 2016 levels were close to 2012 levels. Both indicators have
much higher values than the national and EU rates (more than double). The rate of young people not in employment, education or
training increased in 2014 - 2015 and decreased in 2016. It remains much higher than the national and EU average (more than double).
The situation for early school leavers and secondary education attainment worsened between 2014 and 2016; the higher education
attainment was improving (2015) and then declined (in 2016). In all cases, the indicators are still less favourable than at national and EU
level.

63
Regional Competitiveness Index (RCI)
Score (0-100)
Rank
GDP per capita (PPS)* 58 234/263
Stage of development (1-5) 2
Basic dimension - -
Institutions 44.7 164/263
Macroeconomic stability 61.0 18/28
Health 39.8 242/263
Efficiency dimension 0 263/263
Higher Education and lifelong learning
0 261/263
Labour Market Efficiency 8.6 251/263
Market Size 0 263/263
Innovation dimension 33.9 183/263
Technological Readiness 54.3 179/263
Business Sophistication 29.2 171/263
Innovation 20.9 205/263
4% 11%
8%
21%
20%
36%
Economic Structure in 2014 (% of total GVA)
Agriculture
Industry
Construction
Trade, transport(incl. Tourism)
Financial and otheractivities
Other services
0
25
50
75
100Institutions
Macroeconomicstability
Health
HigherEducation and
lifelong learning
Labour MarketEfficiency
Market Size
TechnologicalReadiness
BusinessSophistication
Innovation
French Guiana UE
2% 8%
7%
19%
11% 53%
% of employment by economic sector (2014)
Agriculture
Industry
Construction
Trade, transport(incl. Tourism)
Financial and otheractivities
Other services
64
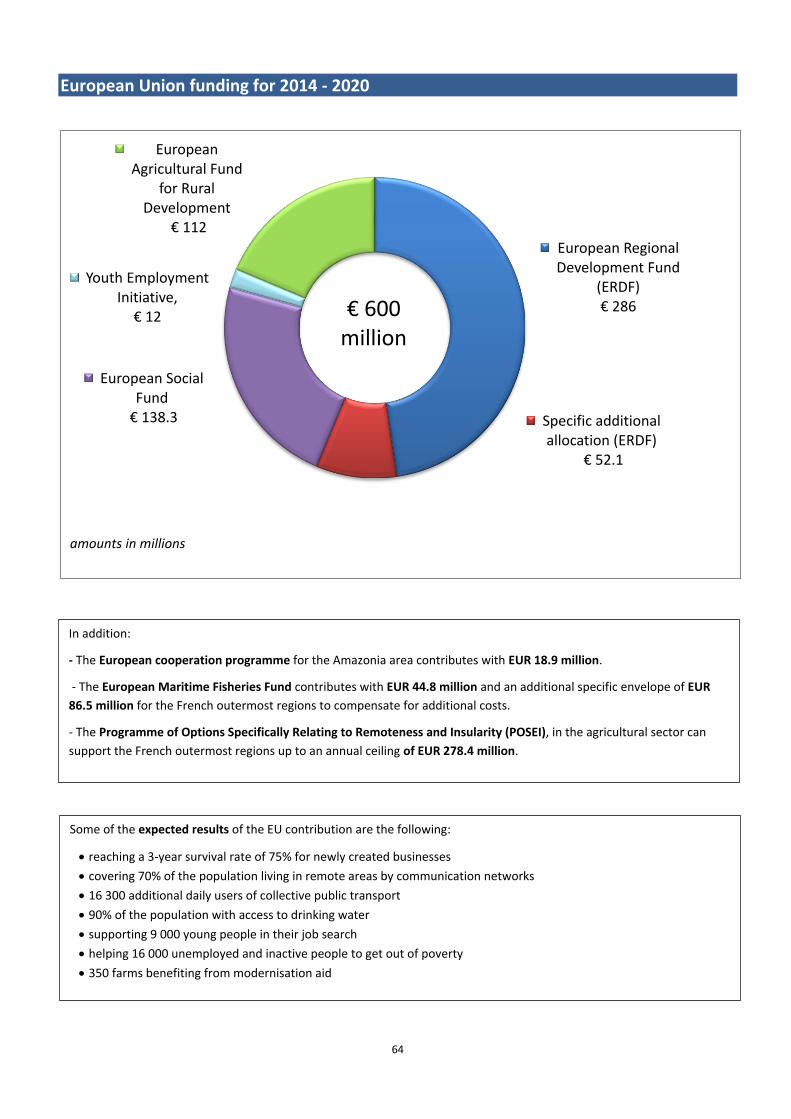
European Union funding for 2014 - 2020
European Regional Development Fund
(ERDF) € 286
Specific additional allocation (ERDF)
€ 52.1
European Social Fund
€ 138.3
Youth Employment Initiative,
€ 12
European Agricultural Fund
for Rural Development
€ 112
€ 600 million
amounts in millions
Some of the expected results of the EU contribution are the following:
reaching a 3-year survival rate of 75% for newly created businesses
covering 70% of the population living in remote areas by communication networks
16 300 additional daily users of collective public transport
90% of the population with access to drinking water
supporting 9 000 young people in their job search
helping 16 000 unemployed and inactive people to get out of poverty
350 farms benefiting from modernisation aid
In addition:
- The European cooperation programme for the Amazonia area contributes with EUR 18.9 million.
- The European Maritime Fisheries Fund contributes with EUR 44.8 million and an additional specific envelope of EUR
86.5 million for the French outermost regions to compensate for additional costs.
- The Programme of Options Specifically Relating to Remoteness and Insularity (POSEI), in the agricultural sector can
support the French outermost regions up to an annual ceiling of EUR 278.4 million.

65
Guadeloupe
Background
Socioeconomic characteristics
The GDP per capita in Guadeloupe decreased in 2012 - 2014 and then slightly increased in 2015. However, it is much lower than the
average GDP per capita in France and the EU. The population is also in decline, along with the share of young people; while the share of
people over 65+ is increasing. According to the NSEE1 forecasts this is expected to make Guadeloupe one of the ‘oldest’ regions in
France in 2040. The unemployment and long-term unemployment rates were fluctuating erratically in 2012 - 2016. They are both more
than double the national and EU rates. The rate of people not in employment, education or training has increased in 2014 - 2015 and
then decreased in 2016; remaining much higher than the national and EU average. The situation for early school leavers and secondary
education attainment worsened in 2014 - 2016; while higher education attainment improved in the same period. In all cases, the
indicators are worse than the national rates.
1 https://www.insee.fr/fr/statistiques/1280900; 2 The value for 2016 is not available. For 2015, the GDP for France was 106 % 3 Young people not in employment,
education or training; 4 % of population aged 18-24.
Basin Caribbean
Islands Guadeloupe, Marie Galante,
La Désirade, Les Saintes
Main city Basse-Terre
Area 1 705 km2
Population 429 849
Population density (N°/Km²)
245
Distance to French mainland (Paris)
6 800km
Guadeloupe FR EU
2012 2013 2014 2015 2016 2016 2016
GDP (PPS per inhabitant in % of EU 28) 72 67 67 69 - 1062 100
Population
Total population (1000) - 437 713 435 293 432 530 429 849 66 759 950 510 284 430
Population aged + 65 years (%) - 15.4 15.9 16.5 17.2 18.8 19.2
Population aged — 25 years (%) - 32.9 32.6 32.1 31.6 30.3 26.7
Unemployment
Unemployment rate 15-74 (%) 23.0 26.2 23.9 23.7 23.9 10.1 8.6
Long-term unemployment (% of active pop) 18.4 20.8 16.4 16.7 17.1 4.6 4.0
Unemployment rate 15-24 (%) 53.0 58.4 57.3 55.3. 46.7 24.7 18.7
Not in employment, education or training 3,4
- - 21.8 22.9 19.4 11.9 11.5
Education
Early school leavers aged 18-24 years (%)4 - - 13.8 16.0 18.1 8.8 10.7
Secondary education attainment 25-64 years (%)
- - 38.1 37.4 36.8 43.5 46.3
Tertiary education attainment 25-64 years (%)
- - 18.7 19.5 20.9 34.6 30.7
66
0
25
50
75
100Institutions
Macroeconomicstability
Health
HigherEducation and
lifelong learning
Labour MarketEfficiency
Market Size
TechnologicalReadiness
BusinessSophistication
Innovation
Guadeloupe UE
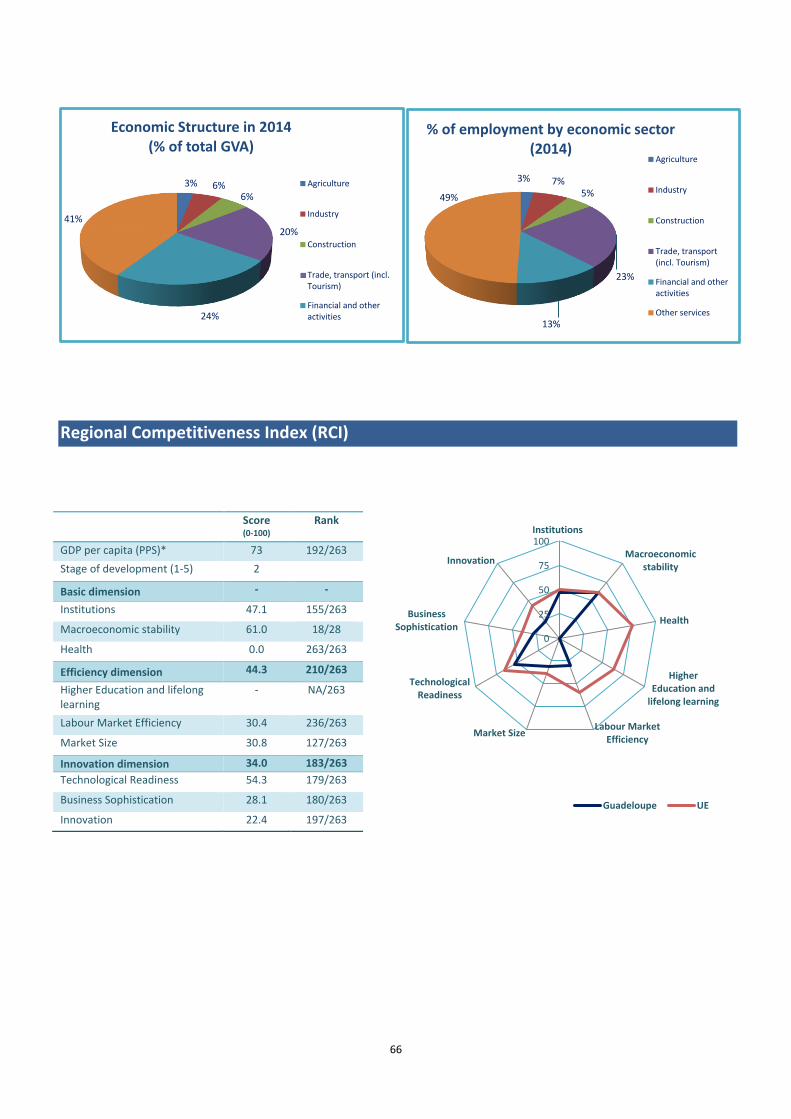
Regional Competitiveness Index (RCI)
Score (0-100)
Rank
GDP per capita (PPS)* 73 192/263
Stage of development (1-5) 2
Basic dimension - -
Institutions 47.1 155/263
Macroeconomic stability 61.0 18/28
Health 0.0 263/263
Efficiency dimension 44.3 210/263
Higher Education and lifelong learning
- NA/263
Labour Market Efficiency 30.4 236/263
Market Size 30.8 127/263
Innovation dimension 34.0 183/263
Technological Readiness 54.3 179/263
Business Sophistication 28.1 180/263
Innovation 22.4 197/263
3% 6% 6%
20%
24%
41%
Economic Structure in 2014 (% of total GVA)
Agriculture
Industry
Construction
Trade, transport (incl.Tourism)
Financial and otheractivities
3% 7% 5%
23%
13%
49%
% of employment by economic sector (2014)
Agriculture
Industry
Construction
Trade, transport(incl. Tourism)
Financial and otheractivities
Other services
* EU 28=100
67
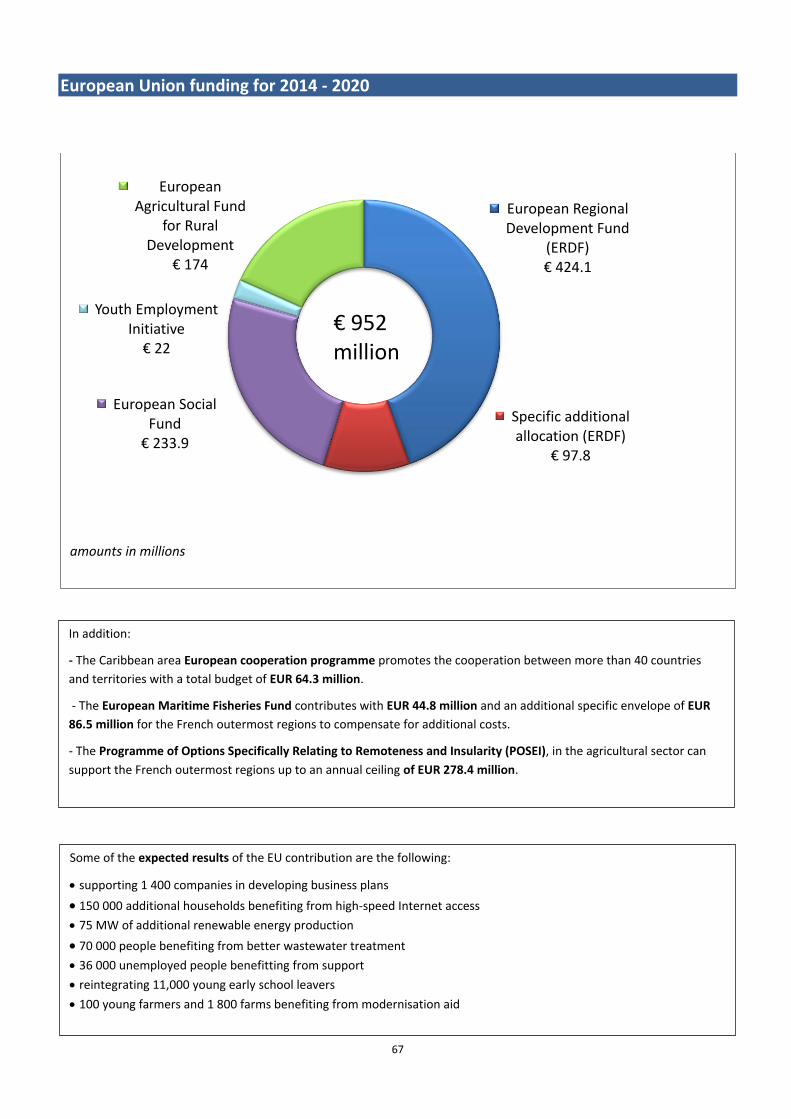
European Union funding for 2014 - 2020
European Regional Development Fund
(ERDF) € 424.1
Specific additional allocation (ERDF)
€ 97.8
European Social Fund
€ 233.9
Youth Employment Initiative
€ 22
European Agricultural Fund
for Rural Development
€ 174
amounts in millions
€ 952 million
Some of the expected results of the EU contribution are the following:
supporting 1 400 companies in developing business plans
150 000 additional households benefiting from high-speed Internet access
75 MW of additional renewable energy production
70 000 people benefiting from better wastewater treatment
36 000 unemployed people benefitting from support
reintegrating 11,000 young early school leavers
100 young farmers and 1 800 farms benefiting from modernisation aid
In addition:
- The Caribbean area European cooperation programme promotes the cooperation between more than 40 countries
and territories with a total budget of EUR 64.3 million.
- The European Maritime Fisheries Fund contributes with EUR 44.8 million and an additional specific envelope of EUR
86.5 million for the French outermost regions to compensate for additional costs.
- The Programme of Options Specifically Relating to Remoteness and Insularity (POSEI), in the agricultural sector can
support the French outermost regions up to an annual ceiling of EUR 278.4 million.

68
The GDP per capita in Madeira increased in 2012 - 2014, with a slight decrease in 2015 was observed. The GDP per capita is quite close
to the national average. The population is decreasing (2012-2016); and so is the share of both younger and older people (65+).
However, the population remains younger than in Portugal and the EU. The unemployment and long-term unemployment rates
decreased in 2013 - 2016 (after peaking in 2013); with the values relatively close to the national rates but below the EU average. The
rate of young people not in employment, education or training (NEET) decreased in 2012 - 2016; but it remains significantly higher than
the national and EU average. The situation for secondary and higher education attainment improved in 2012 - 2016; but the values are
still lower than the national and EU average. On early school leavers, a decline was observed in the same period; but again, much higher
than the national and EU levels.
Madeira
Background
Socioeconomic characteristics
1The GDP value for 2016 is not available. In 2015 for Portugal was 77 %. 2 Young people not in employment, education or training; 3 % of population aged 18-24
Basin Macaronesia
Main islands Madeira, Porto Santo
Main city Funchal
Area 801.52 km2
Population 256 244
Population density (N°/Km²)
319.9
Distance to Portuguese mainland (Lisbon)
1000 km
Madeira PT EU
2012 2013 2014 2015 2016 2016 2016
GDP (PPS per inhabitant in % of EU 28) 71 72 73 72 - 771 100
Population
Total population 264 236 263 091 261 313 258 686 256 424 10 341 330 510 284 430
Population aged + 65 years (%) 14.4 14.6 14.9 15.2 15.6 20.7 19.2
Population aged — 25 years (%) 29.1 28.8 28.3 27.8 27.4 24.8 26.7
Unemployment
Unemployment rate 15-74 (%) 17.5 18.2 15.2 14.9 13.0 11.2 8.6
Long-term unemployment (% of active pop) 10.3 11.5 9.9 9.0 7.8 6.1 4.0
Unemployment rate 15-24 (%) 50.2 51.8 50.5 - - 28 18.7
Not in employment, education or training 2,3
21.4 21.0 20.1 17.7 16.1 10.6 11.5
Education
Early school leavers aged 18-24 years (%)3 27.2 26.2 22.7 23.6 23.2 14.0 10.7
Secondary education attainment 25-64 years (%)
15.9 16.5 18.2 17.8 18.6 23.1 46.3
Tertiary education attainment 25-64 years (%)
14.7 16.2 16.6 17.3 18.9 23.9 30.7
69
0
25
50
75
100Institutions
Macroeconomicstability
Health
HigherEducation and
lifelong learning
Labour MarketEfficiency
Market Size
TechnologicalReadiness
BusinessSophistication
Innovation
Madeira UE
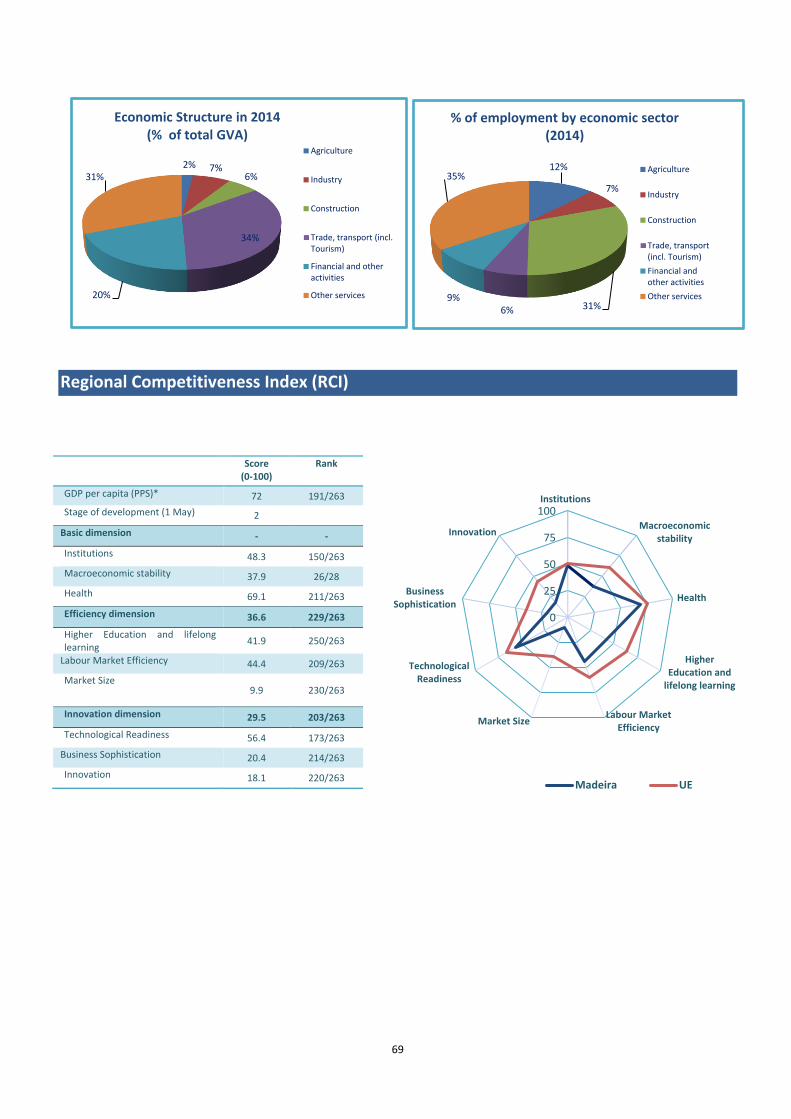
Regional Competitiveness Index (RCI)
Score (0-100)
Rank
GDP per capita (PPS)* 72 191/263
Stage of development (1 May) 2
Basic dimension - -
Institutions 48.3 150/263
Macroeconomic stability 37.9 26/28
Health 69.1 211/263
Efficiency dimension 36.6 229/263
Higher Education and lifelong learning
41.9 250/263
Labour Market Efficiency 44.4 209/263
Market Size 9.9 230/263
Innovation dimension 29.5 203/263
Technological Readiness 56.4 173/263
Business Sophistication 20.4 214/263
Innovation 18.1 220/263
2% 7% 6%
34%
20%
31%
Economic Structure in 2014 (% of total GVA)
Agriculture
Industry
Construction
Trade, transport (incl.Tourism)
Financial and otheractivities
Other services
12%
7%
31% 6% 9%
35%
% of employment by economic sector (2014)
Agriculture
Industry
Construction
Trade, transport(incl. Tourism)
Financial andother activities
Other services
70
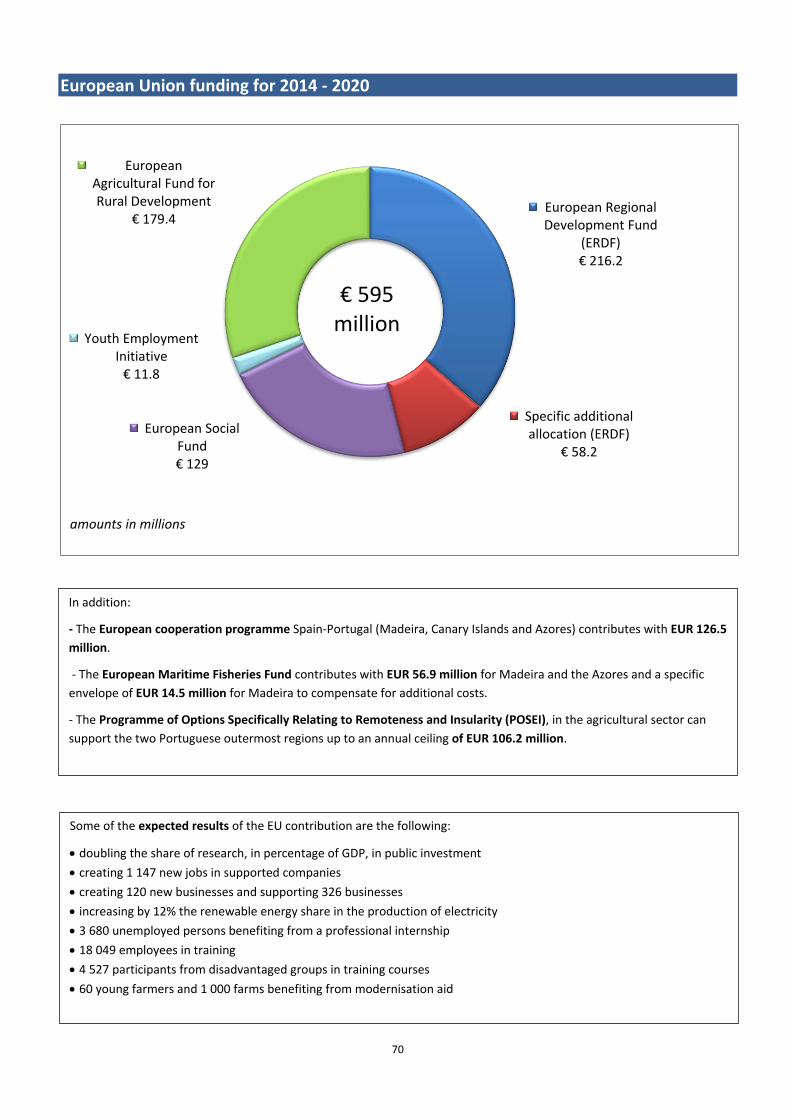
European Union funding for 2014 - 2020
European Regional Development Fund
(ERDF) € 216.2
Specific additional allocation (ERDF)
€ 58.2
European Social Fund € 129
Youth Employment Initiative
€ 11.8
European Agricultural Fund for Rural Development
€ 179.4
amounts in millions
€ 595 million
Some of the expected results of the EU contribution are the following:
doubling the share of research, in percentage of GDP, in public investment
creating 1 147 new jobs in supported companies
creating 120 new businesses and supporting 326 businesses
increasing by 12% the renewable energy share in the production of electricity
3 680 unemployed persons benefiting from a professional internship
18 049 employees in training
4 527 participants from disadvantaged groups in training courses
60 young farmers and 1 000 farms benefiting from modernisation aid
In addition:
- The European cooperation programme Spain-Portugal (Madeira, Canary Islands and Azores) contributes with EUR 126.5
million.
- The European Maritime Fisheries Fund contributes with EUR 56.9 million for Madeira and the Azores and a specific
envelope of EUR 14.5 million for Madeira to compensate for additional costs.
- The Programme of Options Specifically Relating to Remoteness and Insularity (POSEI), in the agricultural sector can
support the two Portuguese outermost regions up to an annual ceiling of EUR 106.2 million.

71
The GDP per capita in Martinique increased in 2012 - 2015, but the values are still far from the French and EU average. The population
including young people decreased (2012 - 2016); while the share of people aged 65+ increased. This is expected to make Martinique
one of the ‘oldest’ regions in France in 2040, according to the INSEE1
forecasts. The unemployment and long-term unemployment rates
have been decreasing in 2013 - 2016. The values are above the national average. The rate of young people not in employment,
education or training has decreased in 2014 - 2016. The 2016 value is still quite higher than the national average. The situation for
secondary and higher education attainment has improved in 2014 - 2016; but, the values are still lower than the national and EU
average. On the early school leavers, there was an increase in the same period. The value remains higher than the national and EU
rates.
Martinique
Background
Socioeconomic characteristics
Martinique FR EU
2012 2013 2014 2015 2016 2016 2016
GDP (PPS per inhabitant in % of EU 28) 75 76 77 78 - 1062 100
Population
Total population (1000) 388 364 385 551 383 911 380 440 376 847 66 759 950 510 284 430
Population aged + 65 years (%) 16.4 17.0 17.6 18.1 18.9 18.8 19.2
Population aged — 25 years (%) 31.2 30.6 29.9 29.4 28.7 30.3 26.7
Unemployment
Unemployment rate 15-74 (%) 21.0 22.9 19.4 18.6 17.6 10.1 8.6
Long-term unemployment (% of active pop) 15.3 16.2 12.7 12.6 11.5 4.6 4.0
Unemployment rate 15-24 (%) 56.7 63.9 51.4 47.3 44.3 24.7 18.7
Not in employment, education or training 3,4
- - 23.2 20.7 19.7 11.9 11.5
Education
Early school leavers aged 18-24 years (%)4 - - 11.9 14.3 14.6 8.8 10.7
Secondary education attainment 25-64 years (%)
- - 36.1 36.7 39.4 43.5 46.3
Tertiary education attainment 25-64 qyears (%)
- - 23.3 24.1 24.3 34.6 30.7
1 https://www.insee.fr/fr/statistiques/1280900; 2 The value for 2016 is not available. For 2015, the GDP for France was 106 %; 3 Young people not in employment, education or
training; 4 % of population aged 18-24
Basin Caribbean
Main cities Fort-de-France
Area 1 128 km2
Population (x 103) 376 847
Population density (N°/Km²)
344
Distance to French mainland (Paris)
6 850 km
72
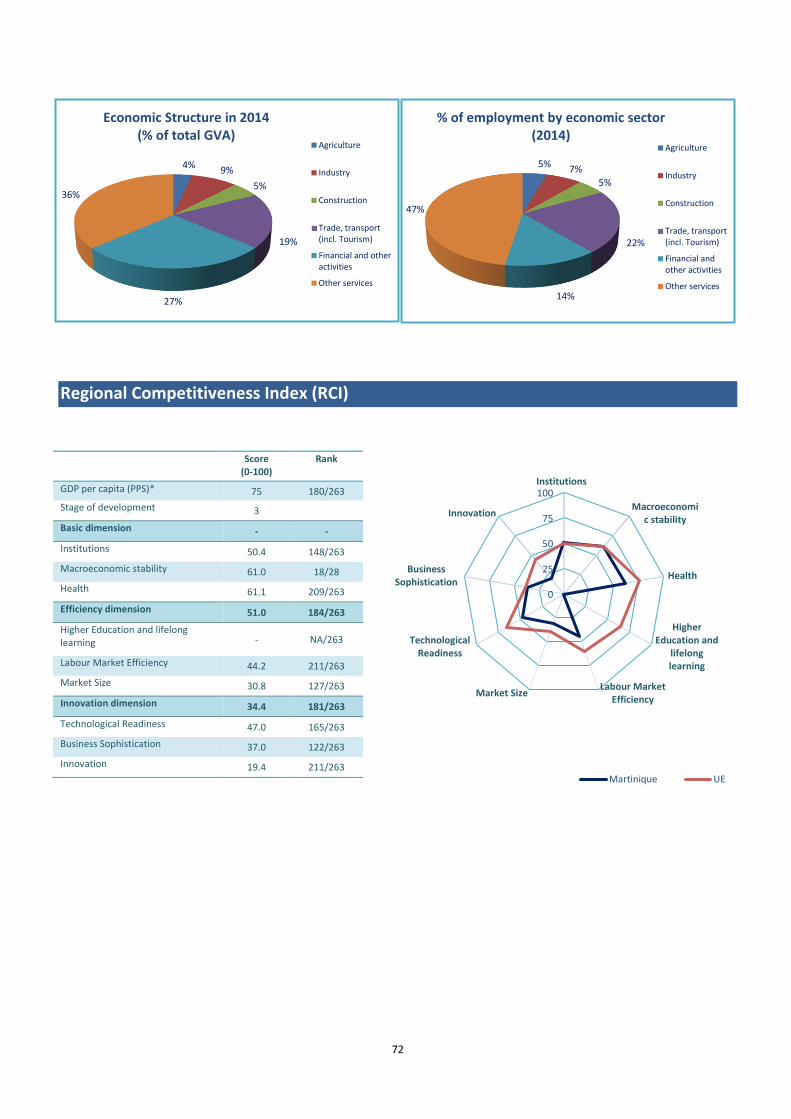
Regional Competitiveness Index (RCI)
Score (0-100)
Rank
GDP per capita (PPS)* 75 180/263
Stage of development 3
Basic dimension - -
Institutions 50.4 148/263
Macroeconomic stability 61.0 18/28
Health 61.1 209/263
Efficiency dimension 51.0 184/263
Higher Education and lifelong learning - NA/263
Labour Market Efficiency 44.2 211/263
Market Size 30.8 127/263
Innovation dimension 34.4 181/263
Technological Readiness 47.0 165/263
Business Sophistication 37.0 122/263
Innovation 19.4 211/263
0
25
50
75
100Institutions
Macroeconomic stability
Health
HigherEducation and
lifelonglearning
Labour MarketEfficiency
Market Size
TechnologicalReadiness
BusinessSophistication
Innovation
Martinique UE
4% 9%
5%
19%
27%
36%
Economic Structure in 2014 (% of total GVA)
Agriculture
Industry
Construction
Trade, transport(incl. Tourism)
Financial and otheractivities
Other services
5% 7%
5%
22%
14%
47%
% of employment by economic sector (2014)
Agriculture
Industry
Construction
Trade, transport(incl. Tourism)
Financial andother activities
Other services
73
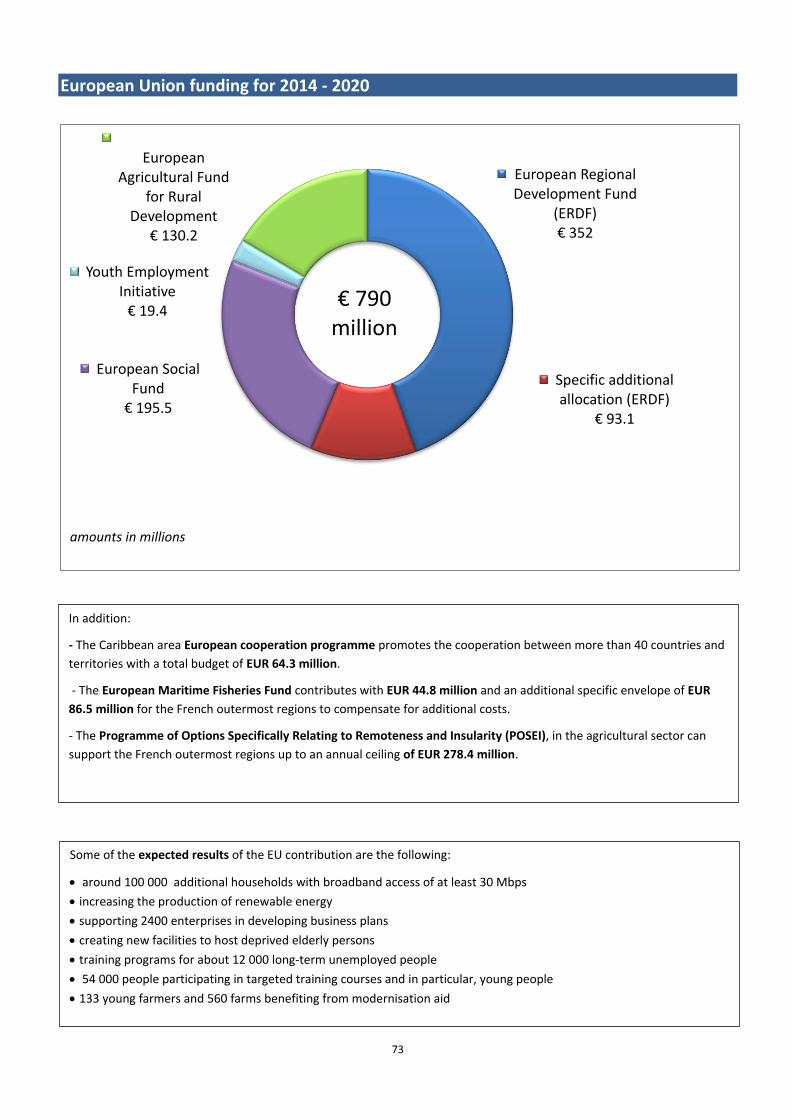
European Union funding for 2014 - 2020
European Regional Development Fund
(ERDF) € 352
Specific additional allocation (ERDF)
€ 93.1
European Social Fund
€ 195.5
Youth Employment Initiative
€ 19.4
European
Agricultural Fund for Rural
Development € 130.2
amounts in millions
€ 790 million
Some of the expected results of the EU contribution are the following:
around 100 000 additional households with broadband access of at least 30 Mbps
increasing the production of renewable energy
supporting 2400 enterprises in developing business plans
creating new facilities to host deprived elderly persons
training programs for about 12 000 long-term unemployed people
54 000 people participating in targeted training courses and in particular, young people
133 young farmers and 560 farms benefiting from modernisation aid
In addition:
- The Caribbean area European cooperation programme promotes the cooperation between more than 40 countries and
territories with a total budget of EUR 64.3 million.
- The European Maritime Fisheries Fund contributes with EUR 44.8 million and an additional specific envelope of EUR
86.5 million for the French outermost regions to compensate for additional costs.
- The Programme of Options Specifically Relating to Remoteness and Insularity (POSEI), in the agricultural sector can
support the French outermost regions up to an annual ceiling of EUR 278.4 million.
74
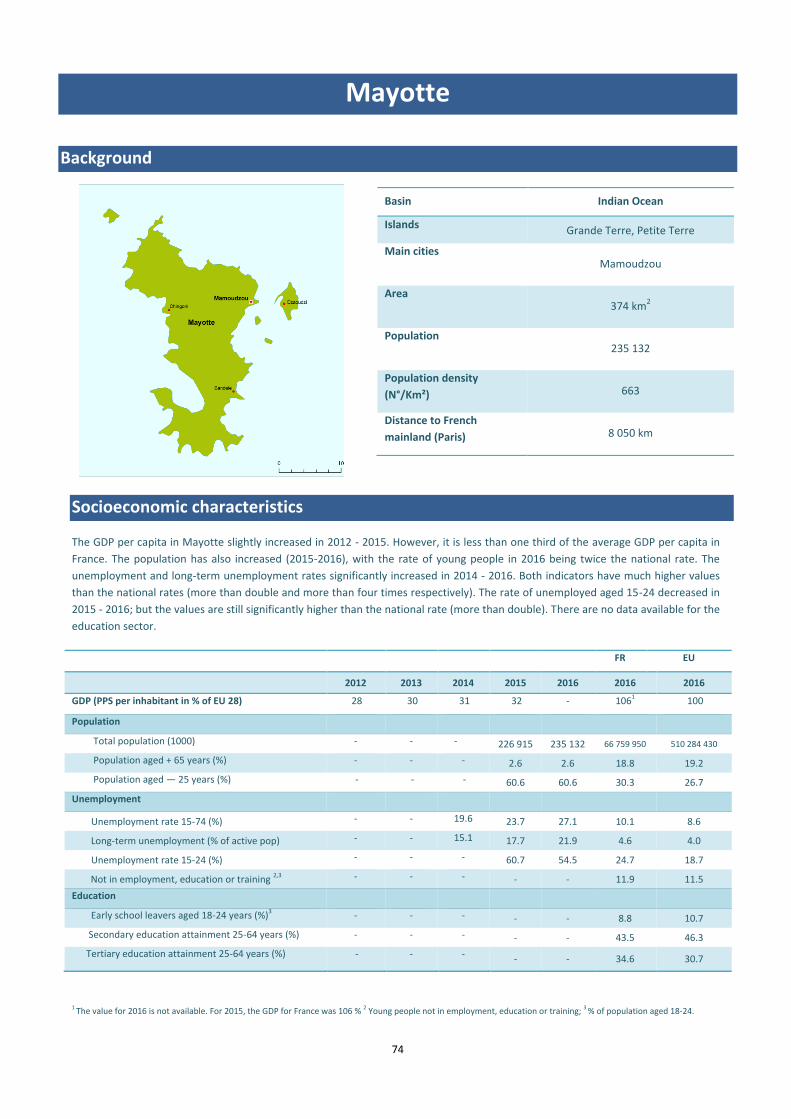
Mayotte
Background
Socioeconomic characteristics
The GDP per capita in Mayotte slightly increased in 2012 - 2015. However, it is less than one third of the average GDP per capita in
France. The population has also increased (2015-2016), with the rate of young people in 2016 being twice the national rate. The
unemployment and long-term unemployment rates significantly increased in 2014 - 2016. Both indicators have much higher values
than the national rates (more than double and more than four times respectively). The rate of unemployed aged 15-24 decreased in
2015 - 2016; but the values are still significantly higher than the national rate (more than double). There are no data available for the
education sector.
1 The value for 2016 is not available. For 2015, the GDP for France was 106 % 2 Young people not in employment, education or training; 3 % of population aged 18-24.
Basin Indian Ocean
Islands Grande Terre, Petite Terre
Main cities Mamoudzou
Area 374 km2
Population 235 132
Population density
(N°/Km²) 663
Distance to French
mainland (Paris) 8 050 km
Mayotte FR EU
2012 2013 2014 2015 2016 2016 2016
GDP (PPS per inhabitant in % of EU 28) 28 30 31 32 - 1061 100
Population
Total population (1000) - - - 226 915 235 132 66 759 950 510 284 430
Population aged + 65 years (%) - - - 2.6 2.6 18.8 19.2
Population aged — 25 years (%) - - - 60.6 60.6 30.3 26.7
Unemployment
Unemployment rate 15-74 (%) - - 19.6 23.7 27.1 10.1 8.6
Long-term unemployment (% of active pop) - - 15.1 17.7 21.9 4.6 4.0
Unemployment rate 15-24 (%) - - - 60.7 54.5 24.7 18.7
Not in employment, education or training 2,3
- - - - - 11.9 11.5
Education
Early school leavers aged 18-24 years (%)3 - - - - - 8.8 10.7
Secondary education attainment 25-64 years (%) - - - - - 43.5 46.3
Tertiary education attainment 25-64 years (%) - - - - - 34.6 30.7
75
Regional Competitiveness Index (RCI)
The 2016 RCI was not determined for Mayotte because of insufficient EUROSTAT statistical data for the years concerned. Mayotte became
an overseas department (‘département d’outre-mer’) in 2012, an outermost region in 2014 and a NUTS 2 region in 2013.
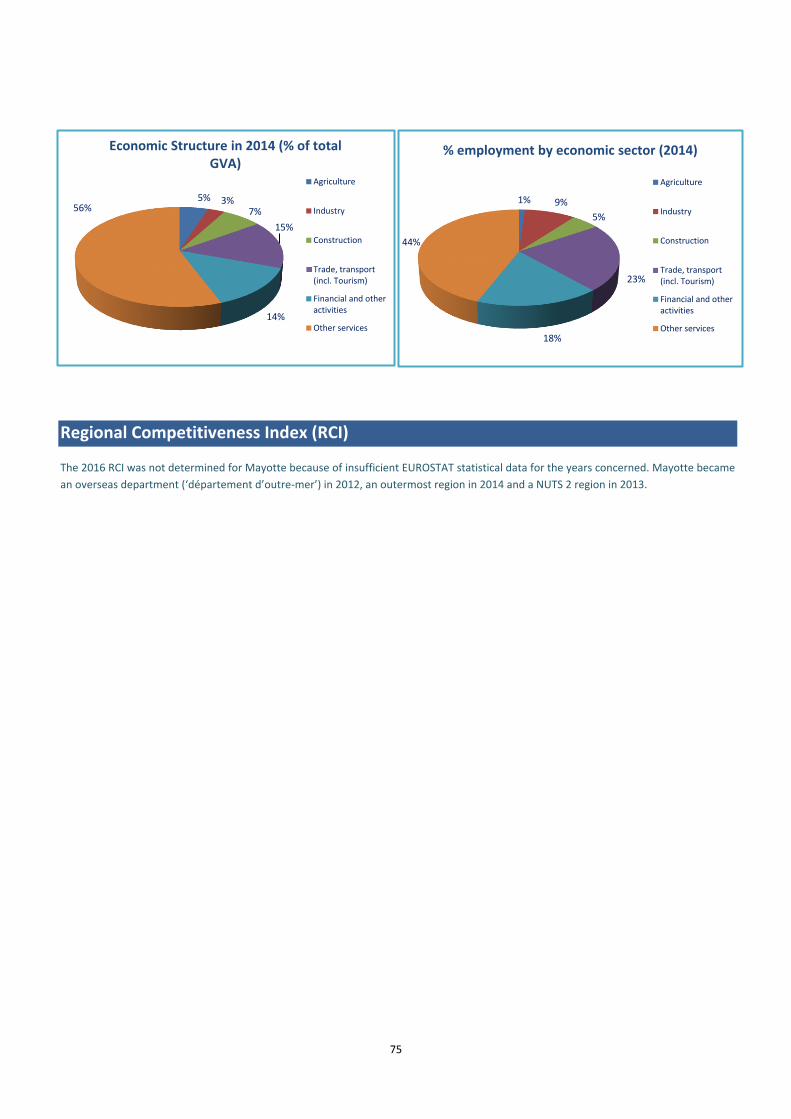
5% 3% 7%
15%
14%
56%
Economic Structure in 2014 (% of total GVA)
Agriculture
Industry
Construction
Trade, transport(incl. Tourism)
Financial and otheractivities
Other services
1% 9%
5%
23%
18%
44%
% employment by economic sector (2014)
Agriculture
Industry
Construction
Trade, transport(incl. Tourism)
Financial and otheractivities
Other services
76
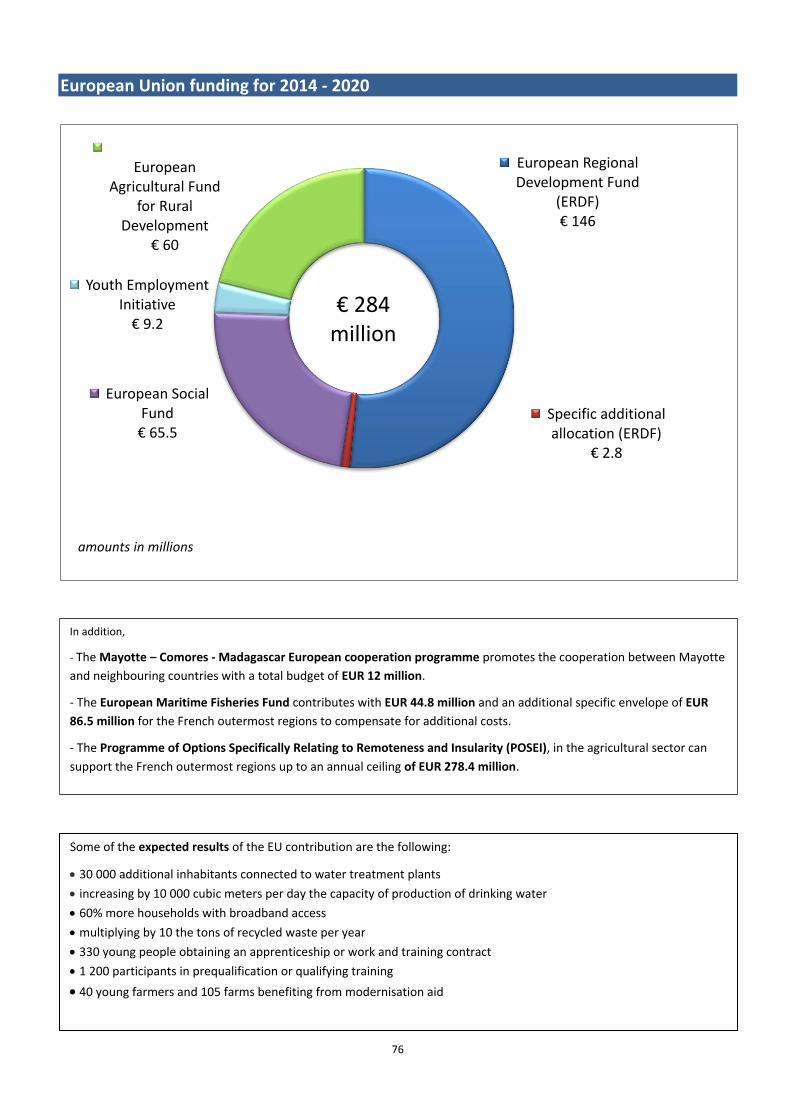
European Union funding for 2014 - 2020
European Regional Development Fund
(ERDF) € 146
Specific additional allocation (ERDF)
€ 2.8
European Social Fund
€ 65.5
Youth Employment Initiative
€ 9.2
European
Agricultural Fund for Rural
Development € 60
€ 284 million
amounts in millions
Some of the expected results of the EU contribution are the following:
30 000 additional inhabitants connected to water treatment plants
increasing by 10 000 cubic meters per day the capacity of production of drinking water
60% more households with broadband access
multiplying by 10 the tons of recycled waste per year
330 young people obtaining an apprenticeship or work and training contract
1 200 participants in prequalification or qualifying training
40 young farmers and 105 farms benefiting from modernisation aid
In addition,
- The Mayotte – Comores - Madagascar European cooperation programme promotes the cooperation between Mayotte
and neighbouring countries with a total budget of EUR 12 million.
- The European Maritime Fisheries Fund contributes with EUR 44.8 million and an additional specific envelope of EUR
86.5 million for the French outermost regions to compensate for additional costs.
- The Programme of Options Specifically Relating to Remoteness and Insularity (POSEI), in the agricultural sector can
support the French outermost regions up to an annual ceiling of EUR 278.4 million.

77
Reunion Island
Background
Socioeconomic characteristics
1 https://www.insee.fr/fr/statistiques/1280900; 2 The value for 2016 is not available. For 2015, the GDP for France was 106 %; 3 Young people not in employment not in training; 1
1 The value for 2016 is not available. For 2015, the GDP for France was 106 % 2 Young people not in employment, education or training; 3 % of population aged 18-24.
Basin Indian Ocean
Main city Saint-Denis
Area 2 512 km2
Population 850 996
Population density (N°/Km²)
339
Distance to French mainland (Paris) 9 400 km
FR EU
2012 2013 2014 2015 2016 2016 2016
GDP (PPS per inhabitant in % of EU 28) 69 70 71 71 - 1061 100
Population
Total population (1000) 833 944 835 103 842 767 847 005 850 996 66 759 950 510 284 430
Population aged + 65 years (%) 9.1 9.4 9.7 10.1 10.5 18.8 19.2
Population aged — 25 years (%) 39.6 39.1 38.8 38.3 37.8 30.3 26.7
Unemployment
Unemployment rate 15-74 (%) 28.6 28.9 26.4 24.1 22.4 10.1 8.6
Long-term unemployment (% of active pop) 19.4 19.8 17.4 15.7 14.2 4.6 4.0
Unemployment rate 15-24 (%) 54.2 57.3 53.7 51.2 44.0 24.7 18.7
Not in employment, education or training 2,3
- - 25.3 25.2 22.5 11.9 11.5
Education
Early school leavers aged 18-24 years (%)3 - - 21.6 19.3 19.1 8.8 10.7
Secondary education attainment 25-64 years (%) - - 34.4 36.0 34.9 43.5 46.3
Tertiary education attainment 25-64 years (%) - - 19.6 20.2 20.8 34.6 30.7
The GDP per capita in Reunion Island slightly increased in 2012 - 2015, but the values are still far from the French average. The population
increased (2012-2016), together with the share of people aged 65+. The rate of young people is decreasing, but it is still higher than the
national and EU rates. The unemployment and long-term unemployment rates decreased in 2013 - 2016. The values are significantly higher
than the national average (more than double). The rate of young people not in employment, education or training decreased in 2014 -
2016. However, the 2016 value is significantly higher (almost double) than the national average. The situation for early school leavers and
higher education attainment is improving in 2014 - 2016; but, the values are inferior to the national average. On the secondary education
attainment in the same period, there was an increase and then a decrease, so that the 2016 value is similar to the 2014 value. These values
are much lower than the national rate.

78
Regional Competitiveness Index (RCI)
0
25
50
75
100Institutions
Macroeconomicstability
Health
HigherEducation and
lifelong learning
Labour MarketEfficiency
Market Size
TechnologicalReadiness
BusinessSophistication
Innovation
Reunion Island UE
Score (0-100)
Rank
GDP per capita (PPS)* 70 202/263
Stage of development (1 May) 2
Basic dimension - -
Institutions 50.5 148/263
Macroeconomic stability 61.0 18/28
Health 53.1 222/263
Efficiency dimension 34.4 236/263
Higher Education and lifelong learning
34.4 259/263
Labour Market Efficiency 28.2 237/263
Market Size 29.9 131/263
Innovation dimension 31.4 193/263
Technological Readiness 50.5 187/263
Business Sophistication 29.6 170/263
Innovation 17.4 277/263
1% 8%
7%
19%
24%
41%
Economic Structure in 2014 (% of total GVA)
Agriculture
Industry
Construction
Trade, transport(incl. Tourism)
Financial and otheractivities
Other services
2% 7% 6%
23%
13%
49%
% employment by economic sector (2014)
Agriculture
Industry
Construction
Trade, transport(incl. Tourism)
Financial and otheractivities
Other services

79
European Union funding for 2014 - 2020
European Regional Development Fund
€ 940,2
Specific additional allocation (ERDF)
€ 190,3
European Social Fund
€ 516,8
Youth Employment Initiative
€ 57,8
European
Agricultural Fund for Rural
Development € 385.5
€ 2.09 billion
amounts in millions
* EU 28=100
Some of the expected results of the EU contribution are the following:
creating 2 661 additional jobs
increasing by more than 60% of the number of enterprises connected to very high speed network
increasing the energy efficiency in housing for 9 600 households
reducing waste volumes by 25 tons
increasing the percentage of population benefiting from drinking water from 42% to 74%
30 000 people benefiting from support to find employment
supporting more than 12 000 young people not in employment, education or training into training or
employment
180 young farmers and 1 800 farms benefiting from modernisation aid
In addition,
- The Indian Ocean area European cooperation programme promotes the cooperation between Reunion Island and
neighbouring countries with a total budget of EUR 63.2 million.
- The European Maritime Fisheries Fund contributes with EUR 44.8 million and an additional specific envelope of EUR
86.5 million for the French outermost regions to compensate for additional costs.
- The Programme of Options Specifically Relating to Remoteness and Insularity (POSEI), in the agricultural sector can
support the French outermost regions up to an annual ceiling of EUR 278.4 million.
80
Saint Martin
Background
Socioeconomic characteristics
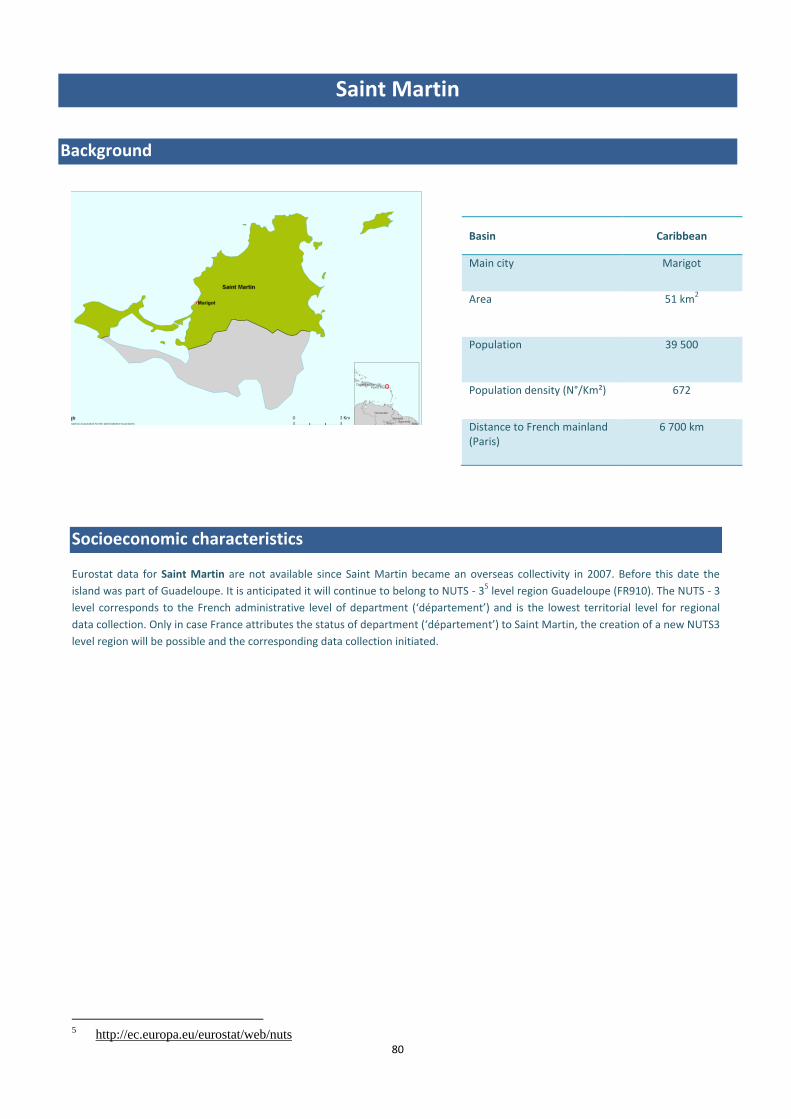
Eurostat data for Saint Martin are not available since Saint Martin became an overseas collectivity in 2007. Before this date the
island was part of Guadeloupe. It is anticipated it will continue to belong to NUTS - 35 level region Guadeloupe (FR910). The NUTS - 3
level corresponds to the French administrative level of department (‘département’) and is the lowest territorial level for regional
data collection. Only in case France attributes the status of department (‘département’) to Saint Martin, the creation of a new NUTS3
level region will be possible and the corresponding data collection initiated.
5 http://ec.europa.eu/eurostat/web/nuts
Basin Caribbean
Main city Marigot
Area 51 km2
Population 39 500
Population density (N°/Km²) 672
Distance to French mainland (Paris)
6 700 km
81
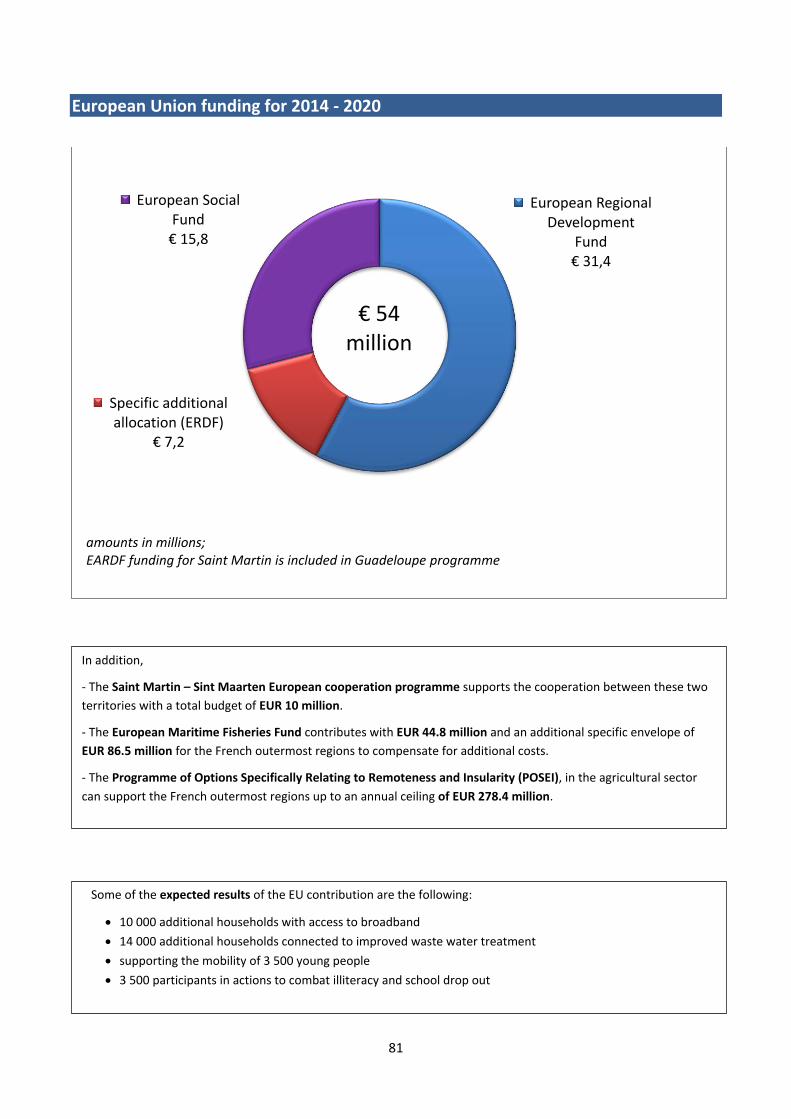
European Union funding for 2014 - 2020
European Regional Development
Fund € 31,4
Specific additional allocation (ERDF)
€ 7,2
European Social Fund
€ 15,8
€ 54 million
amounts in millions; EARDF funding for Saint Martin is included in Guadeloupe programme
In addition,
- The Saint Martin – Sint Maarten European cooperation programme supports the cooperation between these two
territories with a total budget of EUR 10 million.
- The European Maritime Fisheries Fund contributes with EUR 44.8 million and an additional specific envelope of
EUR 86.5 million for the French outermost regions to compensate for additional costs.
- The Programme of Options Specifically Relating to Remoteness and Insularity (POSEI), in the agricultural sector
can support the French outermost regions up to an annual ceiling of EUR 278.4 million.
Some of the expected results of the EU contribution are the following:
10 000 additional households with access to broadband
14 000 additional households connected to improved waste water treatment
supporting the mobility of 3 500 young people
3 500 participants in actions to combat illiteracy and school drop out