Committee on Earth Observations (CEOS) Space Data...
58
Page 1 Committee on Earth Observations (CEOS) Space Data Coordination Group (SDCG) Baseline Global Acquisition Strategy for The Global Forest Observations Initiative (GFOI) – Global Baseline Strategy DRAFT – v1.1 11 March 2013
Transcript of Committee on Earth Observations (CEOS) Space Data...

Page 1
Committee on Earth Observations (CEOS) Space Data Coordination Group (SDCG)
Baseline Global Acquisition Strategy for The Global Forest Observations Initiative (GFOI)
– Global Baseline Strategy
DRAFT – v1.1 11 March 2013
Page 2
Table of Contents
Table of Contents 2
1 Introduction 4 1.1 Background and Purpose 4 1.2 Scope 5 1.3 Contents 6
2 Requirements 7 2.1 Fundamental Information Requirements for GFOI 7 2.2 Policy Considerations 9 2.3 Technical Considerations 10 2.4 Target Product specifications 11 2.5 Data Strategy Response to GFOI Information Requirements 17
3 Strategy for Baseline Global Coverage 18 3.1 Basic Strategy 18 3.2 Core Data Streams and their Roles 19 3.3 Phases 20 3.4 Strategy Maintenance 22
4 Approach to Implementation 26 4.1 Introduction and Overview 26 4.2 Global Baseline Coverage 27 4.3 Regional Focus and Gap Filling 31
5 Core Data Stream Coverage Analysis 34 5.1 2013 34 5.2 2014 35 5.3 2015 36 5.4 2016 36
6 Roles for Other Contributing Data Streams 38 6.1 RapidEye 38 6.2 SPOT 39 6.3 ALOS-2 39 6.4 RADARSAT-2 39 6.5 TerraSAR-X and TanDEM-X 40

Page 3
6.6 ResourceSat-2 / AWiFS 40
7 2013 Implementation Plan 41 7.1 Landsat-7 and Landsat-8 41 7.2 CBERS-3 and Sentinel-1 43 7.3 Data Delivery Pilots 44
8 2014 Implementation Plan 45
9 2015+ Implementation Plan 46
10 Governance 47 10.1 Institutional arrangements 47 10.2 Strategy Management and Roles 47 10.3 Next Steps 47
Annex A – Mission Summaries 49
Annex B – Cloud Analysis 53

Page 4
1.1 Background and Purpose
This document is to define how CEOS space agencies will coordinate their relevant Earth observing satellite systems to acquire data to support information requirements arising from the Group on Earth Observation’s (GEO) Global Forest Observations Initiative (GFOI). Thus, the primary audience for this document is CEOS.
The GFOI (http://www.gfoi.org) has been developed in the context of significant investments by national governments to reduce greenhouse gas emissions from deforestation, forest degradation and associated land use change. National forest information systems are recognised to be essential for effective participation in and reporting to international agreements and forest carbon incentive mechanisms. GFOI supports governments that are establishing national forest information systems by:
• fostering the sustained availability of space-based observations for national forest monitoring systems and assisting countries to make the best use of these observations;
• providing assistance and guidance on utilising space-based observations, collaborating with national institutions and international bodies such as the United Nations (UN) Food and Agriculture Organisation (FAO) to ensure that countries are able to utilise the available data;
• developing methods and guidance documentation (MGD) on the acquisition and use of data for national forest monitoring systems, consistent with and complementary to the work of the IPCC;
• promoting on-going research and development, GFOI supports continuous improvements in the use of space-based observations and the uptake of current forest carbon science.
The GFOI aims to support long-term space-based observation needs emerging from the discussions within the UN Framework Convention on Climate Change (UNFCCC). To realise the mission of the GFOI, the Group on Earth Observations (GEO) will engage with other key users, in particular the FAO.
CEOS, having effectively coordinated space-based acquisitions in support of Forest Carbon Tracking (FCT) demonstration activities since 2009, has accepted responsibility for coordination of the satellite data contribution to the observations and measurement component of GFOI – the regular and routine (systematic) observations and measurements for effective reporting – ensuring continuity of data supply for maintenance of time series and consistent reporting.
Recognising the magnitude of the challenge involved in meeting GFOI & FCT requirements, given the global scale and sustained coverage needed, CEOS in 2011 defined a 3-level strategy as a framework for its coordination efforts:
1 Introduction
Page 5
Element 1: A baseline, coordinated global data acquisition strategy involving a number of space-based `core data streams’ that can be utilized and shared free-of-charge for GFOI purposes. This involves systematic and sustained wall-to-wall Earth Observation (EO) acquisitions of forested areas globally and provides the default forest observations data for all countries without specific technical requirements, heritage or data preference (such as for a particular mission or data type [e.g., optical or SAR]). This baseline global data strategy should guarantee the minimum consistent space data provision necessary for all interested countries to engage in reporting to the relevant UNFCCC under the provisions of a future climate treaty, including the requirements for reducing emissions from deforestation and forest degradation in developing countries; and the role of conservation, sustainable management of forests and enhancement of forest carbon stocks in developing countries (REDD+). To this end the baseline strategy needs to coordinate with the methodologies described in the MGD.
Element 2: A coordinated strategy for national data acquisitions. This will accommodate countries that have specific technical requirements, or heritage and experience on working with a particular EO data source or type, as well as the numerous intergovernmental arrangements that may exist or emerge for the supply of certain data to one or more countries. This will involve a wider range of satellite data sources, including data that is ordinarily provided on a commercial basis.
Element 3: Data supply in support of GFOI R&D activities, including support of: the science studies assisting the development and evolution of the MGD for GFOI; interoperability studies; and validation activities – typically also involving higher resolution EO data, some of which is provided commercially and is generally beyond the scope of CEOS agency responsibility.
Anticipating that the GFOI and FCT data coordination activities would require a significant and sustained effort by CEOS, the 25th CEOS Plenary, in 2011, agreed to the establishment of a dedicated Space Data Coordination Group (SDCG) for GFOI charged with defining and implementing the three-level strategy.
1.2 Scope
This document focuses on Element 1, the baseline global data acquisition strategy. This is the most urgent time-wise and strategically significant element of the overall GFOI data strategy. Element 1 provides evidence that the EO community is committed to the sustained provision of the necessary data flow needed to facilitate wide country participation which is fundamental to the credibility of GFOI, particularly in the REDD+ context. The UNFCCC and the Kyoto Protocol have not comprehensively included forests in emissions reporting regimes, partly due to concerns about monitoring. Recognising the significant role of forests in global carbon emissions and the climate system, GFOI seeks to ensure that the technical and institutional means exist for their monitoring on global scales and in a consistent and comparable manner that will support reporting by national governments to the appropriate frameworks.
Within CEOS and its member space agencies, the document will aim to establish consensus on data requirements associated with the baseline global data acquisition strategy for GFOI, and define how agencies and systems will contribute to its implementation. In the process, gaps and overlaps can be identified and addressed with requests for supplementary data formulated as necessary to donor agencies. Externally, the document will serve to communicate the resolve and technical capacity of CEOS space agencies to coordinate a sustained supply of EO satellite data in support of GFOI, and also to develop an

Page 6
understanding among countries with an interest in participating in GFOI as to the likely nature of, and sources for, the annual coverage of data for their national territory.
While the full operational status of the baseline global data acquisition strategy Element 1 is planned for by 2016, it is recognised that numerous GFOI target countries have begun their implementation of the necessary monitoring systems and also need immediate support. To accomplish this support, a phased approach towards the baseline global data acquisition strategy is proposed for the years 2013-2015, along with piloting measures for Element 2 (coordinated strategy for national data acquisitions) and Element 3 (Data supply in support of GFOI research and development [R&D] activities).
1.3 Contents
Section 2 defines the requirements that determine the design of the global baseline space data acquisition strategy. There are multiple potential applications for the national forest information systems that represent the building blocks of the GFOI, and section 2 identifies those related to the routine reporting of forest-related greenhouse gas emissions and forest carbon stocks to UNFCCC under the anticipated requirements of REDD+. The policy and technical considerations, which have dictated the SDCG approach are discussed, and the resulting satellite data products are described.
Section 3 defines the proposed CEOS strategy for EO data acquisitions for an annual baseline global data acquisition strategy for GFOI. It explains the phasing required to establish a sustained annual strategy and the priorities for coverage during the transition years.
Section 4 describes how CEOS agencies will implement the strategy and identifies the contribution of individual agencies and satellites. The business as usual (BAU) coverage scenario is explained and the plan for an enhanced coordinated coverage is described. Guidance from the SDCG to each contributing CEOS agency is provided in support of the implementation.
Section 5 discusses governance and describes how the SDCG proposes to support the on-going oversight of the strategy in cooperation with the GFOI and CEOS management groups and with the support of individual CEOS agencies.
ANNEX A summarizes potential contributing satellites, including such information as ground resolution, repeat coverage capability, frequencies, and links to further information.
ANNEX B documents cloud analysis techniques employed by the SDCG and the Science Engineering Office (SEO).

Page 7
2.1 Fundamental Information Requirements for GFOI The primary purpose of the CEOS baseline global data acquisition strategy for GFOI is to illustrate that national governments can routinely have access to the required amount of satellite data necessary for them to participate in routine reporting of forest-related greenhouse gas emissions and forest carbon stocks to UNFCCC under the REDD+ provisions. The data and methodologies may also be of interest to developed countries for greenhouse gas inventory estimates associated with land use, land-use change and forestry.
The nature of these national reports, and the information required to compile them, determines the requirements for the GFOI and its support for national forest information systems. The policy and scientific requirements for these reports continues to evolve since negotiations under the UNFCCC to establish a new climate treaty are still underway.
It is therefore necessary to make some assumptions as to the future policy landscape related to forests and their reporting in order to develop the GFOI and the data products which it might promote to help ensure consistency and comparability among national forest information systems, and to define the CEOS acquisition strategies for space data.
The following fundamental requirements have been assumed by the SDCG in developing this document:
1. Countries will report on at least a biennial basis, with annual monitoring. UNFCCC Annex 1 countries prepare an annual national report, which includes a national greenhouse gas (GHG) inventory and supplementary information related to emissions and removals from land use, land-use change and forestry (LULUCF) activities. Inventory reporting frequency for developing countries is biennial, as decided at the 2011 COP-17 in Durban. In order to support all participating countries, and anticipating that market mechanisms may demand more stringent reporting requirements, the GFOI will aim to support the provision of consistent time series observations data with at least an annual frequency, which will support biennial reporting and allow more frequent monitoring, which may be useful for detecting seasonality, for policy purposes, and for institutional continuity.
2. National monitoring systems are a requirement for full results-based implementation although sub-national monitoring is acceptable as an interim step. UNFCCC has agreed that national monitoring is required for full results-based participation in REDD+. This would presumably include any participation via market mechanisms. The methodological basis agreed by UNFCCC is the IPCC Good Practice Guidance (GPG) for Land Use, Land-Use Change and Forestry, which - with the subsequent IPCC 2006 Guidelines - is designed to be adaptable for future reporting of greenhouse gas inventories to the UNFCCC. The guidance, with tiers (representing different levels of data, data quality and stages of methodological complexity) and approaches (representing different methods of land representation), provide methods for estimating national greenhouse gas inventories. The tiers and approaches have been designed so all countries can engage. In anticipation of future requirements around consistency, transparency, comparability, completeness and accuracy (the IPCC GPG reporting principles) in reporting, the GFOI should aim to
2 Requirements
Page 8
support annual national coverage of relevant spatially-explicit datasets for all countries, up to and including the most challenging of the IPCC tiers and approaches. The GFOI MGD aims to describing the optimum use of EO and ground-based data, consistent with the IPCC guidance.
3. The fundamental variables that need to be measured for REDD+ include Forest Area Change (the transitions to, from and within the Forest land use category class - forest-related activity data), associated Carbon Stock Changes, and emissions and removals of CO2 and other greenhouse gases. This is to support IPCC GPG, which require measurements be made accurately and consistently. (IPCC has no precision requirement. Lack of bias and time series consistency are requirements). Technical capabilities for derivation of forest/non-forest data products and for forest area change from satellite data are well established. Different forest ecosystems will need to be distinguished. Satellite data represents one of the data sources for the derivation of carbon stock change estimates and emissions and removals of CO2 and other greenhouse gases, which is more technically challenging.
4. Spatially-explicit national datasets which form the basis for reports may require a spatial resolution better than 30m. As for the definition of what is regarded as forest, within the limits of any ranges that may be agreed, it is likely to be up to the individual countries to determine which minimum mapping area should be used as the basis for their reporting. However, estimation of change at hectare to sub-hectare basis may be required to establish the relationship with ground-based data, and 30m spatial resolution or finer is assumed to be a requirement of future reporting requirements.
5. Estimates of forest degradation will be required as an integral part of reporting. This has been recognized in UNFCCC and IPCC discussions as a priority - given worries about incentives to reduce deforestation inadvertently encouraging degradation.
6. REDD+ requirements go beyond deforestation and degradation. The other activities (conservation, sustainable management of forests and enhancement of forest carbon stocks) also have reporting requirements, which (since no land-use change is involved) may be similar to those for reporting degradation, but may be even more challenging, because proxy indicators (e.g., proximity of transport infrastructure) may be less applicable. There may also be requirements associated with safeguards, e.g. that REDD+ actions should not incentivise conversion of natural forests. Agricultural observations may also be of interest in the context of drivers of REDD+.
The GFOI information products, and therefore the supporting CEOS baseline global data acquisition strategy should be designed to satisfy the most stringent and sophisticated of the reporting tiers and approaches (Tier 3, Approach 3; see section 2.3), so that all participating countries can be supported and the observations component does not become the bottleneck to policy development and satisfying the reporting principles including accuracy, consistency (including in time series), comparability and transparency.
Page 9
2.2 Policy Considerations Negotiations, including REDD+ under the UNFCCC, which impact national forest information systems and their requirements, will continue to evolve. Governments will have multiple purposes in mind for their national forest information systems, including in relation to forest resource management, biodiversity, national reporting, and other issues. Although the priority for the GFOI is to support consistent and comparable reporting by these national forest information systems in the REDD+ context, the need is also to support a wide range of requirements of different national governments.
The UN-REDD Programme is the United Nations collaborative initiative on REDD+ in developing countries established by the Food and Agriculture Organization (FAO), the United Nations Development Programme (UNDP) and the United Nations Environment Programme (UNEP). It supports nationally-led REDD+ processes and promotes the informed and meaningful involvement of all stakeholders, including Indigenous Peoples and other forest-dependent communities, in national and international REDD+ implementation.
The Forest Carbon Partnership Facility (FCPF) is a global partnership, housed within the World Bank’s Carbon Finance Unit. It provides technical assistance and supports developing countries with forest stocks in their efforts to develop national strategies and systems for REDD+. The FCPF further assists countries to test approaches that can demonstrate that REDD+ can work, and provides them with performance-based payments for emission reductions programs. UN-REDD and FCPF are cooperating closely together and recently conducted a common country needs assessment to complete their REDD+ readiness phases. FAO is also supporting the so called Capacity Development for REDD+ project (CD-REDD II), which is partnership led by the Coalition for Rainforest Nations (CfRN) and Thünen Institute of Forest Ecosystems in Germany, funded by Deutsche Gesellschaft für Internationale Zusammenarbeit (GIZ)
As the initial priority for GFOI, the heritage of and prospects for, the policy processes around the definition of, and evolution of, national reporting requirements are of great importance in ensuring that GFOI capabilities, and the supporting CEOS space data acquisition strategies, are established in a way which satisfies current and anticipated future requirements.
Following the re-introduction of tropical deforestation onto the agenda in 2005, the UNFCCC agreed at Conference of the Parties (COP)-13 (Bali, 2007) to begin negotiations on further inclusion of tropical forests in post-2012 climate change agreements. The Bali Action Plan Decision 2/CP.13 highlighted the need for international action on forest monitoring. COP-15 (Copenhagen, 2009) made further progress and explicitly cited the need for national forest monitoring systems and for observations in support of these (Decision 4/CP.15), requesting developing country Parties to:
“…use the most recent Intergovernmental Panel on Climate Change guidance and guidelines, as adopted or encouraged by the Conference of the Parties, as appropriate, as a basis for estimating anthropogenic forest-related greenhouse gas emissions by sources and removals by sinks, forest carbon stocks and forest area changes;
…establish, according to national circumstances and capabilities, robust and transparent national forest monitoring systems and, if appropriate, sub-national systems as part of national monitoring systems that:
(i) Use a combination of remote sensing and ground-based forest carbon inventory approaches for estimating, as appropriate, anthropogenic forest-related greenhouse gas emissions by sources and removals by sinks, forest carbon stocks and forest area changes;

Page 10
(ii) Provide estimates that are transparent, consistent, as far as possible accurate, and that reduce uncertainties, taking into account national capabilities and capacities;
(iii) Are transparent and their results are available and suitable for review as agreed by the Conference of the Parties; “
Since Durban, there have been no specific COP decisions on measurement, reporting and verification (MRV), though via other decisions, Parties have confirmed, amongst other things, that sub-national approaches can be an interim step in the development of national approaches and full results-based implementation requires a national monitoring system. Parties have also indicated in discussion that conservativeness and step-wise approaches may be useful. The expected decision on MRV at COP-18 in Doha was postponed to 2013, at COP-19 in Warsaw, as Parties did not conclude on the draft on MRV and forest monitoring modalities.
35 countries (including the EU, Australia, Norway and Switzerland) signed on to a second commitment period of the Kyoto Protocol (KP) – which remains the only legally binding climate agreement. KP 2 represents only 15% of global emissions and in this second commitment period, Japan, Canada and Russia, who had participated in the KP, withdrew.
2.3 Technical Considerations As noted in section 2.1, there are two fundamental variables, which the IPCC GPG requires to be measured to estimate greenhouse gas emissions associated with REDD+ activities.
1. Area data: There are three Approaches to land-related data collection to represent land set out in the IPCC Guidelines. Countries may use a mix of Approaches for different regions and over time.
• Approach 1 identifies the total area for each land category—typically from non-spatial country statistics categorized into broad land use types at the time of any land use census or inventory. Information is not provided on the nature and area of conversions between land uses, that is, it only provides ‘‘net’’ area changes (for example, deforestation minus afforestation) between two inventories and thus is unlikely to be suitable for any REDD+ policy framework;
• Approach 2 involves tracking of land conversions between categories, resulting in a non-spatially explicit land-use conversion matrix and hence changes cannot be directly linked to forest carbon maps;
• Approach 3 extends Approach 2 by using spatially explicit land conversion information, derived from either sampling or wall-to-wall mapping techniques in time series.
While both Approaches 2 and 3 give gross-net changes among land categories, only Approach 3 allows for the estimation of gross-net changes within a category, that is, detection of deforestation followed by afforestation, which is not possible with Approach 2 unless detailed supplementary information is provided. Only Approach 3 can provide spatially explicit tracking of land conversion information.
It is further noted that land area data may need to be stratified by ecosystem type or management practice, as required for greenhouse gas inventory estimates.

Page 11
2. Carbon Stock Change estimates, or emission factors: IPCC GPG defines different Tiers to represent the methodological complexity required to estimate the emissions and removals from a reporting category given its influence on a country’s total inventory, data availability and national circumstances. Emissions and removals are usually not directly measured; rather estimates of changes in carbon stocks in the various carbon pools of a forest are converted to emission and removal estimates. Carbon stock or stock change information can be obtained at different Tier levels. Which one selected is in principle independent of the Approach to land representation selected (see above), but in practice not all Tiers and Approaches would logically combine.
• Tier 1 uses IPCC default parameters (for example, biomass in different forest biomes, and carbon fraction);
• Tier 2 requires some country-specific carbon data (that is, from field inventories and/or permanent plots);
• Tier 3 uses disaggregated national data of carbon pools and assesses any change in pools through repeated measurements and/or modelling. Moving from Tier 1 to Tier 3 increases the accuracy and precision of the estimates, but usually increases the complexity and the costs of monitoring.
As noted above, the GFOI information products, and therefore any supporting CEOS space data acquisition strategy should be designed to satisfy the most stringent and sophisticated of the reporting tiers and approaches (Tier 3, Approach 3), so that all countries can be supported and that the observations component does not become the bottleneck.
Remote sensing can yield information relevant to biomass estimates, e.g. under some circumstances by use of spectral indices, radar or LiDAR (although no satellite is currently available for this), but these approaches have yet to move systematically from the research to inventory practice, and remote sensing is not so far able to estimate below-ground carbon pools. Furthermore, techniques require calibration or ground truthing, and differentiation of forest types or condition is likely to be more challenging than detection of the presence or absence of forest (so degradation and the other REDD+ activities are much harder than deforestation itself), and emissions of non-CO2 greenhouse gases cannot yet be incorporated into greenhouse gas inventories by use of remote sensing alone. It is therefore inevitable that remote sensing and ground-based data will need to be used together in making emissions and removal estimates sufficient to support REDD+ participation, and how to do this will be one of the areas covered in the Methods and Guidance documentation developed by GFOI.
2.4 Target Product specifications The GFOI Methods and Guidance Document may define a number of thematic forest information product specifications to enable countries to measure Forest Area Change and Carbon Stock Change estimates. These product specifications determine the data acquisition strategies being developed by CEOS to make satellite data available. CEOS will not make products available directly, but will make data available so that countries can generate these products to meet their needs. The product specifications may be divided into three categories intended to be consistent with the structure of the IPCC Good Practice Guidelines as complemented by the MGD.

Page 12
2.4.1 Category A – Land Cover and Change products A1: Land Cover. This is a key product specification required for national baseline mapping. It is for participating countries themselves to decide what level of detail or classification scheme they wish to use, but a legend that is compliant with the UN-FAO Land Cover Classification System (LCCS), and which allows aggregation into the six IPCC Land Categories defined in the IPCC GPG (Forest Land, Grassland, Cropland, Wetlands, Settlements and Other Land), is encouraged. Further division of the Forest Land category into sub-classes will be necessary to achieve the desired improved accuracy in the emission estimation. This includes distinction between natural and planted forests, as well as between forest types with different carbon stock levels, in conjunction with ground-based data. Since satellite data observes land cover, supplementary ground-based data may be required to determine land use, where this is a methodological requirement.
Category Code Name Description
Land Use and Change
A1 Land Cover UN-FAO Land Cover Classification (LCCS) compliant national legend
A2
IPCC Land Category
Transition map (Activity Data)
Transition matrix between the six IPCC Land Cover Categories with the Forest and Forest-remaining-Forest
change categories divided into relevant sub-classes.
Forest Area and Change
B1 Forest / Non-Forest Cover
Map of forest cover based on the national definition of forest. Plantations
distinguished as separate class.
B2 Forest Cover Change
Maps of changes in forest area, incl. changes caused by fire
B3 Near-Real Time Forest Change
Indicators
Early warning indicators of potential changes in forest cover
Forest remaining
Forest
C1 Forest Types
Map of relevant forest types. Forest classes to be included vary between
countries and eco regions. Distinction is required between natural forest and
plantations.
C2
Degradation (and
enhancements of C stocks)
Mapping of different forest degradation types and
proxies/indicators of degradation. Also including enhancements of
carbon stocks.
C3 Above-Ground
Biomass Estimates
Map showing vegetation stratified into broad above-ground biomass categories.
Not for reporting purposes.
Table 2.1 - GFOI Forest Information Products (GFOI Methods and Guidance Document, Annex 2.2).
Page 13
EO data options for the generation of product A1 include:
• Optical data: Can be used stand-alone if cloud-free coverage is obtained, and provides the most versatile classification. Availability of a Short-Wave Infrared (SWIR) band significantly improves class distinction. At least one annual national coverage would be needed, and dual-season (or more) would be preferred.
• L-band SAR (wavelength 23.5 cm): L-band SAR can be used stand-alone, if dual season or more frequent data are available. The thematic richness of classifications derived from L-band SAR is inferior to classifications based on optical data, but reaches best results in combination with optical data. Dual-polarisation (co- and cross-polarisation) is preferred as the cross-polarisation channel is sensitive to vegetation structure.
• C-band SAR (wavelength 5.3 cm): Its capability for land classification is inferior to optical and L-band SAR. C-band SAR can be used for forest/non-forest distinction and timely monitoring of deforestation and logging activities with dense time series, where dual polarisation provides better results. Utility in combination with optical and/or L-band SAR has been proven for improved distinction of certain vegetation classes. Dual-polarisation (including both co- and cross-polarisation) is needed to do this.
A2: IPCC Land Cover Category Transition Data. In order to calculate net carbon emissions, countries are required to produce activity data, i.e., information about the extent of REDD+ activities. Conventionally, activity data are areas arranged in a land area change matrix, as shown in Table 2.2, sufficiently disaggregated so that they can be associated in an emissions or removal calculation with carbon stock differences or other emission factors which are usually expressed per unit area.
A larger number of land cover/land use classes will result in a more complex, but overall more accurate transition matrix. Additional separation into further sub-classes is particularly desired for the "Forest-remaining-Forest (FF)" transition class, to accommodate the characterisation of changes in the carbon contents within a forest, e.g., as a result of degradation (selective logging, fragmentation, fires, deceases) and/or forest management practices (thinning, carbon enhancements). The Forest-remaining-Forest change category should cover transitions between those forest sub-classes and the times since the changes.
The EO data requirements for the generation of A2 product specifications is likely to be based upon multi-year time-series of the data used for the generation of Product A1.

Page 14
Table 2.2 - IPCC Transition Matrix showing the six IPCC land cover categories and associated 36 (theoretical) transitions. Additional subcategories within the FF transition class (Forest remaining Forest) will be required to
characterise events such as degradation or enhancements of carbon stocks.
2.4.2 Category B – Forest Area and Change Product Specifications B1: Forest/Non-Forest Cover product maps can be generated independently or derived by aggregating Product A1, if available. For REDD+ estimation, plantations will need to be classified as a separate class, within Forest.
The EO data options for the generation of the B1 product specification include:
• Optical data: Can be used stand-alone if cloud-free coverage is obtained. The inclusion of the SWIR band improves class distinction. At least one annual national coverage is necessary, but dual-season (or more frequent) is preferred.
• L-band SAR: Can be used stand-alone. Dual-polarisation (co- and cross-polarisation) is strongly recommended, as the cross-polarisation channel is sensitive to vegetation structure. At least one annual coverage (dry season) is required, but dual-season (or better) and/or combination with optical and/or other SAR data would provide improved classification accuracy.
• C-band SAR: Distinction of forest and non-forest is feasible with dense time-series coverage, but is generally not sufficient if based only on single acquisitions. Dual polarisation (co- and cross-polarisation) improves classification accuracy.
B2: Forest Cover Change. This product specification deals with changes in forest cover - typically to be generated on an annual basis to accommodate reporting of forest losses and gains. B2 can be derived by aggregating Product A2, if available, or generated using time-series of satellite data. Fire-related changes are important to detect and can be derived from lower resolution products such as NASA Terra & Aqua MODIS burnt area maps.
The EO data options for the generation of the B1 product include:
• Optical data: Can be used stand-alone if cloud-free coverage is obtained. Time-series are required, preferably at higher frequency than annual as additional intra-year data improves the classification accuracy.
Page 15
• L-band SAR: Can be used stand-alone in dual-polarisation. Time-series are required semi-annual or better as additional intra-year data improves classification accuracy.
• C-band SAR: Can be used for monitoring of deforestation and logging activities under an existing forest mask (Product B1). Dense time-series (monthly, or more frequent) are required, where dual polarisation provides better results.
A Historical Forest Cover Change map (B2’) can be useful to determine past forest cover baselines and assessment of historical change and trends. This product is the same as B2, but is derived from historical (archived) optical satellite data.
B3: Near-Real Time Forest Change Indicators. This product specification is intended to provide early warning indicators of potential changes in forest cover. Lower spatial resolution (100-250m) EO data is sufficient. High temporal observation frequency, monthly or better, is needed for this product.
The EO data options for the generation of the B1 product include:
• Optical data: All optical sensors are potentially useful. Outside of areas with direct ground station downlinks, lower spatial resolution sensors have the potential to fulfil the temporal repetition requirement. 250m resolution NASA Terra and Aqua MODIS data are, for instance, currently used by Brazil within an operational deforestation detection system (DETER) in the Brazilian Legal Amazon. Sensors with a medium/coarse resolution of 50-100m such as CBERS-3 WFI-2 and ResourceSat AWiFS are potentially very useful. High temporal frequency observations (monthly or weekly) would be required.
• L-band SAR: Wide-beam modes (50-100m GSD) are useful even in single polarisation, but dual-polarisation is preferred. High temporal frequency observations (monthly, or better) would be required.
• C-band SAR can provide monitoring and indication of deforestation and logging activities under an existing forest mask (Product specification B1). Dense time-series frequency (monthly, or better) would be required, where dual polarisation provides better results (see B2).
2.4.3 Category C – Forest-remaining-Forest Products C1: Forest Type map. This product specification is for a map showing relevant forest types. Forest classes to be included vary between countries and eco regions, including when applicable; regionally significant types e.g., peat swamp forest, mangrove, low-density forest, and secondary/regrowth. Distinction is also required between natural forest and plantations.
For each land cover category, information is required about its estimated carbon content per unit area (the difference in carbon densities being a carbon emission factor), its size and in the case of the spatially explicit Approach 3, its geographical location.
The need for improved discrimination between forest types that can be associated with different emission factors (differences in carbon contents) has been highlighted as being of key importance to accommodate REDD+ reporting. If degraded forest is regarded as a different forest type, degradation can be handled in this way.
The EO data options for the generation of Product C1 include:

Page 16
• Optical data: Provides the best EO source for forest type distinction and can be used stand-alone if cloud-free coverage is obtained. The inclusion of the SWIR band significantly improves class distinction. Effects of other bands like red-edge on ESA Sentinel-2 need further research. At least one annual national coverage is required, but dual-season coverage (or more frequent) is preferred.
• L-band SAR is generally insufficient on its own for forest type distinction, but in dual-polarisation mode it could compliment optical and C-band data. The combination of dual polarisation L- and C-band data has been demonstrated to allow separation of certain forest types (e.g., Acacia, oil palm, rubber). Dual-season observations would improve class distinction.
• C-band SAR is similar to L-band, in that it is insufficient on its own for forest type distinction. The combination with dual polarisation L-band data has been demonstrated to allow separation of certain forest types (e.g,. Acacia, oil palm, rubber). Dual-polarisation is an absolute requirement. Utilisation in combination with optical data is unknown.
C2: Degradation Map. Consistent identification and mapping of degradation is of high priority, because of the risk that actions to reduce deforestation could inadvertently increase degradation.
Any tpotential degradation type, e.g. caused by selective logging, partial fire, pests/diseases, drought and fuel-wood collection, or proxies or indicators such as logging roads, vegetation index changes, and changes in canopy structure, should be taken into consideration and mapped if feasible. The map should also include enhancements of carbon stocks resulting from management practices and/or natural causes. e.g. forest management and regrowth.
The EO data options for the generation of Product C2 include:
• Optical data: ESA Sentinel-2 will provide the highest resolution and most spectral bands of the core missions (10m). Further research will be required to assess its potential for degradation mapping.
• SAR data: High resolution SAR data can detect some types of forest degradation e.g., logging activities and related proxies. Further research is necessary to establish suitable schemes to combine degradation indicators with degradation mapping.
Identification and mapping of degradation (or proxies) is an area subject to active research and the EO data requirements for the generation of the C2 product can be expected to vary depending on the type of degradation (or proxy). High spatial temporal observation frequencies are likely to be important. Very high spatial resolution (< 5m) presently is provided only by commercial missions (VHR optical and X-band SAR). For any sensor used, dense time series data can be expected to improve detection, with the temporal frequency depending on degradation type.
C3: Above-ground Biomass Estimates: This product specification is for a map showing vegetation stratified into broad above-ground biomass categories. While this product cannot be expected to meet the accuracy standards required for reporting purposes, it can serve as important proxy information for the derivation or improvement of national emission factors.
The EO data options for the generation of Product C3 include:

Page 17
• Optical data: Can be used in combination with allometric equations or statistical in-situ measurements, where they provide forest area and type information, but are not useful stand-alone. They are useful in combination with L-band SAR to increase biomass saturation level.
• L-band SAR: Useful as a stand-alone measurement for low biomass (<100 t/ha) forests. Dual polarisation is required. Biomass saturation level can be increased when combined with optical data.
• C-band SAR: High temporal density stacking of C-band data have proven useful for estimations of forest above-ground biomass in the boreal zone (<150 t/ha), but this methodology seems unsuitable in dense tropical forests. Further research is needed in preparation of ESA Sentinel-1 for lower biomass forests in the tropical and sub-tropical belts.
2.5 Data Strategy Response to GFOI Information Requirements When in full operation, the CEOS baseline global data acquisition strategy is foreseen to illustrate sufficient satellite data availability to accommodate generation of all the GFOI target products described above in 2.4.
In 2013, when only USGS/NASA Landsat-7 and Landsat-8, and INPE/CRESDA CBERS-3 are in operation of the core data streams (see 3.2), data needs for five out of the eight GFOI target products are foreseen:
• Land Cover (A1)
• IPCC Land Category Transition Map (A2)
• Forest/Non-Forest Cover (B1)
• Forest Cover Change (B2)
• Forest Types (C1)
The products that cannot be expected to be fully served by 2013 are
• Near-Real Time Forest Change Indicators (B3) – requires (cloud-free) observations at high temporal revisit frequency
• Degradation (C2) – data requirements to be defined
• Above-Ground Biomass Estimates (C3) – requires L-band SAR.
Product B3 can first be addressed when ESA Sentinel-1 becomes fully operational, limited to a selected number of countries that request dedicated ESA Sentinel-1A observations (accommodated through Element 2 of the CEOS data strategy – see 3.1 below). When ESA Sentinel-2 becomes fully operational (timing to be confirmed with ESA), product B3 can be expected to be accommodated for all countries, except those with near-permanent cloudiness.
Product C2 is considered a priority research topic for GFOI and the data requirements for the generation of a degradation-type product are at present yet to be defined.
Product C3 is also a labelled a priority research topic for GFOI, where L-band SAR constitutes the sensor type with best sensitivity to above-ground biomass. CONAE/ASI SAOCOM-1 is the only mission of the core data streams carrying an L-band SAR and baseline observations supporting generation of B3 products can be expected in 2016.

Page 18
3.1 Basic Strategy The 2011 CEOS Plenary endorsed the development of a CEOS data strategy for GFOI, which addresses both:
• sustained global observations required in support of the GFOI as it evolves in the coming years in support of policy developments; and
• technical support activities on-going within the GFOI, including continuation of the GEO-FCT National Demonstrators (NDs), and science questions in support of the Methods and Guidance Document development and challenges, such as data interoperability.
The agreed strategy comprises three elements:
1. A baseline, coordinated global data acquisition strategy involving a number of core data streams that can be shared openly and acquired free-of-charge for GFOI purposes. This will involve systematic and sustained wall-to-wall acquisitions of forested areas, globally repeated on timescales consistent with national reporting commitments and the requirements of national forest information systems – which are to be determined but anticipated to require at least annual monitoring in support of biennial reporting for developing countries under REDD+ provisions.. This would provide the default forest observations data for all countries without specific technical requirements, heritage or data preference such as for a particular mission or type of optical or SAR data.
2. A coordinated strategy for national data acquisitions. This will accommodate countries that have specific technical requirements, or heritage and experience working with a particular EO data source or type, as well as the numerous intergovernmental arrangements that may exist or emerge for the supply of certain data to one or more countries. This will involve a wider range of satellite data sources, including data that is ordinarily provided on a commercial basis.
3. Data supply in support of GFOI R&D activities, including support to the science studies assisting the evolution of the MGD for GFOI, interoperability studies, and validation activities – typically also involving higher resolution EO data, some of which is provided commercially and is generally beyond the scope of CEOS agency responsibility.
The first element is the subject of this document. The CEOS baseline global data acquisition strategy for GFOI may be characterised as:
• aiming to illustrate the minimum space data provision necessary for all interested countries to engage in reporting to the relevant UNFCCC frameworks, such as REDD+;
• based on acquisitions undertaken by a number of core data streams (see 3.2 below) - which will allow free-of-charge access to the resulting data archives by countries for national forest information systems;
3 Strategy for Baseline Global Coverage

Page 19
• phased – recognising that sufficient and sustained global coverage by these core data streams will not be feasible for several years, and anticipating the launch of a number of key satellites within the next few years, starting in 2013; national REDD+ requirements and policy considerations have been taken into account so far as possible in designing the evolution of this strategy (see 3.3 below);
• adaptive to changes in requirements, MGD development and to space agency supply plans; the baseline global data acquisition strategy is a living plan which will serve as the basis for SDCG’s on-going communication with, and coordination of, the CEOS agencies providing core data streams or other mission data (see 3.4 below and section 10 on Governance). It will be revised on an annual basis.
3.2 Core Data Streams and their Roles The baseline global data acquisition strategy involves coordination of a number of core data streams that satisfy key criteria consistent with the principles for implementation of the GFOI:
• core data streams provide data, at 30m resolution or finer, free-of-charge and openly shareable for GFOI purposes, consistent with being available in support of any country’s information requirements;
• core data stream systems have a sustained and long-term capacity in coverage, processing and distribution which is consistent with the large (global) scale data requirements of the GFOI.
Discussions among CEOS agencies active within the FCT Task for several years have resulted in consensus on a working list of CEOS agency satellite missions that represent the GFOI Core Data Streams – based on available information regarding known or expected data policies and mission capacities. These include:
• Landsat-7 and -8 (optical) – USGS/NASA; • Sentinel-1 series (C-band SAR) – ESA/EU; • Sentinel-2 series (optical) – ESA/EU; • CBERS-3 and -4 (optical) – INPE/CRESDA; • RADARSAT Constellation Mission (C-band SAR) – CSA.
ESA Sentinel-1 and -2 satellites are part of the Copernicus Space Component under ESA responsibility. Copernicus, previously known as GMES (Global Monitoring for Environment and Security), is the European Programme for the establishment of a European capacity for Earth Observation.
CONAE and ASI are considering the possibility of including the L-band SAR SAOCOM-1 series of satellites as a core data stream candidate. Further CEOS agency missions that satisfy these criteria are encouraged for inclusion in the list of core data streams and the SDCG will actively pursue inclusion of further missions. For the time being, it is assumed that coordination of the baseline global data acquisition strategy will involve CRESDA, CSA, ESA, INPE, USGS/NASA and perhaps CONAE and ASI.
3.2.1 Individual roles of the Core Data Streams The requirements outlined in Section 2 above are assumed to be achieved for most countries through a baseline coverage dataset derived from optical data which is the easiest for most

Page 20
countries to handle and analyse. The assumption is that a combination of USGS/NASA Landsat-7, Landsat-8 (formerly LDCM), and ESA Sentinel-2A will provide more than adequate frequency of coverage for GFOI requirements when space and ground segments are fully operational in 2016, for all regions of the world other than those most affected by persistent cloud cover. Prior to availability of the ESA Sentinel-2A data stream, there will be a dependence on USGS/NASA Landsat-7 and -8 in the transition to global coverage.
INPE/CRESDA CBERS-3 and -4 are foreseen as having a significant regional role dictated by its ground station network in Brazil, China, and when fully developed, central Africa. It can also play a role in supporting global coverage needs through to the simultaneous operation of USGS/NASA Landsat-7, Landsat-8, and ESA Sentinel-2A, as well as performing a gap-filling role.
ESA Sentinel-1A offers the first prospect of a radar core data stream, from 2014, and its C-band data will in the start be focused provision of time series data in the tropical and subtropical regions.
The CSA RADARSAT Constellation Mission is being planned to provide synergies and interoperability with the ESA Sentinel-1 series and will provide continuity of gap-filling capabilities for GFOI.
The high availability of C-band SAR data in future will provide opportunities for frequent observations.
The CONAE/ASI SAOCOM-1A mission would be one (or may be the only one) of the radar core data stream candidates operating in L-band frequency. L-band SAR is due to its relatively long wavelength sensitive to forest and vegetation structure and this makes the SAOCOM-1 data an important contribution (see 2.4), in particular in very cloudy regions where sufficient optical cannot be obtained.
3.2.2 GFOI Contributing Data Streams Whilst few CEOS agency missions may currently satisfy the criteria to be classified as a GFOI Core Data Stream, many more will be able to contribute to systematic national, regional, and global coverage – and thereby to the three Elements of the CEOS Data Strategy for GFOI. These include optical high-resolution missions, (such as RapidEye and the SPOT series), as well as other radar missions (such as ALOS-2, Radarsat-2, TerraSAR-X and TanDEM-X). The data from these further missions can also support validation and technical studies. This data may also be needed to satisfy reporting requirements in terms of detection thresholds, secure or enhanced frequency and reliability of cloud-free coverage. They will also be critical in supporting global coverage during the transition period of the core data streams in the early years of the strategy, mainly from 2013 to 2015.
3.3 Phases It is assumed that a new climate treaty with REDD+ provisions will be agreed in 2015 and that there will be a requirement for historical data for setting reference levels.
The GFOI Implementation Plan calls for the key components (including Observations & Measurement) to be operational by the end of 2015. As far as possible, timing of the CEOS Baseline Global Data Acquisition Strategy for GFOI should reflect and support the schedule indicated in the GFOI Implementation Plan. In practical terms, the failure of a number of key data streams in recent years (INPE/CRESDA CBERS-2, JAXA ALOS, ESA Envisat, and USGS/NASA Landsat-5), and delays to the operational availability of their replacements will
Page 21
limit the ability of contributing CEOS agencies to guarantee sustained global coverage consistent with national reporting requirements, until 2016 – which is proposed to be the first year for formal accomplishment of full global space data available in support of GFOI requirements.
A phased approach is proposed by SDCG to:
• allow the establishment of the necessary coordination processes with contributing agencies;
• reflect the schedule of gradually increasing availability of the anticipated core data streams between now and 2016;
• reflect priorities set by the policy context and readiness of individual countries to participate in REDD+ development;
• take into account the need for continuity of coverage of the existing National Demonstrator countries established under the GEO-FCT Task as a precursor to GFOI.
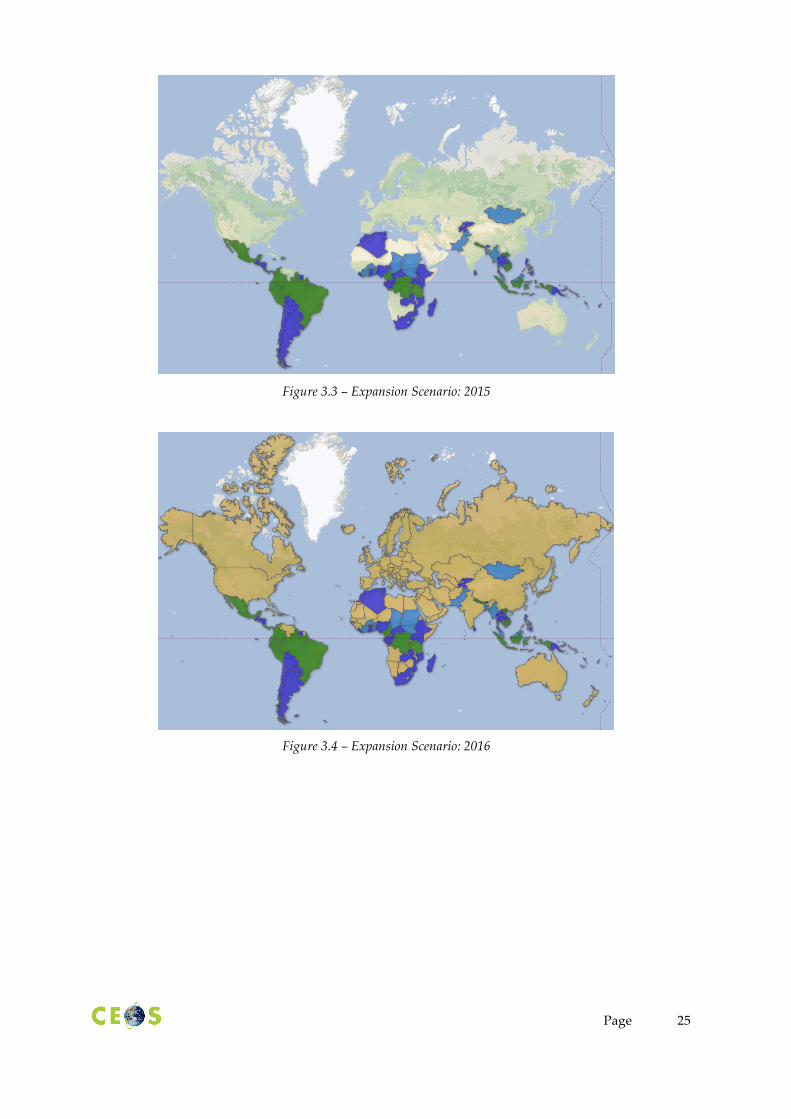
Table 3.1 indicates the proposed schedule for the establishment of the baseline global data acquisition strategy for GFOI by 2016 – consistent with the above considerations:
Year Coverage added No. countries* Area* (Mkm2) Total Area*
(Mkm2)
2013 GEO-FCT National Demonstrator countries
GFOI Participating Countries 15 20.5 20.5
2014
UN-REDD National Programme Countries
WB-FCPF Participating Countries
CD-REDD Project Countries (BMU)
36 18.5 39.0
2015
UN-REDD Partner Countries
WB-FCPF Partner Countries
Other Pan-Tropical Countries
17 9.0 48.0
2016 Global 127 84.8 132.8
Table 3.1 - Proposed schedule for the establishment of the baseline global data acquisitions for GFOI. (* the number of countries and areas exclude overlap between the groups)
The phasing of the strategy applies to coordination of the necessary satellite data acquisitions consistent with national reporting requirements. The strategy is:
- working to ensure continuity of coverage of the FCT National Demonstrator countries and adds as a priority to those countries that are seeking active participation in GFOI and have engaged in related capacity building activities;
- dependent on the launch of the core data streams anticipated between 2013 and 2016 and generally consistent with their acquisition capacities; these are:
• USGS/NASA Landsat-8 (launched 11 February 2013); • INPE/CRESDA CBERS-3 and -4 (late 2013, mid 2014); • ESA Sentinel-1A and -1B (late 2013, 2015);

Page 22
• ESA Sentinel-2A and -2B (mid 2014, 2015); • CONAE/ASI SAOCOM-1A and -1B (2015, 2016)
- consistent with the goal of supporting countries that have ambitions to participate in the
REDD+ frameworks – seeking to provide those countries that have demonstrated readiness with the required wall-to-wall coverage as soon as capacity is available;
- prioritising tropical and sub-tropical forest coverage, consistent with the policy considerations; and
- reflecting engagement of different countries using priorities agreed with the GFOI Steering Committee and the newly formed GFOI Project Office.
The strategy is built around Core Data Streams, which as a part of their designation feature free and open data distribution policies. However, there is a data distribution and delivery service which needs to be added on top of this strategy to ensure countries are able to leverage the data acquired. While not a part of the terms of reference of SDCG, potential development of that service is discussed further in in this document.
3.4 Strategy Maintenance The requirements for the baseline global data acquisition strategy can be anticipated to evolve continuously as the policy and methodological framework around REDD+ develop, and as individual countries determine positions and engage with FCPF, UN-REDD and GFOI. The acquisition capacity can also be expected to change as satellite schedules are altered and national data policies and acquisition strategies evolve.
The baseline global data acquisition strategy will continue to be maintained, in the first instance by the SDCG, as a means of managing expectations of the policy community and of individual countries as to space data availability, and for on-going coordination of the implementation efforts of the contributing space agencies. SDCG proposes to update the baseline global data acquisition strategy at least annually for review at its meetings, endorsement at the CEOS SIT meeting and approval by the data stream agencies. Governance issues are discussed in Section 10 and include continued direction from the GFOI Steering Committee (on evolution of the requirements and policy context) and interaction with the CEOS Strategic Implementation Team (for coordination of implementation matters).
Year Country GEO-FCT ND
GFOI Part’ip.
WB FCPF Part’ip.
UN-REDD Nat. Prog.
GIZ CD-REDD
WB FCPF Cand.
UN-REDD Partner
2013
Brazil √ Cameroon √ √ √ Colombia √ √* √ √
Democratic Republic of the Congo √ √* √ Guyana √ √ √
Indonesia √ √* √ Mexico √ √ √ Nepal √ √* √ Peru √ √ √ √
United Republic of Tanzania √ √ √ Cambodia √ √ √ Costa Rica √ √* √
Ecuador √ √ Panama √ √ √ Viet Nam √ √* √

2014
Argentina √ √ √ Bolivia (Plurinational State of) √ √
Central African Republic √ √ Chile √ √ √
El Salvador √ Ethiopia √* √ Gabon √ √ Ghana √* √ √
Guatemala √ √ Honduras √ √
Kenya √ √ Lao People’s Democratic Republic √* √ √
Liberia √* Madagascar √ Mozambique √* √
Nicaragua √* Papua New Guinea √ √
Paraguay √ √ Congo √* √
Suriname √ √ Thailand √ √ √ Uganda √ √ Vanuatu √ Nigeria √ √
Philippines √ √ √ Solomon Islands √
Sri Lanka √ √ Zambia √ √ Bhutan √ √ √
Morocco √ √ South Africa √
Uruguay √ √ Algeria √ Tunisia √
Kyrgyzstan √ Tajikistan √
2015
Belize √ Burkina Faso √
Burundi √ Chad √
Côte d'Ivoire √ √ Dominican Republic √
Fiji √ Jamaica √ Pakistan √ √
South Sudan √ √ Sudan √ √ Togo √
Bangladesh √ Benin √
Malaysia √ Mongolia √ Myanmar √
2016 Remaining Global
Table 3.2 – Countries involved in the GEO-FCT, WB FCPF, UN-REDD and GIZ CD-REDD processes (*FCPF Readiness Grant signed, or soon expected to be signed)

Page 24
Figure 3.1 – Expansion scenario: 2013
Figure 3.2 – Expansion Scenario: 2014
Page 25
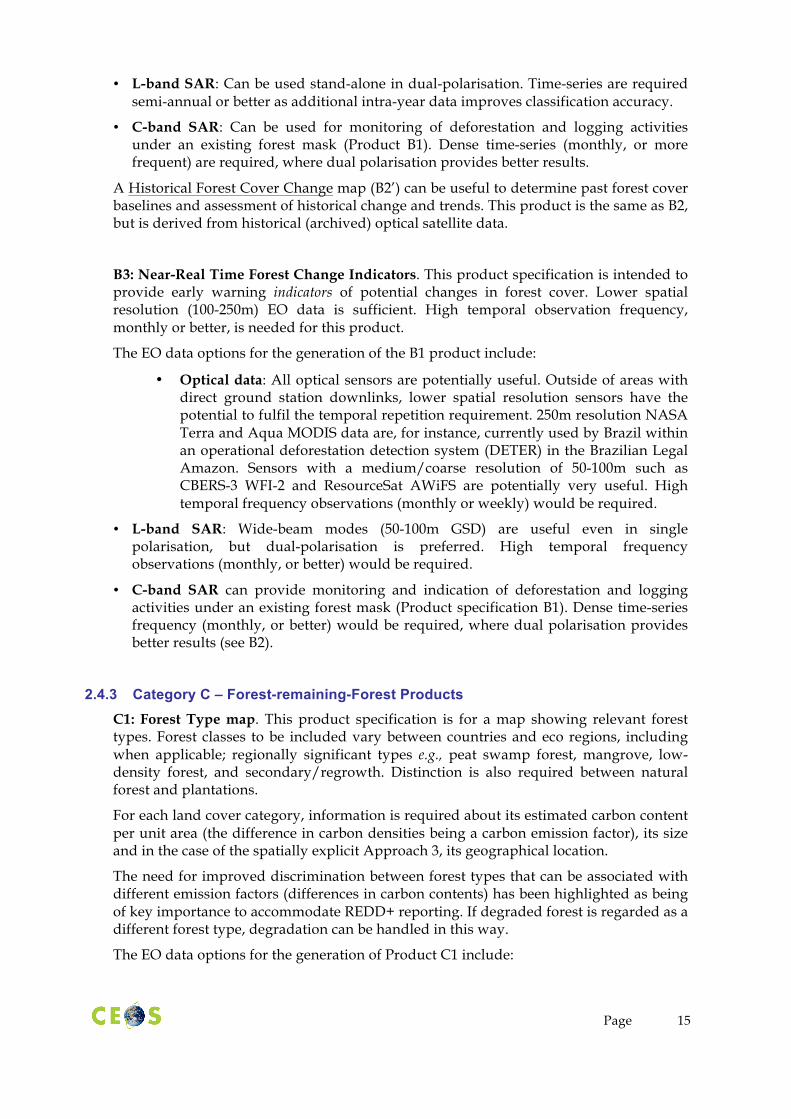
Figure 3.3 – Expansion Scenario: 2015
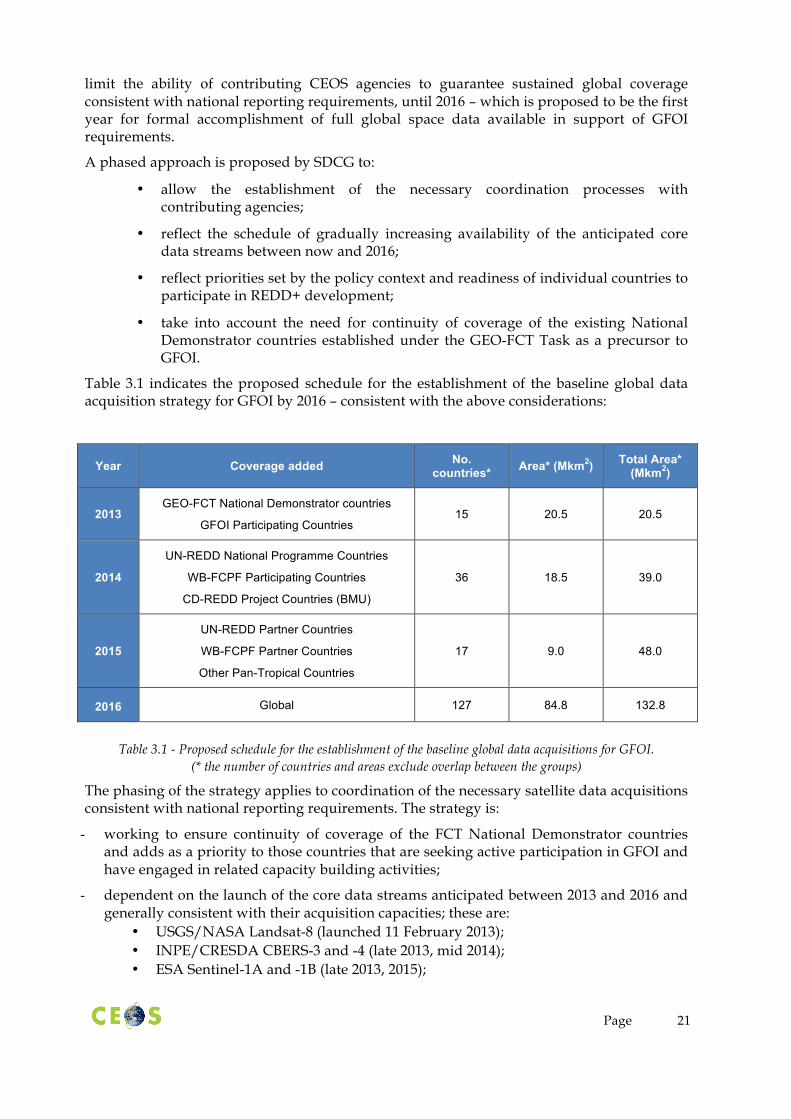
Figure 3.4 – Expansion Scenario: 2016
Page 26
4.1 Introduction and Overview This section outlines the implementation steps required to address the requirements that were defined in Section 2 following the strategy defined in Section 3. It is intended to give guidance to satellite operators and EO data providers.
The implementation is characterised and assessed by:
• summarising the combined core missions “business as usual” (BAU) coverage plans;
• assessing the capacity of the combined BAU plans against the anticipated impact of clouds;
• suggesting recommendations to the BAU plans to better meet GFOI data requirements;
• provide early input to mission teams of key future systems; and • provide general suggestions on how Contributing Data Streams could be employed
to augment or fill critical data gaps.
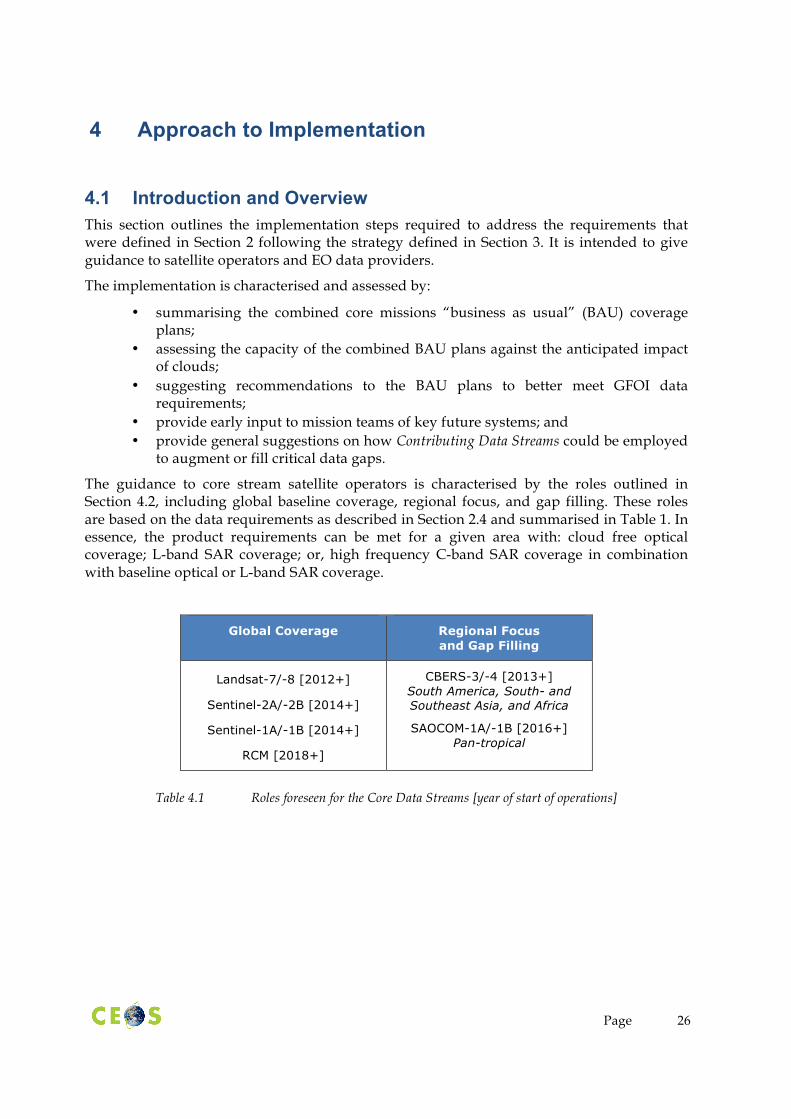
The guidance to core stream satellite operators is characterised by the roles outlined in Section 4.2, including global baseline coverage, regional focus, and gap filling. These roles are based on the data requirements as described in Section 2.4 and summarised in Table 1. In essence, the product requirements can be met for a given area with: cloud free optical coverage; L-band SAR coverage; or, high frequency C-band SAR coverage in combination with baseline optical or L-band SAR coverage.
Global Coverage Regional Focus and Gap Filling
Landsat-7/-8 [2012+]
Sentinel-2A/-2B [2014+]
Sentinel-1A/-1B [2014+]
RCM [2018+]
CBERS-3/-4 [2013+] South America, South- and Southeast Asia, and Africa
SAOCOM-1A/-1B [2016+] Pan-tropical
Table 4.1 Roles foreseen for the Core Data Streams [year of start of operations]
4 Approach to Implementation

Page 27
4.2 Global Baseline Coverage
The technical characteristics and global scale capacity of the USGS/NASA Landsat and ESA Sentinel-2 systems make them key data streams for the GFOI. An indication of their relevance relative to the GFOI forest information target products (see 2.4) is given in Table 4.2 below:
LC A1
LCC A2
F/NF B1
FCC B2
FCC ind B3
F type C1
Degr C2
Biom C3
Landsat 7 & 8 O O O O Δ O Δ Δ
Sentinel 2A & 2B O O O O O O Δ Δ
Table 4.2 Sensor relevance to GFOI target products (O: can be used stand-alone; Δ: can provide partial or complementary information
when in combination with another core sensor, or under other certain circumstances)
4.2.1 Landsat
BAU: USGS/NASA Landsat and the Landsat Long Term Acquisition Plan Acquisitions by the Landsat-7 and Landsat-8 missions are guided by a Long Term Acquisition Plan (LTAP). This plan is used to direct the acquisition of Landsat images, driven by specific parameters: seasonality; land definition; historical coverage, and more recently forecasted cloud cover; gain settings; and sun angle.
The LTAP prescribes which scenes the Landsat missions should acquire. Essentially, the current Landsat-7 and Landsat-8 missions utilize the LTAP to determine when to “turn on” the sensors. Future missions may operate exactly the opposite only turning off sensors occasionally.
While the LTAP is based on individual images, post-processing of the Landsat archive has enabled the generation of cloud-free mosaics based on a set of techniques known as “pixel mining”. The first broad-based implementation of this approach was conducted by the Web-enabled Landsat Data (WELD) project. WELD currently generates 30-meter composites of Landsat-7 Enhanced Thematic Mapper Plus (ETM+) terrain corrected mosaics at weekly, monthly, seasonal and annual periods for the conterminous United States and Alaska. These mosaics provide consistent data that can be used to derive land cover products.
Pixel mining approaches like WELD are expected to provide a valuable capacity, especially in cloud-affected areas. This is discussed further in section 7.1.2.
BAU: USGS/NASA Landsat Capacity Assessment Together, the Landsat-7 and Landsat-8 missions offer an 8-day revisit time, with each individual satellite revisiting every 16-days. Data are acquired during every opportunity over U.S. territory, as well as in South America and in Australia within the Brazilian and Australian ground station masks. Globally, the LTAP aims at achieving at least four cloud-free coverages of every land locale per year, with the exception of smaller Pacific islands which may require individual acquisition requests. The average duty cycles of the two systems is 10 - 11 minutes per orbit, corresponding to about 380 scenes/day for Landsat-7 and some 400 scenes/day for Landsat-8.

Page 28
In regions with persistent cloud cover, analysis from Landsat-7 actual acquisitions has shown that the number of observations based on the LTAP have not been sufficient to achieve this goal of four cloud-free coverages per year. An assessment of Landsat-7 acquisitions over two countries (the Democratic Republic of the Congo and Guyana) from 2000 through 2010 was conducted to assess the frequency of acquisitions and the impact of clouds on acquisition success. A summary of those results are available in Annex B.
4.2.2 Sentinel-2
BAU: Plans for ESA Sentinel-2 Acquisitions The ESA Sentinel High Level Operation Plan (HLOP) identifies the main constraints, limitations and potential conflicts, describes the strategy and provides high-level exploitation (for details see Sentinel-1 under 4.4.1).
The Sentinel-2 instrument has been designed to cover systematically all land surfaces between 56° South latitude (Cape Horn in South America) and 84° North latitude (north of Greenland) including major islands (greater than 100 km2 size), EU islands and all the other small islands located at less than 20km from the coastline, the whole Mediterranean Sea as well as all inland water bodies and closed seas.
The ESA Sentinel-2 satellites will have a repeat cycle of 5 days for the 2-satellite constellation (Sentinel-2A and -2B), where each satellite has a revisit time of 10 days. ESA Sentinel-2 will use the same core ground station network and the European Data Relay System (EDRS) in the Payload Data Ground Segment (PDGS) as ESA Sentinel-1.
BAU: ESA Sentinel-2 Capacity Assessment The PDGS is expected to become available through a phased period of approximately 18 to 24 months beginning with the launch of ESA Sentinel-2A (June 2014). ESA Sentinel-2A’s ramping-up will be defined in late 2013. ESA Sentinel-2B launch target is May 2015.
From 2014 to 2015 ESA Sentinel-2A will be relied upon with a gradual ramping-up of coverage areas, repetitiveness and ground station capabilities. Once the full operational PDGS setup is attained, ESA Sentinel-2A and 2B will systematically cover all land masses between S56 and N84 latitude (5-day combined revisit, or maximum of 73 observations/year). The average duty cycle of the multispectral instrument is 17 minutes, allowing peak performance up to 32 minutes per orbit.
The standard user product from the PDGS is Level 1C ortho-rectified Top Of Atmosphere reflectance, which is archived systematically and provided as 100kmx100km tiles (~ 500Mb). This product includes the parameters for reflectance to radiance conversion.

Page 29
Figure 4.1 Swath coverage for the MSI instrument on ESA Sentinel-2A and -2B over the Democratic Republic of the Congo (DRC). Full coverage of the country requires 7 separate 290-km swaths. The light grey tracks are days 1-5 of the 10-day repeat cycle and the yellow tracks are days 6-10 of the repeat cycle. It will require 10 days to cover DRC with one mission, and 5 days with two missions. This coverage requires ~26 minutes of data acquisition and 160 GB of data volume. (Source: SEO COVE)
4.2.3 Sentinel-1
Observations with high temporal repeat might be required in order to optimise usefulness of C-band SAR for GFOI, it must therefore be determined how an efficient global-scale observation pattern for ESA Sentinel-1 can be implemented. It is proposed to start with using the capacities of the two missions to focus on tropical and subtropical areas. An indication of the foreseen relevance of ESA Sentinel-1 to the GFOI forest information target products (see 2.4) is given in Table 4.3 below:
LC A1
LCC A2
F/NF B1
FCC B2
FCC ind B3
F type C1
Degr C2
Biom C3
Sentinel 1A & 1B Δ – – O O Δ – –
RCM Δ – – O O Δ – –
Table 4.3. Sensor relevance to GFOI target products (O: can be used stand-alone; Δ: can provide partial or complementary information
when in combination with another core sensor, or under other certain circumstances)
BAU: Plans for ESA Sentinel-1 Acquisitions The ESA Sentinel High Level Operation Plan (HLOP) identifies the main constraints, limitations and potential conflicts related to the high level operations of the ESA Sentinel missions. The HLOP describes the measures and the strategy to cope with these constraints

Page 30
and to allocate ESA Sentinel resources with the goal of reducing the potential conflicts during operations and providing a high level exploitation of the ESA Sentinel Operations.
The implementation of a pre-defined observation strategy for the ESA Sentinel-1 and Sentinel-2 missions is based on a careful analysis of the user needs and optimisation of the related space and ground resources. This is necessary due to the various constraints related to these missions.
The up to 18 months ramp-up phase of ESA Sentinel-1 starts at completion of the 3-month commissioning phase that follows the launch of ESA Sentinel-1A (Oct 2013), and continues until the Full Operational Capacity is reached with the constellation of the ESA Sentinel-1A and -1B.
Figure 4.2 Sentinel-1 acquisitions (simulation) over parts of Europe and surrounding waters – IWS mode, descending orbits over a 12-day repeat cycle
Once the full operational setup is reached, ESA Sentinel-1A and -1B are planned to regularly cover the world, where the default mode over land is the Interferometric Wide-Swath (IWS) mode. The respective polarisation mode (single vs. dual polarisation) is depending on mission and application requirements, as well as the overall system capacity; in particular the data download constraints.
BAU: ESA Sentinel-1 Capacity Assessment A preliminary and indicative observation scenario for the first 6 months of the ESA Sentinel-1 exploitation phase - where only two core ground stations (Matera and Svalbard) will be available - is being defined. Highest priority is given to GMES services and use, as well as to national services and use by ESA/EU Member States. Coverage of Europe, European waters, and North Pole remain the priority areas for ESA Sentinel-1 operations. Outside of Europe operations, a campaign to support forest monitoring international activities is foreseen. The use of the dual polarisation (potentially VV+VH) is still to be confirmed during the ramp-up phase, as this is may overload the sensor/downlink capacities.

Page 31
With Full Operational Capacity, the ESA Sentinel-1 resources are expected to allow a substantial amount of data relevant to global forest monitoring. The design of the related global acquisition plan is still under consideration by ESA.
The potential for interoperable use of C-band SAR with other SAR systems should be highlighted also here. C-band frequency is complementary to both L- and X-band and as mentioned above, synergetic use of C-band and L-band SAR has for instance demonstrated the potential for improved distinction of key forest types such as rubber, oil palm and Acacia.
4.2.4 CSA RADARSAT Constellation Mission (RCM) CSA RCM and ESA Sentinel-1 will have comparable configurations and the anticipated roles for the two missions pertaining to GFOI can be expected to be similar. The high level of complementarity between the missions allows for a high level of coordination in the acquisition planning for GFOI, similar to that of ESA RADARSAT-2 and ESA ENVISAT ASAR within the GEO Forest Carbon Tracking Task.
CSA RCM will feature largely pre-programmed acquisitions to meet clearly defined user needs. CSA is currently conducting capacity assessments for domestic use, which will help determine capacities to support campaigns like the GFOI. Prelaunch requests from the SDCG in support of GFOI may be possible to integrate with the concept of operations currently under development.
4.3 Regional Focus and Gap Filling
The INPE/CRESDA CBERS-3/-4 and CONAE/ASI SAOCOM-1 missions may not be intended for full global-scale operations, but do have the capacity to fulfil regional/semi-continental scale observations consistent with GFOI objectives.
LC A1
LCC A2
F/NF B1
FCC B2
FCC ind B3
F type C1
Degr C2
Biom C3
CBERS 3 & 4 (MUXCAM, PanMUX, IRS)
O O O O – O Δ Δ
SAOCOM 1A & 1B O O O O Δ Δ – O
Table 4.4. Sensor relevance to GFOI target products (O: can be used stand-alone; Δ: can provide partial or complementary information
when in combination with another core sensor, or under other certain circumstances)
4.3.1 CBERS-3 and -4
BAU: Plans for INPE/CRESAD CBERS-3 and -4 Acquisitions INPE/CRESDA CBERS-3 is scheduled for launch in late 2013, with CBERS-4 planned to follow in mid 2014. The two satellites are identical in configuration. While Brazil (INPE) and China (CRESDA) home country geographic areas are the first priority for the CBERS-3 and -4

Page 32
missions, every opportunity observations are planned within the entire coverage areas of the INPE (Cuiaba1) and the CRESDA (Miyun, Sanya and Kashi2) ground stations. As shown in Figure 4.2, the stations cover most of tropical South America, and South- and Southeast Asia. It is anticipated that all data acquired will be processed and made available through the INPE and CRESDA catalogues.
CBERS for Africa is an on-going initiative by INPE to establish a network of CBERS ground stations in Africa (Maspalomas/Spain, Aswan/Egypt, Libreville/Gabon, Mahlindi/Kenya, Hartebeesthoek/South Africa). The Maspalomas and Hartebeesthoek ground stations are expected to be ready for operations by the end of 2013. The schedule for the remaining African ground station upgrades is not currently available, but once in operations, the stations will cover the whole African continent.
Figure 4.3. INPE/CRESDA CBERS-3 & 4 ground station coverages for INPE (left) and for CRESDA (right).
The ground station network over Africa is presently under establishment.
BAU: INPE/CRESDA CBERS-3 Capacity Assessment During routine operations, all four instruments on INPE/CRESDA CBERS (MUXCam, PanMUX, IRS, WFI-2) are planned to be acquired simultaneously. The combined data rate for the four instruments is about 300 mbps, which is within the capacity for the X-band downlink. The system duty cycle is approximately 15 minutes per orbit for each satellite.
INPE and CRESDA have not (yet) developed plans for systematic observations outside the INPE/CRESDA CBERS ground station network, but capacity exists to extend observations also to other areas by use of the On-Board Recorder (OBR) in support of GFOI.
1 The Cuiaba ground station covers in full: Brazil, Bolivia, Paraguay, Surinam and Uruguay, and in part: Guyana, Venezuela, Colombia, Peru, Chile and Argentina.
2 The Miyun, Sanya and Kashi ground stations cover in full in South and Southeast Asia: China, Pakistan, Nepal, Bhutan, Bangladesh, Burma, Thailand, Malaysia, Brunei, Laos, Cambodia, Vietnam, Philippines and Singapore, and in part: Indonesia (Kalimantan and north and central Sumatra) and India.

Page 33
4.3.2 Argentine-Italian SAOCOM-1
BAU: Plans for Pan-tropical observations The CONAE/ASI SAOCOM-1 mission is one (or may be the only one) of the radar core data streams operating in L-band frequency. L-band SAR is due to its relatively long wavelength sensitive to forest and vegetation structure and CONAE/ASI SAOCOM-1 data can therefore be expected to constitute an important contribution to the development of several of the GFOI target forest information product specifications (see 2.4).
The potential of sensor interoperability should also be highlighted, as the L-band frequency is complementary to both C- and X-band SAR. Synergetic use of L-band and C-band has for instance demonstrated the potential for improved distinction of forest plantations from natural forest.
The first priority for SAOCOM-1 is acquisitions over Argentina, and over Europe, within the framework of the SIASGE System which is composed by Argentine-Italian SAOCOM Constellation and the Italian COSMO SkyMed Constellation. A Global Background Mission strategy is under development for the remaining capacity. Its objective is to foresee acquisitions of certain valuable data to generate a data base useful for future uses, according to the available resources. In particular, pan-tropical coverage utilising the dual-polarisation mode two to three times per year might receive priority and is under consideration. With launch of CONAE/ASI SAOCOM-1A in late 2015, the first pan-tropical coverage can be expected in 2016. CONAE/ASI SAOCOM-1B is scheduled for launch 6 months after 1A.
BAU: CONAE/ASI SAOCOM Capacity Assessment Ground stations in Cordoba (Argentina), Matera (Italy) will be used for direct downlink and playback of onboard recorder data. Also, Fairbanks (Alaska) is under consideration to be used for data downlink but the corresponding agreements are still under negotiation. The possibility of using Svalbard GS is also under consideration.
The average duty cycle for CONAE/ASI SAOCOM-1 is about 15 minutes per orbit (for each satellite). The on-board recorder capacity is 256 Gbits, which corresponds to 14-17 minutes of recorded data, depending on the observation mode used. Data will be downlinked at a constant data rate (310 mbps).

Page 34
5.1 2013 In terms of geographical coverage, USGS/NASA Landsat 7 and Landsat 8 will already in the 2013 time frame provide full global coverage (see 4.2.1). The question is whether the number of acquisitions over a country can be expected to be sufficient to obtain a minimum of one clear-sky coverage per year.
With the Landsat Long-Term Acquisition Plan (LTAP) plans, the continental USA, and the regions within station masks of the Brazilian and Australian ground stations in Cuiaba, Alice Springs and Darwin (major part of South America, Australia, Papua New Guinea and the southern islands of Indonesia) are foreseen to be covered by every acquisition opportunity. Starting from May 2013 when Landsat-8 is assumed to be fully operational, the two satellites combined will provide acquisitions almost 4 times per month, corresponding to about 3 potential wall-to-wall coverages per month when the Landsat-73 scan line errors has been taken into account..
The number of observations that can be foreseen for the rest of the world through the LTAP has been estimated based on the analysis of the Landsat-7 LTAP database over D.R. Congo described under 4.2.1 above. Based on the assumption that the Landsat operations over the DRC can be considered representative for any (tropical) country (probably some regional variations), an average of about 10 observations per year can be expected for an arbitrary area in the world by each of Landsat-7 and Landsat-8. For 2013, this would mean approximately 10 useful coverages (about 5 by Landsat-8 and 10/2 by Landsat-7). According to the DRC analysis example, 10 coverages per year would yield clear sky coverage for about 50% of the country, which thus would be insufficient to fully meet the coverage requirements for GFOI in 2013.
Figure 5.1 – Number of monthly coverages foreseen by Landsat-73 and Landsat-8 in 2013.
3 In order to account for the impact of the systematic data loss caused by the Landsat-7 ETM+ scan line error, the number of foreseen observations by Landsat-7 has here been divided by a factor 2.
5 Core Data Stream Coverage Analysis

Page 35
Figure 5.1 above provides an indication for Other Contributing data streams where optical Core data streams can be expected to be insufficient, and gap-filling observations may be of interest. Regions in orange have the lowest number of expected observations, according to the BAU LTAP plans for the two Landsat satellites, including e.g. Central America, Africa, central Asia and parts of Southeast Asia. Contributing mission operators are also reminded to consider the countries designated as priorities for GFOI, listed in Table 3.2 above (16 countries in 2013).
5.2 2014 In the 2014 time frame, INPE/CRESDA CBERS-3 is also expected to be in full operations. Every opportunity observations with CBERS-3 will result in about 14 coverages per year, which is what is planned over INPE’s Cuiaba ground station as well as over the three main ground stations in China operated by CRESDA. CBERS-3 has capacity to acquire data also outside the coverage of the ground stations, but no systematic overage is planned for 2014 according to the CBERS-3 BAU plans.
Figure 5.2 illustrates the number of coverages foreseen in 2014 by CBERS-3, Landsat-7 and Landsat-8. Compared to 2013, coverage is improved from about one to two observations per month over Southeast Asia, Oceania and the southern and western parts of Africa through the CBERS ground stations in China and Africa. Central Africa and Central America have the lowest number of coverages according to the BAU plans of the three missions in question.
The expansion plan for 2014 calls for the inclusion of an additional 28 countries (all UN-REDD Pilots, additional BMU funded FAO countries and World Bank FCPF Participating countries).
Figure 5.2 – Average number of monthly coverages foreseen by Landsat-7 and -8 and CBERS-3 in 2014.
ESA Sentinel-1A and the Payload Data Ground Segment (PDGS) will be in its ramp-up phase and C-band Synthetic Aperture Radar observations are in 2014 expected to be limited over mainly Europe and surrounding waters and the Arctic (not shown in Figure 5.2).

Page 36
5.3 2015 ESA Sentinel-2A is expected to be operational in 2015, with ESA Sentinel-2B coming up later the same year. Using the same ground segment (PDGS) as Sentinel-1, the ramp-up is expected to be completed 18-24 months after the launch of 2A, around early or mid 2016.
In anticipation of ESA’s plans for Sentinel-2 observations to be made public, a conservative tentative assumption for 2015 is that ESA Sentinel-2 observations will be limited to Europe. When further information becomes available, this information will be updated.
Scheduled for launch in 2014, the INPE/CRESDA CBERS-4 mission is also expected to be in operation in 2015, adding capacity to that of CBERS-3.
The expected coverage for the 2015 time frame is shown in Figure 5.3. The observation frequency over Europe and over the regions covered by the INPE and CRESDA ground stations will be improved, while the limited number of coverages over large parts of Africa, Central America and parts of South America and, to a lesser extent, over southern Indonesia and Oceania, remain.
The expansion plan for 2015 calls for the inclusion of an additional 16 countries (remaining UN-REDD Observer and World Bank FCPF Candidate countries). See Table 3.2 and figures 3.1-3.4 for details.
Figure 5.3 – Average number of monthly coverages foreseen by Landsat-7 and -8, CBERS-3 and -4, and
Sentinel-2A in 2015.
Synthetic Aperture Radar observations with Sentinel-1A and, launched in 2014, Sentinel-1B are in 2015 expected to gradually cover areas also outside the European region and the Arctic
5.4 2016 Full coverage of all global land areas six times per month can be expected in early or mid 2016, when the ESA Sentinel-2A, -2B and the Payload Data Ground Segment are foreseen to be in full operations. Adding to the coverages already provided by the USGS/NASA Landsat-7 and -8 and INPE/CRESDA CBERS-3 and -4, more than eight coverages per month can be expected even for the least covered regions (orange in Figure 5.3). The most frequently covered region (central part of South America) may be covered more than 12 times, or some 150 times in a year.
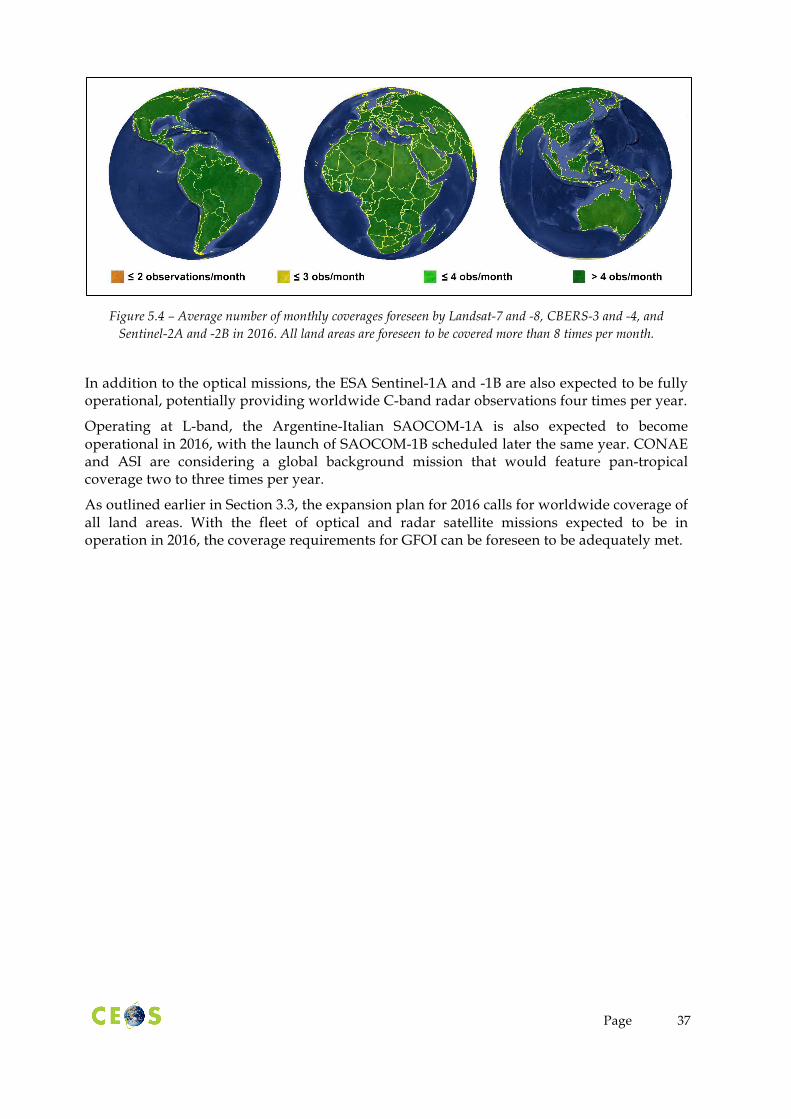
Page 37
Figure 5.4 – Average number of monthly coverages foreseen by Landsat-7 and -8, CBERS-3 and -4, and
Sentinel-2A and -2B in 2016. All land areas are foreseen to be covered more than 8 times per month.
In addition to the optical missions, the ESA Sentinel-1A and -1B are also expected to be fully operational, potentially providing worldwide C-band radar observations four times per year.
Operating at L-band, the Argentine-Italian SAOCOM-1A is also expected to become operational in 2016, with the launch of SAOCOM-1B scheduled later the same year. CONAE and ASI are considering a global background mission that would feature pan-tropical coverage two to three times per year.
As outlined earlier in Section 3.3, the expansion plan for 2016 calls for worldwide coverage of all land areas. With the fleet of optical and radar satellite missions expected to be in operation in 2016, the coverage requirements for GFOI can be foreseen to be adequately met.

Page 38
The approach to implementation of a baseline global data acquisition strategy for GFOI relies on Core data streams as outlined in Section 3.2. However, there are a number of important Other Contributing data streams that can make very valuable contributions to providing coverage, either as complementary gap-filling observations in areas or times where Core data are insufficient, or by providing thematic information not available on the Core missions. In most cases, this will be national level coverage and therefore will be implemented under strategy Element 2, to be developed in 2013 and implemented in 2014. An increased importance also exists during the early phase of the Element 1 baseline global data acquisition strategy, where Other Contributing data streams will be needed to fill critical gaps, also as precursors or pilots for strategy Element 2.
The actual usage of these data streams will depend on interest expressed from countries via Element 2 of the strategy. However, in general the following roles could be envisioned.
LC A1
LCC A2
F/NF B1
FCC B2
FCC ind B3
F type C1
Degr C2
Biom C3
RapidEye O O O O Δ O Δ Δ
SPOT O O O O – O Δ Δ
ALOS-2 O O O O O Δ – O
RADARSAT-2 Δ – – O O Δ – –
TerraSAR-X and TanDEM-X
Δ – O O O Δ Ο –
ResourceSat-2 (AWiFS) – – – – O – – –
Table 6.1 Contributing missions potential relevance to GFOI target products (O: can be used stand-alone; Δ: can provide partial or complementary information
when in combination with another core sensor, or under other certain circumstances)
6.1 RapidEye DLR/Public-Private Partnership (DLR/PPP) RapidEye is a constellation of five satellites used to facilitate frequent observations and reduction of the impact of cloud cover. It features an annual global acquisition plan with a priority over forested areas. The specific details of the plan (temporal repeat, regional focus areas) depend on actual user needs and orders.
With the high revisit frequency together with a spatial resolution of 6.5 metres, DLR/PPP RapidEye has the technical potential to support generation of all the GFOI target products. DLR/PPP RapidEye are therefore encouraged to consider the outcome of the coverage analysis (section 5) in their acquisition planning, and in collaboration with DLR, CNES and KSAT, coordinate RapidEye and SPOT data acquisition planning over the Congo Basin and Madagascar.
6 Roles for Other Contributing Data Streams

Page 39
DLR/PPP RapidEye is encouraged to continue acquisition of data for GFOI R&D activities
6.2 SPOT Optical data from the CNES SPOT systems are of potential relevance to all of the GFOI target products. There is no global systematic acquisition plan implemented, but CNES SPOT-4 and -5 have since 2010 been used to undertake systematic annual observations over the Congo Basin and Madagascar in support of REDD+ activities in the regions, through an initiative by the French government. The initiative is to be completed in 2014, when the two satellites will have reached the end of their mission lives. CNES SPOT-4 was recently decommissioned and CNES SPOT-5 is planned to be decommissioned in mid-2014.
The data are publicly available through a special user agreement for REDD+ purposes, and can be used by GFOI countries in the region.
In accordance with actions from the 2nd SDCG meeting (Sept 2012), CNES is encouraged to continue efforts for acquisitions over cloudy areas in Congo Basin Initiative countries and Madagascar, and in collaboration with DLR, RapidEye and KSAT, coordinate CNES SPOT and RapidEye data acquisition planning over the Congo Basin and Madagascar.
6.3 ALOS-2 JAXA ALOS-2 is scheduled for launch in late 2013. It will be the only L-band SAR in operation until the planned launch of CONAE/ASI SAOCOM-1A. With L-band sensitivity to vegetation structure, JAXA ALOS-2 has potential to support several of the GFOI target products, in particular in countries with severe cloud cover and those with past experience of L-band SAR. The potential for interoperable use of L-band SAR with both optical and other SAR systems should be noted also here.
Forest monitoring defined as one of key objectives for JAXA ALOS-2 and a global acquisition strategy – the Basic Observation Scenario (BOS) – is under development to maintain continuity with JAXA ALOS-1 PALSAR global acquisitions. The BOS comprises fine resolution observations (10m) over the global land areas twice per year, and four times per year observations over the pan-tropical belt. For rapid deforestation monitoring, coarser resolution (100m) ScanSAR observations are planned 9 times per year over the tropical forest areas.
In accordance with actions at the 2nd SDCG meeting (Sept 2012), it was noted that JAXA ALOS-2 would constitute a significant contribution to the GFOI global baseline strategy, and JAXA was encouraged to consider possibilities for inclusion of JAXA ALOS-2 as a Core mission.
The data policy for JAXA ALOS-2 is yet to be decided.
6.4 RADARSAT-2 CSA RADARSAT-2 has been used to undertake dedicated acquisitions over selected GEO FCT National Demonstrator countries between 2009 and 2012. The observations were coordinated with ESA ENVISAT ASAR and were used to progress development of forest-related applications for C-band SAR. It was amongst others demonstrated in the GEO-FCT researcg programme that dense time series of C-band SAR data could be used to monitor changes in forest area and to detect degradation related features such as logging roads.

Page 40
In accordance with actions at the 2nd SDCG meeting (Sept 2012), CSA/MDA were encouraged to consider the outcome of the SDCG gap analysis in their acquisition planning, and to consider continued RADARSAT-2 data provision for GFOI R&D activities. It was recommended that the SDCG (via KSAT) initiate discussions with CSA and MDA within the context of the discussion framework to access commercial data sets required to meet the GFOI objectives.
6.5 TerraSAR-X and TanDEM-X DLR TerraSAR-X operates in X-band, which due to its high frequency can yield higher spatial ground resolution than L-band or C-band SAR systems. DLR TerraSAR-X data at 1 and 3 m resolution have demonstrated the potential to detect degradation related features, such as logging roads, changes in canopy cover and removal of individual trees, at high precision.
The DLR TanDEM-X system – achieved by two DLR TerraSAR-X spacecraft in constellation – is designed for collection of two global single-pol coverages of X-band SAR data at 12m resolution within the 2011-2013 time period for the generation of a global Digital Elevation Model.
It should be noted that while DLR TerraSAR-X data acquisitions are primarily order-based, bistatic X-band data are being collected systematically to cover the full globe up two four times between 2011 and 2013 within the DLR TanDEM-X mission as part of its global DEM project. The potential for synergetic use of X-band with C- or L-band over national scales should be noted. Additionally, excess capacities beyond orders and the DLR TanDEM-X mission requirements are coordinated in background missions, such as for the GEO FCT validation sites in place between 2008 and present.
The continuity of global acquisitions by DLR TerraSAR-X beyond 2013 is unknown at this time, so DLR is asked to clarify the plans for TerraSAR-X after the global DEM observations have been completed. DLR is also encouraged to continue with provision of data for GFOI R&D to improve understanding of potential of X-band SAR and to better link existing work with X-band SAR on forestry with GFOI R&D activities.
6.6 ResourceSat-2 / AWiFS The Indian Space Research Organisation’s (ISRO) ResourceSat-2 Advanced Wide Field Sensor (AWiFS) is a moderate resolution (56-70m) twin camera system with a combined (left and right) swath width of 740km, which yields a sub-swath repeat cycle of 5 days. It operates in four spectral bands, including NIR and SWIR.
Despite its coarser spatial resolution (56-70m), ISRO AWiFS is of potential interest for GFOI due to its wide swath and high temporal repeat. It can be utilised for gap-filling purposes for other optical sensors in regions with perennial cloud cover. The spectral characteristics of the four ISRO AWiFS bands correspond closely to Landsat ETM+ bands 2, 3, 4 and 5.
Similar to NASA TERRA and AQUA MODIS, but with finer spatial resolution, ISRO AWiFS can be perceived to be used for near-real time monitoring of forest change indicators (GFOI Product B3).
A pilot campaign to assess ISRO AWiFS capacity and usefulness to support GFOI is planned within 2013.

Page 41
Sections 7, 8, and 9 of this strategy outline the steps being suggested by the SDCG to implement the Element 1 strategy in 2013, 2014, and 2015 and beyond. The implementation steps for 2013 include recommendations embedded in the text, while the level of detail decreases for 2014 and again for 2015 and beyond, reflecting increasing uncertainty further into the future. It is expected for the 2014 update of the Element 1 strategy, a set of detailed implementation recommendations for 2014 will be developed. The years 2015 and 2016 and beyond will be documented and described based on best knowledge at the time.
7.1 Landsat-7 and Landsat-8 While the USGS/NASA Landsat missions have attained global coverage, the temporal frequency is insufficient to achieve repeated, national, cloud-free coverage over many tropical countries. As noted in Table 4.2, Landsat can provide stand-alone coverage for five of the eight target products defined in Sections 2.4, and complimentary information for another two. The only product for which USGS/NASA Landsat is less suited is the C2 Degradation Map product, which requires higher spatial resolution then USGS/NASA Landsat can offer. Based on currently anticipated Core Data Streams, ESA Sentinel-2 will be able to provide the necessary inputs for the C2 product.
While USGS/NASA Landsat will provide global, spatial and increased temporal coverage beginning in mid-2013 through the utilization of the newly launched USGS/NASA Landsat-8, the assessment of USGS/NASA Landsat capacity performed by SDCG and referred to in Section 4.2.1 concludes that temporal revisits will be insufficient to achieve national cloud-free coverage to support GFOI identified products over many tropical countries.
It is anticipated that once USGS/NASA Landat-8 is operational, both the USGS/NASA Landsat-7 and Landsat-8 LTAPs will be revised and updated, and the SDCG is suggesting additional modifications, which would support GFOI acquisition needs.
7.1.1 Boost Acquisitions for Cloudy Countries in 2013 Based on the capacity assessment referred to in Sections 4.2.1, the combination of USGS/NASA Landsat-7 and Landsat-8 is expected to provide global coverage in 2013, but there will be significant challenges to ensure complete coverage over very cloudy regions, especially in the tropics. Table 7.1 shows the percent cloud cover over countries featured in the 2013 GFOI expansion scenario.
Pixel mining approaches like the Web-enabled Landsat Data (WELD) project have the potential to greatly expand the available supply of useful, optical data over cloudy areas in the form of cloud free mosaics.
While the number of useful pixels that can be extracted depends in part on the number of scenes acquired, it should also be recognised that pixel mining has limitations, and can only be applied to those scenes for which the cloud fraction (estimated to be around 60% by USGS/NASA) and distribution enables terrain correction (i.e. those that can be processed to Landsat L1T.)
The Landsat acquisition strategy is currently biased against acquiring data over persistently cloudy areas, meaning that fewer scenes may be acquired over the very areas that could most
7 2013 Implementation Plan

Page 42
benefit from pixel mining. Based on discussions with the Landsat Acquisition Manager, the emergence of pixel mining is a factor being considering as acquisition plans evolve.
SDCG-‐2013-‐1
USGS/NASA / Landsat-‐7 Landsat-‐8
Modify the USGS/NASA Landsat-‐7 and Landsat-‐8 acquisition strategies in 2013 to boost the number of acquisitions over the countries included in table 7.1. This would include considering “every opportunity” acquisitions where capacity allows, as well as focusing the “missed opportunity boost” over the countries identified. Recognising the large potential value of techniques like Web-‐enabled Landsat Data (WELD, pixel mining) in generating cloud free mosaics, the SDCG will look forward to working with the Landsat Team in general, and the Landsat Acquisition Manager in particular, to achieve mutually beneficial results.
SDCG-‐2013-‐2
USGS/NASA / Landsat-‐7 Landsat-‐8
Recognising the large potential value of techniques like Web-‐enabled Landsat Data (WELD, pixel mining) in generating cloud free mosaics, modify the USGS/NASA Landsat-‐7 and Landsat-‐8 acquisition strategies to optimise acquisitions over cloudy areas in support of pixel mining. While GFOI will eventually require global coverage, the initial focus should be on tropical countries in line with the approach to expansion (outlined in section 3.3).
Countries for which these cloud cover counter measures do not prove successful may need to utilize high temporal repeat C-band SAR, or L-band SAR once those data streams become available. These data streams, while Core, would mostly likely be provided to countries under Element 2 of the SDCG strategy.
Country % Cloudiness Country % Cloudiness
Cameroon 82% Brazil 68%
Colombia 79% D.R. Congo 68%
Panama 77% Fiji 69%
Guyana 74% Vietnam 69%
Ecuador 73% Tanzania 67%
Cambodia 72% Peru 66%
Indonesia 71% Mexico 51%
Costa Rica 69% Nepal 47%
Table 7.1 Percent Annual Cloudiness of 2013 Expansion Scenario Countries [NASA International Satellite Cloud Climatology Project (ISCCP) dataset (D2 product, 25 years, 280-km pixels, 3-hour sampling, monthly averages).]
7.1.2 Development of a Pixel Mining Service for GFOI Recommendation SDCG-2013-2 recognises that more acquisitions over cloudy regions add to the number of cloud-free pixels from which information can potentially be extracted using pixel mining. However, in order to deliver the benefit of these techniques to countries in GFOI, a global pixel mining service will need to be developed.

Page 43
The WELD project is collaboration between the USGS/NASA/EROS and South Dakota State University, and is funded by USGS/NASA and NASA's Making Earth System Data Records for Use in Research Environments (MEaSUREs) program. Currently WELD is available via the internet, and generates 30-meter composites of Landsat 7 Enhanced Thematic Mapper Plus (ETM+) terrain corrected (Level 1T) mosaics at weekly, monthly, seasonal and annual periods for the conterminous United States (CONUS) and Alaska.
Recently, MEaSUREs funding for the expansion to global coverage of WELD has been approved – this expansion is the first step in enabling the provision of a pixel mining service to GFOI countries.
SDCG-‐2013-‐3
USGS/NASA, NASA / Landsat Archive
In order to support the provision of a pixel mining service to GFOI countries, NASA and USGS/NASA to continue to work with their partners to deliver global coverage for Web-‐enabled Landsat Data (WELD, pixel mining).
Based on progress in 2013 towards the realization of global coverage through WELD or similar techniques, SDCG should work with CEOS leadership, USGS/NASA, NASA, INPE, CRESDA, ESA, NSC, and groups like LSI to define the scope, nature, and implementation details for a pixel mining service for GFOI.
SDCG-‐2013-‐4
SDCG with support from USGS/NASA, NASA, INPE, CRESDA, ESA, NSC, CEOS SEO and LSI-‐VC
SDCG, supported by key CEOS implementation partners, to define the scope, nature, and implementation details for a proposed pixel mining service for GFOI. This proposal should take into account progress towards the development of global WELD or similar technique, the definition of the Element 2 (country specific) acquisition strategy, feedback from the GFOI community, and be presented for endorsement at CEOS SIT-‐29 in 2014.
While this initial pixel mining service would be focused on Landsat (largely because of the on going WELD activity), it could be anticipated that pixel mining could usefully be applied to other optical data streams such as INPE/CRESDA CBERS-3/-4, and ESA Sentinel-2.
7.2 CBERS-3 and Sentinel-1 Based on current launch plans, it is anticipated that satellites providing two additional core data streams will be launched mid-to-late 2013 – INPE/CRESDA CBERS-3 and ESA Sentinel-1. While it is likely that these missions will be launched in 2013, it is also likely that their checkout and calibration will mean that they do not start providing an operational data stream until late 2013 or early 2014. For this reason, the SDCG is not assuming that they will make a significant contribution to global coverage until 2014.
Once operational, it is anticipated that these systems will be employed in the roles outlined in Section 4.1, and Table 4.1. In anticipation of these roles, there are several activities that can take place in 2013 to ensure best utilisation of these data streams when they do come online.
SDCG-‐2013-‐5
INPE, CRESDA / CBERS-‐3
To the extent that launch timing, checkout and calibration allow, focus INPE/CRESDA CBERS-‐3 acquisitions in support of GFOI on the regional focus and gap filling role outlined in table 4.1 and section 4.3, and with a focus on the countries identified in the approach to expansion (outlined in section 3.3).
The SDCG will look forward to working with the INPE/CRESDA Acquisition Managers to achieve mutually beneficial results.

Page 44
SDCG-‐2013-‐6
ESA / Sentinel-‐1
To the extent that launch timing, checkout and calibration allow, focus ESA Sentinel-‐1 acquisitions in support of GFOI on the selected national wall-‐to-‐wall coverage role outlined in table 4.1 and section 4.4.
It is anticipated that once the capacity of INPE/CRESDA CBERS-3 and ESA Sentinel-1 is confirmed, more specific coverage recommendations for these systems will be developed. This would be anticipated to be included as a 2014 implantation recommendation in the updated Element 1 strategy presented at SIT-29.
7.3 Data Delivery Pilots As outlined in Section 3, the Element 1 Strategy is built around Core data streams, with free and open data distribution policies. Despite this, the Element 1 strategy has focused only on the coordination of data acquisitions, guided by the Terms of Reference of SDCG.
It is recognised that without distribution of data to final users, coordinated acquisitions do little to serve the GFOI community. The SDCG is asking that in 2013, CEOS leadership engage the SDCG, as well as key CEOS components such as the Working Group on Information Systems and Services (WGISS) and the Land Surface Imaging Virtual Constellation (LSI-VC) on defining how GFOI participating countries can receive Core data stream acquisitions. The plan should be delivered in time for presentation at the 2014 meeting of the Strategic Implementation Team (SIT-29).
SDCG-‐2013-‐7
SDCG with support from CEOS SIT Chair, WGISS, CEOS SEO, and LSI-‐VC
SDCG, supported by key CEOS implementation partners, work to define how GFOI participating countries can receive Core data stream acquisitions. The plan should be delivered in time for presentation at the 2014 meeting of the Strategic Implementation Team (SIT-‐29). Ideally, this activity would include a small pilot demonstration involving one or more GFOI countries in 2013.
A number of guiding principles should be applied to data delivery to GFOI participating countries:
• distribution and delivery of data to GFOI participating countries should take place using the mechanisms utilised by other CEOS and GEO activities e.g. data portals (hard drive deliveries being a last case scenario);
• interoperable catalogue capacities like the CEOS WGISS Integrated Catalogue (CWIC) and the Heterogeneous Missions Accessibility (HMA) service be leveraged to the greatest extent possible;
• in the 2013 timeframe, the vast majority of data to flow will be USGS/NASA Landsat, and so data delivery programs like those offered by USGS/NASA directly, and via SilvaCarbon, should be leveraged; and
• in 2013 CEOS should work to define how the future Core data streams will distributed.
.
Page 45
8 2014 Implementation Plan Following on from 2013 and USGS/NASA Landsat, the Core data streams will be augmented in 2014 by the expected addition of INPE/CRESDA CBERS-3 and ESA Sentinel-1A. Both missions are currently expected to launch in 2013, but are not expected to provide an operational data flow until 2014.
As outlined in Section 4.3, once operational, INPE/CRESDA CBERS-3 should focus on providing regional coverage as well as gap filling where capacity allows. Specific regions of interest are expected to be South America, Asia, and Africa. Expected increases in INPE/CRESDA CBERS ground station coverage will mean that the system can offer greatly expanded capacity over Africa. The launch of INPE/CRESDA CBERS-4 is also tentatively planned for late-2014, which would add further capacity to the INPE/CRESDA CBERS data stream.
As outlined in Section 4.4, it is expected that the recommendation will be that ESA Sentinel-1 support to GFOI be directed to provide wall-to-wall C-band coverage for selected countries in its ramp up phase (see 4.4.1). The identification of which countries should be covered wall-to-wall should take into account the interest, heritage and technical capacity of a country to work with C-band data stream, as well as the relative need (i.e. cloud cover) for radar data. It is expected that this assessment will be carried out in part based on historical utilisation, and in conjunction with the implementation of specific national coverages under the Element 2 strategy.
In mid 2014, the launch of ESA Sentinel-2A is anticipated. This will provide an additional optical data stream, which is expected to complement USGS/NASA Landsat, and also offer higher geometric resolution of 10m/20m and a wider swath width of 290km. It is expected (Section 4.1) that the ESA Sentinel-2 series will provide a highly valuable cover data stream, offering global baseline coverage.

Page 46
9 2015+ Implementation Plan With the arrival of an operational Core data stream from ESA Sentinel-2A, the requirements of all target products can be met globally. And with the addition of the second satellites of both the ESA Sentinel-1 and Sentinel-2 missions in 2015, GFOI users will enjoy increased temporal coverage and reliability.
It is also anticipated that in 2015, CONAE/ASI SAOCOM-1A will become operational. While noting that the SAOCOM mission data policy is yet to be decided by CONAE and ASI, the possibility of including the SAOCOM-1 series of satellites as a core data stream candidate is under consideration. CONAE/ASI SAOCOM is an L-band radar instrument, and as noted in section 4.3, L-band SAR has the capacity to support the generation of all target products. Importantly, CONAE and ASI are considering the possibility of including annual acquisitions over the pan-tropical zone in the Global Background Mission that is under development.
The launch of the CSA RADARSAT Constellation Mission (RCM) is planed for 2018. While the data policy for GFOI remains to be confirmed, RCM is currently considered a Core data stream. This three-satellite constellation has great potential to complement ESA Sentinel-1’s role, and increase the capacity and reliability of C-band data streams.

Page 47
10.1 Institutional arrangements
The GFOI Space Data Coordination Group (SDCG) was established by CEOS for the purpose of developing and managing a CEOS data acquisition strategy for GEO’s GFOI. The SDCG is an ad hoc group of CEOS and its existence is reviewed and approved on an annual basis by CEOS Plenary. The GFOI Implementation Plan foresees the establishment of an institutional home for GFOI in a relevant organisation (such as FAO) with full-time staff assigned to the execution of the various operational functions in due course. These functions will include the coordination of the space data acquisitions and delivery since operational activities are beyond of the scope of CEOS responsibilities. We can anticipate some on-going need for the kind of activities which have been initiated by the SDCG, in interfacing with CEOS data provider agencies, particularly in monitoring the annual progress towards data acquisition targets and adapting acquisition strategies accordingly to guarantee that these targets are met. The optimal organisational arrangements and interfaces will be determined by CEOS at its annual Plenary and SIT meetings as the GFOI structure matures. For the time being, the assumption is that an ad hoc SDCG will continue to develop and manage the CEOS data strategy for GFOI.
10.2 Strategy Management and Roles
The SDCG proposes to update the GFOI data strategy on at least an annual basis and to present the updated strategy to CEOS SIT for endorsement – with an emphasis on the implementation plan for the coming year and the actions required of contributing CEOS agencies. SIT is the forum for securing commitment at a senior level within CEOS agencies with regards to satellite mission implementation matters.
The GFOI Steering Committee, on which CEOS is represented, has the responsibility of ensuring the strategy is informed by the latest policy developments and requirements and may make special requests of CEOS as these factors evolve. The SDCG reports to all Steering Committee meetings through the CEOS representative.
The geometry in early 2013 has begun to change with the arrival of the first of the staff for the GFOI Project Office. The Project Office will become a hub for engagement of GEO governments in the GFOI activity and will have a future stake in the dialogue with countries, including around the arrangements for the space data acquisitions and supply in support of national forest information systems and carbon accounting ambitions.
10.3 Next Steps
The next steps for the SDCG are to:
1. seek endorsement of this baseline global data acquisition strategy at the next CEOS SIT meeting (March 2013), and in particular by the Core data stream CEOS provider agencies; particular emphasis will be given to buy-in of CEOS provider agencies for the
10 Governance
Page 48
Baseline Global Data Acquisition Strategy for the year ahead (setting the model for the future annual engagement in the same way between SDCG and SIT);
2. coordinate implementation of the 2013 baseline global data acquisition strategy with the CEOS agencies concerned - overseeing the progress towards realisation of the 2013 coverage targets;
3. initiate the second Element of the CEOS data strategy for GFOI - A coordinated strategy for national data acquisitions. SDCG proposes that this Element focus on those countries which are the top priority for inclusion in 2013 as GFOI participating countries and which are the subject of the 2013 coverage targets. This Element will establish a dialogue with these countries to establish their REDD+ readiness status, and will explore any technical requirements, or heritage and experience on working with a particular EO data source or type, as well as any arrangements that may already exist for the supply of data. It will confirm the need and optimal acquisition and delivery arrangements for each of the countries concerned. Coordination with the GFOI Project Office will be required here.
4. consistent with the desire to demonstrate outcomes for GEO governments prior to the 2015 GEOSS implementation target date, the SDCG will highlight a few countries that might serve as partners in pilot projects for the delivery of a national coverage dataset during 2013.
5. manage the annual update (for early 2014) to the baseline global data acquisition strategy to reflect changes in the policy drivers or data stream availability.
6. ESA Sentinel-1: Mission Capacity Simulations - In late 2012, an initial set of acquisition simulations for ESA Sentinel-1 was performed to check for 4 times per year coverage of the world’s forests. Additional simulations are planned to cover frequently highly clouded countries of the tropical belt, to include them into the early ramp-up phase. These simulations take into account the instrument duty cycle, limitations in number of X-band switches, as well as available core ground stations network for data downlink. It is envisioned that ESA Sentinel-1 will provide dense time series of wall-to-wall data over selected countries of interest – in particular those that are worst affected by cloud. It is requested that ESA provide inputs on 2013 tasks to prepare for the start of ESA Sentinel-1 operations in 2014.
7. Element 2: National Data Coordination - Following the development of the strategy Element 2 in 2013, implementation is planned to begin in 2014. The Element 2 strategy will be submitted for approval at SIT-29 (nominally in France, Q1 2014). Implementation will be assumed to begin with a pilot phase as outlined in section 5.3 and be coordinated with the GFOI Project Office.
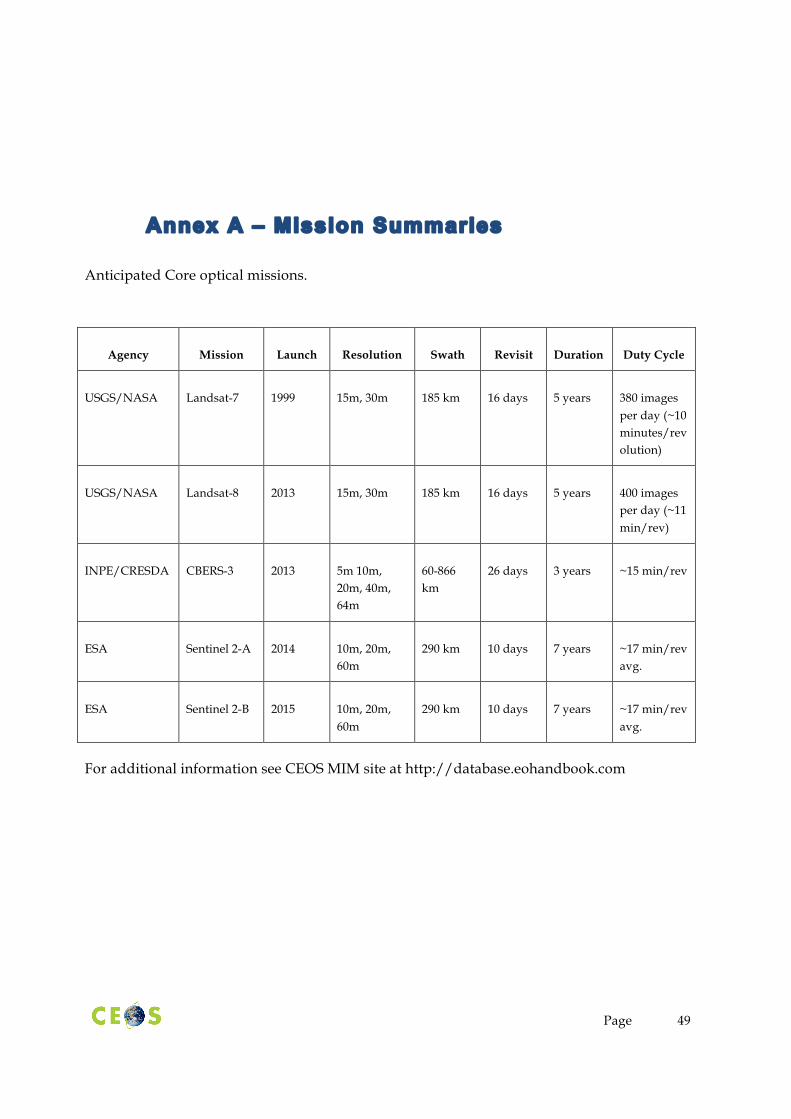
Page 49
Anticipated Core optical missions.
Agency Mission Launch Resolution Swath Revisit Duration Duty Cycle
USGS/NASA Landsat-7 1999 15m, 30m 185 km 16 days 5 years 380 images per day (~10 minutes/revolution)
USGS/NASA Landsat-8 2013 15m, 30m 185 km 16 days 5 years 400 images per day (~11 min/rev)
INPE/CRESDA CBERS-3 2013 5m 10m, 20m, 40m, 64m
60-866 km
26 days 3 years ~15 min/rev
ESA Sentinel 2-A 2014 10m, 20m, 60m
290 km 10 days 7 years ~17 min/rev avg.
ESA Sentinel 2-B 2015 10m, 20m, 60m
290 km 10 days 7 years ~17 min/rev avg.
For additional information see CEOS MIM site at http://database.eohandbook.com
Annex A – Mission Summaries

Page 50
Anticipated Core SAR missions.
Agency Mission Launch Band Polarization Res Revisit Duration Duty
Cycle
ESA Sentinel 1-A 2013 C Single-, Dual-polarisation
9 m, 20 m, 50 m
12 days 7 years ~25 min/rev
ESA Sentinel 1-B 2014 Single-, Dual-polarisation
9 m, 20 m, 50 m
12 days 7 years ~25 min/rev
CSA RADARSAT Constellation Mission (3 satellites)
2018 C Single-, Dual-, Full- polarisation
1 m, 3 m, 5 m, 16 m, 50 m, 100 m
12 days 7 years ~12 min/rev per satellite
CONAE and ASI
SAOCOM-1A 2015 L Single-, Dual-, Full- polarisation
10 m, 30 m, 50 m, 100 m
16 days 5 years ~15 min/rev
CONAE and ASI
SAOCOM-1B 2016 L Single-, Dual-, Full- polarisation
10 m, 30 m, 50 m, 100 m
16 days 5 years ~15 min/rev
For additional information see CEOS MIM site at http://database.eohandbook.com

Page 51
Additional optical missions of interest.
Agency Mission Launch Res Swath Revisit Duration Duty Cycle
CNES SPOT-5 2002 2.5 m, 5 m, 10 m, 20 m
60 km 26 days Planned to be decommissioned in 2014
TBC
DLR/ Public-Private Partnership
RapidEye 2008 5 m, 6,5 m
77 km 5.5 days (daily off-nadir)
Through 2019 according to latest info from RapidEye
4 million km²/day from the combined 5 satellites
INPE Amazonia-1 2014 40 m 740 km 26 days 3 years TBC
ISRO ResourceSat-2 AWiFS
2012 56 m 740 km 26 days 3 years TBC
For additional information see CEOS MIM site at http://database.eohandbook.com

Page 52
Additional SAR missions of interest.
Agency Mission Launch Band Polarization
Res Revisit Duration Duty Cycle
CSA RADARSAT -1 1996 C HH 8 m, 25 m, 30 m, 35 m, 50 m, 100 m
24 days 5 years TBC
CSA RADARSAT-2 2007 C HH, VV, HV, VH
3 m, 5 m, 8 m, 10 m, 25m
24 days 7 years TBC
DLR TerraSAR-X 2007 X HH, VV, HV, VH
1 m, 3 m, 16 m
11 days 8 years 18 %4 (~18 min/rev)
DLR TanDEM-X 2010 X HH, VV, HV, VH
1 m, 3 m, 16 m
11 days 8 years
~3 min/rev, max ~12 min/day5
JAXA ALOS-2 2013 L HH, VV, HV, HH+HV, VV+VH, HH+HV+VH+VV
3 m, 6 m, 10 m, 60 m, 100 m
14 days 5-7 years ~50 min/rev
For additional information see CEOS MIM site at http://database.eohandbook.com
4 A typical actual scenario is: 1= 60 sec Stripmap/ScanSAR + 220 sec Spotlight with option (according to current orders) to do 600 sec Data Takes.
5 1.000 km swath length per orbit and a total of 5.000 km per day (with swath width=3D30km)

Page 53
USGS/NASA Landsat 7: The Democratic Republic of the Congo (DRC)
In regions with persistent cloud cover, experience from USGS/NASA Landsat-7 has shown that observations according to the LTAP have not been sufficient to achieve this goal of four cloud-free coverages per year. An assessment of USGS/NASA Landsat-7 acquisitions over the Democratic Republic of the Congo (DRC) from 2000 through 2010 was conducted to assess the frequency of acquisitions and the impact of clouds on acquisition success. A summary of those results is shown below.
Figure B.1 Average cloudiness over DRC measured by USGS/NASA Landsat-7 from 2000 through 2010. Red: >50%, Green: <50%. Persistent cloudiness is shown in the far western region near Congo and Gabon. In addition, higher cloudiness is observed in the northern half of DRC, which coincides with the densely forested areas. In regions of high cloudiness, clear (or less than 10% cloudy) optical acquisitions will be less likely.
Annex B – Cloud Analysis
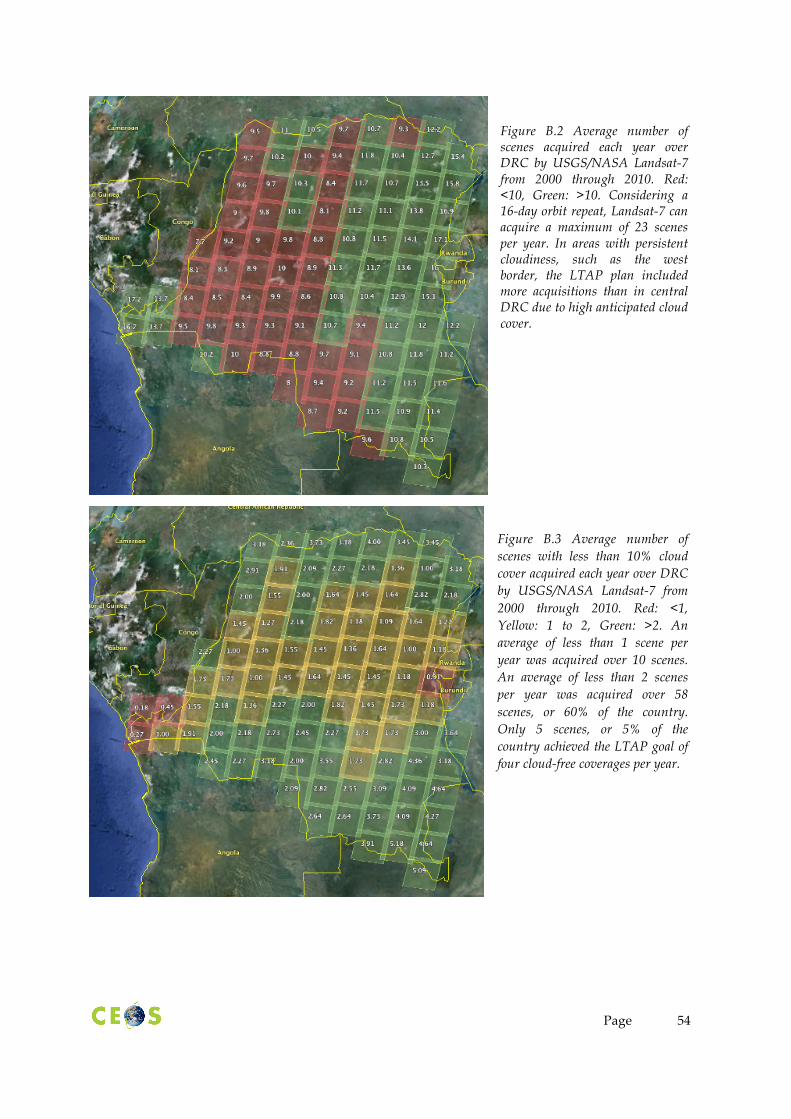
Page 54
Figure B.2 Average number of scenes acquired each year over DRC by USGS/NASA Landsat-7 from 2000 through 2010. Red: <10, Green: >10. Considering a 16-day orbit repeat, Landsat-7 can acquire a maximum of 23 scenes per year. In areas with persistent cloudiness, such as the west border, the LTAP plan included more acquisitions than in central DRC due to high anticipated cloud cover.
Figure B.3 Average number of scenes with less than 10% cloud cover acquired each year over DRC by USGS/NASA Landsat-7 from 2000 through 2010. Red: <1, Yellow: 1 to 2, Green: >2. An average of less than 1 scene per year was acquired over 10 scenes. An average of less than 2 scenes per year was acquired over 58 scenes, or 60% of the country. Only 5 scenes, or 5% of the country achieved the LTAP goal of four cloud-free coverages per year.

Page 55
In order to achieve at least one or two clear-sky scenes (<10% cloud cover) per year over the entire country, the LTAP BAU plan must be augmented with additional acquisitions, and/or pixel mining approaches such as WELD must be utilized. This analysis for DRC shows that 38% of the WRS path-row combinations (scenes) will allow at least two clear-sky scenes per year. To ensure at least two scenes per year over most of the country, USGS/NASA Landsat must increase the number of acquired scenes for this region through LTAP augmentation, combine the results of several images using pixel mining, such as the WELD process, supplement existing measurements with observations by other optical sensors (e.g., INPE/CRESDA CBERS-3), or consider SAR imagery that can penetrate clouds.
One example of the potential impact of pixel mining is shown in the Figure B.4 (below). Though only 38% of the scenes have at least two clear-sky (less than 10% average cloudiness, or Sub-10) images per year, if one considers scenes with higher cloudiness (less than 20% average cloudiness, or Sub-20), the results improve to 84% of the scenes with at least two images per year.
Figure B.4 Number of annual acquisitions for 96 USGS/NASA Landsat-7 scenes over DRC between 2000 and 2010. Red: Number of scenes with less than 10% average cloudiness (Sub-10), Green: Number of scenes with less than 20% average cloudiness (Sub-20). The number of acquisitions above 2 per year increases from 38% for Sub-10 to 84% when Sub-20 are included. It is believed that pixel mining techniques can ensure at least 2 scenes per year for most of DRC, with the exception of the far west coast by combining the clear portion from more acquisitions even if the images are mostly cloudy.
USGS/NASA Landsat 7 – impact of the ETM+ scan line error
A factor that needs to be taken into consideration in the USGS/NASA Landsat-7 analysis is the impact of the ETM+ scan line error, which results in systematic stripes with no data across the field of view, causing 22% data loss for any given scene. The gaps can be filled with subsequent acquisitions as the locations of the stripes vary between observations, but it has the effect that even during cloud free conditions, at least two acquisitions are required to obtain clear sky coverage over a full scene.
0 1 2 3 4 5 6 7 8
0 20 40 60 80 100
Number of Acquisitions
Path-Row Scene # (East to West)
DRC Yearly Acquisitions
Sub10 Sub20

Page 56
Assuming the average measured success rate of achieving scenes with <10% cloud cover, if USGS/NASA Landsat-7 were to acquire scenes over DRC on every orbit pass (up to 23 per year), the estimated number of WRS path-row scenes obtaining two clear-sky images per year will go from 38% to 88% of the country. Taking the scan line error into account, this would mean one clear-sky images per year for 88% of the country.
Once USGS/NASA Landsat-8 is providing an operational data stream, it is possible to acquire an additional 23 scenes per year over any given location, thereby increasing the potential for acquiring more clear-sky scenes. With the addition of USGS/NASA Landsat-8 acquiring scenes over DRC on every orbit pass, the number of WRS path-row scenes obtaining two clear-sky images per year will be 97% of the country, or 76% including the data reduction due to the USGS/NASA Landsat-7 scan line error. Therefore, an augmentation in the Landsat LTAP for USGS/NASA Landsat-7 and Landsat-8 over these cloudy regions will have significant benefit to GFOI. In those areas with very low success rate, SAR imagery may be the only near-term option for forest cover imagery.
USGS/NASA Landsat 7: Guyana
A similar assessment of USGS/NASA Landsat-7 acquisitions over Guyana, South America from 2000 through 2010 is shown below.
Figure B.5 Average cloudiness over Guyana measured by USGS/NASA Landsat-7 from 2000 through 2010. Red: >50%, Green: <50%. Persistent cloudiness is shown in the inland areas. In these regions of high cloudiness, clear (or less than 10% cloudy) optical acquisitions were very rare.

Page 57
Figure B.6 Average number of scenes with less than 10% cloud cover acquired each year over Guyana by USGS/NASA Landsat-7 from 2000 through 2010. Red: <1, Yellow: 1 to 2, Green: >2. Due to persistent cloudiness, an average of less than 1 scene per year was acquired over 8 scenes and 4 of those scenes did not acquire a single image with less than 10% cloud cover over 11 years. None of the scenes achieved the LTAP goal of four cloud-free coverages per year.
In order to assess the impact of pixel mining, additional analyses were conducted using quarter-scale scenes. In cases where a quarter-scale scene (~85 km square) has minimal cloud cover (<10% cloudiness), it is believed that pixel mining techniques, such as WELD, can achieve significant improvements in coverage by utilizing clear portions of full-scale scenes. The figure below summarizes these results.
Figure B.7 Average number of quarter-scale scenes with less than 10% cloud cover acquired each year over Guyana by USGS/NASA Landsat-7 from 2000 through 2010. Red: <1, Yellow: 1 to 2, Green: >2. Scenes were counted if any one of the quarter-scale regions had <10% average cloud cover. These results suggest that pixel mining can significantly improve results. By merging clear portions of cloudy scenes it is possible to acquire composite scenes for forest studies. In this case, only 4 scenes still achieve less than one scene per year, but all scenes show a large improvement over full-scale discrimination, compared to the previous Figure B.5.
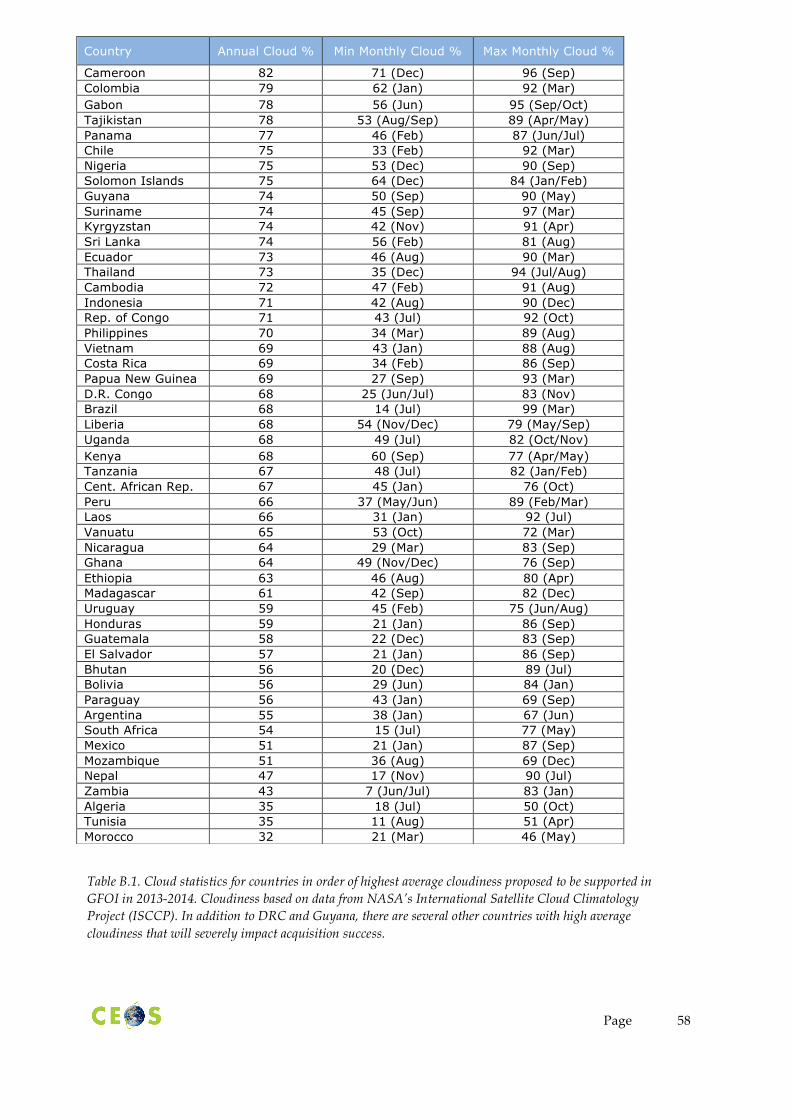
Page 58
Country Annual Cloud % Min Monthly Cloud % Max Monthly Cloud %
Cameroon 82 71 (Dec) 96 (Sep) Colombia 79 62 (Jan) 92 (Mar) Gabon 78 56 (Jun) 95 (Sep/Oct) Tajikistan 78 53 (Aug/Sep) 89 (Apr/May) Panama 77 46 (Feb) 87 (Jun/Jul) Chile 75 33 (Feb) 92 (Mar) Nigeria 75 53 (Dec) 90 (Sep) Solomon Islands 75 64 (Dec) 84 (Jan/Feb) Guyana 74 50 (Sep) 90 (May) Suriname 74 45 (Sep) 97 (Mar) Kyrgyzstan 74 42 (Nov) 91 (Apr) Sri Lanka 74 56 (Feb) 81 (Aug) Ecuador 73 46 (Aug) 90 (Mar) Thailand 73 35 (Dec) 94 (Jul/Aug) Cambodia 72 47 (Feb) 91 (Aug) Indonesia 71 42 (Aug) 90 (Dec) Rep. of Congo 71 43 (Jul) 92 (Oct) Philippines 70 34 (Mar) 89 (Aug) Vietnam 69 43 (Jan) 88 (Aug) Costa Rica 69 34 (Feb) 86 (Sep) Papua New Guinea 69 27 (Sep) 93 (Mar) D.R. Congo 68 25 (Jun/Jul) 83 (Nov) Brazil 68 14 (Jul) 99 (Mar) Liberia 68 54 (Nov/Dec) 79 (May/Sep) Uganda 68 49 (Jul) 82 (Oct/Nov) Kenya 68 60 (Sep) 77 (Apr/May) Tanzania 67 48 (Jul) 82 (Jan/Feb) Cent. African Rep. 67 45 (Jan) 76 (Oct) Peru 66 37 (May/Jun) 89 (Feb/Mar) Laos 66 31 (Jan) 92 (Jul) Vanuatu 65 53 (Oct) 72 (Mar) Nicaragua 64 29 (Mar) 83 (Sep) Ghana 64 49 (Nov/Dec) 76 (Sep) Ethiopia 63 46 (Aug) 80 (Apr) Madagascar 61 42 (Sep) 82 (Dec) Uruguay 59 45 (Feb) 75 (Jun/Aug) Honduras 59 21 (Jan) 86 (Sep) Guatemala 58 22 (Dec) 83 (Sep) El Salvador 57 21 (Jan) 86 (Sep) Bhutan 56 20 (Dec) 89 (Jul) Bolivia 56 29 (Jun) 84 (Jan) Paraguay 56 43 (Jan) 69 (Sep) Argentina 55 38 (Jan) 67 (Jun) South Africa 54 15 (Jul) 77 (May) Mexico 51 21 (Jan) 87 (Sep) Mozambique 51 36 (Aug) 69 (Dec) Nepal 47 17 (Nov) 90 (Jul) Zambia 43 7 (Jun/Jul) 83 (Jan) Algeria 35 18 (Jul) 50 (Oct) Tunisia 35 11 (Aug) 51 (Apr) Morocco 32 21 (Mar) 46 (May)
Table B.1. Cloud statistics for countries in order of highest average cloudiness proposed to be supported in GFOI in 2013-2014. Cloudiness based on data from NASA’s International Satellite Cloud Climatology Project (ISCCP). In addition to DRC and Guyana, there are several other countries with high average cloudiness that will severely impact acquisition success.