Committee for the Common Organisation of Agricultural ... · Committee for the Common Organisation...
57
Cereals market situation Committee for the Common Organisation of Agricultural Markets 28 th February 2019
Transcript of Committee for the Common Organisation of Agricultural ... · Committee for the Common Organisation...

Cereals market situation
Committee for the Common Organisationof Agricultural Markets
28th February 2019

Exchange Rates
2

Euro – US Dollar exchange rate
3

4
Euro – Argentine Peso and Brazilian Real exchange rate
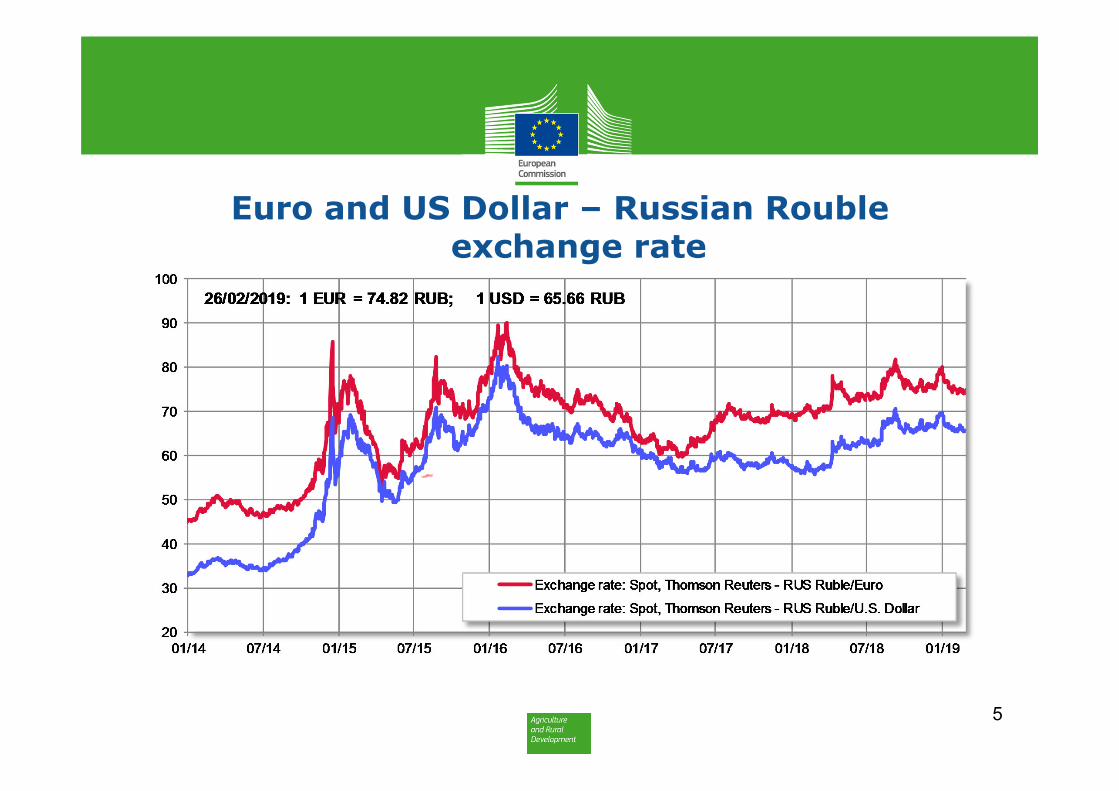
Euro and US Dollar – Russian Rouble exchange rate
5

Euro and US Dollar - Ukraine Hryvnia exchange rate
6
7
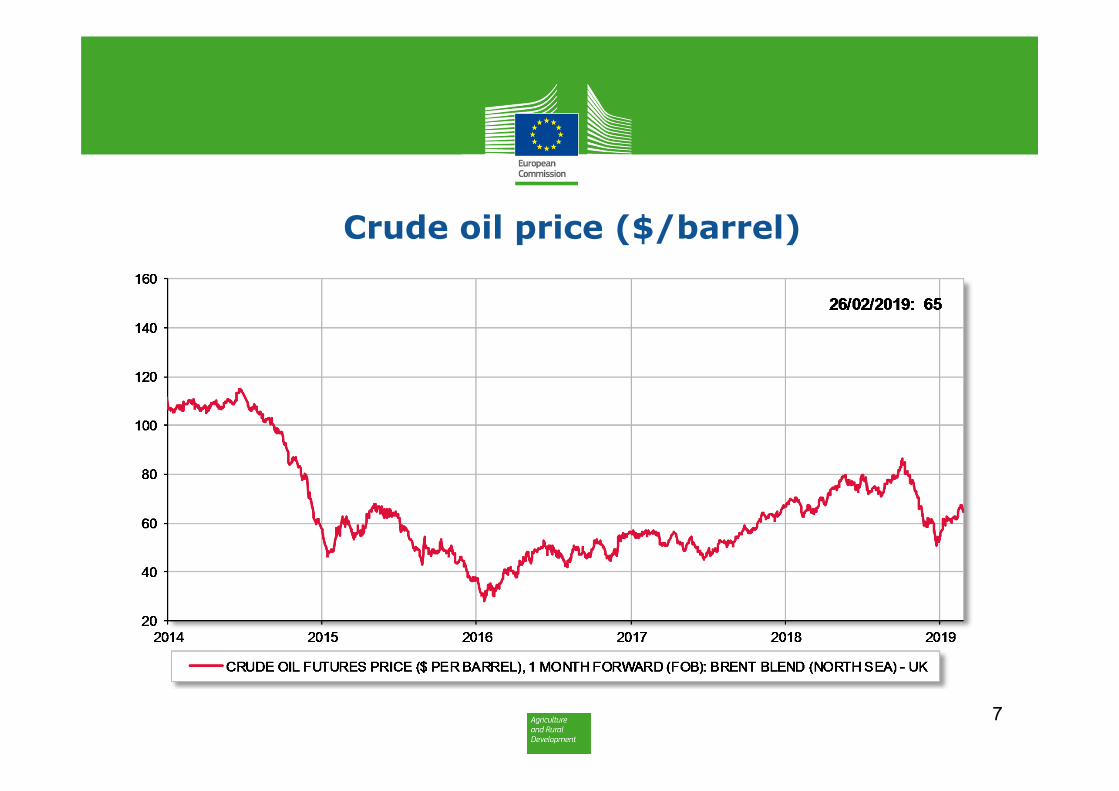
Crude oil price ($/barrel)

8
Baltic Dry Index
World Cereals Forecasts
USDA
9

10
World wheat: USDA

11
USDA: Wheat production forecast

USDA 2018/19 Supply and Demand Estimates(WASDE – 585 of 8 February 2019)
Wheat: world production estimate raised slightly (+1.3m) from December to 734.8m t (-28.4m or -3.7% y/y). Mainly reflecting higher feed use in China global demand increased to 747.2m t (+2m m/m; +3m or +0.41% y/y). Ending stockslowered by 0.4m to 267.5m t (-12.5m or -4.5% y/y) of which 140m t in China (-3.6m from Dec; +6.7% y/y), i.e. 52.3% of world total. Excluding China the global stocks-to-use ratio is estimated at 20.5%.
Production: larger RUS (+1.6m to 71.6m t) forecast and increases for BRAand Paraguay were partly offset by cuts in ARG (-0.3m to 19.2m) and China (-1.1m to 131.4m). The RUS wheat crop incl. 51m winter wheat(71% of total) and 20.6m t spring wheat. Harvested area for total wheatamounted to 26.2m ha (incl. 14.35m winter and 11.85m spring wheat). Average yield reached 2.73 t/ha, 2nd highest on record.
World exports put higher to 178.7m t (-2.6% y/y) on larger RUS (+0.5m to 37m t) and Pakistani (1.7m t) exports partly offset by lower shipmentsfrom AUS (-0.5 to 10m) and ARG (-0.2 to 14m). EU estimate unchangedat 22m t.
12

Wheat import forecasts for selected countries and regions
• Source: USDA (data in million tonnes, incl. flour, July/June); *forecast• North Africa = Algeria, Egypt, Libya, Morocco and Tunisia • South East Asia = Indonesia, Malaysia, Philippines, Thailand and Vietnam
13
2015/16 2016/17 2017/18 2018/19*
Algeria 8.153 8.414 8.172 7.000
Egypt 11.925 11.175 12.407 12.500Morocco 4.503 5.191 3.640 3.000
North Africa 27.873 28.273 27.409 25.700
Saudi Arabia 2.931 3.716 3.440 3.400Vietnam 3.070 5.535 4.655 4.500
Indonesia 10.045 10.176 10.516 10.000
SE Asia 25.483 27.750 26.744 25.900
14
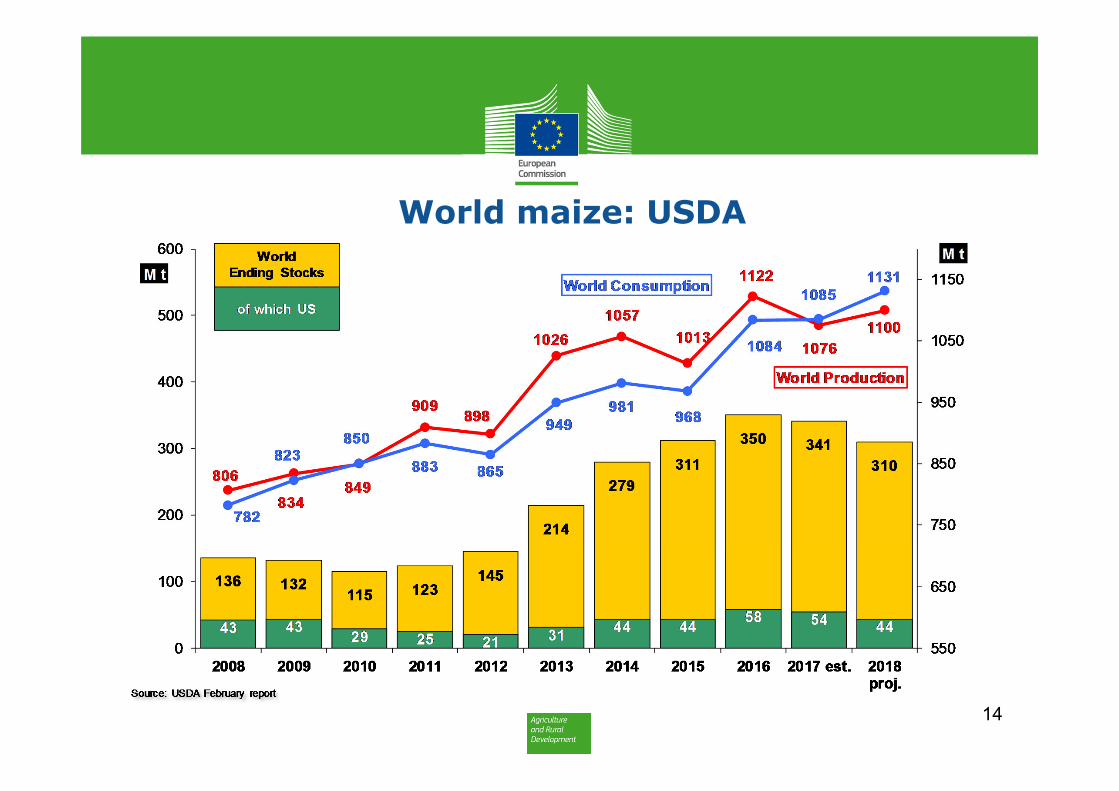
World maize: USDA
15
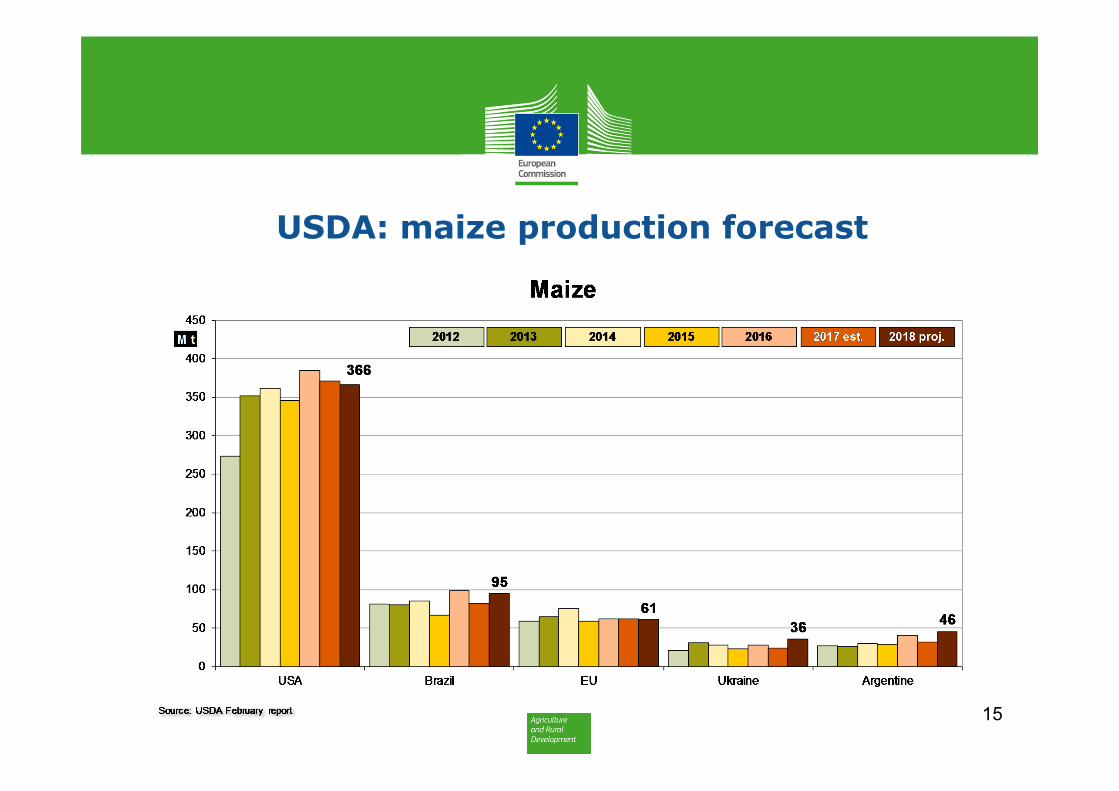
USDA: maize production forecast

USDA 2018/19 Supply and Demand Estimates(WASDE – 585 of 8 February 2019)
Maize: World production forecast unchanged at 1,100m t (+24m t or +2.2% y/y) with consumption also stable at 1,131m t (+45.6m or +4.2% y/y), a new record. Feed use is estimated slightly lower at 698m t (+4%), incl. 64.2m (+12.6% y/y) for the EU. Ending stocks expected to decrease to 310m t (-31m or -9.1% y/y), incl. 207.8m t in China (-6.6% y/y; 67.1% of world total).
Reflecting reduced yields (11.07 t/ha) US production lowered by 5.2m to 366.3m t (-1.3% y/y), while projected ARG maize crop increased sharply, up 3.5m to 46m t (+44%) on larger area (5.5m ha) and yield (8.36 t/ha). Once again, the forecast for UKR crop was raised, up 0.5m to a record 35.5m t (+47% y/y). Forecast for South Africa reduced further to 11.5m t (-15% y/y) on persisting drought.
The EU remains the largest importer with 21m t (+2.6m y/y) followed by MEX (16.7m) and Japan (15.5m). On increased production estimate UKRexports were raised by 0.5m to 28.5m t (+10.5m or +58% y/y), whileARG exports up 1m to 29m t (+8m or 38%). BRA export projection unchanged at 29m t (+18%).
16

World Cereals Forecasts
International Grains Council
17

18
World cereals: IGC

19
World wheat: IGC
20
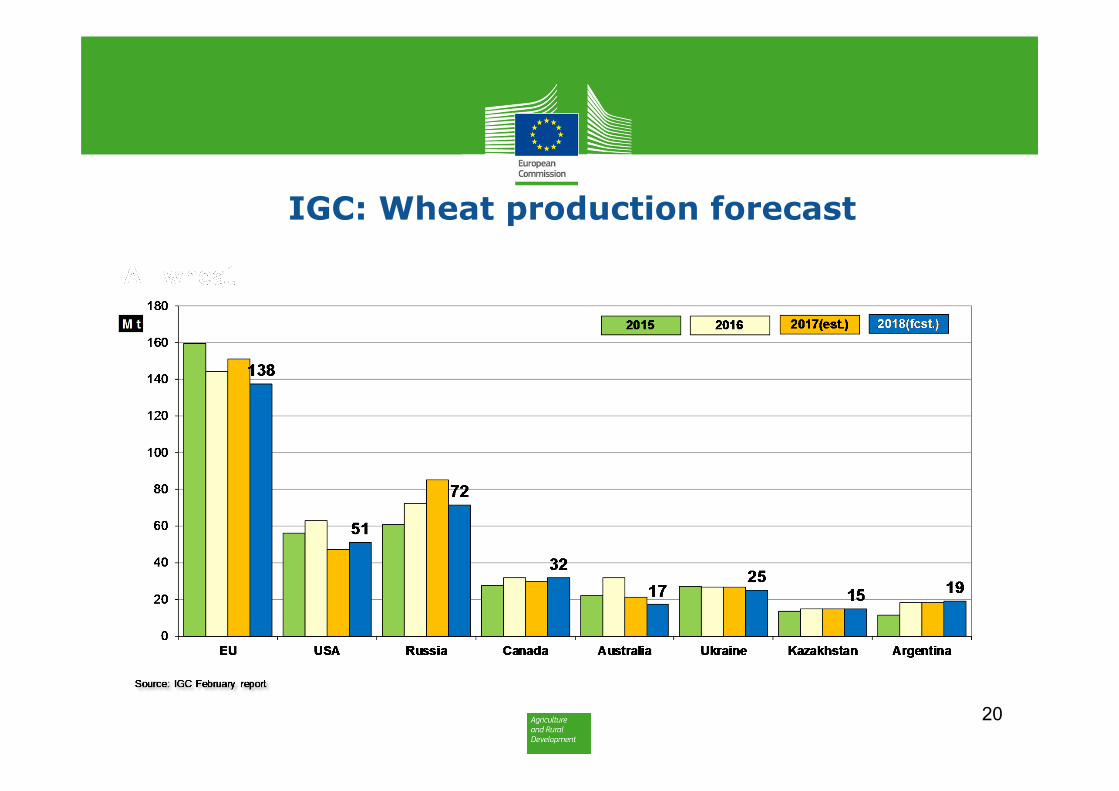
IGC: Wheat production forecast

Summary of the IGC Grain Market Report (GMR 496 of 21/02/2019) Outlook for 2018/19
• Wheat production in selected countries (all wheat; million tonnes)
21
15/16 16/17 17/18(estimate)
18/19 (forecast)
m/m change (m t)
y/y change
EU-28 159.6 144.2 151.4 137.7 - -9.1 %
USA 56.1 62.8 47.4 51.3 - +8.2 %
Canada 27.6 32.1 30.0 31.8 - +6.0%
Russia 61.0 72.5 85.1 71.6 - -15.9 %
Ukraine 27.3 26.8 27.0 25.0 - -7.3 %
Australia 22.3 31.8 21.2 17.3 +0.7 -18.6%
China 132.6 (+2.4)
133.3(+4.4)
134.3(-3.9)
131.4 -3.3 -2.2 %
India 86.5 86.0 98.5 99.7 - +1.2 %
World 739.8(+2.5)
756.9(+4.4)
763.6(-3.8)
735.2 -2.1 -3.7 %

22
World durum wheat: IGC
Summary of the IGC Grain Market Report (GMR 496 of 21/02/2019) Outlook for 2018/19
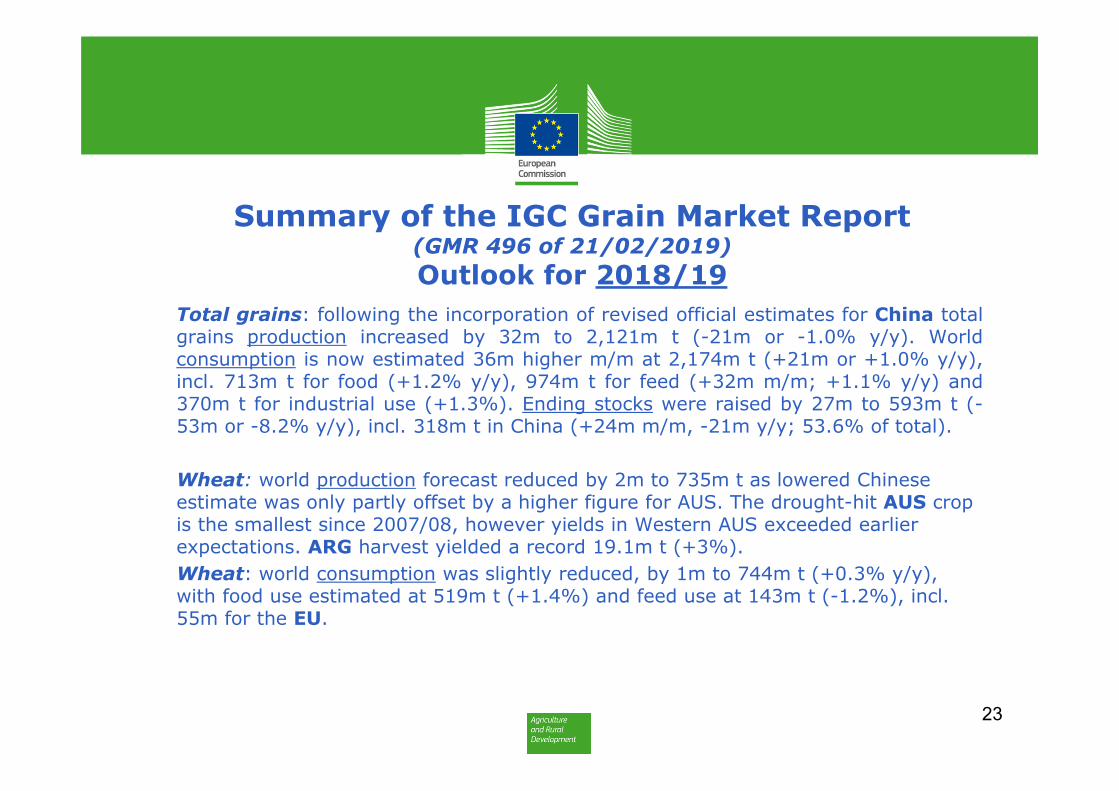
• Total grains: following the incorporation of revised official estimates for China totalgrains production increased by 32m to 2,121m t (-21m or -1.0% y/y). Worldconsumption is now estimated 36m higher m/m at 2,174m t (+21m or +1.0% y/y),incl. 713m t for food (+1.2% y/y), 974m t for feed (+32m m/m; +1.1% y/y) and370m t for industrial use (+1.3%). Ending stocks were raised by 27m to 593m t (-53m or -8.2% y/y), incl. 318m t in China (+24m m/m, -21m y/y; 53.6% of total).
• Wheat: world production forecast reduced by 2m to 735m t as lowered Chinese estimate was only partly offset by a higher figure for AUS. The drought-hit AUS crop is the smallest since 2007/08, however yields in Western AUS exceeded earlier expectations. ARG harvest yielded a record 19.1m t (+3%).
• Wheat: world consumption was slightly reduced, by 1m to 744m t (+0.3% y/y), with food use estimated at 519m t (+1.4%) and feed use at 143m t (-1.2%), incl. 55m for the EU.
••
23
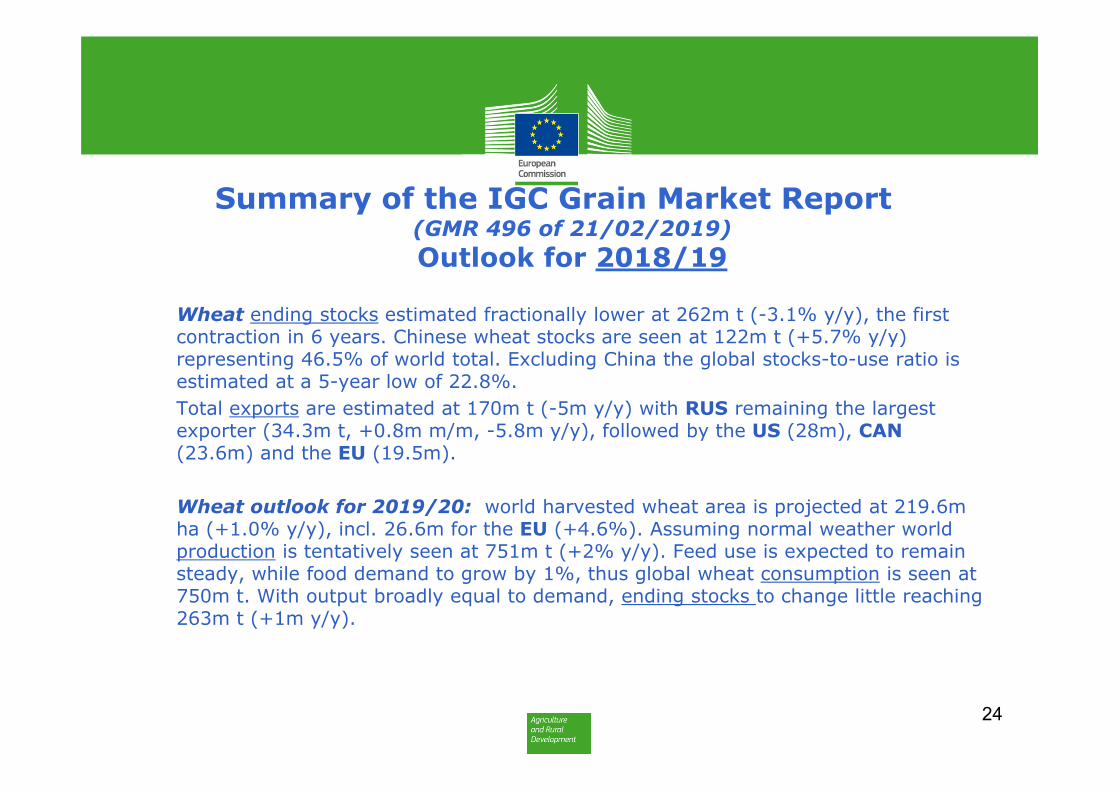
Summary of the IGC Grain Market Report (GMR 496 of 21/02/2019) Outlook for 2018/19
• Wheat ending stocks estimated fractionally lower at 262m t (-3.1% y/y), the first contraction in 6 years. Chinese wheat stocks are seen at 122m t (+5.7% y/y) representing 46.5% of world total. Excluding China the global stocks-to-use ratio is estimated at a 5-year low of 22.8%.
• Total exports are estimated at 170m t (-5m y/y) with RUS remaining the largest exporter (34.3m t, +0.8m m/m, -5.8m y/y), followed by the US (28m), CAN(23.6m) and the EU (19.5m).
• Wheat outlook for 2019/20: world harvested wheat area is projected at 219.6m ha (+1.0% y/y), incl. 26.6m for the EU (+4.6%). Assuming normal weather world production is tentatively seen at 751m t (+2% y/y). Feed use is expected to remain steady, while food demand to grow by 1%, thus global wheat consumption is seen at 750m t. With output broadly equal to demand, ending stocks to change little reaching 263m t (+1m y/y).
•24

25
World maize: IGC

26
IGC: maize production forecast

Summary of the IGC Grain Market Report (GMR 496 of 21/02/2019) Outlook for 2018/19
• Maize production in selected countries (million tonnes)
27
15/16 16/17 17/18(estimate)
18/19(forecast)
m/m change (m t)
y/y change
EU-28 59.0 62.6 64.6 65.0 - +0.6 %
USA 345.5 384.8 371.1 366.3 -5.2 -1.3 %
Ukraine 23.3 28.0 24.1 35.5 - +47.2 %
Russia 13.2 15.3 13.2 11.2 - -15.5%
Brazil 67.0 97.8 80.8 93.5 - +15.8 %
Argentina 39.8 49.5 43.3 51.0 +1.5 +17.8 %
China 265.0 (+40.4)
263.6(+44.0)
259.1(+43.2)
257.3 +37.4 -0.7 %
World 1,023.5(+40.4)
1,131.1(+44.1)
1,089.6(+42.9)
1,109.0 +33.1 +1.8 %
Summary of the IGC Grain Market Report (GMR 496 of 21/02/2019) Outlook for 2018/19
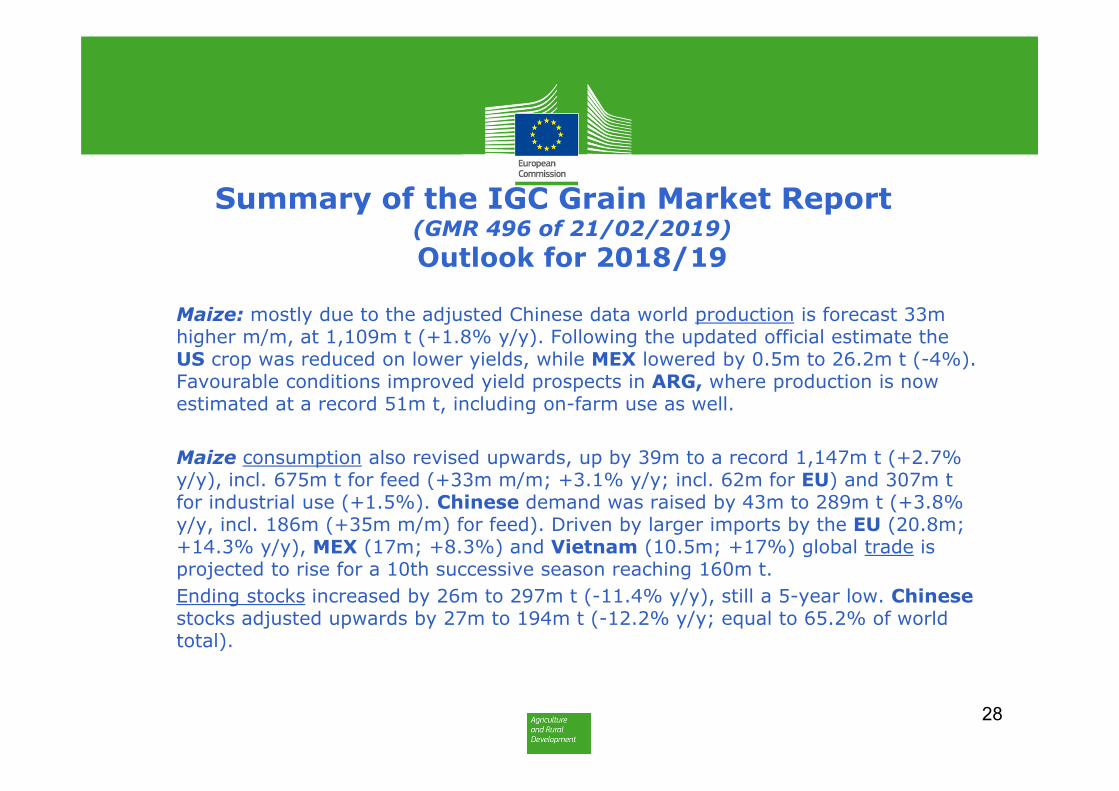
• Maize: mostly due to the adjusted Chinese data world production is forecast 33m higher m/m, at 1,109m t (+1.8% y/y). Following the updated official estimate the US crop was reduced on lower yields, while MEX lowered by 0.5m to 26.2m t (-4%).Favourable conditions improved yield prospects in ARG, where production is now estimated at a record 51m t, including on-farm use as well.
• Maize consumption also revised upwards, up by 39m to a record 1,147m t (+2.7% y/y), incl. 675m t for feed (+33m m/m; +3.1% y/y; incl. 62m for EU) and 307m t for industrial use (+1.5%). Chinese demand was raised by 43m to 289m t (+3.8% y/y, incl. 186m (+35m m/m) for feed). Driven by larger imports by the EU (20.8m; +14.3% y/y), MEX (17m; +8.3%) and Vietnam (10.5m; +17%) global trade is projected to rise for a 10th successive season reaching 160m t.
• Ending stocks increased by 26m to 297m t (-11.4% y/y), still a 5-year low. Chinesestocks adjusted upwards by 27m to 194m t (-12.2% y/y; equal to 65.2% of world total).
28

Summary of the IGC Grain Market Report (GMR 496 of 21/02/2019) Outlook for 2018/19
• Maize: preliminary prospects 2019/20: world harvested area is expected to grow by 0.9% to 194.8m ha, incl. 8.5m ha in the EU (+4.3%), 4.3m ha in UKR (-4.4%), 34.2m in USA (+3.4%) and 42.9m ha in China (+1.8%).
• US area to increase on better projected returns compared to soya beans, whereas low margins could reduce sowings in UKR.
29

30
World barley: IGC
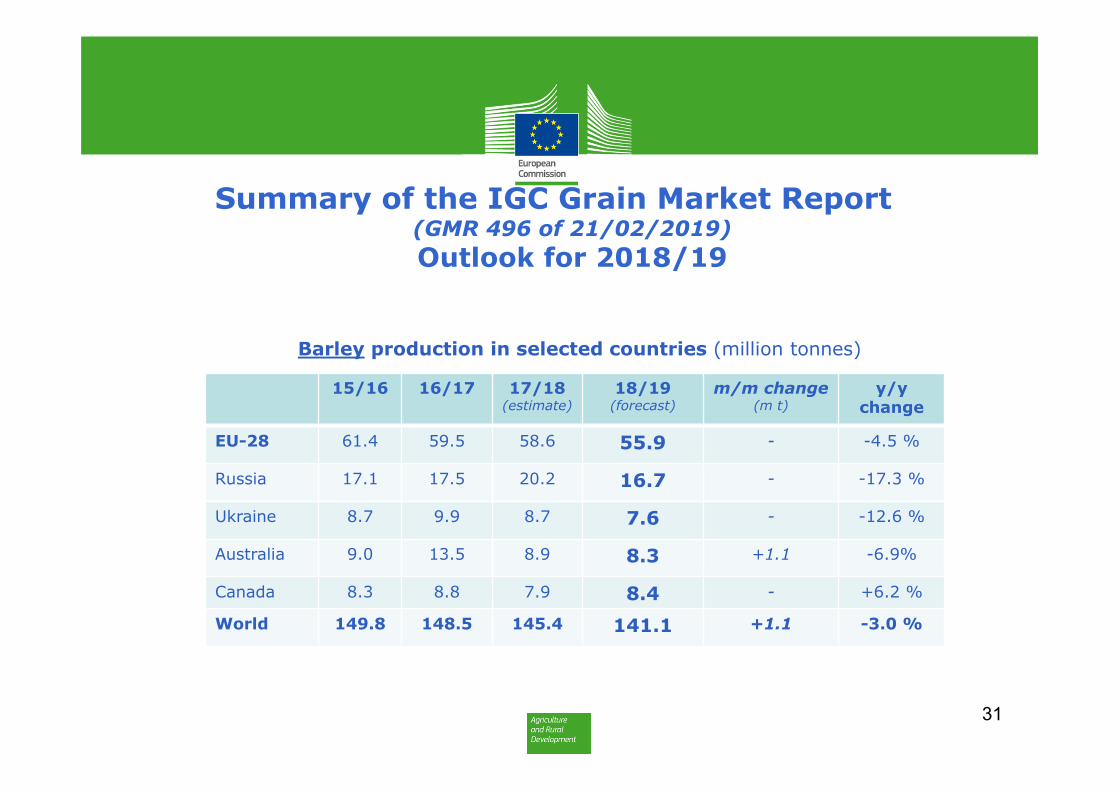
Summary of the IGC Grain Market Report (GMR 496 of 21/02/2019) Outlook for 2018/19
• Barley production in selected countries (million tonnes)
31
15/16 16/17 17/18(estimate)
18/19(forecast)
m/m change(m t)
y/y change
EU-28 61.4 59.5 58.6 55.9 - -4.5 %
Russia 17.1 17.5 20.2 16.7 - -17.3 %
Ukraine 8.7 9.9 8.7 7.6 - -12.6 %
Australia 9.0 13.5 8.9 8.3 +1.1 -6.9%
Canada 8.3 8.8 7.9 8.4 - +6.2 %
World 149.8 148.5 145.4 141.1 +1.1 -3.0 %

Summary of the IGC Grain Market Report (GMR 496 of 21/02/2019) Outlook for 2018/19
• Barley: world production forecast was raised by 1.1m to 141m t (-3% y/y) due to higher estimate for AUS, where the drop in output was less than projected before. A record crop in Western AUS partly compensated for the sharp fall in the eastern states.
• Due to a larger crop in AUS world consumption slightly increased to 145.5m t (-2.2% y/y), incl. 98m t feed use (-2.0%). Chinese import forecast lowered by 0.7m to 6.5m t (-25% y/y). Global trade in malting barley is expected to drop by 1m to 3.5m t due to quality concerns in some origins.
• Barley: preliminary prospects for 2019/20: world harvested area is expected to increase by 1% to a 4-year high of 49.3m ha (+0.6%) reflecting relatively strong prices. EU barley area is projected at 12.5m ha (+0.3%), while UKR at 2.8m ha (+10%).
32

33
World oats: IGC

Cereals Market News and Prices
34

Market News 1. (28-2-2019)Russia/Ukraine
- RUS (SovEcon): as of 21/Feb 2018/19 grain exports reached 33.4m t, incl. wheat at 28.3m (+8%), barley at 3.5m (-12%) and maize at 1.6m (-48%).
- RUS (SovEcon): reflecting favourable conditions and yields expected above trend, 2019/20 wheat crop is forecast at 80m t (+2.7m from before; 72.1m in 17/18).
- RUS (Ag.Min.): 2019/20 grain production forecast raised to 118m t from 108-110. 2018/19 grain export forecast confirmed at 42m t, incl. 37m wheat.
- UKR (Ag. Min.): as of 27 February 2018/19 grain exports reached 32.3m t (+20% y/y): wheat 12.5m (-5%), maize 15.8m (+64%), barley 3.3m (-17%).
- UKR (State Statistics Service): 2018/19 grain production estimated at 69.8m t(+13.8% from 61.3m last year), incl. wheat at 24.6m t (-57%; 26.1m), maize at 35.6m t (+47.8%; 24.1m) and barley at 7.3m t.
- UKR (Ag.Min): 2018/19 grain exports seen at a record 49m t (+24% y/y).
35

Market News 2. (28-2-2019)USA: Grain export inspections w/e 19/FEBR/2019
36
• Marketing Year = June/May for wheat and September/August for maize, sorghum and soybeans; www.ams.usda.gov/mnreports/wa_gr101.txt
- - US maize exports slowed recently with weekly shipments at 0.75-0.94m t- - US wheat & soybeans exports slightly stronger due to improved competitiveness
Commodity MY 2018/19 MY 2017/18 Change
Maize 24 921 716 17 996 877 + 38.5 %
Sorghum 826 288 2 749 022 - 69.9 %
Soybeans 25 036 623 37 781 725 - 33.7 %
Wheat 16 447 718 17 882 069 - 8.0 %

Market News 3. (28-2-2019)USA
- USDA’s Winter Wheat and Canola Seedings report: Based on a survey conducted in early December 2018 winter wheat area seeded for the 2019 harvest is estimated at 12.66m ha (-3.8% y/y and -4.4% from 2017). This represents the 2nd lowest US acreage on record and smallest in 110 years.
- The total includes: Hard Red Winter: 8.98m ha (70.9% of total; -3% y/y) Soft Red Winter: 2.29m ha (18.1% of total; -7% y/y) White Winter: 1.39m ha (11.0% of total; -3% y/y)
- US will not raise import duties on $200 billion in Chinese goods to 25% from a current 10% due to substantial progress in trade talks. (IEG Vantage)
37
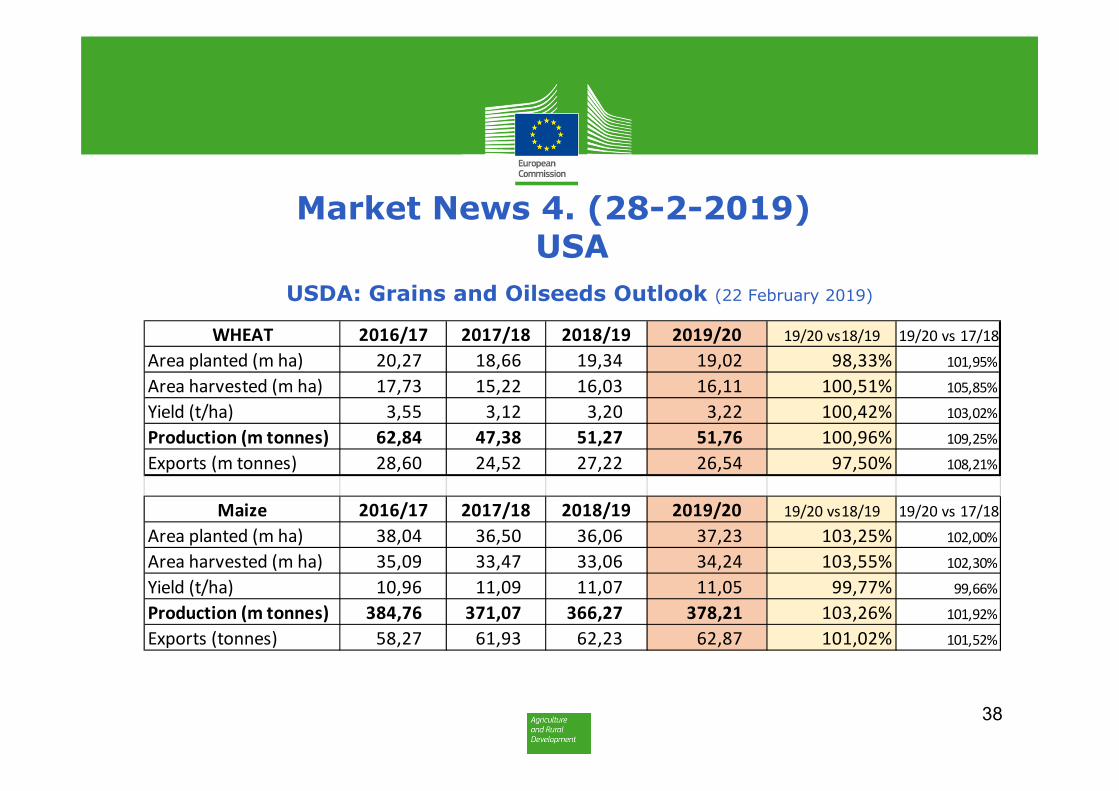
Market News 4. (28-2-2019)USA
USDA: Grains and Oilseeds Outlook (22 February 2019)
38
WHEAT 2016/17 2017/18 2018/19 2019/20 19/20 vs18/19 19/20 vs 17/18Area planted (m ha) 20,27 18,66 19,34 19,02 98,33% 101,95%Area harvested (m ha) 17,73 15,22 16,03 16,11 100,51% 105,85%Yield (t/ha) 3,55 3,12 3,20 3,22 100,42% 103,02%Production (m tonnes) 62,84 47,38 51,27 51,76 100,96% 109,25%Exports (m tonnes) 28,60 24,52 27,22 26,54 97,50% 108,21%
Maize 2016/17 2017/18 2018/19 2019/20 19/20 vs18/19 19/20 vs 17/18Area planted (m ha) 38,04 36,50 36,06 37,23 103,25% 102,00%Area harvested (m ha) 35,09 33,47 33,06 34,24 103,55% 102,30%Yield (t/ha) 10,96 11,09 11,07 11,05 99,77% 99,66%Production (m tonnes) 384,76 371,07 366,27 378,21 103,26% 101,92%Exports (tonnes) 58,27 61,93 62,23 62,87 101,02% 101,52%
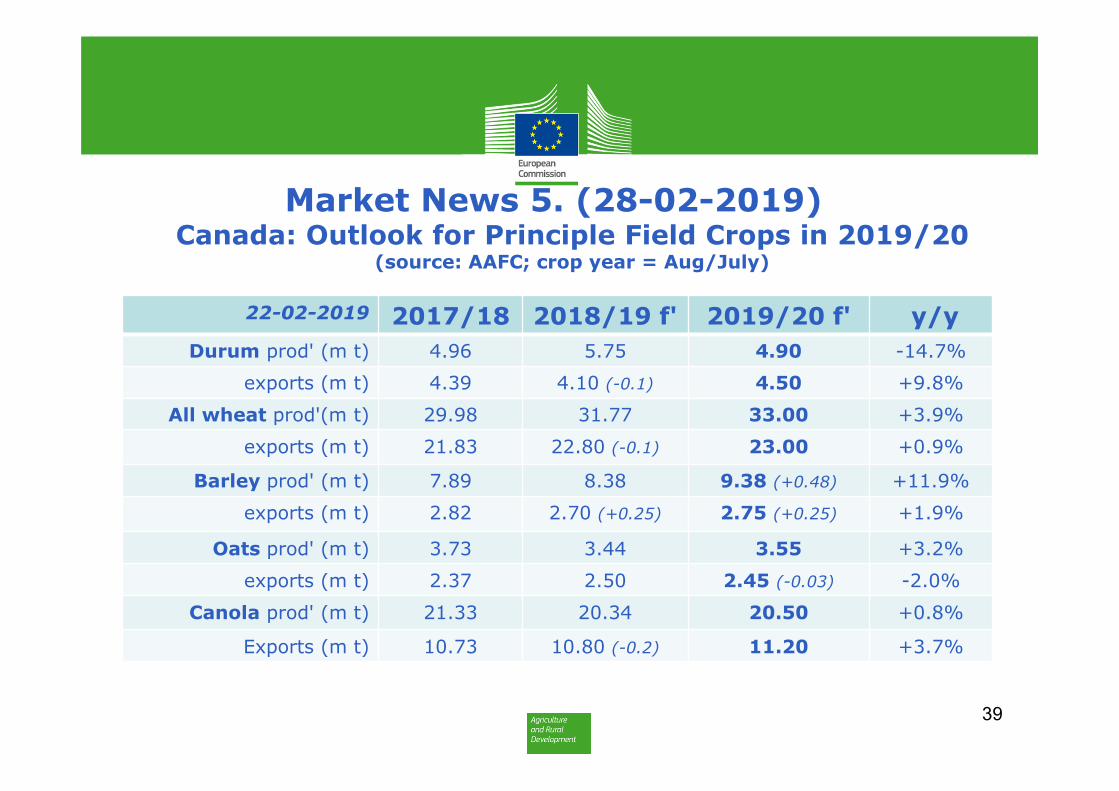
Market News 5. (28-02-2019) Canada: Outlook for Principle Field Crops in 2019/20
(source: AAFC; crop year = Aug/July)
22-02-2019 2017/18 2018/19 f' 2019/20 f' y/y Durum prod' (m t) 4.96 5.75 4.90 -14.7%
exports (m t) 4.39 4.10 (-0.1) 4.50 +9.8%
All wheat prod'(m t) 29.98 31.77 33.00 +3.9%
exports (m t) 21.83 22.80 (-0.1) 23.00 +0.9%
Barley prod' (m t) 7.89 8.38 9.38 (+0.48) +11.9%
exports (m t) 2.82 2.70 (+0.25) 2.75 (+0.25) +1.9%
Oats prod' (m t) 3.73 3.44 3.55 +3.2%
exports (m t) 2.37 2.50 2.45 (-0.03) -2.0%
Canola prod' (m t) 21.33 20.34 20.50 +0.8%
Exports (m t) 10.73 10.80 (-0.2) 11.20 +3.7%
39
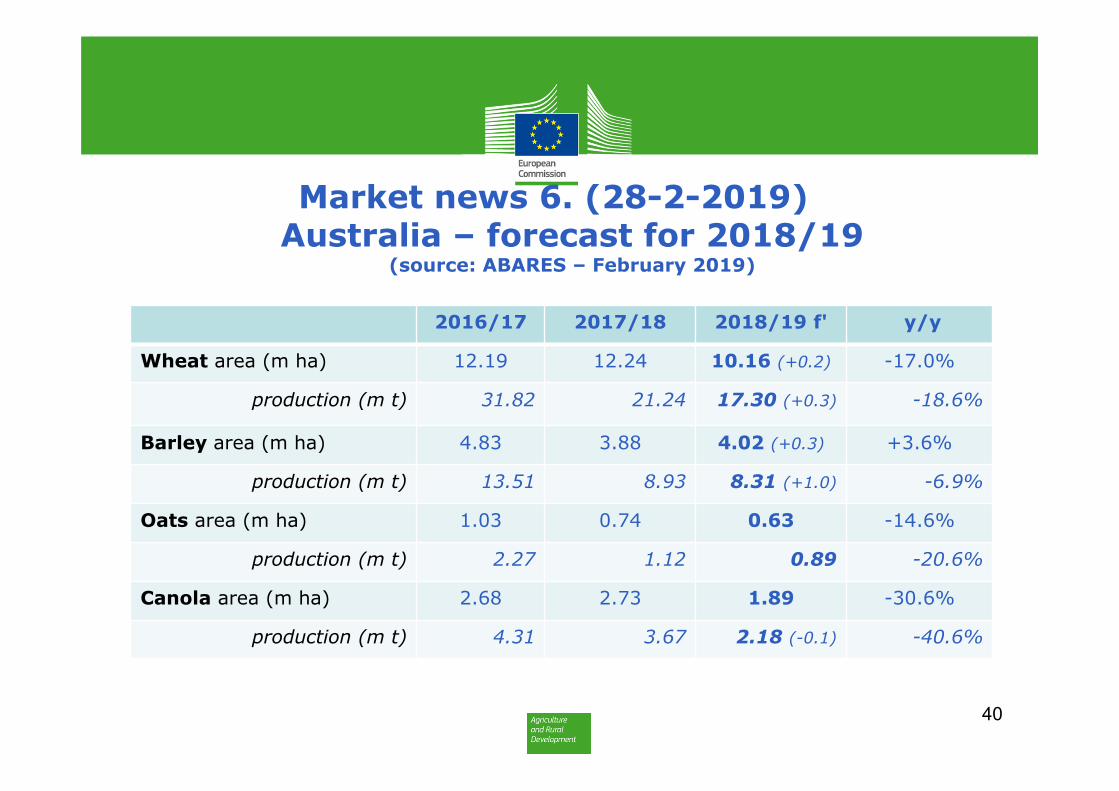
Market news 6. (28-2-2019)Australia – forecast for 2018/19
(source: ABARES – February 2019)
2016/17 2017/18 2018/19 f' y/y
Wheat area (m ha) 12.19 12.24 10.16 (+0.2) -17.0%
production (m t) 31.82 21.24 17.30 (+0.3) -18.6%
Barley area (m ha) 4.83 3.88 4.02 (+0.3) +3.6%
production (m t) 13.51 8.93 8.31 (+1.0) -6.9%
Oats area (m ha) 1.03 0.74 0.63 -14.6%
production (m t) 2.27 1.12 0.89 -20.6%
Canola area (m ha) 2.68 2.73 1.89 -30.6%
production (m t) 4.31 3.67 2.18 (-0.1) -40.6%
40
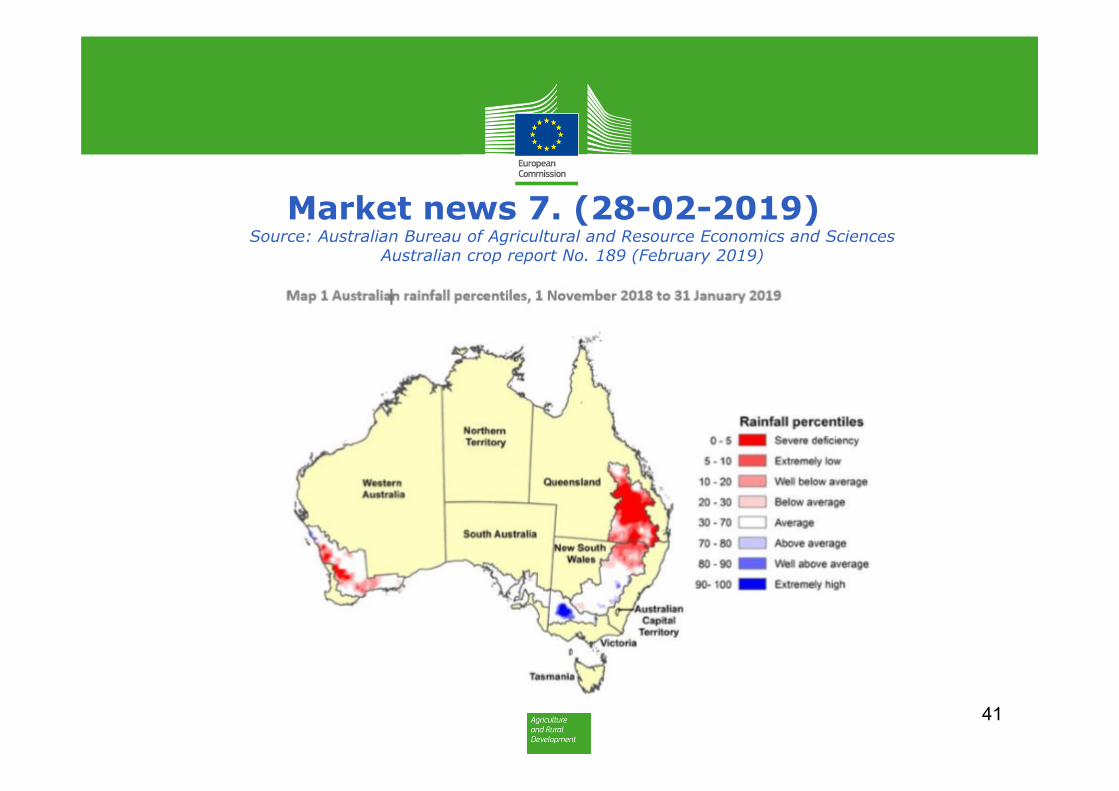
Market news 7. (28-02-2019)Source: Australian Bureau of Agricultural and Resource Economics and Sciences
Australian crop report No. 189 (February 2019)
41

Market News 8. (28-2-2019)Australia (ABARES report February 2019)
• - In 2018/19 production of all major winter crops (wheat, barley, oats, canola) fell due to severe drought in the eastern states, mainlyQueensland and New South Wales.
• - Wheat and barley production fell sharply in NSW in particular (-60% to 1.8m and -47% to 0.6m respectively) as large areas were cut for hay.
• - Wheat and barley production decreased by around 50% in Victoria to 2m and 1.1m respectively.
• - Conditions were much more favourable in Western Australia where total winter crop production reached 17.7m t, 2nd largest on record, including:• 10.2m t wheat (+28% y/y despite a 6% decrease in area)• 4.9m t barley (a record for the region; +33% due to a 25% increase in area)
• - For the March-May 2019 period outlook is for below average rainfall in Queensland and northern NSW.
42

Market News 9. (28-2-2019)Brazil
• CONAB February report on 2018/19 S&D forecasts:• - Maize: estimated full season crop lowered on reduced yield prospects (5.27 t/ha)
due to hot and dry conditions. Area is seen at 5m ha (-1.2% y/y). The safrinha cropestimate raised on larger area (11.8m ha; +2.4%), while yield is projected to reach5.52 t/ha (+18.2%). Exports unchanged at 31m t from before (+25%).
• - Soya bean crop forecast reduced sharply reflecting unfavourable conditions. Furthercuts are likely in the March report. While area is seen at 35.8m ha (+1.9%), yield isexpected to decrease by 5.1% to 3.22 t/ha.
43
12-02-2019 Forecast +/- previous f'cast
Previous year
+/- y/y
Wheat prod (m t) 5.6 +0.2 4.3 +32%Consumption (m t) 11.4 +0.4 11.3 +1%
Soybeans prod (m t) 115.3 -3.5 119.3 -3%Soy exports (m t) 71.5 -3.5 83.6 -14%
Maize prod (m t) 91.7 +0.5 80.8 +13%Maize 1st crop 26.5 -0.9 26.8 -1%Maize 2nd crop 65.2 +1.5 53.9 +21%

Market News 10. (28-2-2019)
• - ARG (BAGE): owing to higher yield estimates for early planted crops, 2018/19 maize production forecast increased by 2m to 45mt (31.7m previous year). Maize was sown on 5.8m ha (+0.3m ha y/y). Soya bean production forecast maintained at 53m t with planted area estimated at 17.7m ha (≈ y/y).
• - ARG (Ag. Min.): 2018/19 wheat production forecast raised by 0.2m to 19.5m t (18.5m last year) and barley unchanged at 5.1m t (3.7m).
• - Egypt (IGC): 2019/20 wheat production forecast at 9.5m t (9.0m previous year), from an area of 1.3m ha (1.2m).
• - Egypt (IGC): Government decided to permit wheat imports from Serbia.
44
45
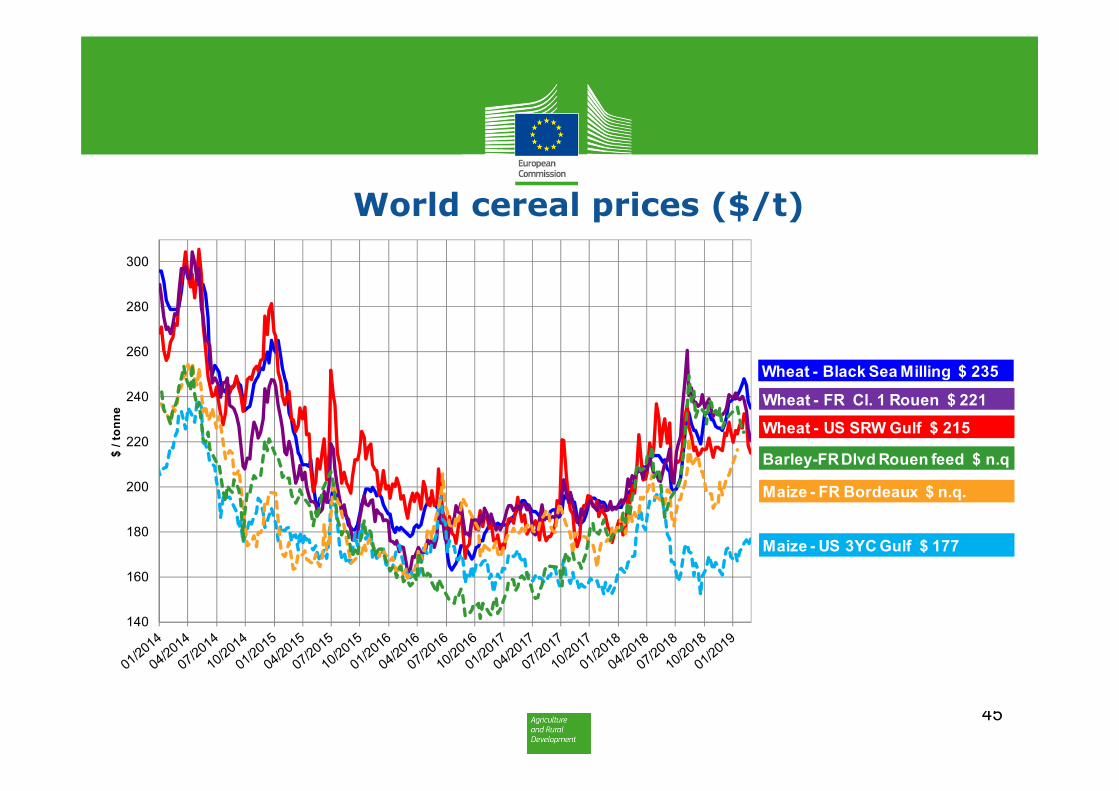
World cereal prices ($/t)
140
160
180
200
220
240
260
280
300
$ / t
onne
Wheat - Black Sea Milling $ 235
Wheat - US SRW Gulf $ 215Wheat - FR Cl. 1 Rouen $ 221
Maize - FR Bordeaux $ n.q.
Maize - US 3YC Gulf $ 177
Barley-FR Dlvd Rouen feed $ n.q

46
World common wheat prices ($/t)
140
190
240
290
340
390
$ / t
onne
Wheat - Black Sea Milling $ 235
Wheat - US SRW Gulf $ 215
Wheat - FR Cl. 1 Rouen $ 221
Wheat - Argentina - $ 238

47
US CME SRW wheat futures
48
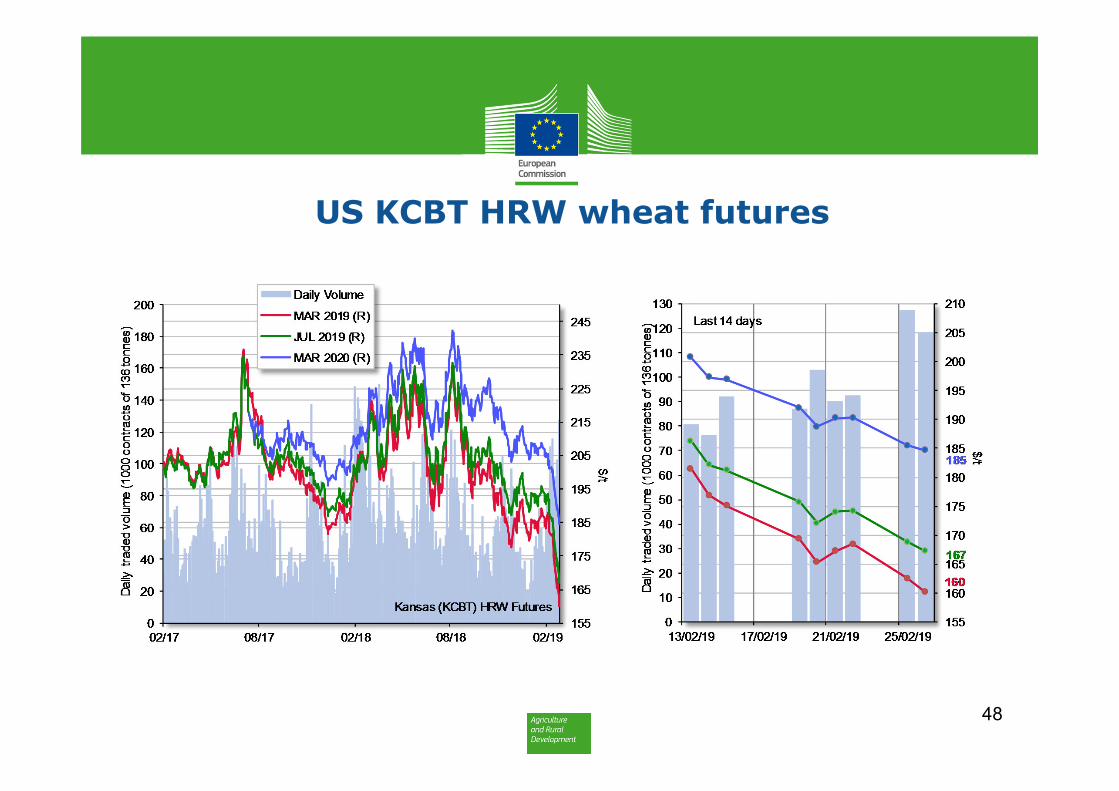
US KCBT HRW wheat futures

49
EU Milling Wheat Futures

50
CME maize futures

51
EU maize futures

Trade
52

53
Selected cereals trade for the past 4 weeksCountry Crop Quantity
(in t)Price($/t)
Origins Delivery
Egypt Wheat 300 000 US: 234.5 fob(Freight:25.5 $/t)
EU/UKR: 244.5-248(Freight: 13.3-17.2 $/t)
US (SRW): 120 000EU (FR): 120 000
UKR: 60 000
March
Egypt Wheat 360 000 234.5-238.2 fob Freight: 11.3-18.1 $/t
EU (FR): 180 000EU (RO): 60 000
RUS: 60 000UKR: 60 000
Apr
Algeria Wheat 600 000 247-247.5 c&f Optional (possibly EU) Mar/Apr
Algeria Barley 120 000 219-220 c&f optional Mar
Tunisia Barley 75 000 202.2-2018.5 c&f optional Apr-Jul

54
(update of Situation at 25/02/2019)
● Imports: 20.9m t (15.3m t last year; 11.4m t two years ago) 3.29m t soft wheat +23% y/y 0.75m t durum wheat -27% y/y 16.1m t maize +45% y/y 0.11m t barley -71% y/y
● Exports: 18.5m t (21.5m t last year; 25.3m t two years ago) 11.6m t soft wheat -17% y/y 3m t barley -21% y/y 0.53m t durum wheat -28% y/y 1.34m t maize +58% y/y
●
EU cereals trade 2018/19
So far, the EU is a net cereal importer of 2.4m t. Last year at this stage, EU was a net exporter of 6.2m t against 13.9m t two years ago.

55Source: AMIS - Market Monitor

Conclusions
- Most cereals prices decreased on slow demand, ample supplies and good prospects for new crops
- Wheat futures prices fell sharply to contract lows - Maize prices fell for ARG & UKR and edged higher for US - RUS wheat exports continued to slow on reduced competitiveness - USDA lowered US maize crop, while raised ARG output to a record - IGC incorporated revised official Chinese production data resulting
in higher global maize production, use and stocks - On fob basis US SRW wheat most competitive - On fob basis ARG is the cheapest origin for maize
56

Thank you for your attention!
Market data the for cereals, oilseeds and protein crops are available at the EU Crops Market Observatory .
https://ec.europa.eu/agriculture/market-observatory/crops