Commissioning subsystems of the 10 meter prototype
19
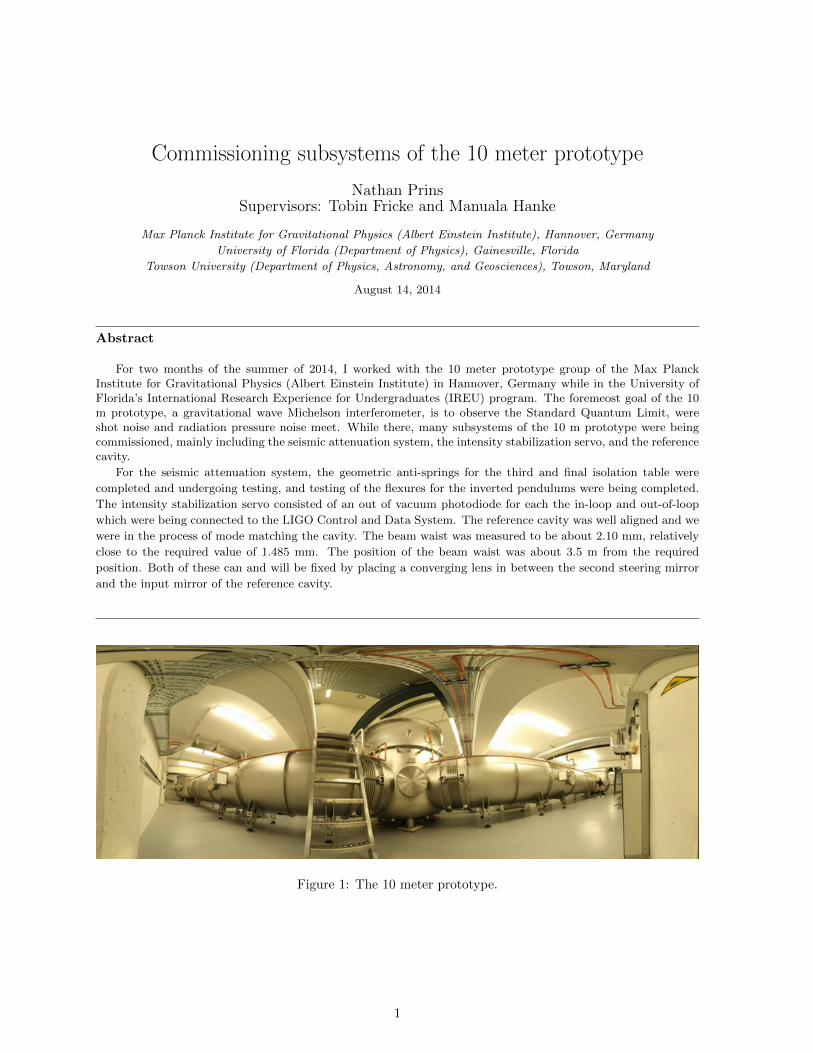
Commissioning subsystems of the 10 meter prototype Nathan Prins Supervisors: Tobin Fricke and Manuala Hanke Max Planck Institute for Gravitational Physics (Albert Einstein Institute), Hannover, Germany University of Florida (Department of Physics), Gainesville, Florida Towson University (Department of Physics, Astronomy, and Geosciences), Towson, Maryland August 14, 2014 Abstract For two months of the summer of 2014, I worked with the 10 meter prototype group of the Max Planck Institute for Gravitational Physics (Albert Einstein Institute) in Hannover, Germany while in the University of Florida’s International Research Experience for Undergraduates (IREU) program. The foremeost goal of the 10 m prototype, a gravitational wave Michelson interferometer, is to observe the Standard Quantum Limit, were shot noise and radiation pressure noise meet. While there, many subsystems of the 10 m prototype were being commissioned, mainly including the seismic attenuation system, the intensity stabilization servo, and the reference cavity. For the seismic attenuation system, the geometric anti-springs for the third and final isolation table were completed and undergoing testing, and testing of the flexures for the inverted pendulums were being completed. The intensity stabilization servo consisted of an out of vacuum photodiode for each the in-loop and out-of-loop which were being connected to the LIGO Control and Data System. The reference cavity was well aligned and we were in the process of mode matching the cavity. The beam waist was measured to be about 2.10 mm, relatively close to the required value of 1.485 mm. The position of the beam waist was about 3.5 m from the required position. Both of these can and will be fixed by placing a converging lens in between the second steering mirror and the input mirror of the reference cavity. Figure 1: The 10 meter prototype. 1
Transcript of Commissioning subsystems of the 10 meter prototype
Commissioning subsystems of the 10 meter prototype
Nathan PrinsSupervisors: Tobin Fricke and Manuala Hanke
Max Planck Institute for Gravitational Physics (Albert Einstein Institute), Hannover, Germany
University of Florida (Department of Physics), Gainesville, Florida
Towson University (Department of Physics, Astronomy, and Geosciences), Towson, Maryland
August 14, 2014
Abstract
For two months of the summer of 2014, I worked with the 10 meter prototype group of the Max PlanckInstitute for Gravitational Physics (Albert Einstein Institute) in Hannover, Germany while in the University ofFlorida’s International Research Experience for Undergraduates (IREU) program. The foremeost goal of the 10m prototype, a gravitational wave Michelson interferometer, is to observe the Standard Quantum Limit, wereshot noise and radiation pressure noise meet. While there, many subsystems of the 10 m prototype were beingcommissioned, mainly including the seismic attenuation system, the intensity stabilization servo, and the referencecavity.
For the seismic attenuation system, the geometric anti-springs for the third and final isolation table were
completed and undergoing testing, and testing of the flexures for the inverted pendulums were being completed.
The intensity stabilization servo consisted of an out of vacuum photodiode for each the in-loop and out-of-loop
which were being connected to the LIGO Control and Data System. The reference cavity was well aligned and we
were in the process of mode matching the cavity. The beam waist was measured to be about 2.10 mm, relatively
close to the required value of 1.485 mm. The position of the beam waist was about 3.5 m from the required
position. Both of these can and will be fixed by placing a converging lens in between the second steering mirror
and the input mirror of the reference cavity.
Figure 1: The 10 meter prototype.
1
1 Introduction
In 1916, Albert Einstein, backed by his revolutionary theory of general relativity, predicted the existence of
gravitational waves, carriers of gravitational energy produced by accelerating masses [1]. This prediction
came about because of the Lorentz invariance, stating that information cannot propogate faster than the
speed of light. This is opposed to Newton’s gravity, in which the force of gravity acts instantaneously on
mass. Hence, gravitational waves propogate gravitation information at the speed of light in the form of
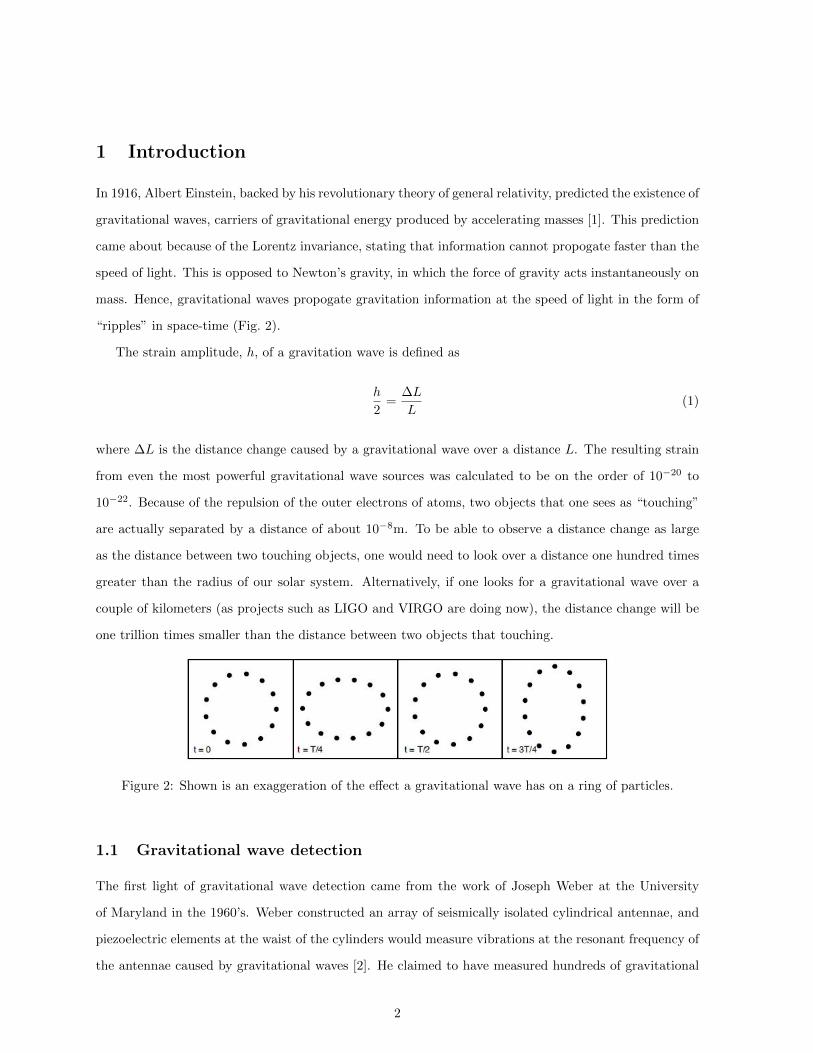
“ripples” in space-time (Fig. 2).
The strain amplitude, h, of a gravitation wave is defined as
h
2=
∆L
L(1)
where ∆L is the distance change caused by a gravitational wave over a distance L. The resulting strain
from even the most powerful gravitational wave sources was calculated to be on the order of 10−20 to
10−22. Because of the repulsion of the outer electrons of atoms, two objects that one sees as “touching”
are actually separated by a distance of about 10−8m. To be able to observe a distance change as large
as the distance between two touching objects, one would need to look over a distance one hundred times
greater than the radius of our solar system. Alternatively, if one looks for a gravitational wave over a
couple of kilometers (as projects such as LIGO and VIRGO are doing now), the distance change will be
one trillion times smaller than the distance between two objects that touching.
Figure 2: Shown is an exaggeration of the effect a gravitational wave has on a ring of particles.
1.1 Gravitational wave detection
The first light of gravitational wave detection came from the work of Joseph Weber at the University
of Maryland in the 1960’s. Weber constructed an array of seismically isolated cylindrical antennae, and
piezoelectric elements at the waist of the cylinders would measure vibrations at the resonant frequency of
the antennae caused by gravitational waves [2]. He claimed to have measured hundreds of gravitational
2
wave events over a few months with his technique, but the inablility to replicate his results by numerous
outside groups around the world revealed that Weber had used inconsistent and subjective data analysis
techniques. Through failing to admit to his mistakes and stubbornly holding on to the validity of his
discoveries, Weber’s voice fell into controversy and defamer. However, his legacy is that of a “brilliant
blunder,” as defined by Mario Livio [5], for his research, though flawed, evoked a surge of new ideas and
continuing research in gravitation wave detection.
Soon after came the discovery of the binary system of two neutron stars by Russell Alan Hulse and
Joseph Hooton Taylor, Jr. with the Arecibo 305m antenna [3]. One of these neutron stars is a pulsar,
meaning it regularly releases a burst of radio waves due to the rapid rotation about its own axis. By
observing the systematic time variations of the radio pulses, the duo from the University of Massachusetts
Amherst found that the orbit of the two neutron stars was contracting in such a way that was accurately
described by the emission of gravitational waves, thus marking the first evidence of gravitational waves,
albeit indirect.
The next step in gravitational wave detection is the direct detection of gravitational waves, as We-
ber tried to do. Doing so will open an entirely new form of astronomy, gravitational wave astronomy,
with which will come the direct observation of black holes, the revealing of the cores of supernovae,
the investigation of the subtle working of dark matter, and perhaps the observation of events not yet
discovered.
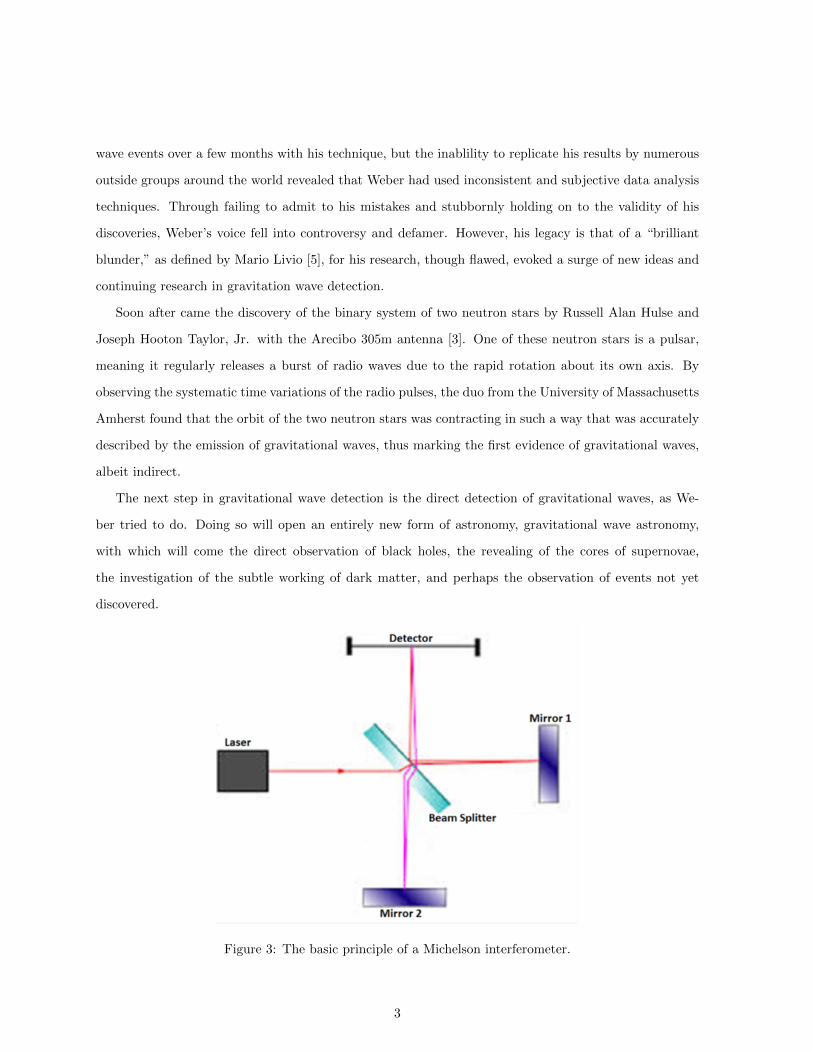
Figure 3: The basic principle of a Michelson interferometer.
3
1.2 Interferometry
Since the Weber bar was decidedly not sensitive enough, the Michelson interferometer has been used to try
to detect gravitational waves. Originally used to measure the speed of light, the Michelson interferometer
measures the distances of two mirrors relative to each other (Fig. 3). A laser beam is pointed at a beam
splitter which separates the beam into two, each going to a different mirror. Both beams come back to
the beam splitter which then sends parts of each beam to a detector. Because lasers are waves, the two
beams interfere at the detector, resulting in fringes. This interference can quantify the distances of the
the two mirrors from the beam splitter if the wavelength of the beam is known.
In the past few decades, major gravitational wave interferometry projects have started. This includes
sites that have collected data, such as the Laser Interferometry Gravitational wave Observatory (LIGO),
which has a 4km interferometer in both Livingston, Louisiana and Hanford, Washington, Virgo, a 3km
interferometer located in Cassia, Italy, and GEO600, the 600m interferometer in Hannover, Germany,
as well as smaller sites used for the research and developement of noise reduction techniques, such
as the LIGO 40m prototype at the California Institute of Technology and TAMA300 at the National
Astronomical Observatory of Japan. Techniques of improving the sensitivity of all detectors and the
quality of the scientific data will improve as more detectors, both larger and smaller, are built and the
business of detecting gravitational waves will grow stronger.
In collaboration with Leibniz University and the QUEST cluster of excellence (QUantum Engineering
and Space Time research), the Max Planck Institute for Gravitation Physics (Albert Einstein Institute)
has been developing the Hannover 10 meter prototype (Fig. 1), an L-shaped Michelson interferometer
with 11.65m arms. The foremost goal of the 10m prototype is to realize a sensitivity defined as the
Standard Quantum Limit (SQL), study the quantum proterties at the SQL, and eventually surpass the
SQL sensitivity. The ability to study the quantum properties of the test masses will translate to the
development of techniques to surpass the SQL in future generation gravitational wave detectors.
While at the Albert Einstein Institute (AEI) in Hannover, I assisted in commissioning many of the
subsystems of the 10m prototype, including the intensity stabilization, reference cavity, thermal noise
interferometer, and seismic attenuation system. In this paper, I present an overview of what I learned
about each subsystem, what I have done with each system, and what still needs to be done in the future.
4
2 The sub-SQL interferometer
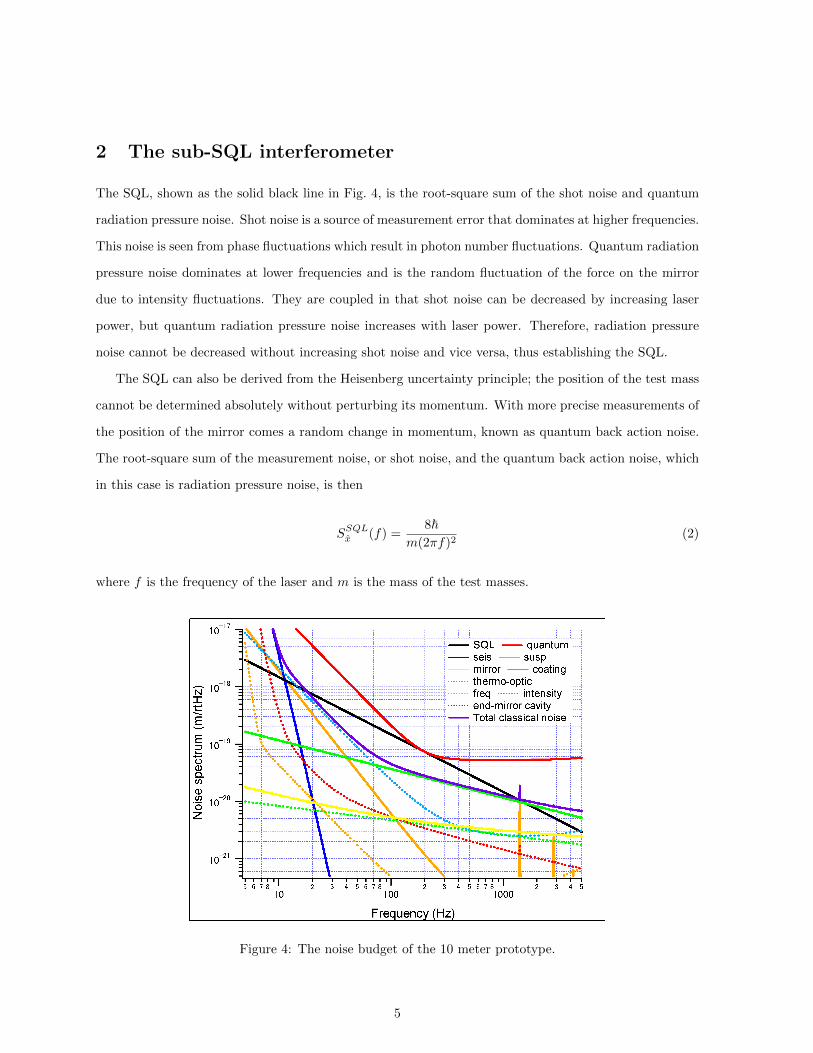
The SQL, shown as the solid black line in Fig. 4, is the root-square sum of the shot noise and quantum
radiation pressure noise. Shot noise is a source of measurement error that dominates at higher frequencies.
This noise is seen from phase fluctuations which result in photon number fluctuations. Quantum radiation
pressure noise dominates at lower frequencies and is the random fluctuation of the force on the mirror
due to intensity fluctuations. They are coupled in that shot noise can be decreased by increasing laser
power, but quantum radiation pressure noise increases with laser power. Therefore, radiation pressure
noise cannot be decreased without increasing shot noise and vice versa, thus establishing the SQL.
The SQL can also be derived from the Heisenberg uncertainty principle; the position of the test mass
cannot be determined absolutely without perturbing its momentum. With more precise measurements of
the position of the mirror comes a random change in momentum, known as quantum back action noise.
The root-square sum of the measurement noise, or shot noise, and the quantum back action noise, which
in this case is radiation pressure noise, is then
SSQLx̂ (f) =
8~m(2πf)2
(2)
where f is the frequency of the laser and m is the mass of the test masses.
Figure 4: The noise budget of the 10 meter prototype.
5
As the SQL is inversely proportional to the mass, increasing the mass will effectively reduce the SQL.
This is why LIGO uses 40kg test masses. However, the 10m prototype wants to observe the SQL. To
acomplish this, the SQL is increased by decreasing the mass of the test masses. Unfortunately, the masses
cannot be decreased too much without excessively increasing thermal noise, so 100g masses are used.
The laser used is a 1064nm nonplanar ring oscillator (NPRO), and it is a continuous wave, solid-state
laser.
3 Seismic attenuation system
Seismic noise is caused by the natural vibration of Earth below 0.3 Hz and human activity (traffic,
trains, and even people walking around the building) around 1-10 Hz, and is the main source of noise in
this frequency range. The seismic attenuation system (SAS) keeps the mirrors as still as possible. The
SAS consists of a triple suspension system placed on an isolation table, both with active and passive
attenuation. Passive attenuation is a result of the design of the SAS, and it revolves around decreasing
the resonant frequency of the apparatuses. Active attenuation is acheived by measuring the parameter
to be attenuated, and then implementing a method to change it to a desired value.
3.1 Suspension system
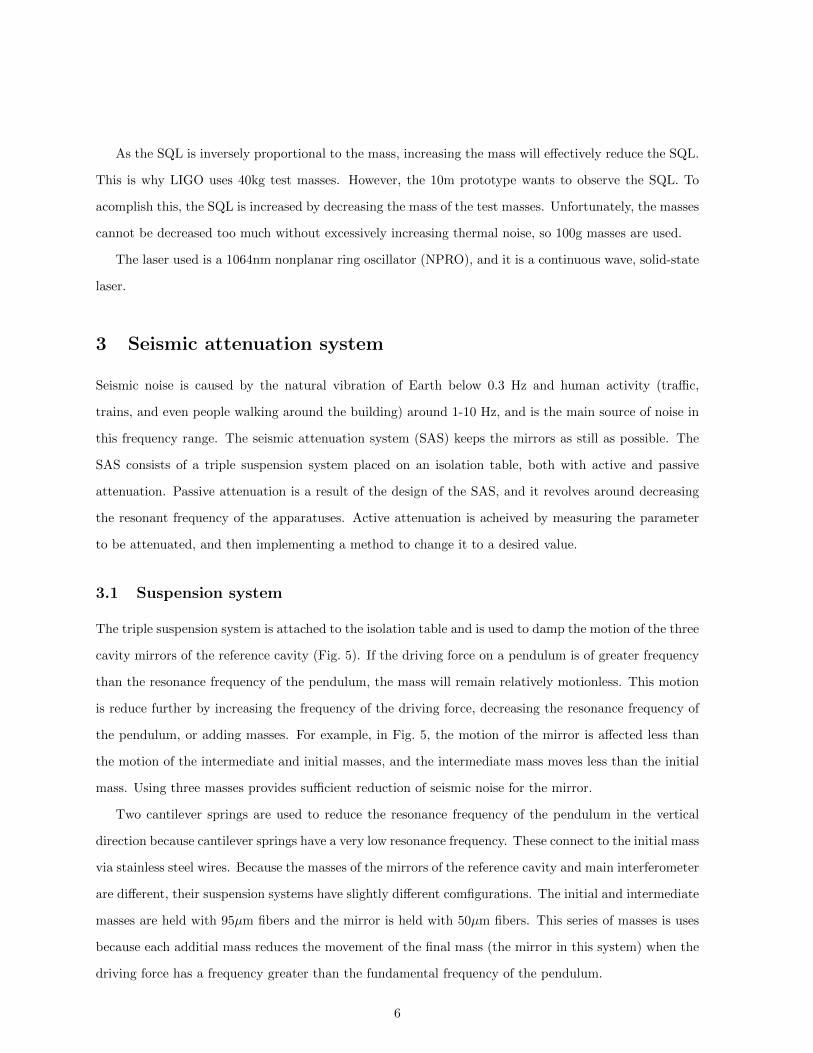
The triple suspension system is attached to the isolation table and is used to damp the motion of the three
cavity mirrors of the reference cavity (Fig. 5). If the driving force on a pendulum is of greater frequency
than the resonance frequency of the pendulum, the mass will remain relatively motionless. This motion
is reduce further by increasing the frequency of the driving force, decreasing the resonance frequency of
the pendulum, or adding masses. For example, in Fig. 5, the motion of the mirror is affected less than
the motion of the intermediate and initial masses, and the intermediate mass moves less than the initial
mass. Using three masses provides sufficient reduction of seismic noise for the mirror.
Two cantilever springs are used to reduce the resonance frequency of the pendulum in the vertical
direction because cantilever springs have a very low resonance frequency. These connect to the initial mass
via stainless steel wires. Because the masses of the mirrors of the reference cavity and main interferometer
are different, their suspension systems have slightly different comfigurations. The initial and intermediate
masses are held with 95µm fibers and the mirror is held with 50µm fibers. This series of masses is uses
because each additial mass reduces the movement of the final mass (the mirror in this system) when the
driving force has a frequency greater than the fundamental frequency of the pendulum.
6
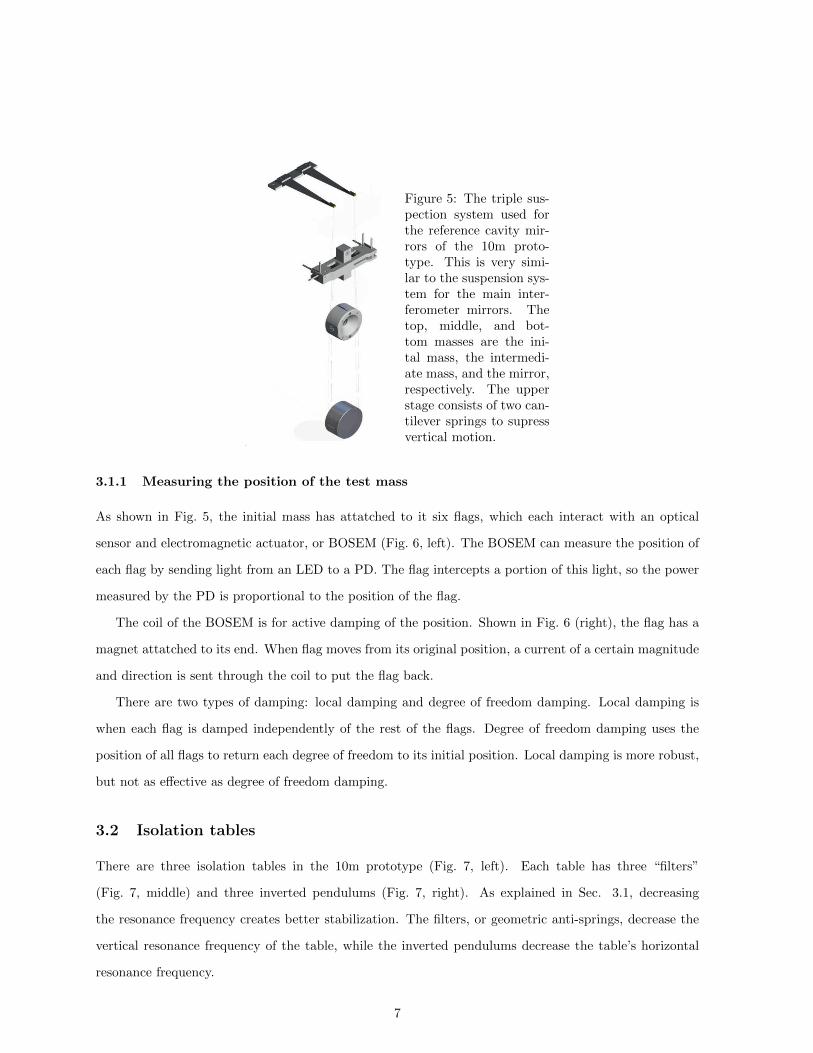
Figure 5: The triple sus-pection system used forthe reference cavity mir-rors of the 10m proto-type. This is very simi-lar to the suspension sys-tem for the main inter-ferometer mirrors. Thetop, middle, and bot-tom masses are the ini-tal mass, the intermedi-ate mass, and the mirror,respectively. The upperstage consists of two can-tilever springs to supressvertical motion.
3.1.1 Measuring the position of the test mass
As shown in Fig. 5, the initial mass has attatched to it six flags, which each interact with an optical
sensor and electromagnetic actuator, or BOSEM (Fig. 6, left). The BOSEM can measure the position of
each flag by sending light from an LED to a PD. The flag intercepts a portion of this light, so the power
measured by the PD is proportional to the position of the flag.
The coil of the BOSEM is for active damping of the position. Shown in Fig. 6 (right), the flag has a
magnet attatched to its end. When flag moves from its original position, a current of a certain magnitude
and direction is sent through the coil to put the flag back.
There are two types of damping: local damping and degree of freedom damping. Local damping is
when each flag is damped independently of the rest of the flags. Degree of freedom damping uses the
position of all flags to return each degree of freedom to its initial position. Local damping is more robust,
but not as effective as degree of freedom damping.
3.2 Isolation tables
There are three isolation tables in the 10m prototype (Fig. 7, left). Each table has three “filters”
(Fig. 7, middle) and three inverted pendulums (Fig. 7, right). As explained in Sec. 3.1, decreasing
the resonance frequency creates better stabilization. The filters, or geometric anti-springs, decrease the
vertical resonance frequency of the table, while the inverted pendulums decrease the table’s horizontal
resonance frequency.
7
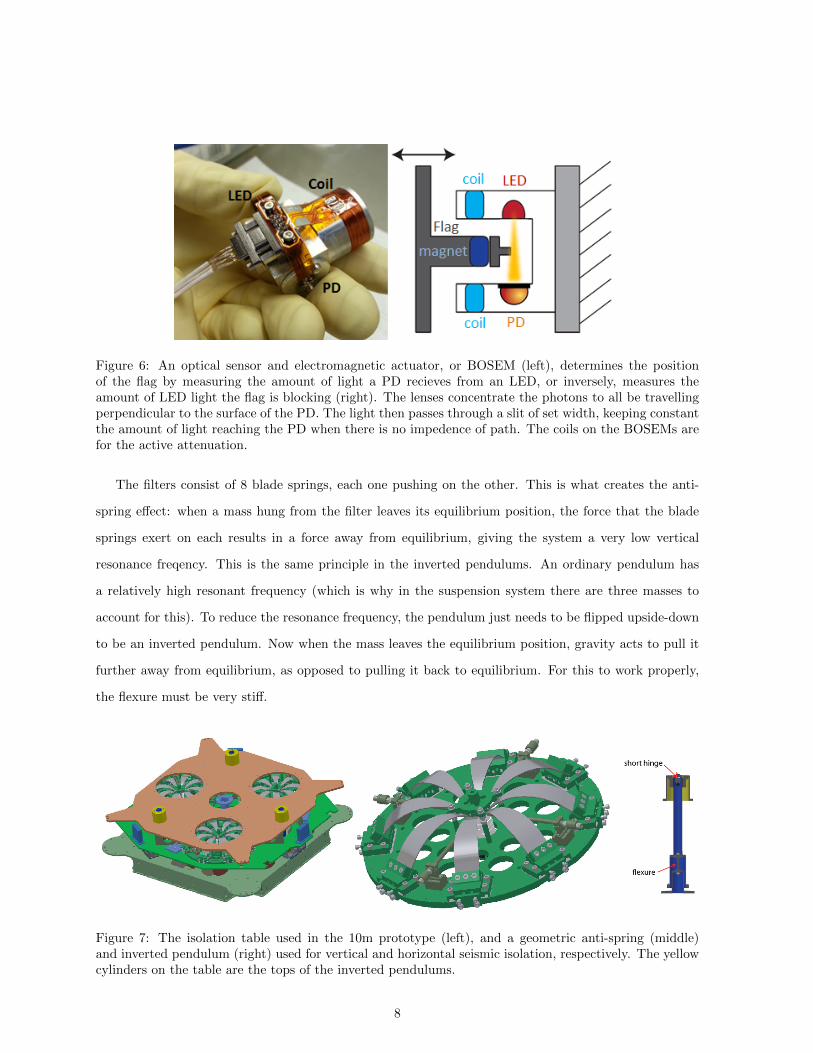
Figure 6: An optical sensor and electromagnetic actuator, or BOSEM (left), determines the positionof the flag by measuring the amount of light a PD recieves from an LED, or inversely, measures theamount of LED light the flag is blocking (right). The lenses concentrate the photons to all be travellingperpendicular to the surface of the PD. The light then passes through a slit of set width, keeping constantthe amount of light reaching the PD when there is no impedence of path. The coils on the BOSEMs arefor the active attenuation.
The filters consist of 8 blade springs, each one pushing on the other. This is what creates the anti-
spring effect: when a mass hung from the filter leaves its equilibrium position, the force that the blade
springs exert on each results in a force away from equilibrium, giving the system a very low vertical
resonance freqency. This is the same principle in the inverted pendulums. An ordinary pendulum has
a relatively high resonant frequency (which is why in the suspension system there are three masses to
account for this). To reduce the resonance frequency, the pendulum just needs to be flipped upside-down
to be an inverted pendulum. Now when the mass leaves the equilibrium position, gravity acts to pull it
further away from equilibrium, as opposed to pulling it back to equilibrium. For this to work properly,
the flexure must be very stiff.
Figure 7: The isolation table used in the 10m prototype (left), and a geometric anti-spring (middle)and inverted pendulum (right) used for vertical and horizontal seismic isolation, respectively. The yellowcylinders on the table are the tops of the inverted pendulums.
8
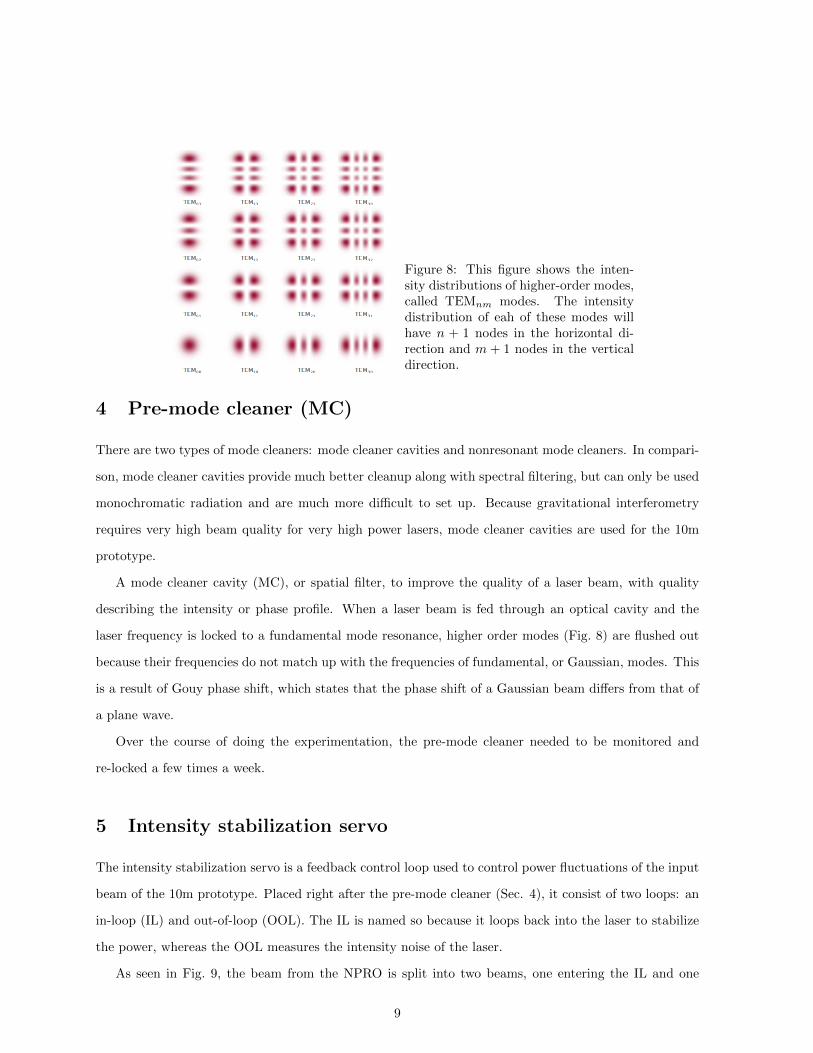
Figure 8: This figure shows the inten-sity distributions of higher-order modes,called TEMnm modes. The intensitydistribution of eah of these modes willhave n + 1 nodes in the horizontal di-rection and m + 1 nodes in the verticaldirection.
4 Pre-mode cleaner (MC)
There are two types of mode cleaners: mode cleaner cavities and nonresonant mode cleaners. In compari-
son, mode cleaner cavities provide much better cleanup along with spectral filtering, but can only be used
monochromatic radiation and are much more difficult to set up. Because gravitational interferometry
requires very high beam quality for very high power lasers, mode cleaner cavities are used for the 10m
prototype.
A mode cleaner cavity (MC), or spatial filter, to improve the quality of a laser beam, with quality
describing the intensity or phase profile. When a laser beam is fed through an optical cavity and the
laser frequency is locked to a fundamental mode resonance, higher order modes (Fig. 8) are flushed out
because their frequencies do not match up with the frequencies of fundamental, or Gaussian, modes. This
is a result of Gouy phase shift, which states that the phase shift of a Gaussian beam differs from that of
a plane wave.
Over the course of doing the experimentation, the pre-mode cleaner needed to be monitored and
re-locked a few times a week.
5 Intensity stabilization servo
The intensity stabilization servo is a feedback control loop used to control power fluctuations of the input
beam of the 10m prototype. Placed right after the pre-mode cleaner (Sec. 4), it consist of two loops: an
in-loop (IL) and out-of-loop (OOL). The IL is named so because it loops back into the laser to stabilize
the power, whereas the OOL measures the intensity noise of the laser.
As seen in Fig. 9, the beam from the NPRO is split into two beams, one entering the IL and one
9
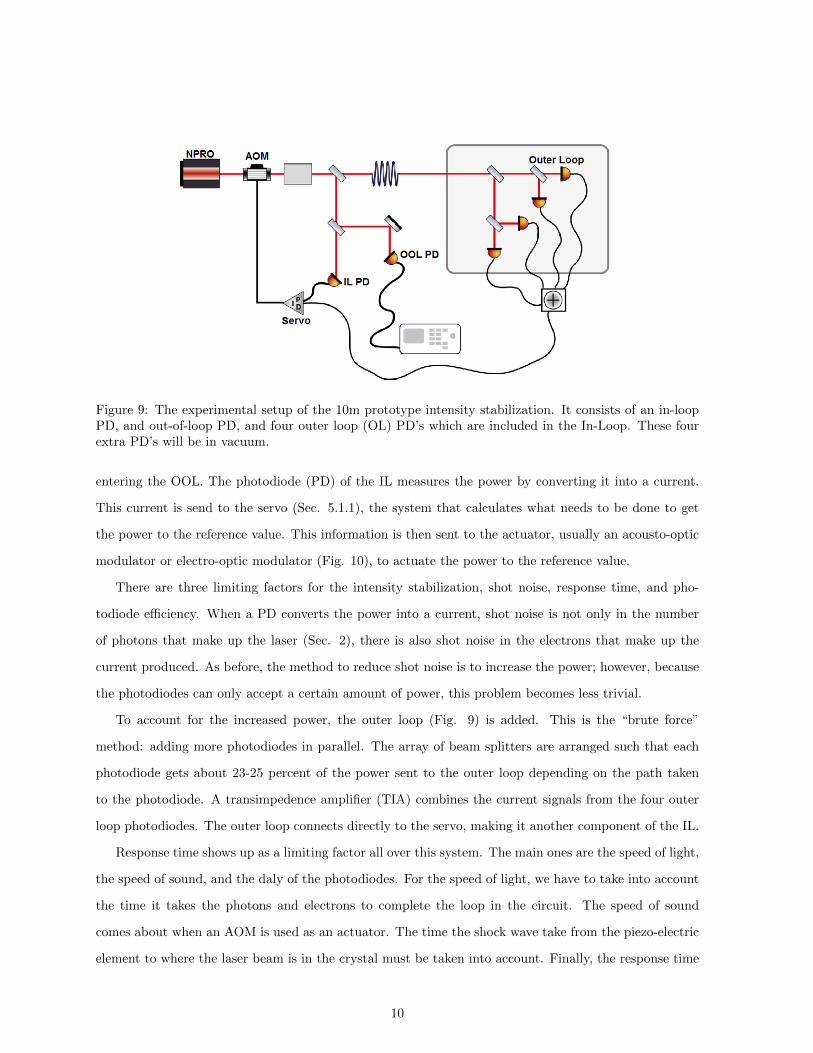
Figure 9: The experimental setup of the 10m prototype intensity stabilization. It consists of an in-loopPD, and out-of-loop PD, and four outer loop (OL) PD’s which are included in the In-Loop. These fourextra PD’s will be in vacuum.
entering the OOL. The photodiode (PD) of the IL measures the power by converting it into a current.
This current is send to the servo (Sec. 5.1.1), the system that calculates what needs to be done to get
the power to the reference value. This information is then sent to the actuator, usually an acousto-optic
modulator or electro-optic modulator (Fig. 10), to actuate the power to the reference value.
There are three limiting factors for the intensity stabilization, shot noise, response time, and pho-
todiode efficiency. When a PD converts the power into a current, shot noise is not only in the number
of photons that make up the laser (Sec. 2), there is also shot noise in the electrons that make up the
current produced. As before, the method to reduce shot noise is to increase the power; however, because
the photodiodes can only accept a certain amount of power, this problem becomes less trivial.
To account for the increased power, the outer loop (Fig. 9) is added. This is the “brute force”
method: adding more photodiodes in parallel. The array of beam splitters are arranged such that each
photodiode gets about 23-25 percent of the power sent to the outer loop depending on the path taken
to the photodiode. A transimpedence amplifier (TIA) combines the current signals from the four outer
loop photodiodes. The outer loop connects directly to the servo, making it another component of the IL.
Response time shows up as a limiting factor all over this system. The main ones are the speed of light,
the speed of sound, and the daly of the photodiodes. For the speed of light, we have to take into account
the time it takes the photons and electrons to complete the loop in the circuit. The speed of sound
comes about when an AOM is used as an actuator. The time the shock wave take from the piezo-electric
element to where the laser beam is in the crystal must be taken into account. Finally, the response time
10

Figure 10: Left: an acousto-optic modulator (AOM) consists of a piezo-electric element, a crystal, and anacoustic absorber. When an electric field is applied to the piezo-electric element, causing it to compressand expand, sound waves through the crystal and changes in the crystal’s refractive index. These changesin refractive index cause the light to refract at various angles, decreasing the intensity of the final beam.Right: an electro-optic modulator (EOM) is used to modulate a specific characteristic of a beam of lightusing the electro-optic effect and generally consists of a crystal surrounded by a parallel plate capacitor forthe electric field. Like the AOM, the change in refractive index of the material can be used to modulatethe phase, frequency, amplitude, or polarization of the beam.
of the photodiodes depends on the surface area of the photodiodes, smaller photodiodes having shorter
response times. Therefore, photodiodes are made to be as small as possible while still practical, so the
intensity stabilization photodiodes are generally about 1 mm2.
The last main limiting factor is the efficiency of the photodiodes. This includes both the electronics
used to convert the power received into a current and the path and method used to absorb the laser beam.
The electronics are mostly set, but the beam path to the photodiode is a key factor in improving photo-
diode efficiency. Each photodiode also comes with a glass window, which is removed to reduce scattering.
The light absorbed by the glass filters of the phtotodiodes is incident at Brewster’s angle (section ??)
to further reduce backscattering. Brewster’s angle is the angle at which light of a certain polarizartion
has zero reflection at a dielectric surface. When unpolarized light is incident at the Brewster’s angle, the
reflected light is then completely polarized. Because the beam is polarized, being absorbed by the glass
filters at Brewster’s angle reduces the amount of light that is reflected. There is, however, some current
generated when no light is present, so the total current generated is the sum of this ’dark’ current and
the photocurrent.
I left the institute with and intrensity stabilization servo consisting of one photodiode for each the IL
and OOL. These were connected to the electronics, but were not yet in agreement with the LIGO Control
and Data System (CDS). In the near future, the intensity stabilization will be connected to CDS and the
11
outer loop will be connected and installed inside the vacuum system.
5.1 Control theory
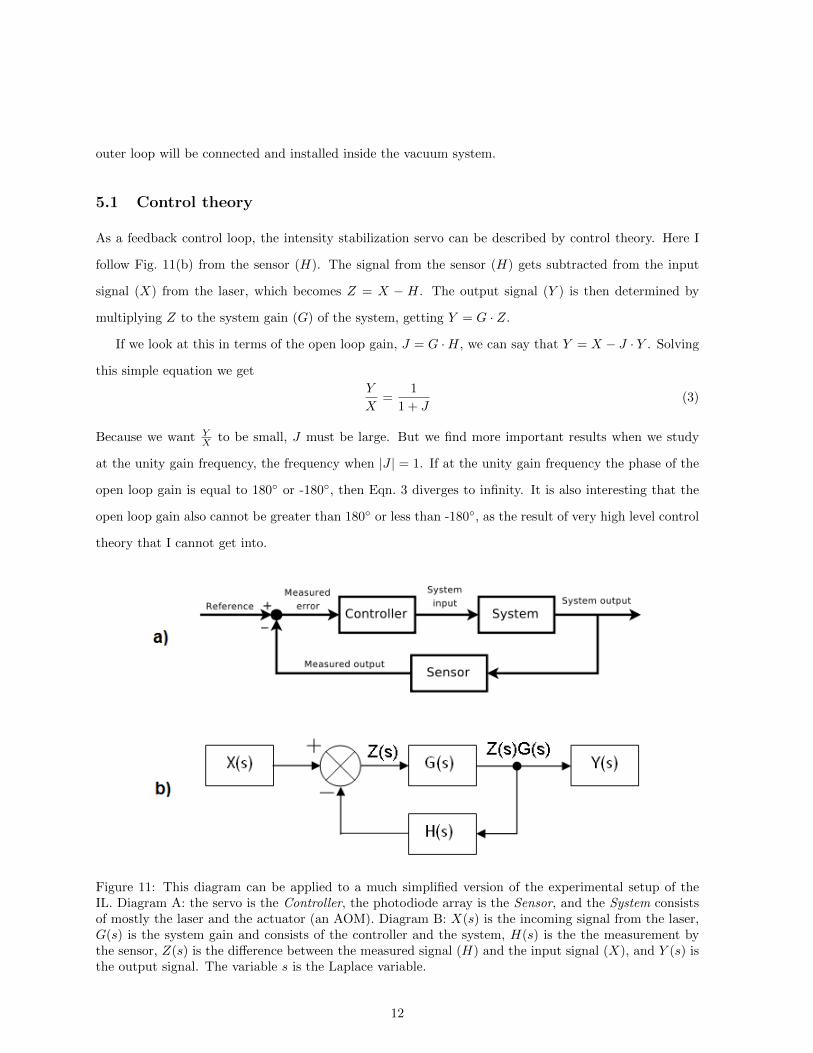
As a feedback control loop, the intensity stabilization servo can be described by control theory. Here I
follow Fig. 11(b) from the sensor (H). The signal from the sensor (H) gets subtracted from the input
signal (X) from the laser, which becomes Z = X − H. The output signal (Y ) is then determined by
multiplying Z to the system gain (G) of the system, getting Y = G · Z.
If we look at this in terms of the open loop gain, J = G ·H, we can say that Y = X − J · Y . Solving
this simple equation we get
Y
X=
1
1 + J(3)
Because we want YX to be small, J must be large. But we find more important results when we study
at the unity gain frequency, the frequency when |J | = 1. If at the unity gain frequency the phase of the
open loop gain is equal to 180◦ or -180◦, then Eqn. 3 diverges to infinity. It is also interesting that the
open loop gain also cannot be greater than 180◦ or less than -180◦, as the result of very high level control
theory that I cannot get into.
Figure 11: This diagram can be applied to a much simplified version of the experimental setup of theIL. Diagram A: the servo is the Controller, the photodiode array is the Sensor, and the System consistsof mostly the laser and the actuator (an AOM). Diagram B: X(s) is the incoming signal from the laser,G(s) is the system gain and consists of the controller and the system, H(s) is the the measurement bythe sensor, Z(s) is the difference between the measured signal (H) and the input signal (X), and Y (s) isthe output signal. The variable s is the Laplace variable.
12
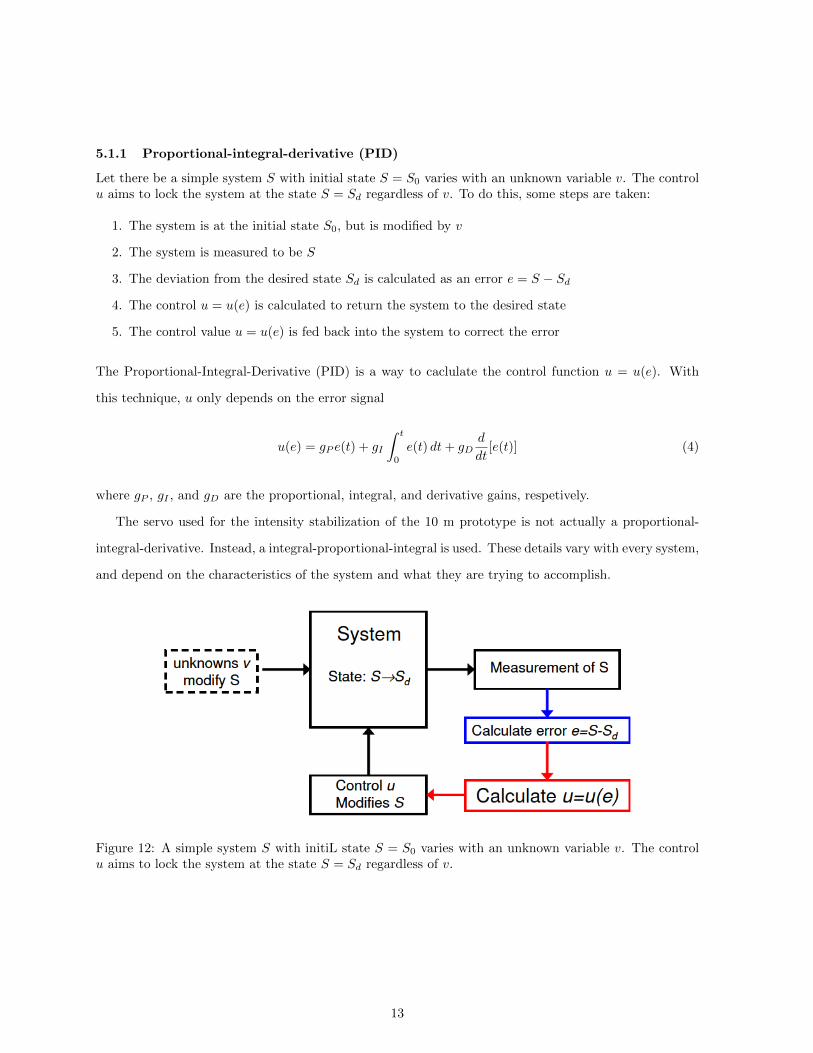
5.1.1 Proportional-integral-derivative (PID)
Let there be a simple system S with initial state S = S0 varies with an unknown variable v. The controlu aims to lock the system at the state S = Sd regardless of v. To do this, some steps are taken:
1. The system is at the initial state S0, but is modified by v
2. The system is measured to be S
3. The deviation from the desired state Sd is calculated as an error e = S − Sd
4. The control u = u(e) is calculated to return the system to the desired state
5. The control value u = u(e) is fed back into the system to correct the error
The Proportional-Integral-Derivative (PID) is a way to caclulate the control function u = u(e). With
this technique, u only depends on the error signal
u(e) = gP e(t) + gI
∫ t
0
e(t) dt+ gDd
dt[e(t)] (4)
where gP , gI , and gD are the proportional, integral, and derivative gains, respetively.
The servo used for the intensity stabilization of the 10 m prototype is not actually a proportional-
integral-derivative. Instead, a integral-proportional-integral is used. These details vary with every system,
and depend on the characteristics of the system and what they are trying to accomplish.
Figure 12: A simple system S with initiL state S = S0 varies with an unknown variable v. The controlu aims to lock the system at the state S = Sd regardless of v.
13
6 Frequency reference cavity
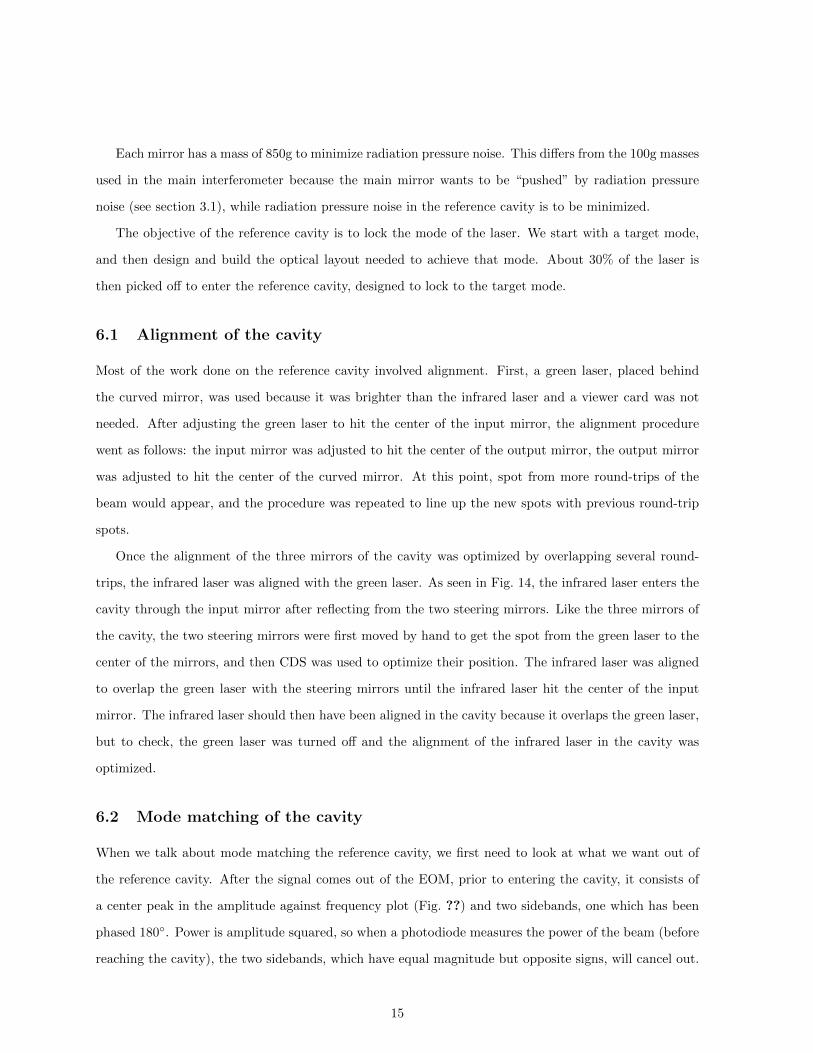
The reference cavity is a suspended triangular optical resonator cavity used for frequency stabilization.
The cavity is configured in such a way that only certain frequencies will resonate in the cavity, i.e. the
cavity should fit a discrete number of wavelengths. It consists of a curved mirror (RC1a) in the south tank
and two planar mirrors (RC2a and RC2b) at about 45◦ in the central tank. For all references to mirror
names, see Fig. 14. The mirror in the south tank is curved because it needs to match the wavefronts, or
lines of equal phase, of the beam (Fig. 15).
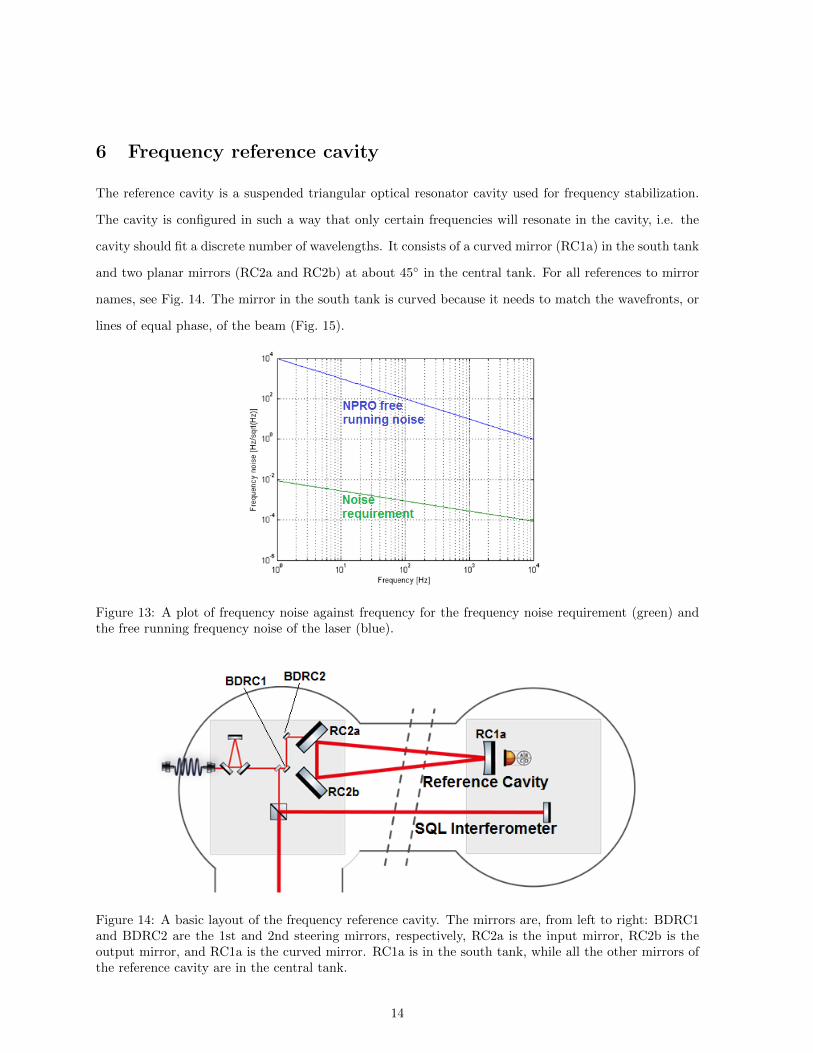
Figure 13: A plot of frequency noise against frequency for the frequency noise requirement (green) andthe free running frequency noise of the laser (blue).
Figure 14: A basic layout of the frequency reference cavity. The mirrors are, from left to right: BDRC1and BDRC2 are the 1st and 2nd steering mirrors, respectively, RC2a is the input mirror, RC2b is theoutput mirror, and RC1a is the curved mirror. RC1a is in the south tank, while all the other mirrors ofthe reference cavity are in the central tank.
14
Each mirror has a mass of 850g to minimize radiation pressure noise. This differs from the 100g masses
used in the main interferometer because the main mirror wants to be “pushed” by radiation pressure
noise (see section 3.1), while radiation pressure noise in the reference cavity is to be minimized.
The objective of the reference cavity is to lock the mode of the laser. We start with a target mode,
and then design and build the optical layout needed to achieve that mode. About 30% of the laser is
then picked off to enter the reference cavity, designed to lock to the target mode.
6.1 Alignment of the cavity
Most of the work done on the reference cavity involved alignment. First, a green laser, placed behind
the curved mirror, was used because it was brighter than the infrared laser and a viewer card was not
needed. After adjusting the green laser to hit the center of the input mirror, the alignment procedure
went as follows: the input mirror was adjusted to hit the center of the output mirror, the output mirror
was adjusted to hit the center of the curved mirror. At this point, spot from more round-trips of the
beam would appear, and the procedure was repeated to line up the new spots with previous round-trip
spots.
Once the alignment of the three mirrors of the cavity was optimized by overlapping several round-
trips, the infrared laser was aligned with the green laser. As seen in Fig. 14, the infrared laser enters the
cavity through the input mirror after reflecting from the two steering mirrors. Like the three mirrors of
the cavity, the two steering mirrors were first moved by hand to get the spot from the green laser to the
center of the mirrors, and then CDS was used to optimize their position. The infrared laser was aligned
to overlap the green laser with the steering mirrors until the infrared laser hit the center of the input
mirror. The infrared laser should then have been aligned in the cavity because it overlaps the green laser,
but to check, the green laser was turned off and the alignment of the infrared laser in the cavity was
optimized.
6.2 Mode matching of the cavity
When we talk about mode matching the reference cavity, we first need to look at what we want out of
the reference cavity. After the signal comes out of the EOM, prior to entering the cavity, it consists of
a center peak in the amplitude against frequency plot (Fig. ??) and two sidebands, one which has been
phased 180◦. Power is amplitude squared, so when a photodiode measures the power of the beam (before
reaching the cavity), the two sidebands, which have equal magnitude but opposite signs, will cancel out.
15

Figure 15: Left: A cross section of the beam intensity. Right: The beam radius of the laser againstposition (solid blue line) and the asymptotes at which it converges to (dotted blue line) as the beampropogates away from the waist. The origin marks where the waist of the beam should be located. Themeasured beam waist was about 2.10 mm and about 3.5 m from the correct position.
This leaves only the main peak, so it is a way of cleaning out the two sidebands.
We measure this by measuring the power of the beam reflected off the input mirror. Becasue the
transfer function of the reference cavity will phase shift the sidebands 180◦ without shifter the phase of
the main peak, the photodiode should read the same as the photodiode measuring the power of the beam
before reaching the cavity.
We get this type of mode matching by making sure the state of the beam at any position within the
cavity is equal to the round trip beams at that same position. We obtain this by making sure of two
things: the beam waist must be directly in between the two planar mirrors and the wavefronts at the
curved mirror must match up exactly with the curvature of the mirror.
The radius of the beam is given by
w(z) = w0
√√√√1 +
(z
zR
)2
(5)
where w0 is the radius at the beam waist and zR is the Rayleigh range. The Rayleigh range is given by
zR =πw2
0
λ(6)
meaning the divergence of the beam depends on the size of the beam waist. This then becomes a simple
calculation of what we want the beam waist to be. We use the equation for the radius of curvature of
16
the wavefronts (R)
R(z) = z
[1 +
(z
zR
)2](7)
with Eq. 6 and the parameter values used were R = 37.8m, the curvature of the mirror, z = 10.6m, the
distance from the beam waist (in between the two planar mirrors) to the curved mirror, and λ = 1064nm
to calculate the beam waist size to be 1.485 mm.
6.3 Mode matching results
To see how well matched we were, a beam scan, shown in Fig. 15, was taken about 3 and 6 meters after
the input mirror. The origin is were the beam waist should be, showing that the beam is about 3.5 m off.
the beam waist meausred was about 2.10 mm, which is about 0.60 mm greater than what it should be.
This is where the group left off with the reference cavity. The next thing to do is to move a converging
lens that is in between the second steering mirror and the input mirrors to get the beam waist to the
correct size and position.
7 Conclusions
This project was very broad and consisted of work on almost all of the subsystems of the 10 m prototype.
Because of this, few definitive results were obtained for any specific topic. I can, however, comment on
the status of the sybsystems that were worked with during the 2 month experimental period.
The third and final isolation table of the seismic attenuation system was being built and tested. The
flexures for the inverted pendulums were beling tested for stiffness, and the geometric anti-springs were
constructed and installed. The intensity stabilization servo was left with a photodiode for each the in-
loop and out-of-loop, both out of vacuum. The process of connecting it to the LIGO Control and Data
System was underway. Finally, the reference cavity was well aligned and relatively well mode matched.
The beam waist was measured to be 2.10 mm, about 0.60 mm greater than the required waist size of
1.485 mm, and the position of the beam waist was about 3.5 m from the required position. Neither of
these values are too deviated, meaning a converging lens placed between the second steering mirror and
the input mirror should solve the issue.
17

Acknowledgements
I would first like to thank the people who got me here, my reasearch advisor at Towson University, Dr.
James Overduin, and my academic advisor, Dr. David Schaefer, for their glowing letters of recommenda-
tion and invaluble support and knowledge that helped me get through my first two years of college, and
will undoubtedly help me throughout the rest of my life. I would like to thank Dr. Bernard F. Whiting,
Dr. Guido Mueller, and Andonis Mitidis for accepting me for this position and providing me with much
of the material needed to be successful in this program. I give immense appreciation to Kristin Nicole for
her hard work in scheduling and taking care of the logistics that I am sure no one could do better. I was
very thankful to have stayed in contact with Dr. Michele Heurs while at the Albert Einstein Institute,
for she was always fun to talk to and she provided amazing support for whatever was needed.
I would especially like to thank the group I worked with in Hannover, who somehow found a way to
make everyday work more fun and enjoyable than travelling Europe. This includes out group leader Dr.
Harald Lueck, our two post-docs Dr. Tobin Fricke and Dr. Conor Mow-Lowry, and the Ph.D students
Manuela Hanke, Gerald Bergmann, Tobias “Fu” Westphal, Vaishali Adya, Sina Koehlenbeck, Patrick
Opperman and countless others. Each one played such a fantastic role in making this summer the best
experience of my life. I could relive this summer this summer countless times, and the only thing I would
change is the amount of time I spend with this mazing group of people.
Finally, I would like to thank the NSF and the University of Florida for the funding and financial
support, and the Max Planck Institute for Gravitational Physics (Albert Einstein Institue) for being an
outstanding host.
References
[1] A. Einstein, Preuss. Akad. Wiss. Berlin 688 (1916)
[2] J. Weber, Phys. Rev. Lett., vol. 20, 1307 (1968)
[3] R.A. Hulse and J.H. Taylor, Astrophys. J. Lett. 195 (1975)
[4] A.A. Michelson, American Journal of Science (1887)
[5] M. Livio, Brilliant Blunders: from Darwin to Einstein (Simon & Schuster, 2013)
[6] K. Somiya et al. 2009, Conceptual design of an interferometer with a sub-SQL sensitivity, ver. 2.0
(LIGO Document Control Center, T0900069)
18
[7] P. Kwee, B. Willke, & K. Danzmann 2009, Shot-noise-limited laser power stabilization with a high-
power photodiode array (Optics Letters, Vol. 34, No. 19)
19