Commissioning for PV Performance - sunspec.org · Commissioning for PV Performance Best Practice...
74
Commissioning for PV Performance Best Practice Guide 1 www.sunspec.org Document #: D42039-1 Status: Draft Version 1 Commissioning for PV Performance SunSpec Alliance Best Practice Guide Authors: Joseph Cunningham, Paul Hernday, James Mokri Program Manager: TJ Keating Please send comments to [email protected] Abstract This best practice guide is PV System Commissioning or re-Commissioning Guide Supplement to characterize and maximize PV system performance. If a PV system is commissioned using industry standards, then it should produce as much energy as was expected, right? No, PV industry commissioning standards do not call for performance testing. This Commissioning Guide outlines methods to use during commissioning to characterize and maximize PV system performance.
Transcript of Commissioning for PV Performance - sunspec.org · Commissioning for PV Performance Best Practice...
Commissioning for PV Performance
Best Practice Guide 1 www.sunspec.org
Document #: D42039-1
Status: Draft
Version 1
Commissioning for PV Performance
SunSpec Alliance Best Practice Guide
Authors:
Joseph Cunningham, Paul Hernday, James Mokri
Program Manager: TJ Keating
Please send comments to [email protected]
Abstract
This best practice guide is PV System Commissioning or re-Commissioning Guide Supplement to characterize and maximize PV system performance.
If a PV system is commissioned using industry standards, then it should produce as much energy as was expected, right? No, PV industry commissioning standards do not call for performance testing. This Commissioning Guide outlines methods to use during commissioning to characterize and maximize PV system performance.
Commissioning for PV Performance
Best Practice Guide 2 www.sunspec.org
Copyright © SunSpec Alliance 2009-2014. All Rights Reserved.
All other copyrights and trademarks are the property of their respective owners.
License Agreement and Copyright Notice
This document and the information contained herein is provided on an "AS IS" basis and the SunSpec Alliance DISCLAIMS ALL WARRANTIES, EXPRESS OR IMPLIED, INCLUDING BUT NOT LIMITED TO ANY WARRANTY THAT THE USE OF THE INFORMATION HEREIN WILL NOT INFRINGE ANY OWNERSHIP RIGHTS OR ANY IMPLIED WARRANTIES OF MERCHANTABILITY OR FITNESS FOR A PARTICULAR PURPOSE.
This document may be used, copied, and furnished to others, without restrictions of any kind, provided that this document itself may not be modified in anyway, except as needed by the SunSpec Technical Committee and as governed by the SunSpec IPR Policy. The complete policy of the SunSpec Alliance can be found at www.sunspec.org
Prepared by the SunSpec Alliance
4030 Moorpark Avenue, Suite 109
San Jose, CA 95117
Website: www.sunspec.org
Email: [email protected]
Commissioning for PV Performance
Best Practice Guide 3 www.sunspec.org
Revision History
Revision Date Reason
Draft 1 10-20-2014 First draft

Commissioning for PV Performance
Best Practice Guide 4 www.sunspec.org
About the SunSpec Alliance The SunSpec Alliance is a trade alliance of developers, manufacturers, operators and service
providers, together pursuing open information standards for the distributed energy industry.
SunSpec standards address most operational aspects of PV, storage and other distributed energy
power plants on the smart grid—including residential, commercial, and utility-scale systems—
thus reducing cost, promoting innovation, and accelerating industry growth.
Over 70 organizations are members of the SunSpec Alliance, including global leaders from Asia,
Europe, and North America. Membership is open to corporations, non-profits, and individuals.
For more information about the SunSpec Alliance, or to download SunSpec specifications at no
charge, please visit www.sunspec.org.
About the SunSpec Specification Process SunSpec Alliance specifications are initiated by SunSpec members desiring to establish an
industry standard for mutual benefit. Any SunSpec member can propose a technical work item.
Given sufficient interest and time to participate, and barring any significant objections, a
workgroup is formed and its charter is approved by the board of directors. The workgroup meets
regularly to advance the agenda of the team.
The output of the workgroup is generally in the form of an Interoperability Specification. These
documents are considered to be normative, meaning that there is a matter of conformance
required to support interoperability. The revision and associated process of managing these
documents is tightly controlled. Other documents, including this document, are informative, or
make some recommendation with regard to best practices, but are not a matter of conformance.
Informative documents can be revised more freely and frequently to improve the quality and
quantity of information provided.
SunSpec Interoperability Specifications follow this lifecycle pattern of -DRAFT, TEST,
APPROVED and SUPERSEDED.
For more information or to download a SunSpec Alliance specification, go to
http://www.sunspec.org/specifications.
Acknowledgements We would like to thank the following contributors:
Reid Rutherford, Eric Alderman, John Nunneley, Garen Grigoryan, Laks Sampath, Geoffrey
Klise, Tom Tansy, Tim Keating, Sarah Kurtz, Scott Jezwinski, Jay Johnson, Jack Flicker,
Christopher Flueckiger, Jeff Jowett, Gary Orlove, Gary Handelin, J.V. Muñoz, Harley Denio, Sai
Ravi Vasista Tatapudi, Dave Bell, Willard MacDonald
Commissioning for PV Performance
Best Practice Guide 5 www.sunspec.org
Table of Contents
Table of Figures............................................................................................................. 8
Tables ............................................................................................................................. 8
Images ............................................................................................................................ 9
Nomenclature .............................................................................................................. 10
1. INTRODUCTION .................................................................................................... 11
2. PV SYSTEM AC PERFORMANCE EVALUATION ................................................ 14 2.1 Overview .....................................................................................................................14 2.2 Performance Evaluation Methods Overview ............................................................15
Capacity Test ....................................................................................................................16 2.3 System Definition and Risk Allocation of Performance Factors .............................29 2.4 Duration of the Commissioning Performance Evaluation .......................................29 2.5 Commissioning Performance Evaluation Metrics PPI and EPI ...............................29 2.6 Measurement and Inspection Data Needed As Input to the Performance Model ..30 2.7 Analyzing the Input Data and Uncertainties .............................................................31 2.8 Reporting Performance Results ................................................................................32 2.9 Method Details ............................................................................................................33 2.10 References ................................................................................................................33
3. ARRAY PERFORMANCE ...................................................................................... 33 3.1 Introduction ................................................................................................................33 3.2 Review of I-V Curve Tracing ......................................................................................33 3.3 Environmental Conditions .........................................................................................35 3.4 Test Equipment ..........................................................................................................36
Electrical measurements ...................................................................................................36 Irradiance and temperature measurement .........................................................................37
3.5 Measurement process................................................................................................37 Measuring string I-V curves at the combiner box ...............................................................37 Deploying the irradiance sensor ........................................................................................38 Deploying the temperature sensor .....................................................................................39
3.6 Planning Your Tests ...................................................................................................39 Coverage ..........................................................................................................................39 Granularity.........................................................................................................................39 Harnessed strings .............................................................................................................40 Estimating the time required for testing the array ..............................................................40
3.7 Safety ..........................................................................................................................40 3.8 Analyzing and Reporting Your Array Performance Data .........................................41
Reported performance parameters ....................................................................................41 Comparing measured and predicted performance .............................................................41
3.9 Test Equipment Considerations ................................................................................43 I-V curve tracer ..................................................................................................................43 Irradiance sensor...............................................................................................................44 Temperature sensor ..........................................................................................................45
3.10 References ................................................................................................................46 3.11 .......................................................................................................................................46
4. INSULATION RESISTANCE .................................................................................. 46 4.1 Introduction ................................................................................................................46
Commissioning for PV Performance
Best Practice Guide 6 www.sunspec.org
4.2 About Insulation Resistance Measurement ..............................................................48 How a meg tester works ....................................................................................................48 Which current is which?.....................................................................................................48 Effects of environmental conditions ...................................................................................49 Test configurations for PV strings ......................................................................................49 Test voltage level ..............................................................................................................50 Granularity.........................................................................................................................50
4.3 Safety ..........................................................................................................................51 4.4 Making Insulation Resistance Measurements ..........................................................51
Preparing to test insulation resistance ...............................................................................51 Required equipment and materials ....................................................................................52 Basic test procedure ..........................................................................................................52 Overview of procedures for meg testing the PV array ........................................................52 Procedure #1 - Individual strings, single-ended configuration, grounded system ...............53 Procedure #2 – Individual strings, short-circuit configuration, grounded system ................53 Procedure #3 - Individual strings, single-ended configuration, ungrounded system ...........54 Procedure #4 – Individual strings, short-circuit configuration, ungrounded system ............54 Procedure #5 – Multiple strings, single-ended configuration, grounded system .................55 Procedure #6 – Multiple strings, single-ended configuration, ungrounded system .............55 Procedures for meg testing PV source circuit conductors (without PV modules) ...............56 Procedure for meg testing dc feeder (combiner output) conductors ...................................57 Meg testing inverter output conductors ..............................................................................57
4.5 Analyzing and Reporting Meg Test Data ..................................................................57 Absolute test limits ............................................................................................................57 Relative test limits .............................................................................................................58 Reporting your results .......................................................................................................58
4.6 Test Equipment Considerations ................................................................................59 4.7 References ..................................................................................................................59 4.8 Contributors ...............................................................................................................59
5. INFRARED IMAGING ............................................................................................ 60 5.1 Introduction ................................................................................................................60 5.2 How Infrared Imaging Works .....................................................................................60 5.3 Measurement Conditions ...........................................................................................61 5.4 Measurement Technique ...........................................................................................61
Emissivity ..........................................................................................................................61 Thermal reflections ............................................................................................................61 Thermal diffusion ...............................................................................................................62 Setting the temperature span ............................................................................................62 Measuring PV module temperature ...................................................................................62 Setting limits for acceptable temperature ...........................................................................63
5.5 Procedure ...................................................................................................................63 Safety ................................................................................................................................63 Operating conditions .........................................................................................................63 Infrared camera settings ....................................................................................................63 Positioning and focusing the camera .................................................................................64 Imaging the array ..............................................................................................................64 Imaging other system components ....................................................................................64
5.6 Reporting Infrared Imaging Results ..........................................................................64 5.7 Infrared Imaging Examples ........................................................................................65 5.8 Test Equipment Considerations ................................................................................68
Commissioning for PV Performance
Best Practice Guide 7 www.sunspec.org
Sensitivity ..........................................................................................................................68 Auto-spanning ...................................................................................................................68 Manual temperature span adjustment ...............................................................................68 Manual focus .....................................................................................................................68 Field of view ......................................................................................................................68 Image resolution ................................................................................................................68 Visual image capture .........................................................................................................68 Image enhancement ..........................................................................................................69 Light shield ........................................................................................................................69 Storage .............................................................................................................................69 Annotation .........................................................................................................................69 Data analysis software ......................................................................................................69
5.9 References ..................................................................................................................69 5.10 Contributors .............................................................................................................69
6. SOLAR ACCESS (draft) ........................................................................................ 70 6.1 Introduction ................................................................................................................70 6.2 Shade Measurement Concepts and Terminology ....................................................70 6.3 Measurement Conditions ...........................................................................................72 6.4 Measurement Process ...............................................................................................72
Choosing measurement locations .....................................................................................72 6.5 Data analysis ..............................................................................................................72 6.6 Reporting Shade Analysis Results ...........................................................................72 6.7 Test Equipment Considerations ................................................................................73 6.8 References ..................................................................................................................74 6.9 Contributors ...............................................................................................................74
Commissioning for PV Performance
Best Practice Guide 8 www.sunspec.org
Table of Figures
Figure 1: Performance Test Analysis and Test Sequence ............................................ 16
Figure 2: Flow Chart - INITIAL COMMISSIONING – CAPACITY TEST OF POWER – POWER PERFORMANCE INDEX (PPI) ................................................................ 19
Figure 3: Flow Chart - SECONDARY COMMISSIONING – ENERGY TEST – ENERGY PERFORMANCE INDEX (EPI) .............................................................................. 23
Figure 4: Energy kWh vs Energy Performance Index; Predicted and Actual Energy kWh and PR ................................................................................................................... 26
Figure 5: Solar Plant Life Cycle ..................................................................................... 27
Figure 6: Life sequence of a PV system ........................................................................ 27
Figure 7: Seasonal Variation of PR ............................................................................... 30
Figure 8: Typical I-V and PV curves .............................................................................. 34
Figure 9: Definition of the fill factor, a performance metric that represents the square-ness of the I-V curve and expresses the PV source’s ability to generate power in relation to Isc and Voc. ........................................................................................... 35
Figure 10: Electrical configuration for I-V curve measurements of PV source circuits at a combiner box.......................................................................................................... 38
Figure 11: When the measured I-V curve deviates from normal curve shape, the type of deviation provides insight into possible causes ...................................................... 42
Figure 12: Equivalent irradiance measurement error caused by a time delay between measurements of the irradiance and the I-V curve, under irradiance ramping conditions ............................................................................................................... 45
Figure 13: Voltage profile along the string of PV modules for single-ended and double-ended application of the test voltage. ..................................................................... 49
Figure 14: Distributions of insulation resistance measurement data for populations of PV source circuits. ....................................................................................................... 58
Figure 15: Variation of the emissivity and reflectance of glass as a function of angle of incidence. Zero degrees corresponds to a perpendicular camera angle (Courtesy FLIR) ...................................................................................................................... 62
Figure 16: Example of a solar access measurement with annual, seasonal, and monthly results. Courtesy Solmetric. ................................................................................... 70
Commissioning for PV Performance
Best Practice Guide 9 www.sunspec.org
Tables
Table 1: Secondary Commissioning – Calculation of EPI ............................................. 28
Table 2: Measurements and inspections needed for performance evaluation .............. 31
Table 3: Test equipment required to measure PV source circuit performance parameters ............................................................................................................. 36
Table 4: Key to the PV array measurement procedures discussed below. ................... 53
Infrared Images
Image 1: Poor connection between module cable and ribbon conductor. Courtesy Harmony Farm Supply. .......................................................................................... 65
Image 2: Resistive interconnection in early generation dc combiner PC board. Courtesy Solmetric. ............................................................................................................... 65
Image 3: Hot spot and conducting bypass diode. .......................................................... 65
Image 4: Bypassed cell group (middle) showing warmer cells and heated j-box. Courtesy Solmetric. ................................................................................................ 65
Image 5: Bypassed cells (outer two groups) imaged from backside. Courtesy FLIR. .. 65
Image 6: Hot spot on PV module. Courtesy J.V. Muñoz et al, Universidad de Jaén ..... 65
Image 7: Hot spots at cell ribbon bonds. Courtesy Arizona State University ................. 66
Image 8: Open circuited strings and modules in 860kW rooftop array. Courtesy Oregon Infrared. ................................................................................................................. 66
Image 9: IR and visual images of resistive electrical connectors between two PV modules. Courtesy J.V. Muñoz et al, Universidad de Jaén. ................................... 66
Image 10: IR and visual images of hot spot on a cell resulting from shading. Courtesy J.V. Muñoz et al, Universidad de Jaén. .................................................................. 66
Image 11: Hot cell viewed from module backside. The cooler circular area in the center of the cell is caused by a bubble in the module backsheet. Courtesy J.V. Muñoz et al, Universidad de Jaén. ......................................................................................... 67
Image 12: Hot cell ......................................................................................................... 67
Commissioning for PV Performance
Best Practice Guide 10 www.sunspec.org
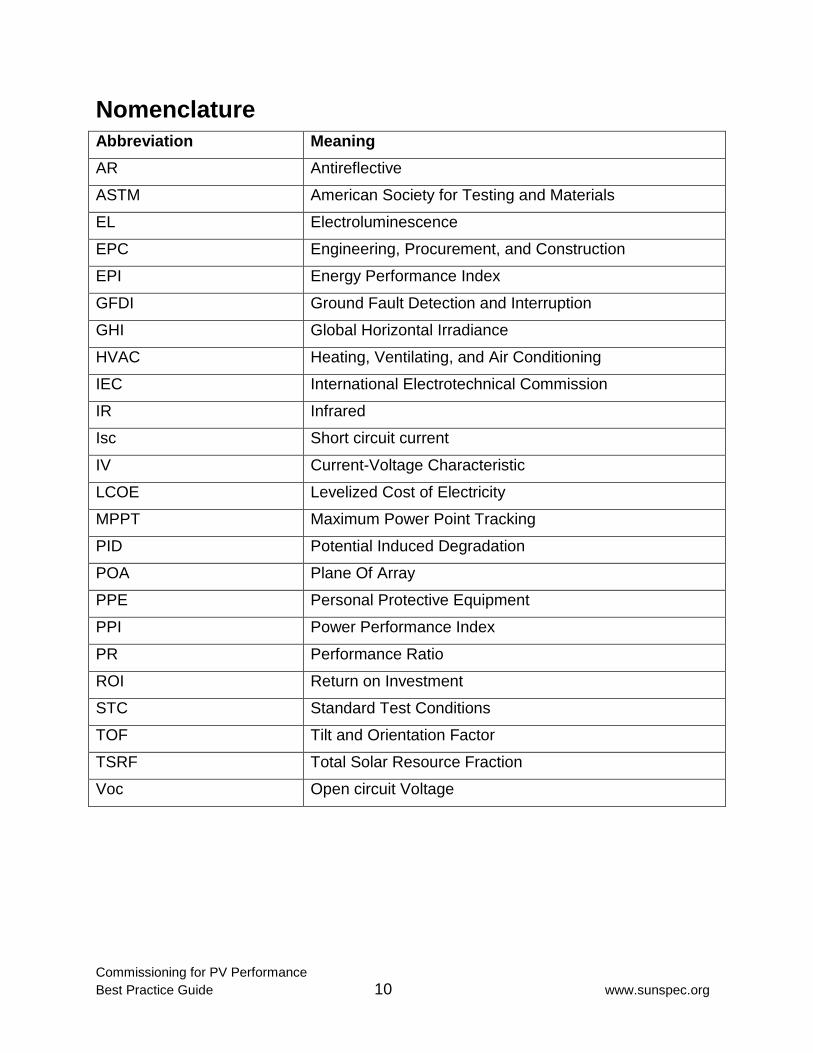
Nomenclature
Abbreviation Meaning
AR Antireflective
ASTM American Society for Testing and Materials
EL Electroluminescence
EPC Engineering, Procurement, and Construction
EPI Energy Performance Index
GFDI Ground Fault Detection and Interruption
GHI Global Horizontal Irradiance
HVAC Heating, Ventilating, and Air Conditioning
IEC International Electrotechnical Commission
IR Infrared
Isc Short circuit current
IV Current-Voltage Characteristic
LCOE Levelized Cost of Electricity
MPPT Maximum Power Point Tracking
PID Potential Induced Degradation
POA Plane Of Array
PPE Personal Protective Equipment
PPI Power Performance Index
PR Performance Ratio
ROI Return on Investment
STC Standard Test Conditions
TOF Tilt and Orientation Factor
TSRF Total Solar Resource Fraction
Voc Open circuit Voltage
Commissioning for PV Performance
Best Practice Guide 11 www.sunspec.org
1. INTRODUCTION Commissioning is the process of assuring that a PV plant is safe, meets design objectives, and
functions and produces energy in accordance with the owner’s expectations. If a PV system is
commissioned according to industry standards, then it must be performing as expected, right?
Not necessarily. PV industry standards for commissioning do not include performance testing.
The National Electric Code and the IEC commissioning standard (IEC62446) mention nothing
about performance testing. ASTM E2848-11 outlines a method of performance measurement
during the commissioning stage, but it is not a complete, consistent, standardized method of
measurement and metrics.
Why is performance measurement an important component of the commissioning process? Ask
any system owner, financial partner or O&M provider what the key metrics are for any system.
They all include actual kWh production versus expectations. Reid Rutherford, CEO of Photon
Energy Services of Mountain View CA states, “I want the commissioning report to give me a
prediction of the energy production from the system based on inspection and measurements done
after it has been built and before final acceptance of the system, to validate our investment.”
Simply put, anyone with a financial interest in a PV project wants to know, “Am I getting the PV
energy production at the time of commissioning that was promised when I made my investment
decision?” prior to acceptance of the system.
According to Business Dictionary.com, commissioning is defined as:
Process by which an equipment, facility, or plant (which is installed, or is complete or near
completion) is tested to verify if it functions according to its design objectives or
specifications.
The electric power industry definitions of commissioning include:
Power Plant Commissioning is the process of assuring that all systems and components of
a power plant are designed, installed, tested, operated, and maintained according to the
operational requirements of the client.
The key words in these definitions are “functions according to design objectives” and “according
to the operational requirements of the client.” Owners, financial institutions, or any guarantor of
system production should not accept a commissioning process which does not include tests to
verify that it functions according to the original design objectives which were used as a basis for
the investment decision. Furthermore, these tests must be standardized and consistent for all the
commissioning of all PV projects.
Since the objectives usually specify levels of power generation and energy production,
commissioning needs to include performance testing. Wide adoption of rigorous performance
testing practices will avoid problems like these:
1. The 75 kW inverter was commissioned by a well-respected inverter manufacturer and all
appeared to be working well. It was later discovered that the MPPT software settings of
the inverter were not configured properly and the kWh production of the system was
about 25% lower than it should have been. The settings were changed remotely in five
minutes and system performance improved by 30%. However, months of valuable kWh
production were lost.
Commissioning for PV Performance
Best Practice Guide 12 www.sunspec.org
2. In another instance, a 30 kW PV system was installed on parking/shade structures in
Phoenix. Commissioning consisted mainly of a final check of the main connections,
turning the inverters on, and waiting to see that all items were working correctly and that
the system was producing power. The power produced at that time appeared to be
adequate. A few months later, the customer complained of lower than expected savings
on his utility bill. A review of the monitoring data confirmed that the kWh production
had dropped significantly - but gradually - within the first few weeks of operation. A field
inspection revealed a reversed ground polarity of some of the strings. The wiring was
redone, correctly, and the system returned to normal power production within days. An
adequate commissioning procedure would have revealed the reversed polarity of the
grounding elements. Even if the polarity issue was missed, a more thorough performance
test during commissioning, including the capture of performance data for more than one
day, would have caught the power reduction within days after the system went online.
The SunSpec Asset Lifecycle Performance Standards Committee received the message from
industry professionals, investors and PV system owners that PV performance and safety
measurements must be included in the commissioning stage of a project. This was confirmed in
a survey performed in December, 2012 and repeated in July, 2013. The industry needs a
consistent, standardized method of measurement, data collection and the metrics used during the
commissioning of a PV project to affirm that the energy output of the system meets or exceeds
expectations.
The SunSpec Alliance has teamed with PV industry professionals to produce a set of guidelines
which addresses PV system performance testing during commissioning. This how-to guide is
intended to be used by industry professionals, EPC’s, PV system owners, financial institutions,
O&M providers and standards setting organizations as the basis for developing a consistent,
standardized method of measurement during commissioning, as well as the metrics used to
record and report commissioning test results. There is further discussion on how to use the
results to help satisfy ones risk assessment, or for future O&M purposes.
This guide addresses the following topics:
1. Chapter 1- Introduction: The business case for performance testing during commissioning
that includes a full year of performance data and a recommendation for a secondary
commissioning process to account for hidden defects that often become manifest after a
“break-in” period of six to 12 months
2. Chapter 2 – System ac Performance Evaluation: Actual performance metrics to be used
and methods of measurement and data collection, including:
a. A Summary of an 18 month study published by the SunSpec Alliance originally
done by San Jose State University and the Performance Committee of SolarTech
now sponsored by the SunSpec Alliance1.
b. Recommendations for performance metrics during the initial commissioning as
well as for a secondary commissioning
1 Solar PV Performance Assessment – Practices, Methods and Guidelines to Assess Performance of Existing
Systems, James Mokri, Professor at San Jose State University and Joseph Cunningham, Director of Operations,
Centrosolar, available on the SunSpec website, www.sunspec.org

Commissioning for PV Performance
Best Practice Guide 13 www.sunspec.org
c. Method of measurement, data collection and metrics reporting and how they may
relate to the need for system corrections during commissioning and maintenance.
d. Life cycle examples to help justify PV performance modeling and future
investments
3. Chapter 3: Array Performance Measurement
a. I-V Curve Tracing and discrete voltage and current measurement methods
b. Relationship to PV system performance verification, correction and measurement
c. Measurement methods
d. Interpreting I-V curves for performance troubleshooting
e. Test equipment selection
4. Chapter 4: Insulation Resistance Measurement
a. Importance of PV system wire insulation for safety and performance
b. Measurement methods for ac and dc circuits
c. Interpretation of insulation test data and application of the results
d. Test equipment selection
5. Chapter 5: Infrared Measurements
a. Relationship between heat and PV performance
b. How Infrared Imaging works
c. Infrared Imaging techniques
d. Interpretation of results
e. Selecting test equipment
6. Chapter 6: Shade Measurement (Solar Access)
a. Shade – the performance killer
b. How to measure potential and actual shade against acceptable tolerances
c. Measurement techniques
d. Results, system design and verification during commissioning and maintenance
e. Selecting test equipment
The purpose of this guide is to recommend standardized, consistent methods of measurement,
data collection and metrics reporting of PV system performance during the commissioning of a
new system, during a secondary commissioning after a “break-in” period, and for re-
commissioning a system for a change of ownership, change of O&M provider, or close to the
end of warranty periods. By employing these guidelines, the authors believe that any financially
interested party will be secure in the knowledge that the risk of revenue generation has been
Commissioning for PV Performance
Best Practice Guide 14 www.sunspec.org
mitigated from the time the system first starts producing income through the generation of
electric power.
This process will also help the key parties verify that the PV system production is meeting
expectations, and it will set a baseline expectation of system production for consideration of
future O&M needs of the system.
The authors further believe that mitigation of revenue risk, aided by these suggested guidelines
of standardized, consistent methods of measurement, data collection and metrics reporting of PV
system performance during the commissioning of a system will help the capital markets accept
PV as an investment with lower risk and aide in moving PV to an acceptable asset class.
This is intended to be a supplementary guide to existing or developing industry standards such as
those developed by ASTM, IEC and others, with an emphasis on PV Production Performance
measurement and verification during commissioning. Over time, these methods will be proposed
as additions to the corresponding standards.
2. PV SYSTEM AC PERFORMANCE EVALUATION
2.1 Overview
This chapter summarizes metrics and methods for acceptance testing of the performance of an
as-built PV system under actual weather conditions during the first year of operation. The
primary purpose of the acceptance evaluation is to determine if the system has the capability of
generating the predicted electrical energy (kWh) over its lifetime. The evaluation compares the
system’s actual measured output with the expected output. Good agreement means the original
PV model predictions for the long-term kWh, ROI, and LCOE are valid. A secondary purpose is
to establish a baseline of performance for use in future evaluations of performance trend to
support O&M decisions.
The terminology used in this guide employs definitions used by organizations such as NREL.
Below are definitions for various states of power and energy that are used throughout this
chapter:
Predicted Power: The power that is predicted to be generated by the PV system based on
historical weather conditions, PV module STC test data and PV system design.
Expected Power: The power expected to be generated by a PV system at any particular time
based on actual weather, irradiation and as-built PV system configuration.
Measured Power: The PV system ac output power that was measured during the test.
Exclusions are discussed below.
Predicted Energy: The energy generation predicted from historical weather data that is
considered to be representative for the site, using a model chosen by the parties to the test.
Expected Energy: The energy generation predicted from the same model but using the weather
data that is collected during the test. Exclusions and details are discussed below.
Commissioning for PV Performance
Best Practice Guide 15 www.sunspec.org
Measured Energy: The energy generation that was measured during the test. Exclusions are
discussed below.
System AC performance evaluation differs from some other commissioning measurements in
that it should include an initial evaluation, plus an evaluation of the first twelve months of
operation. The initial evaluation of power and energy is designed to ensure that the system is
functioning properly. The extended evaluation compares the first full year of system actual
Measured Energy production to the Expected Energy production based on actual weather
conditions during the same year. The longer-term evaluation takes into account the many factors
such as weather, soiling, grid outages, and as-built configuration that differ from the assumptions
used in the original design model.
Two performance metrics are presented in this chapter, one focusing on instantaneous ac power
and the other on ac energy generation. Unlike other metrics commonly used, such as
Performance Ratio (PR) and Yield, these metrics are clearly defined to use actual irradiance,
temperature, wind speed, and as-built system configuration, all of which have an effect on the
performance of the system. These two metrics are:
Power Performance Index (PPI): An evaluation at an instant in time during the initial
commissioning, and defined as the actual Measured Power divided by the Expected Power
Energy Performance Index (EPI): An evaluation based on the first year of performance data, and
defined as the actual Measured Energy divided by the Expected Energy. .
The NEC code, IEC 62446, and jurisdictional authorities define requirements for system safety
and installation completeness and functionality; however they do not address performance
verification of that system output power or energy generation meets expectations. The IEC
62446 functionality tests include measuring PV string polarity, Voc, and Isc. The safety tests
include measuring insulation resistance and grounding integrity. However, the IEC standard does
not call for an evaluation of power or long term energy production over the range of weather
conditions assumed in the original prediction. AC performance evaluation is important because
the Predicted Energy production output is used in the financial model to predict the long-term
financial viability of the project through metrics such as ROI and LCOE. Estimation of
uncertainty in the expected and measured performance is also important to include because
uncertainty directly affects performance risk and project financing. It is well known, that actual
system energy performance metrics are more accurate when performed using data collected for a
full year or more compared to shorter durations. It is recommended that verification take place
after a full year of data has been collected.
2.2 Performance Evaluation Methods Overview
The performance evaluation processes recommended in this Guide are summarized in Figure 1
and discussed in this section.
Commissioning for PV Performance
Best Practice Guide 16 www.sunspec.org
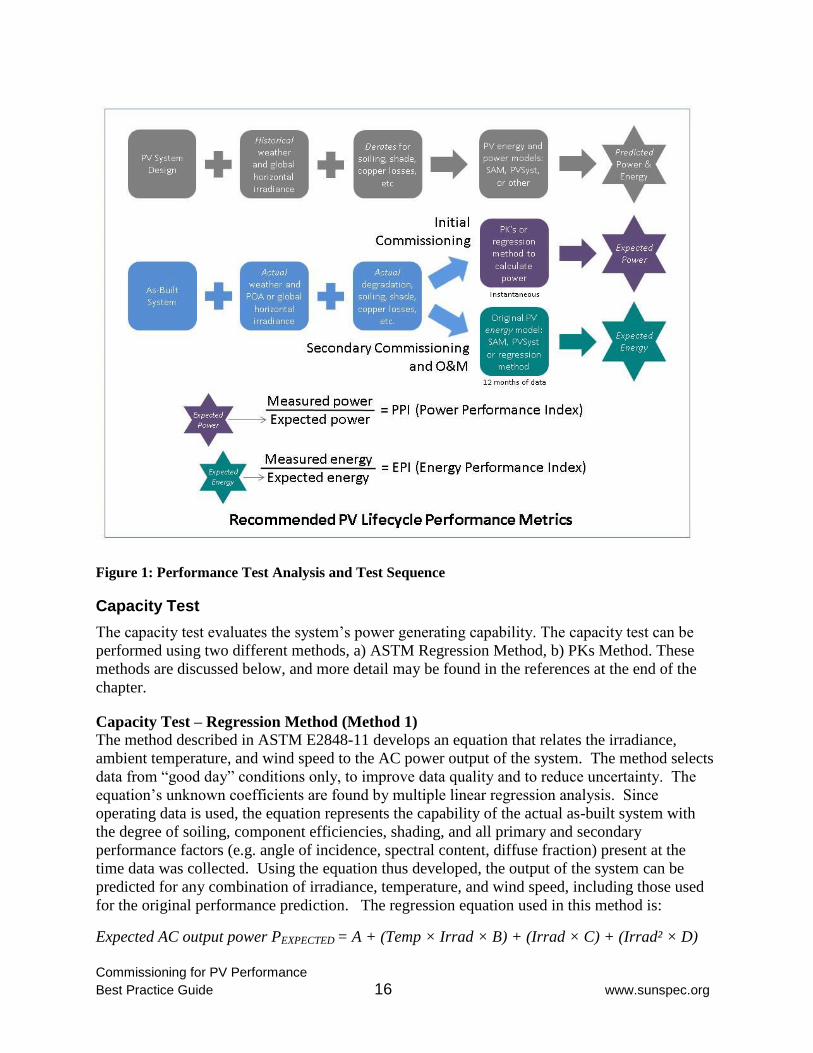
Figure 1: Performance Test Analysis and Test Sequence
Capacity Test
The capacity test evaluates the system’s power generating capability. The capacity test can be
performed using two different methods, a) ASTM Regression Method, b) PKs Method. These
methods are discussed below, and more detail may be found in the references at the end of the
chapter.
Capacity Test – Regression Method (Method 1)
The method described in ASTM E2848-11 develops an equation that relates the irradiance,
ambient temperature, and wind speed to the AC power output of the system. The method selects
data from “good day” conditions only, to improve data quality and to reduce uncertainty. The
equation’s unknown coefficients are found by multiple linear regression analysis. Since
operating data is used, the equation represents the capability of the actual as-built system with
the degree of soiling, component efficiencies, shading, and all primary and secondary
performance factors (e.g. angle of incidence, spectral content, diffuse fraction) present at the
time data was collected. Using the equation thus developed, the output of the system can be
predicted for any combination of irradiance, temperature, and wind speed, including those used
for the original performance prediction. The regression equation used in this method is:
Expected AC output power PEXPECTED = A + (Temp × Irrad × B) + (Irrad × C) + (Irrad² × D)
Commissioning for PV Performance
Best Practice Guide 17 www.sunspec.org
Where A, B, C and D are coefficients calculated by the regression analysis.
In this approach, the regression equation is developed, and then used to calculate the Predicted
Power output of the as-built clean and new system using the same historic weather, PV system
design considerations and PV module data, which were used in the original PV performance
prediction calculation to determine if the original calculation of Predicted Power is validated.
The ratio of Predicted Power calculated using the regression equation thus derived, to the
original model Predicted Power, which we can call PPI, should be used to determine if the
system is performing as expected. A ratio of 1.0 or greater, within a tolerance acceptable to the
owner, is the goal of this step. Before this equation is accepted as a baseline for future
evaluations, caution is advised to make sure the system is operating as it was designed to operate
and that it is producing the amount of power that it was designed to produce, and if it is not, to
correct the system and/or the regression equation before using the regression equation
coefficients for future evaluations.
The following steps may be repeated until an acceptable tolerance is reached.
1. Calculate regression equation coefficients using actual system operating data
2. Use new regression equation and historic weather data from the original system design
model to calculate the Predicted Power
3. Divide the Predicted Power thus derived by the Predicted Power calculated in the original
system design model.
4. A PPI value within an acceptable tolerance of 1.0, or greater, indicates the system is
performing as predicted.
5. A PPI value less than 1.0 (minus the tolerance value) indicates low system performance.
Take corrective action to troubleshoot and fix the system. Conversely, the original model
may have been flawed as far as system design and derates that were used, in which case it
should be corrected.
6. Repeat steps 1 thru 5 above until the PPI-Regression is within an acceptable tolerance of
1.0.
This method is outlined in the flow chart in Figure 2.
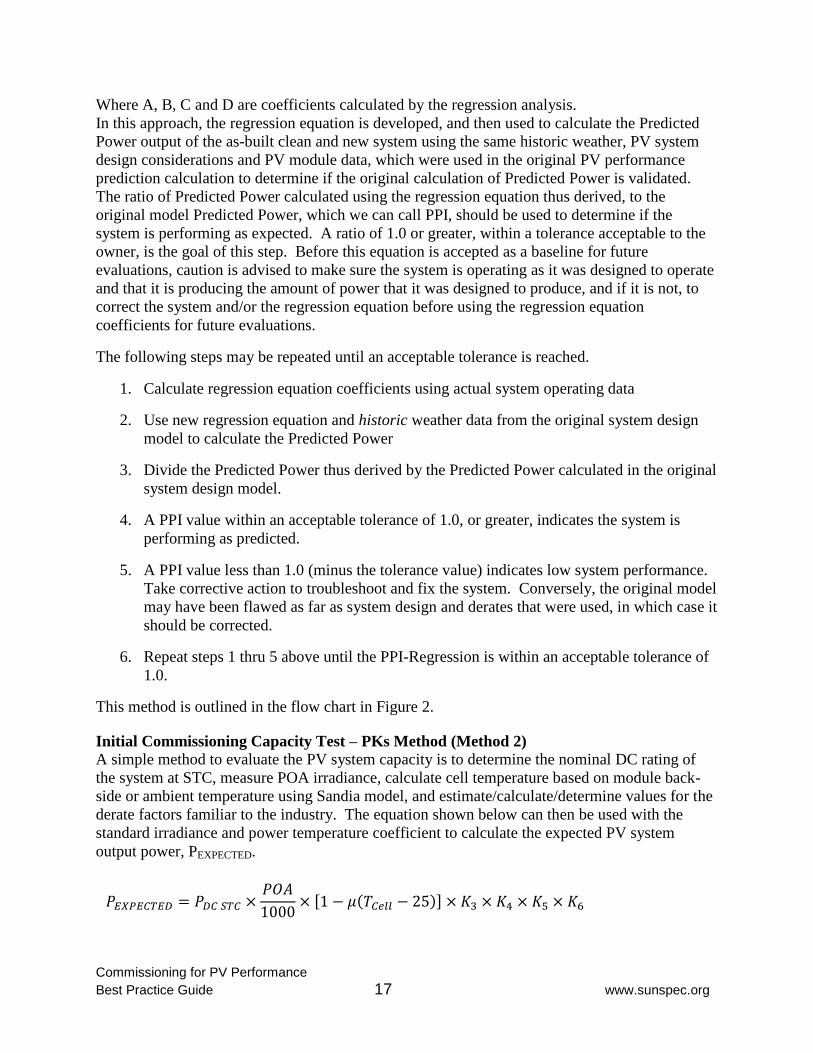
Initial Commissioning Capacity Test – PKs Method (Method 2)
A simple method to evaluate the PV system capacity is to determine the nominal DC rating of
the system at STC, measure POA irradiance, calculate cell temperature based on module back-
side or ambient temperature using Sandia model, and estimate/calculate/determine values for the
derate factors familiar to the industry. The equation shown below can then be used with the
standard irradiance and power temperature coefficient to calculate the expected PV system
output power, PEXPECTED.
𝑃𝐸𝑋𝑃𝐸𝐶𝑇𝐸𝐷 = 𝑃𝐷𝐶 𝑆𝑇𝐶 ×𝑃𝑂𝐴
1000× [1 − 𝜇(𝑇𝐶𝑒𝑙𝑙 − 25)] × 𝐾3 × 𝐾4 × 𝐾5 × 𝐾6
Commissioning for PV Performance
Best Practice Guide 18 www.sunspec.org
This equation has been referred to as the Power Temperature Correction model in Ref 4 by
Marion. Due to the form of the equation, it has also been referred to as the PKs equation.
For the purposes of this evaluation it is recommended that irradiance be 600 W/m2 or greater.
Refer to Figure 2 Flow Chart, Method 2 and calculate PPI.
A PPI of actual power measured versus expected power thus derived, within expected tolerances
of 1.0, validates the performance of the as-built system.
Commissioning for PV Performance
Best Practice Guide 19 www.sunspec.org
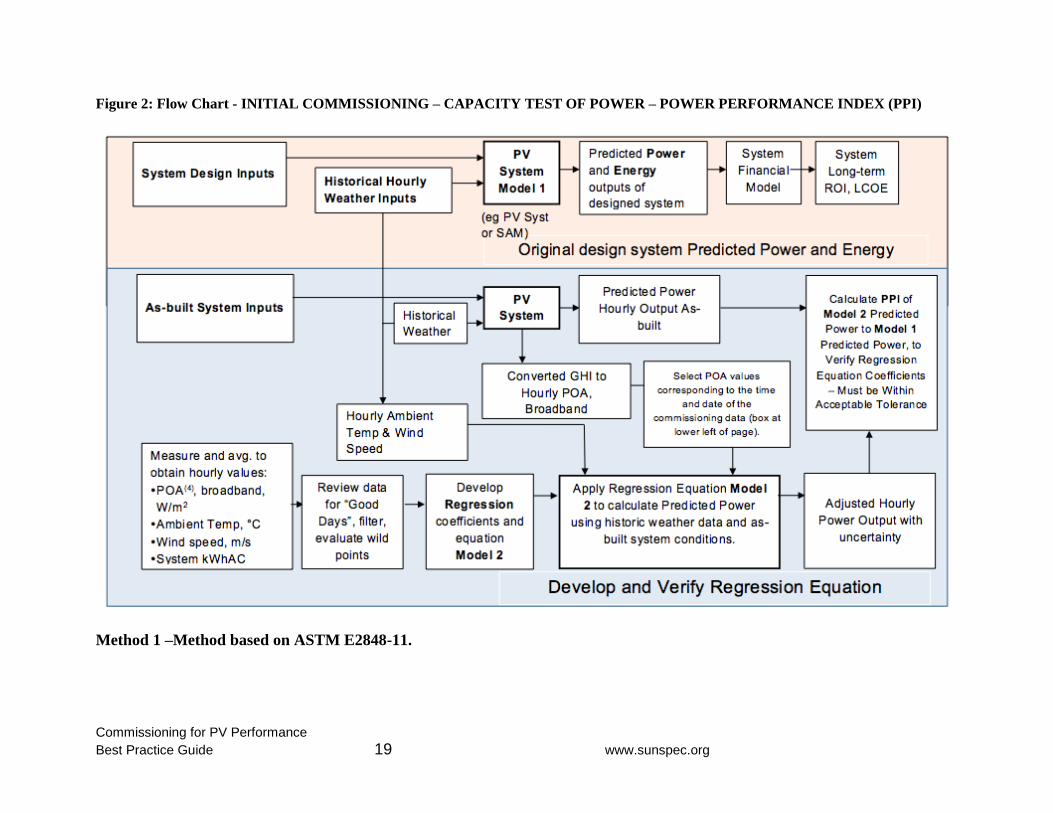
Figure 2: Flow Chart - INITIAL COMMISSIONING – CAPACITY TEST OF POWER – POWER PERFORMANCE INDEX (PPI)
Method 1 –Method based on ASTM E2848-11.
Commissioning for PV Performance
Best Practice Guide 20 www.sunspec.org
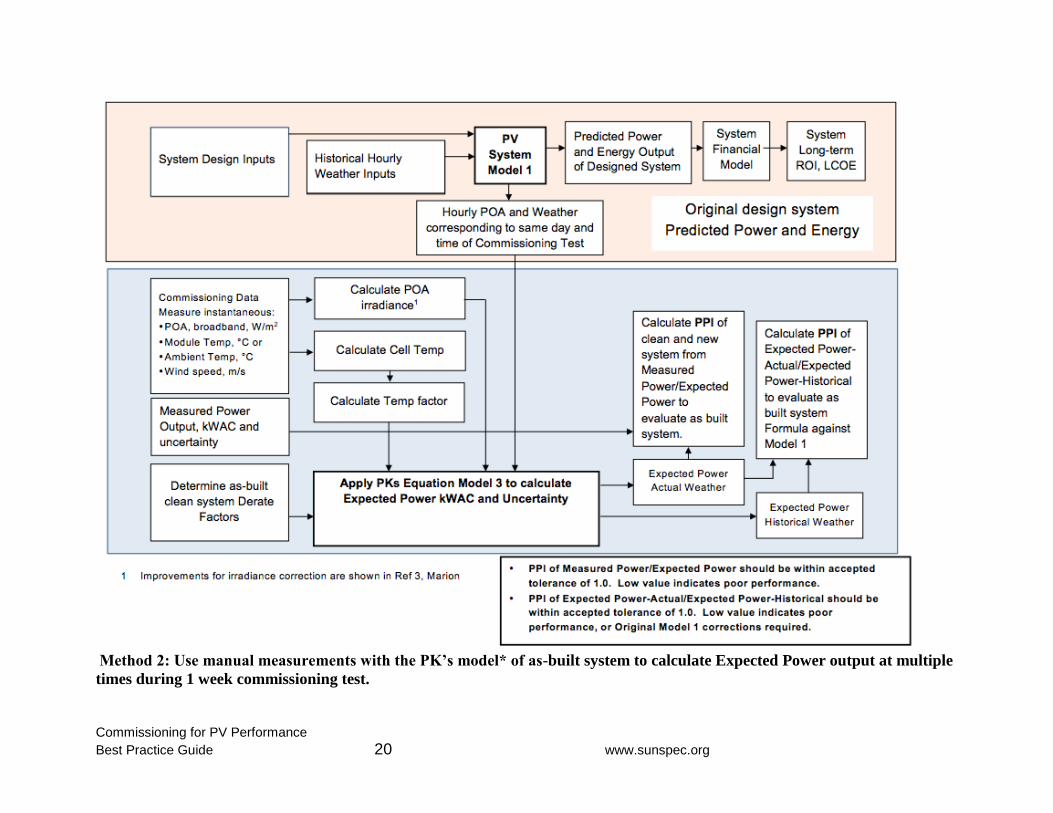
Method 2: Use manual measurements with the PK’s model* of as-built system to calculate Expected Power output at multiple
times during 1 week commissioning test.
Commissioning for PV Performance
Best Practice Guide 21 www.sunspec.org
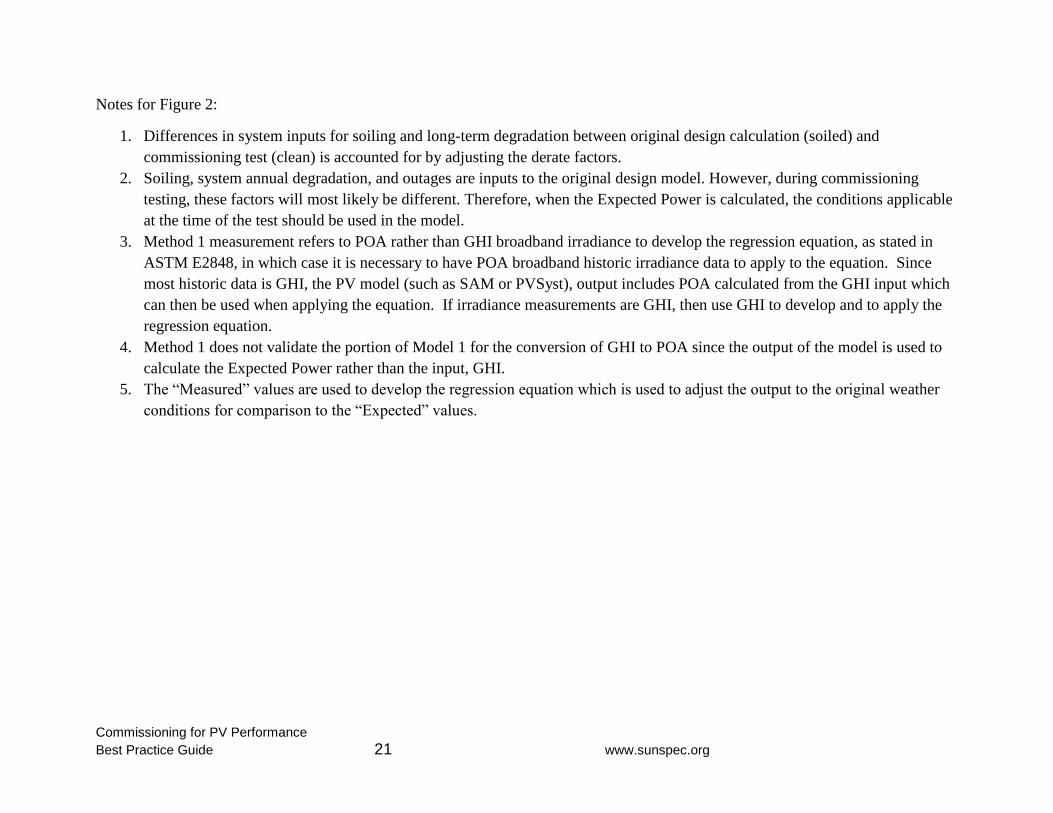
Notes for Figure 2:
1. Differences in system inputs for soiling and long-term degradation between original design calculation (soiled) and
commissioning test (clean) is accounted for by adjusting the derate factors.
2. Soiling, system annual degradation, and outages are inputs to the original design model. However, during commissioning
testing, these factors will most likely be different. Therefore, when the Expected Power is calculated, the conditions applicable
at the time of the test should be used in the model.
3. Method 1 measurement refers to POA rather than GHI broadband irradiance to develop the regression equation, as stated in
ASTM E2848, in which case it is necessary to have POA broadband historic irradiance data to apply to the equation. Since
most historic data is GHI, the PV model (such as SAM or PVSyst), output includes POA calculated from the GHI input which
can then be used when applying the equation. If irradiance measurements are GHI, then use GHI to develop and to apply the
regression equation.
4. Method 1 does not validate the portion of Model 1 for the conversion of GHI to POA since the output of the model is used to
calculate the Expected Power rather than the input, GHI.
5. The “Measured” values are used to develop the regression equation which is used to adjust the output to the original weather
conditions for comparison to the “Expected” values.
Commissioning for PV Performance
Best Practice Guide 22 www.sunspec.org
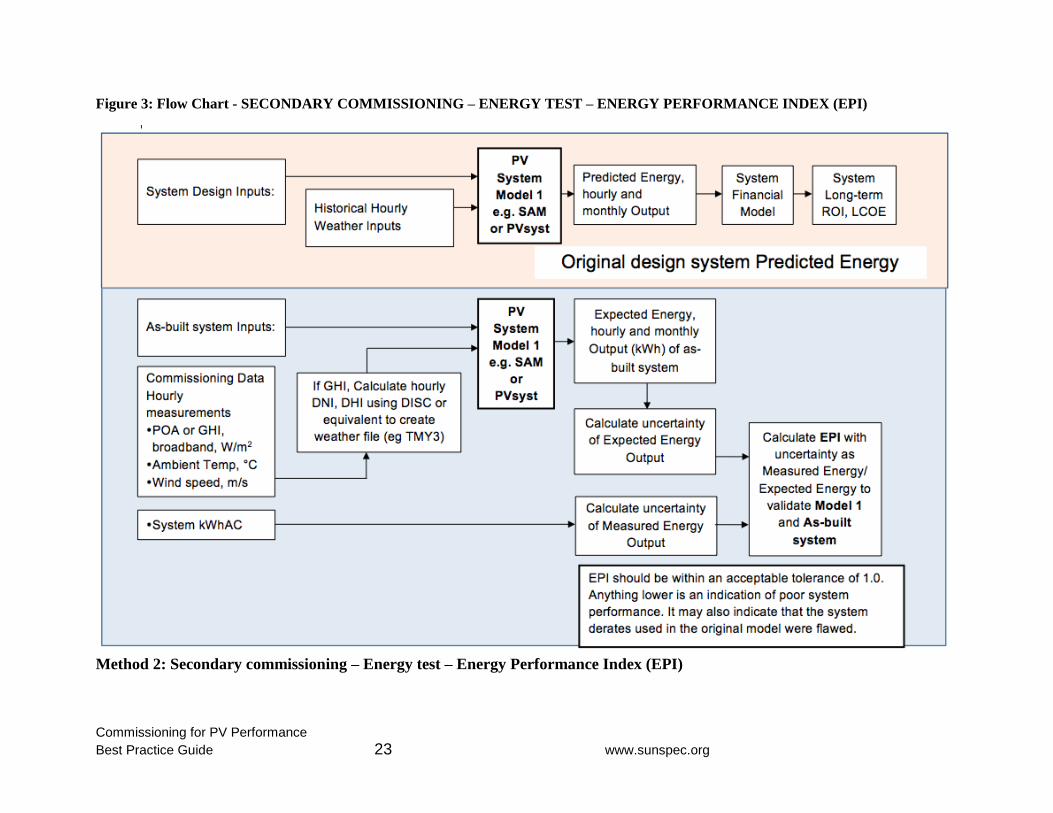
Secondary Commissioning Energy Test – PV Performance Model with Actual Weather
Input Method (Method 1)
Secondary commissioning is relatively long-term compared to initial commissioning and is
performed during the first year of operation. Methods in this section should be applied for an
entire year for maintenance purposes and system performance validation, and for evaluating
performance guarantees, if they exist. Weather and irradiation variability can vary widely for the
same month year-to-year, but it is typically within a reasonable tolerance of historical values
over the course of an entire year. An EPI is calculated as the actual Measured Energy divided by
the Expected Energy based on actual conditions as derived from one of the methods below.
The EPI value should be within an agreed-to tolerance of 1.0.
The most straightforward approach is to use the same PV performance model as used for the
original performance prediction, but revised for as-built clean and new condition and using the
actual weather measured during the energy test converted to the input format (such as TMY)
required for the PV performance model (e.g. SAM or PVSyst). The above method is represented
in the Figure 3 Flow Chart, Method 1.
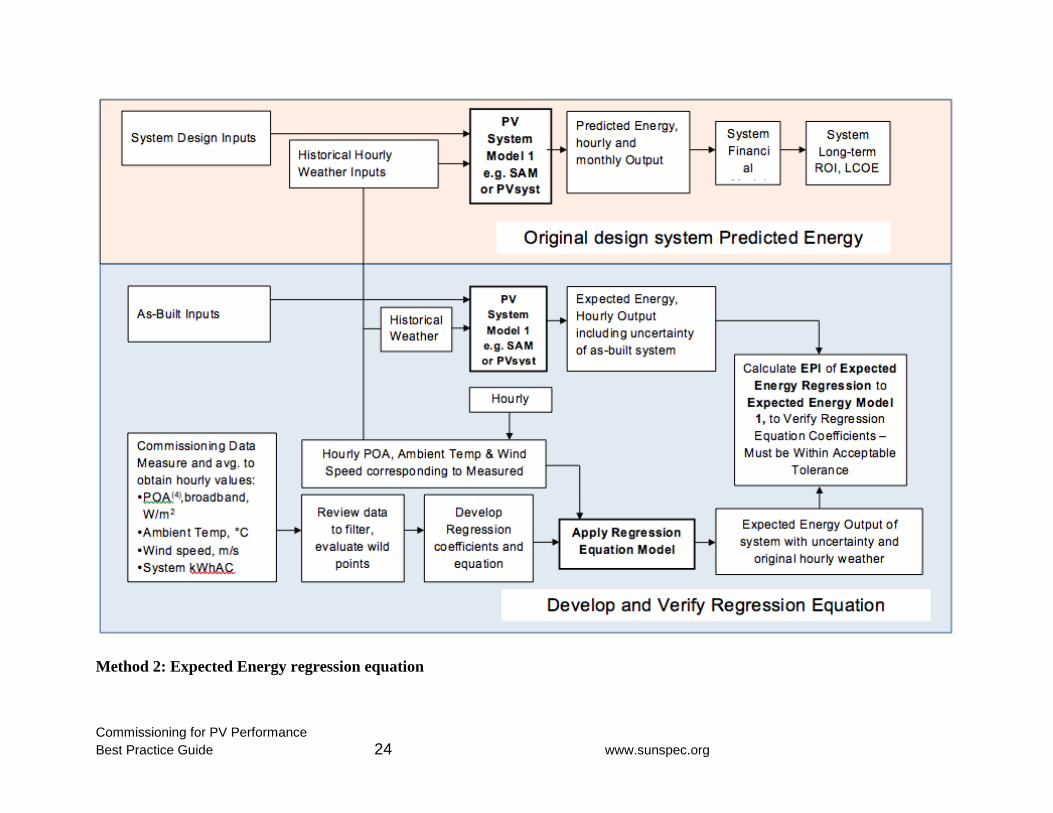
Secondary Commissioning Energy Test – Regression Model Method (Method 2)
Secondary commissioning can be performed using the regression equation method similar to
regression method used for initial commissioning.
Expected ac Energy EEXPECTED = A + (Temp × Irrad × B) + (Irrad × C) + (Irrad² × D)
where A, B, C and D are coefficients calculated by the regression analysis.
The above method is represented in the Figure 3 Flow Chart, Method 2.
This method is also applicable for applying baseline-operating measurements to long-term
operation for O&M decisions.
After Initial Commissioning and a full year of system performance evaluation, PV system
performance baseline and model validation will allow the system owner and maintenance
providers to effectively evaluate system performance, at any time, for the life of the system.
Commissioning for PV Performance
Best Practice Guide 23 www.sunspec.org
Figure 3: Flow Chart - SECONDARY COMMISSIONING – ENERGY TEST – ENERGY PERFORMANCE INDEX (EPI)
Method 2: Secondary commissioning – Energy test – Energy Performance Index (EPI)
Commissioning for PV Performance
Best Practice Guide 24 www.sunspec.org
Method 2: Expected Energy regression equation

Commissioning for PV Performance
Best Practice Guide 25 www.sunspec.org
Notes for Figure 3:
1. The duration of the secondary commissioning test should be one year.
2. Method 1 does not validate the portion of Model 1 for the conversion of GHI to POA since the output of the model is used to
calculate the Expected Power rather than the input, GHI.
3. Soiling and system annual degradation are inputs to the original design model, however, during commissioning testing
soiling and degradation will most likely be different. Therefore, when the Expected Power is calculated, the conditions
applicable at the time of the test should be used in the model.
The “Measured” values are used to develop the regression equation which is used to adjust the output to the original weather
conditions for comparison to the “Expected” values.
Commissioning for PV Performance
Best Practice Guide 26 www.sunspec.org
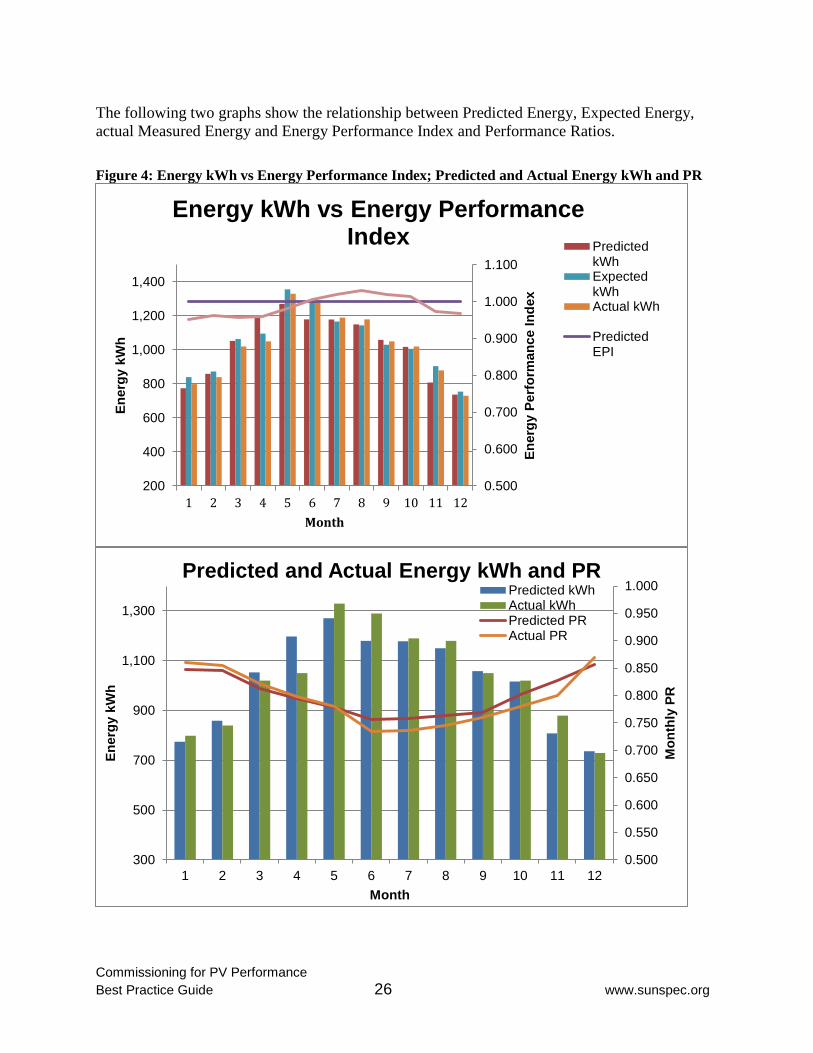
The following two graphs show the relationship between Predicted Energy, Expected Energy,
actual Measured Energy and Energy Performance Index and Performance Ratios.
Figure 4: Energy kWh vs Energy Performance Index; Predicted and Actual Energy kWh and PR
0.500
0.600
0.700
0.800
0.900
1.000
1.100
200
400
600
800
1,000
1,200
1,400
1 2 3 4 5 6 7 8 9 10 11 12
En
erg
y P
erf
orm
an
ce I
nd
ex
En
erg
y k
Wh
Month
Energy kWh vs Energy Performance Index Predicted
kWhExpectedkWhActual kWh
PredictedEPI
0.500
0.550
0.600
0.650
0.700
0.750
0.800
0.850
0.900
0.950
1.000
300
500
700
900
1,100
1,300
1 2 3 4 5 6 7 8 9 10 11 12
Mo
nth
ly P
R
En
erg
y k
Wh
Month
Predicted and Actual Energy kWh and PR Predicted kWhActual kWhPredicted PRActual PR
Commissioning for PV Performance
Best Practice Guide 27 www.sunspec.org
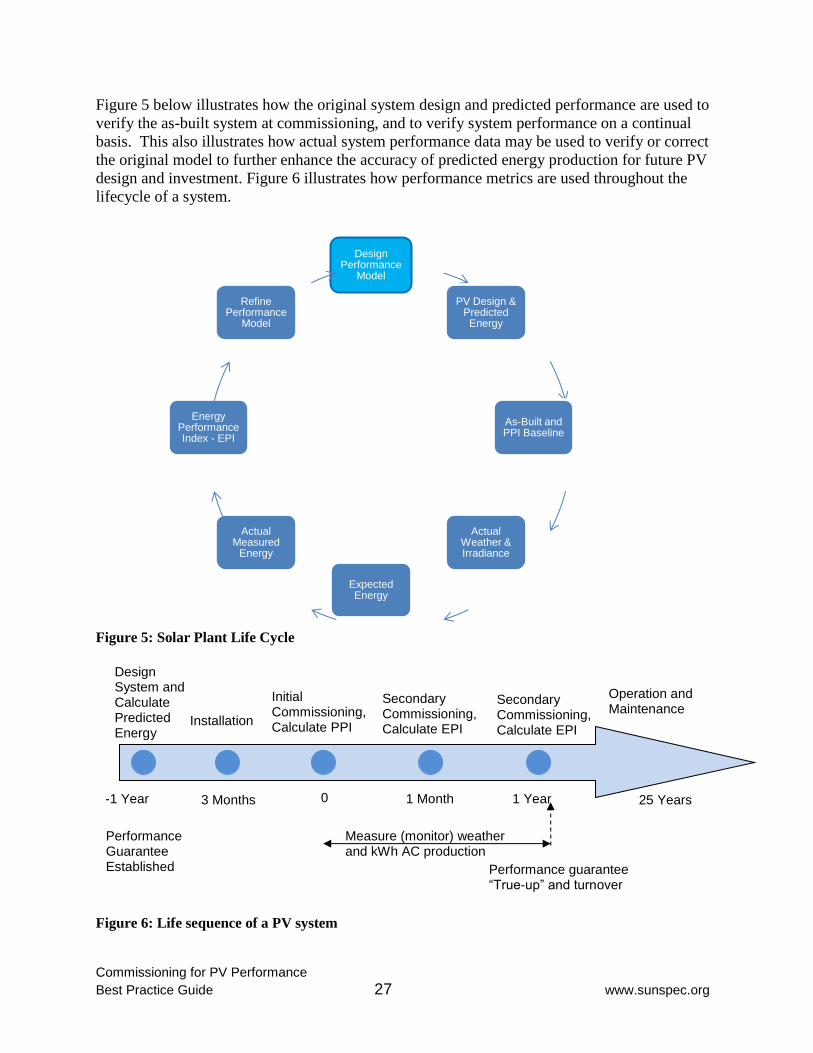
Figure 5 below illustrates how the original system design and predicted performance are used to
verify the as-built system at commissioning, and to verify system performance on a continual
basis. This also illustrates how actual system performance data may be used to verify or correct
the original model to further enhance the accuracy of predicted energy production for future PV
design and investment. Figure 6 illustrates how performance metrics are used throughout the
lifecycle of a system.
Figure 5: Solar Plant Life Cycle
Figure 6: Life sequence of a PV system
Design Performance
Model
PV Design & Predicted Energy
As-Built and PPI Baseline
Actual Weather & Irradiance
Expected Energy
Actual Measured
Energy
Energy Performance Index - EPI
Refine Performance
Model
Initial Commissioning, Calculate PPI
Measure (monitor) weather and kWh AC production
Performance guarantee “True-up” and turnover
Performance Guarantee Established
Secondary Commissioning, Calculate EPI
Operation and Maintenance
Design System and Calculate Predicted Energy
Secondary Commissioning, Calculate EPI
Installation
-1 Year 3 Months 0 1 Month 1 Year 25 Years
Commissioning for PV Performance
Best Practice Guide 28 www.sunspec.org
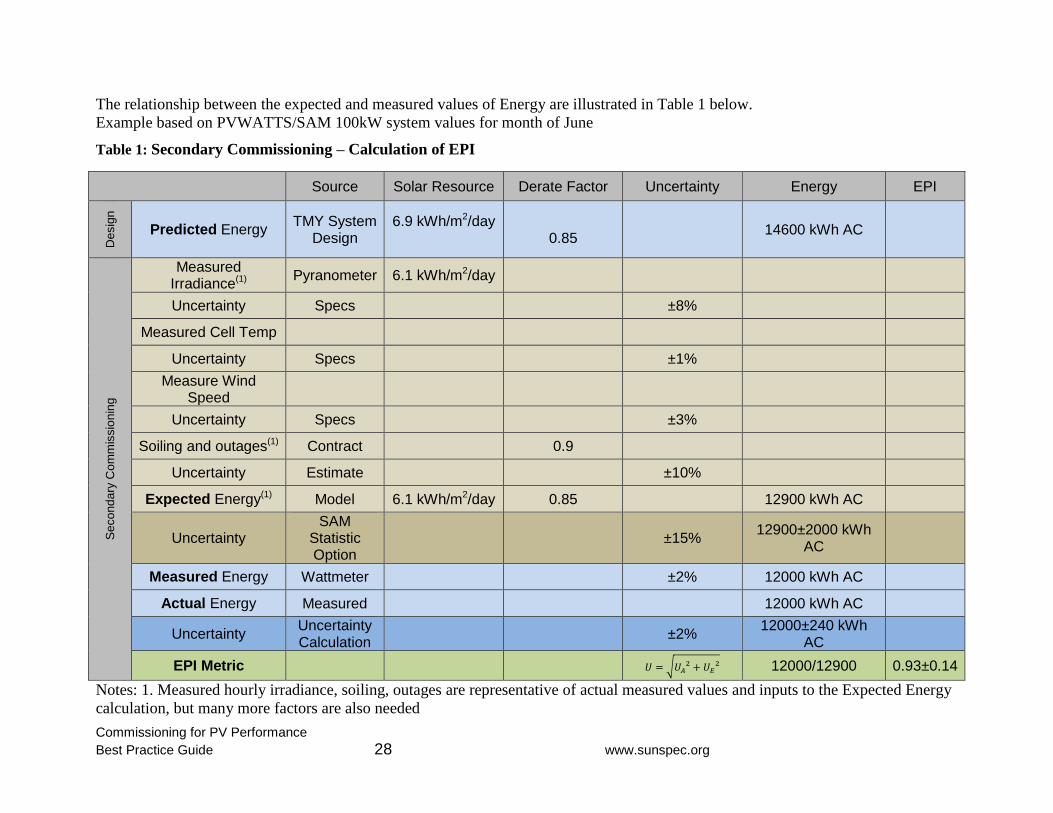
The relationship between the expected and measured values of Energy are illustrated in Table 1 below.
Example based on PVWATTS/SAM 100kW system values for month of June
Table 1: Secondary Commissioning – Calculation of EPI
Source Solar Resource Derate Factor Uncertainty Energy EPI
Desig
n
Predicted Energy TMY System
Design 6.9 kWh/m2/day
0.85 14600 kWh AC
Se
co
nd
ary
Co
mm
issio
nin
g
Measured Irradiance(1)
Pyranometer 6.1 kWh/m2/day
Uncertainty Specs ±8%
Measured Cell Temp
Uncertainty Specs ±1%
Measure Wind Speed
Uncertainty Specs ±3%
Soiling and outages(1) Contract 0.9
Uncertainty Estimate ±10%
Expected Energy(1) Model 6.1 kWh/m2/day 0.85 12900 kWh AC
Uncertainty SAM
Statistic Option
±15% 12900±2000 kWh
AC
Measured Energy Wattmeter ±2% 12000 kWh AC
Actual Energy Measured 12000 kWh AC
Uncertainty Uncertainty Calculation
±2% 12000±240 kWh
AC
EPI Metric 𝑈 = √𝑈𝐴2 + 𝑈𝐸
2 12000/12900 0.93±0.14
Notes: 1. Measured hourly irradiance, soiling, outages are representative of actual measured values and inputs to the Expected Energy
calculation, but many more factors are also needed
Commissioning for PV Performance
Best Practice Guide 29 www.sunspec.org
2.3 System Definition and Risk Allocation of Performance Factors
The physical system being evaluated is generally considered to be the PV modules, balance of
system, inverter, and all the related as-built components with good or bad design or installation
quality. The inputs to the system model are generally understood to be the many factors such as
weather, soiling, shading, degradation, tracking effectiveness, outages, and O&M practices which
directly affect system power and energy production. These factors are separate from the physical
system and the installer and owner must agree as to who accepts the risk if the actual values of these
factors differ from the values used in the predicted performance models (and in the performance
guarantee, if applicable).
Performance guarantees are outside the scope of this guide. However, the methods of performance
measurement described in this chapter may be used to evaluate performance for guarantee purposes.
As part of the Performance Evaluation, if there is a difference between the Measured Energy and
Expected Energy which is outside the agreed-upon tolerance, troubleshooting of the system and/or
Expected Energy model would be indicated.
2.4 Duration of the Commissioning Performance Evaluation
The contract, and Performance Guarantee, if any, ultimately define the duration of the energy test
during secondary commissioning. Generally, Initial Commissioning occurs during 0 to 6 months of
operation, typically when the system is turned on and considered fully operational. Secondary
Commissioning occurs during the first year of operation as shown in Figure 5. Short-term testing is
useful to evaluate the initial power output using a Capacity Test and the PPI metric, while long term
testing is considered to be an Energy Test with use of EPI. The longer-term performance
assessment provides useful data to support O&M after the first year of operation.
2.5 Commissioning Performance Evaluation Metrics PPI and EPI
Recommended metrics are Power Performance Index (PPI) for power and Energy Performance
Index (EPI) for energy. The PPI and EPI acceptance criteria must be defined by the contract, such
as 0.9 to 1.1 allowing 10% tolerance
However, the industry has used various performance metrics and various calculation methods for
the same metric, such as Performance Ratio, Yield, Performance Factor and others. Standards have
been written and are being written at a high level, but this guide is intended to aid in the calculation
of appropriate metrics specifically for commissioning. Measurements and inspections during
commissioning are made to evaluate system as-built quality, safety, contract compliance, and
performance evaluation.
Performance Ratio and Yield are metrics commonly associated with system performance, however
the PR metric doesn’t account for cell temperature and wind speed, and Yield doesn’t account for
cell temperature or irradiance. As a result, these metrics don’t evaluate system function and
therefore are not appropriate for commissioning.
The seasonal variation of PR can be illustrated using PVWATTS to represent an actual system to
calculate monthly AC kWh and monthly insolation. A 100kW system with latitude tilt in
Commissioning for PV Performance
Best Practice Guide 30 www.sunspec.org
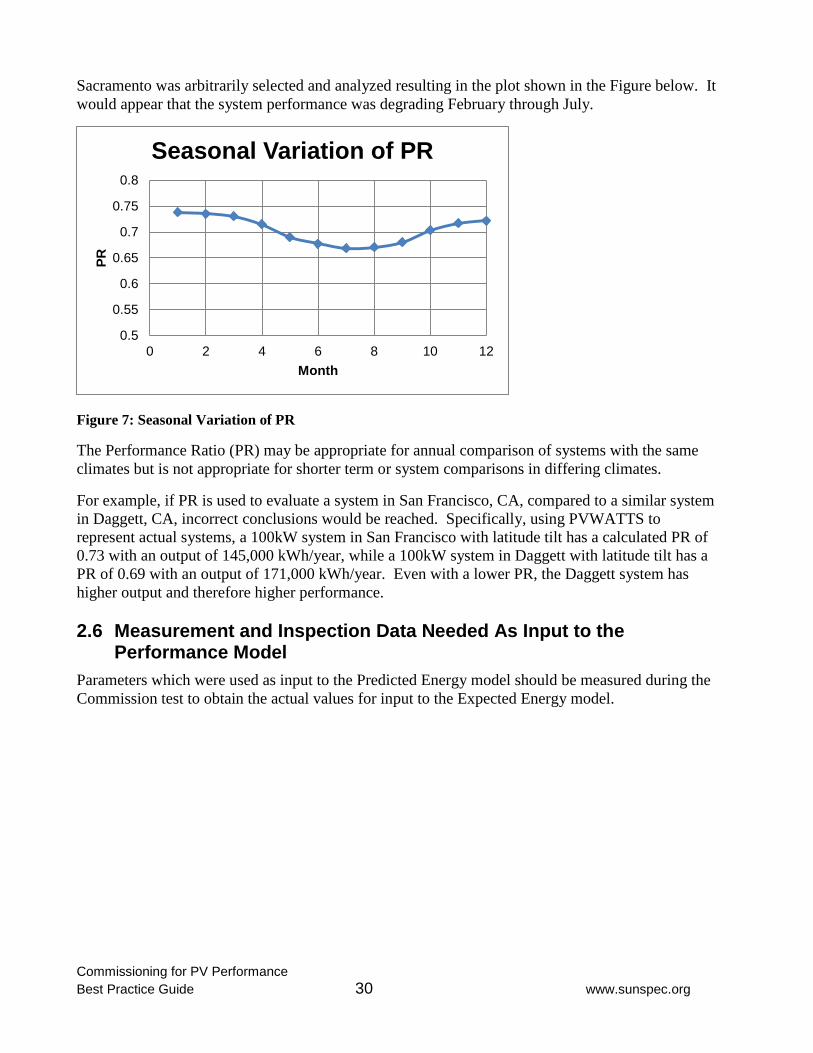
Sacramento was arbitrarily selected and analyzed resulting in the plot shown in the Figure below. It
would appear that the system performance was degrading February through July.
Figure 7: Seasonal Variation of PR
The Performance Ratio (PR) may be appropriate for annual comparison of systems with the same
climates but is not appropriate for shorter term or system comparisons in differing climates.
For example, if PR is used to evaluate a system in San Francisco, CA, compared to a similar system
in Daggett, CA, incorrect conclusions would be reached. Specifically, using PVWATTS to
represent actual systems, a 100kW system in San Francisco with latitude tilt has a calculated PR of
0.73 with an output of 145,000 kWh/year, while a 100kW system in Daggett with latitude tilt has a
PR of 0.69 with an output of 171,000 kWh/year. Even with a lower PR, the Daggett system has
higher output and therefore higher performance.
2.6 Measurement and Inspection Data Needed As Input to the Performance Model
Parameters which were used as input to the Predicted Energy model should be measured during the
Commission test to obtain the actual values for input to the Expected Energy model.
0.5
0.55
0.6
0.65
0.7
0.75
0.8
0 2 4 6 8 10 12
PR
Month
Seasonal Variation of PR
Commissioning for PV Performance
Best Practice Guide 31 www.sunspec.org
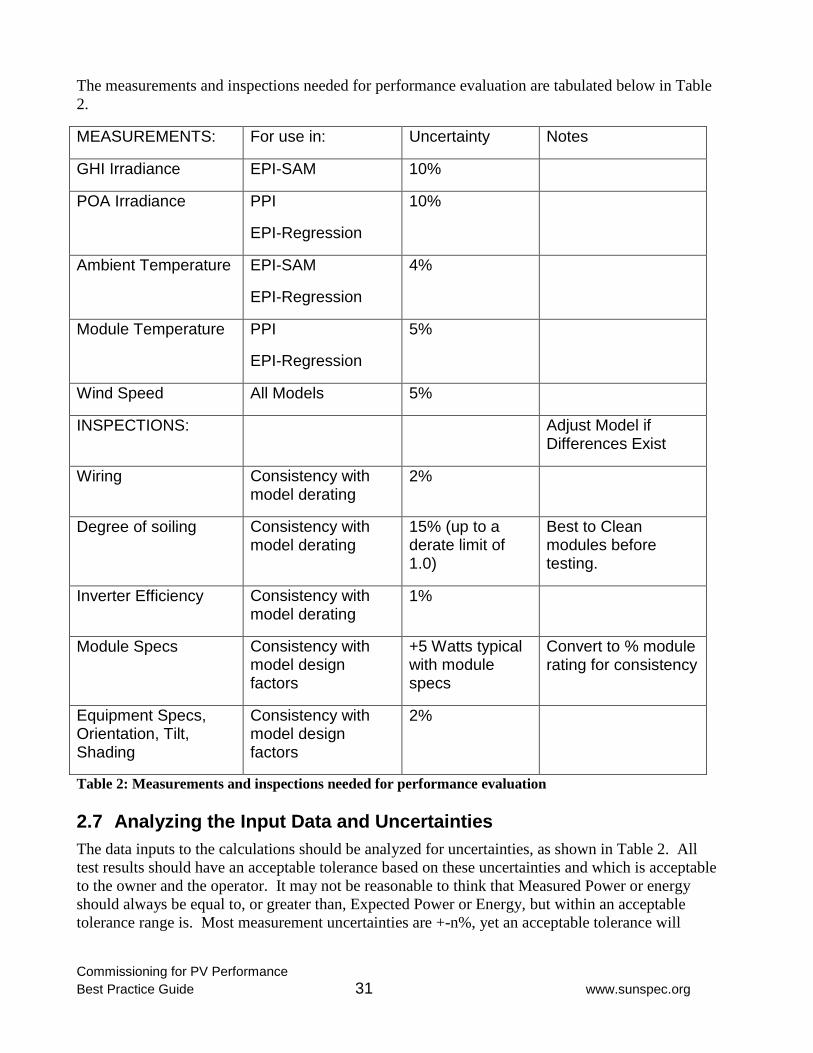
The measurements and inspections needed for performance evaluation are tabulated below in Table
2.
MEASUREMENTS: For use in: Uncertainty Notes
GHI Irradiance EPI-SAM 10%
POA Irradiance PPI
EPI-Regression
10%
Ambient Temperature EPI-SAM
EPI-Regression
4%
Module Temperature PPI
EPI-Regression
5%
Wind Speed All Models 5%
INSPECTIONS: Adjust Model if Differences Exist
Wiring Consistency with model derating
2%
Degree of soiling Consistency with model derating
15% (up to a derate limit of 1.0)
Best to Clean modules before testing.
Inverter Efficiency Consistency with model derating
1%
Module Specs Consistency with model design factors
+5 Watts typical with module specs
Convert to % module rating for consistency
Equipment Specs, Orientation, Tilt, Shading
Consistency with model design factors
2%
Table 2: Measurements and inspections needed for performance evaluation
2.7 Analyzing the Input Data and Uncertainties
The data inputs to the calculations should be analyzed for uncertainties, as shown in Table 2. All
test results should have an acceptable tolerance based on these uncertainties and which is acceptable
to the owner and the operator. It may not be reasonable to think that Measured Power or energy
should always be equal to, or greater than, Expected Power or Energy, but within an acceptable
tolerance range is. Most measurement uncertainties are +-n%, yet an acceptable tolerance will
Commissioning for PV Performance
Best Practice Guide 32 www.sunspec.org
usually be minus n%. It’s also reasonable to expect that Measured Power or Energy will exceed or
fall below Expected Power or Energy,with equal likelihood and degree.
For these reasons, an acceptable tolerance for a PPI or an EPI may be one half of the combined
uncertainties of the input data. For example, if the combined uncertainties for the Expected Energy
and Measured Energy for the duration of a test period is 10%, then the tolerance would be 5%. In
this example, an acceptable EPI would be 95%, or greater.
2.8 Reporting Performance Results
Ultimately, an owner or O&M provider should be able to generate EPI reports within the data
collection and monitoring system, without the need to download monitoring data to another
reporting system. This requires incorporating a standard PV energy production model into the
monitoring system. This system should also use standardized methods of collecting weather and
irradiance data. The data collection and monitoring system will then be capable of producing
Predicted Energy from the design model, Expected Energy from real operating conditions, and
Measured Energy. If a standardized method of incorporating the model and actual weather and
irradiance data is used in any monitoring system, then monitoring results will be consistent across
all platforms.
A spreadsheet, or other reporting format, may also be used for collecting data, calculating results
and reporting purposes. Inputs for such a system may be downloaded from a data collection and
monitoring system or combination of systems, or they may be input manually. Regardless of the
method, the inputs should be standardized for consistent results.
Reports should include the following elements, at a minimum:
System name, address/location
System size, type (fixed, tracking), module, inverter, pitch and azimuth
System derate factors – as-built
Name of person(s) performing the tests and reporting the results
Test equipment used (monitoring/model, irradiance sensor, temperature sensor, etc.)
Period of time for measurements
If EPI, measurements eliminated from the calculations (down-time, unreliable data, etc)
Number of measurements taken and used
Irradiance measured (and conversion of POA to GHI if appropriate)
Temperature measured (and conversion of ambient to module/cell if appropriate)
Wind Speed Measured
AC Power or Energy Measured
Calculation method and results (regression coefficients if regression method used)
PPI and/or EPI calculated
Uncertainty of the test results and acceptable tolerance
Notes on any significant findings or observances
Summary and narrative of the outcome, with an action plan, if required
Commissioning for PV Performance
Best Practice Guide 33 www.sunspec.org
2.9 Method Details
More detail on the methods described in this Guide may be found in the reference sources at the end
of this chapter. In particular, the SunSpec PV System Performance Assessment white paper will
give greater detail on the equations and methods recommended.
2.10 References
ASTM E2848-11, Standard Test Method for Reporting Photovoltaic Non-Concentrator System
Performance, ASTM International, West Conshohocken, PA, 2011, www.astm.org
Grid connected photovoltaic systems – Minimum requirements for system documentation,
commissioning tests and inspection. IEC Standard 62446. Geneva, Switzerland:
International Electrotechnical Commission, 2009.
Marion, B. (2008). Comparison of Predictive Models for Photovoltaic Module Performance:
Preprint. Retrieved from http://www.osti.gov/scitech/servlets/purl/929602
Mokri, J; Cunningham, J (June 2014). “PV System Performance Assessment”. San Jose, CA:
SunSpec Alliance.
3. ARRAY PERFORMANCE
3.1 Introduction
This chapter describes measurement of the power production performance of the array’s PV source
circuits, using test equipment connected to the home run conductors at the combiner box. Our focus
on the testing of performance contrasts with IEC-62446, which focuses on the testing of
functionality and considers performance testing to be beyond its scope. I-V curve tracing is widely
accepted as the most comprehensive measurement of PV source circuit performance, and in this
chapter, we affirm that distinction and concentrate primarily on its use. Separate measurements of
Isc, Voc, Vop and Iop (operating voltage and current) are discussed as an alternate method.
PV array performance measurements are always paired with simultaneous (as nearly as possible)
measurements of irradiance and module temperature, which provide the basis for evaluating the
array performance data. This chapter includes a discussion of irradiance and temperature
measurement methods for array performance characterization, which differ from the methods
normally used for system ac power and energy characterization (Meydbray et. al., March & October
2012).
3.2 Review of I-V Curve Tracing
A PV array, like an individual PV cell or module, supplies maximum power at a particular output
current and voltage called the maximum power point. The location of the max power point in I-V
space at a given instant is determined by the irradiance and cell temperature, PV module type,
number of modules in tested in series and parallel, losses due to interconnection resistance, shading,
soiling, the state of health of individual PV modules, and electrical connections. Any of these
factors can cause modules or source circuits to underperform or even stop producing altogether. If
the problem goes un-noticed, this lost capacity translates into lower system energy yield and longer
Commissioning for PV Performance
Best Practice Guide 34 www.sunspec.org
payback. Even a system that is producing to contracted levels may in fact have some
underperforming elements, and thus be capable of even higher production.
The primary task of array performance evaluation is to measure the maximum output power of the
PV source circuits and compare the results with performance predictions derived from detailed
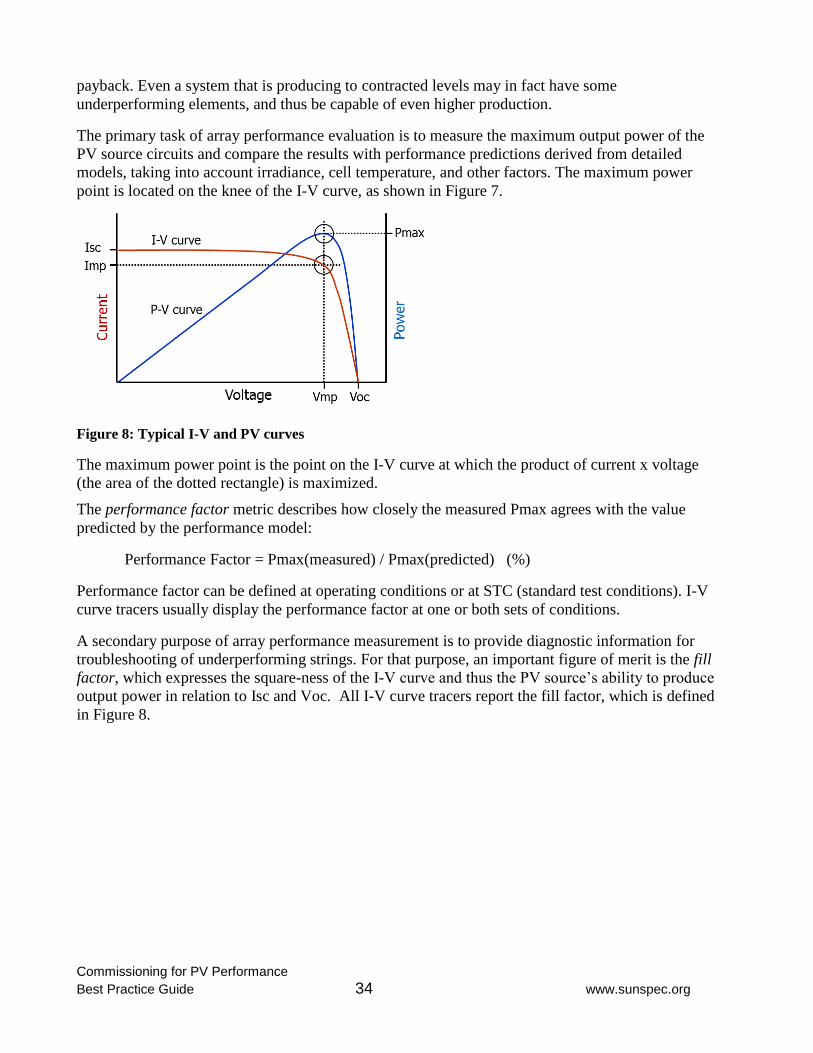
models, taking into account irradiance, cell temperature, and other factors. The maximum power
point is located on the knee of the I-V curve, as shown in Figure 7.
Figure 8: Typical I-V and PV curves
The maximum power point is the point on the I-V curve at which the product of current x voltage
(the area of the dotted rectangle) is maximized.
The performance factor metric describes how closely the measured Pmax agrees with the value
predicted by the performance model:
Performance Factor = Pmax(measured) / Pmax(predicted) (%)
Performance factor can be defined at operating conditions or at STC (standard test conditions). I-V
curve tracers usually display the performance factor at one or both sets of conditions.
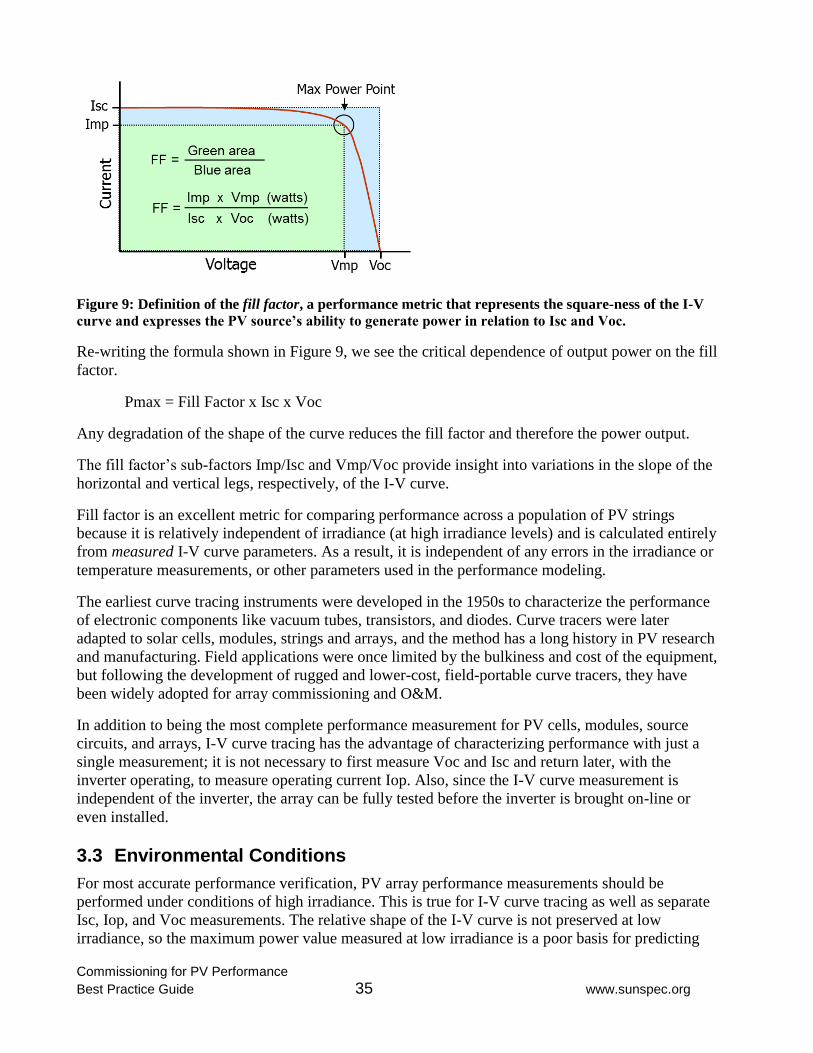
A secondary purpose of array performance measurement is to provide diagnostic information for
troubleshooting of underperforming strings. For that purpose, an important figure of merit is the fill
factor, which expresses the square-ness of the I-V curve and thus the PV source’s ability to produce
output power in relation to Isc and Voc. All I-V curve tracers report the fill factor, which is defined
in Figure 8.
Commissioning for PV Performance
Best Practice Guide 35 www.sunspec.org
Figure 9: Definition of the fill factor, a performance metric that represents the square-ness of the I-V
curve and expresses the PV source’s ability to generate power in relation to Isc and Voc.
Re-writing the formula shown in Figure 9, we see the critical dependence of output power on the fill
factor.
Pmax = Fill Factor x Isc x Voc
Any degradation of the shape of the curve reduces the fill factor and therefore the power output.
The fill factor’s sub-factors Imp/Isc and Vmp/Voc provide insight into variations in the slope of the
horizontal and vertical legs, respectively, of the I-V curve.
Fill factor is an excellent metric for comparing performance across a population of PV strings
because it is relatively independent of irradiance (at high irradiance levels) and is calculated entirely
from measured I-V curve parameters. As a result, it is independent of any errors in the irradiance or
temperature measurements, or other parameters used in the performance modeling.
The earliest curve tracing instruments were developed in the 1950s to characterize the performance
of electronic components like vacuum tubes, transistors, and diodes. Curve tracers were later
adapted to solar cells, modules, strings and arrays, and the method has a long history in PV research
and manufacturing. Field applications were once limited by the bulkiness and cost of the equipment,
but following the development of rugged and lower-cost, field-portable curve tracers, they have
been widely adopted for array commissioning and O&M.
In addition to being the most complete performance measurement for PV cells, modules, source
circuits, and arrays, I-V curve tracing has the advantage of characterizing performance with just a
single measurement; it is not necessary to first measure Voc and Isc and return later, with the
inverter operating, to measure operating current Iop. Also, since the I-V curve measurement is
independent of the inverter, the array can be fully tested before the inverter is brought on-line or
even installed.
3.3 Environmental Conditions
For most accurate performance verification, PV array performance measurements should be
performed under conditions of high irradiance. This is true for I-V curve tracing as well as separate
Isc, Iop, and Voc measurements. The relative shape of the I-V curve is not preserved at low
irradiance, so the maximum power value measured at low irradiance is a poor basis for predicting
Commissioning for PV Performance
Best Practice Guide 36 www.sunspec.org
performance under high light conditions. IEC-1829 Onsite Measurement of I-V Characteristics calls
for a minimum irradiance of 700 W/m2 in the plane of the array. Contracts for array
commissioning typically specify a minimum plane of array irradiance, which may differ from the
IEC value.
Accuracy is also best when the irradiance is stable. If a PV performance measurement is made when
the irradiance is rapidly ramping up or down, any time delay between the PV performance and
irradiance measurements translates into a random irradiance measurement error, which is further
translated into apparent performance variation of the PV circuits when the data is analyzed.
Wind is also a factor in PV array performance measurements. Wind – especially variable or gusty
wind – causes rapid and non-uniform variation in PV module temperature. Time delay between the
module temperature and I-V measurement causes apparent performance variation as in the case of
irradiance variation, though the impact of temperature error is smaller.
The position of the sun relative to the orientation of the array is also a factor in measurement
accuracy. When light arrives at an angle perpendicular to the modules, more light is transmitted
through the glass to the cells than when the light arrives at more glancing angles. When the angle of
incidence (the angle between the incident ray and the perpendicular) increases beyond 50 degrees, a
rapidly increasing amount of light is lost to reflection at the air-glass interface. This causes an
effective irradiance measurement error if the irradiance sensor and modules differ in their angle of
incidence responses. IEC-1829 calls for the angle of incidence to be less than 45 degrees, that is, the
direct rays of the sun should fall within a cone that measures 45 degrees from a line perpendicular
to the module surface. A common practice is to take array performance measurements within 2-3
hours of solar noon, which can be found for your job site at
http://www.esrl.noaa.gov/gmd/grad/solcalc/
3.4 Test Equipment
Test equipment for array performance measurement is divided into three categories: electrical,
irradiance, and module temperature measurements.
Electrical measurements
The commissioning contract calls out the parameters to be measured and may also specify the test
equipment. Table 1 lists the capabilities of various types of equipment. Selection of test equipment
is discussed later in this chapter.
Measured parameters Test equipment
I-V curve (includes Isc, Voc, Imp, Vmp, Fill Factor, and the curve itself)
I-V curve tracer
Isc, Voc, Iop, Vop String checker with dc clamp-meter
Table 3: Test equipment options for measuring PV source circuit performance.
Commissioning for PV Performance
Best Practice Guide 37 www.sunspec.org
Like I-V curve tracing, string checkers safely make and break the connection to the PV source
circuit for the Isc measurement. String checkers may also measure additional parameters such as
insulation resistance and ground continuity.
In addition to the instruments, DC cables or test leads to connect to the circuit under test will be
needed:
Test leads with alligator clips or probes for connections inside combiner boxes
Specialized cables for connecting directly to PV connectors
Irradiance and temperature measurement
Irradiance and module temperature are required to evaluate the array performance data, regardless
of the current and voltage measurement methods employed. Measurement kits designed for PV
array measurements typically include irradiance and temperature sensors.
3.5 Measurement process
Measuring string I-V curves at the combiner box
Measuring string performance always involves isolating and connecting to the string you want to
measure. As an example, these are the steps for measuring strings at the combiner box in a
negative-grounded array. See Figure 3
1. Shut down the inverter (if required by system operating policy)
2. Open the dc disconnect switch for the combiner box at which measurements will be made
3. Lift all of the string fuses
4. Connect the test leads of the I-V curve tracer to the positive and negative bus bars, observing
polarities.
At this point the electrical configuration is as shown in Figure 9.
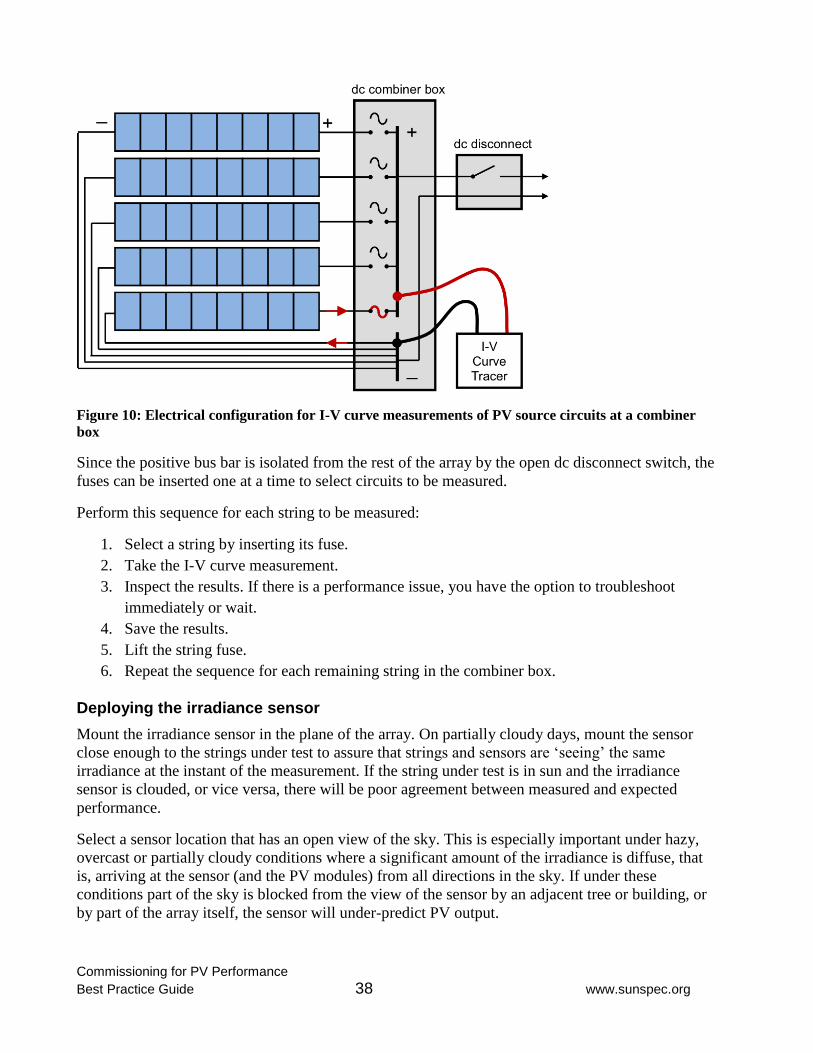
Commissioning for PV Performance
Best Practice Guide 38 www.sunspec.org
Figure 10: Electrical configuration for I-V curve measurements of PV source circuits at a combiner
box
Since the positive bus bar is isolated from the rest of the array by the open dc disconnect switch, the
fuses can be inserted one at a time to select circuits to be measured.
Perform this sequence for each string to be measured:
1. Select a string by inserting its fuse.
2. Take the I-V curve measurement.
3. Inspect the results. If there is a performance issue, you have the option to troubleshoot
immediately or wait.
4. Save the results.
5. Lift the string fuse.
6. Repeat the sequence for each remaining string in the combiner box.
Deploying the irradiance sensor
Mount the irradiance sensor in the plane of the array. On partially cloudy days, mount the sensor
close enough to the strings under test to assure that strings and sensors are ‘seeing’ the same
irradiance at the instant of the measurement. If the string under test is in sun and the irradiance
sensor is clouded, or vice versa, there will be poor agreement between measured and expected
performance.
Select a sensor location that has an open view of the sky. This is especially important under hazy,
overcast or partially cloudy conditions where a significant amount of the irradiance is diffuse, that
is, arriving at the sensor (and the PV modules) from all directions in the sky. If under these
conditions part of the sky is blocked from the view of the sensor by an adjacent tree or building, or
by part of the array itself, the sensor will under-predict PV output.
Commissioning for PV Performance
Best Practice Guide 39 www.sunspec.org
The selected sensor mounting location should also be free of reflected light (albedo). Common
sources of reflected light include the PV support structure, buildings, cars, pavement and so on. In
parking canopy arrays, mounting the irradiance sensor magnetically to the side of an end purlin can
have the double disadvantage of blocking diffuse light from part of the sky and reflecting additional
direct sunlight onto the sensor.
If the sensor is designed to be surface-mounted, placing the sensor on one of the modules in the
array will also assure proper alignment. Be sure not to place the irradiance sensor on a module
under test, as it will shade the cells and produce a step in the I-V curve.
Deploying the temperature sensor
If a module backside temperature sensor is being used, attach it with high temperature tape to assure
that it stays in firm contact with the module backsheet for the duration of the measurements.
Common plastic duct tape or electrical tape will sag and stretch under hot conditions, allowing an
air gap to form between the sensor and the backsheet, which in turn causes a large temperature
error.
Temperature is not uniform across an array. The edges run cooler, and the top edge may be warmer
than the bottom edge and sides, where cooler air is drawn in by convection. Attach the temperature
sensor at a location that represents the average temperature for the strings under test.
Avoid attaching surface temperature sensors to the face of the module, where they will shadow the
cells and affect the measured performance.
If an infrared thermometer is being used, avoid thermal reflections by placing the sensor in direct
contact with the surface of the glass. Module glass is not transparent in the wavelength range of IR
thermometers, so the measured value represents the temperature of the outer surface of the glass,
not the temperature of the cells. Adjust the thermometer’s emissivity setting to 0.92, the emissivity
of glass.
Physical contact and IR measurements both have the limitation that they measure surface
temperatures. The temperature of interest for analyzing string performance data is the average PV
cell temperature, which is typically a few degrees Celsius warmer than the backside or frontside
surface temperatures. Data analysis should take these temperature offsets into account.
3.6 Planning Your Tests
An effective test plan should take these factors into account.
Coverage
Contracts usually call for testing each string. This is a best practice for commissioning, although
sampling strategies are sometimes employed in very large utility arrays.
Granularity
If every string terminates at the combiner box, the usual commissioning test practice is to measure
the strings individually. Some I-V curve tracers have sufficient current range to measure multiple
strings in parallel, but this reduces the visibility of problems in any one string. Measuring strings in
parallel does reduce the test time, but the increase in strings tested per day is less than one would
expect because relocating from combiner to combiner typically consumes more time than the testing
itself.

Commissioning for PV Performance
Best Practice Guide 40 www.sunspec.org
Harnessed strings
Harnessing is the practice of connecting strings in parallel out in the array and running a single pair
of conductors (the harness conductors) back to the combiner box.
As a rough rule of thumb, harnessing can save BOS costs in arrays that are larger than 1MW and in
which the string layout is straightforward and also consistent from combiner to combiner. In
crystalline arrays, harnessing is usually limited to two and sometimes three strings. In thin film
arrays module Isc is much smaller and it is not unusual to harness 6-8 strings.
The easiest way to test harnessed arrays is to measure at the harness level at the combiner box. The
drawback is that the visibility of issues in a single string is reduced, as discussed above. The
alternatives are 1) move out into the array with the test equipment, disconnect strings from the
harnesses, and test them individually, or 2) measure at the combiner box but connect only one string
at a time to the harness, or 3) measure string performance during array assembly, before the strings
are connected to the harness.
Estimating the time required for testing the array
The amount of time required to measure array performance depends on these factors:
Coverage: Will I-V measurements be performed at each combiner box, or at just a percentage of the
combiners?
Granularity: Will strings be measured singly or in parallel? In the case of harnessed arrays, will the
harnesses be measured intact from the combiner box, or will the strings be disconnected and
measured separately.
Test method: I-V curve tracing is a single measurement. The method of separately measuring Isc,
Voc and Iop requires the extra step of measuring the string operating currents under inverter
operation.
Setup time at the combiner box: This includes electrically isolating and opening the combiner box,
lifting fuses, and making electrical connections.
Moving between combiner boxes: This tends to be the biggest time factor, especially if the boxes
are far apart. In parking canopy arrays, the use of lifts may also be a factor.
Sensor redeployment: The time required for redeploying the sensors is greater in the case of wired
or handheld sensors, which typically must be redeployed at each combiner box Wireless sensors,
depending on their wireless range, may allow you to test multiple combiner boxes per sensor
deployment.
Instrument thermal limitations: As discussed earlier, all I-V curve tracers and multi-testers absorb
energy with each measurement. Depending on the design of the instrument, on hot days you may
need to allow periods of time for the instrument to dissipate this heat.
3.7 Safety
Measuring PV source circuits exposes the operator to lethal shock and arc flash hazards. Selection
of the proper degree of arc flash protection is discussed in Shapiro, Radibratovic, 2014. Personnel
must be properly trained, equipped, and supervised. Safe work practices, including the use of
personal protective equipment (PPE), must be followed. Specific requirements for worker safety are
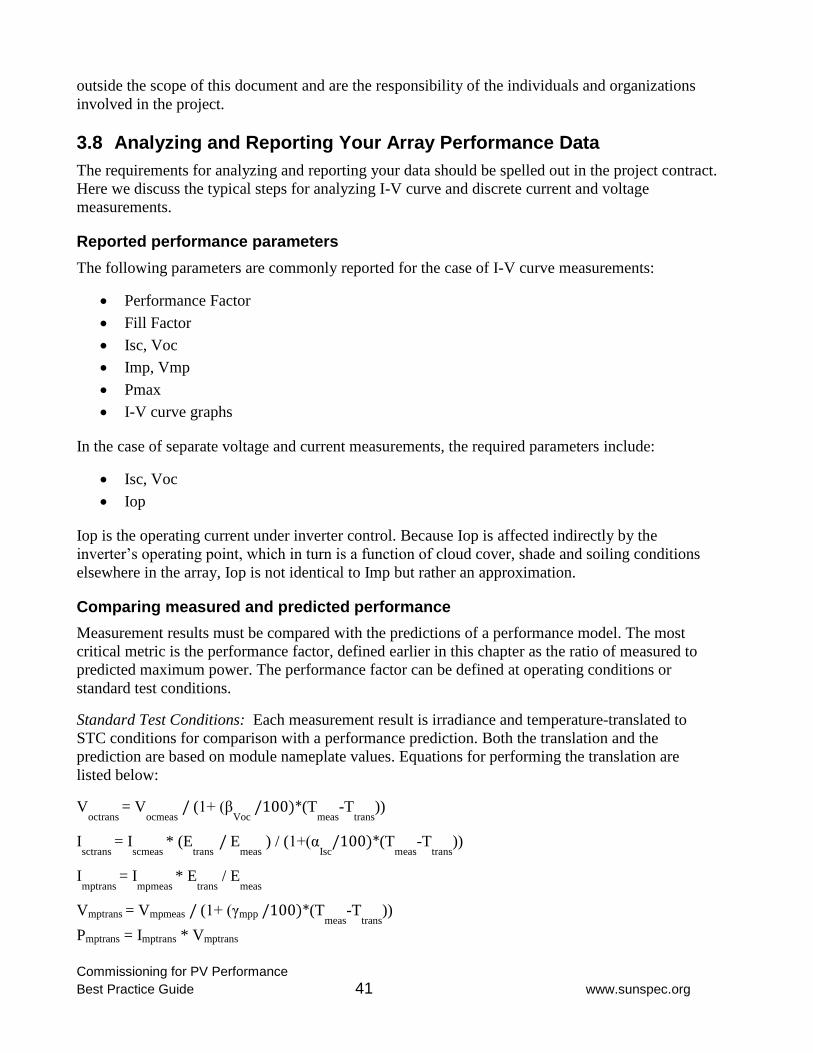
Commissioning for PV Performance
Best Practice Guide 41 www.sunspec.org
outside the scope of this document and are the responsibility of the individuals and organizations
involved in the project.
3.8 Analyzing and Reporting Your Array Performance Data
The requirements for analyzing and reporting your data should be spelled out in the project contract.
Here we discuss the typical steps for analyzing I-V curve and discrete current and voltage
measurements.
Reported performance parameters
The following parameters are commonly reported for the case of I-V curve measurements:
Performance Factor
Fill Factor
Isc, Voc
Imp, Vmp
Pmax
I-V curve graphs
In the case of separate voltage and current measurements, the required parameters include:
Isc, Voc
Iop
Iop is the operating current under inverter control. Because Iop is affected indirectly by the
inverter’s operating point, which in turn is a function of cloud cover, shade and soiling conditions
elsewhere in the array, Iop is not identical to Imp but rather an approximation.
Comparing measured and predicted performance
Measurement results must be compared with the predictions of a performance model. The most
critical metric is the performance factor, defined earlier in this chapter as the ratio of measured to
predicted maximum power. The performance factor can be defined at operating conditions or
standard test conditions.
Standard Test Conditions: Each measurement result is irradiance and temperature-translated to
STC conditions for comparison with a performance prediction. Both the translation and the
prediction are based on module nameplate values. Equations for performing the translation are
listed below:
Voctrans
= Vocmeas
/ (1+ (βVoc
/100)*(Tmeas
-Ttrans
))
Isctrans
= Iscmeas
* (Etrans
/ Emeas
) / (1+(αIsc
/100)*(Tmeas
-Ttrans
))
Imptrans
= Impmeas
* Etrans
/ Emeas
Vmptrans = Vmpmeas / (1+ (γmpp /100)*(Tmeas
-Ttrans
))
Pmptrans = Imptrans * Vmptrans
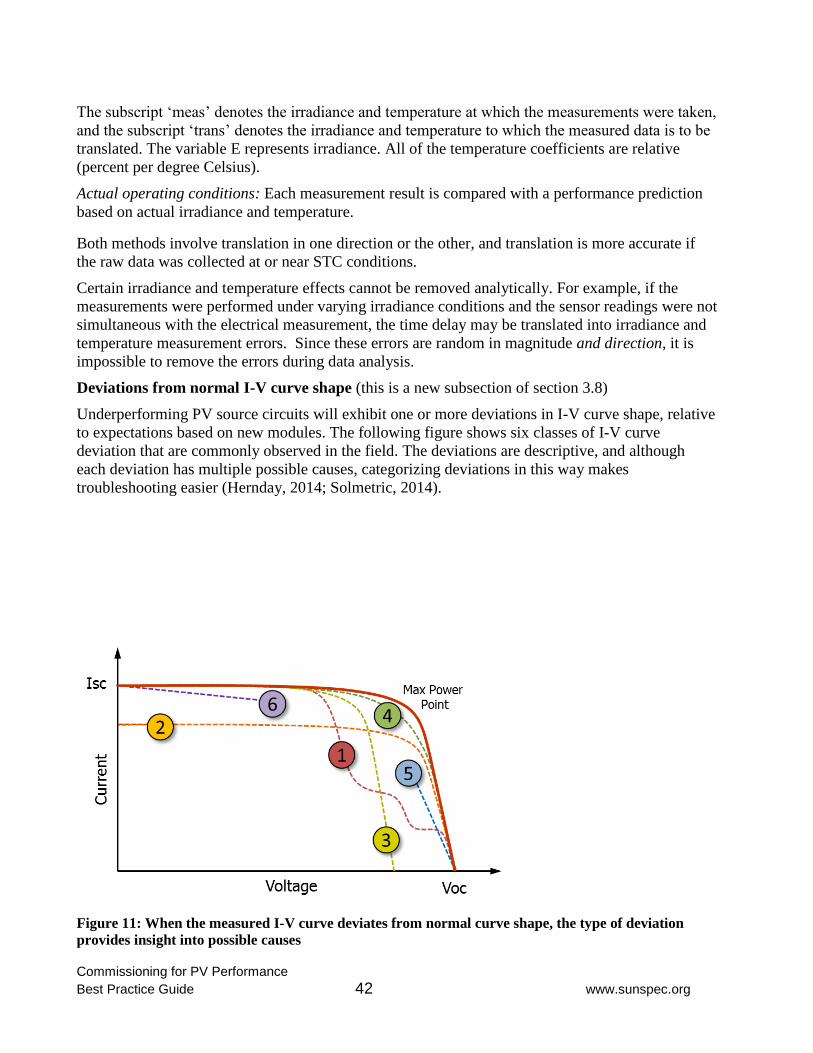
Commissioning for PV Performance
Best Practice Guide 42 www.sunspec.org
The subscript ‘meas’ denotes the irradiance and temperature at which the measurements were taken,
and the subscript ‘trans’ denotes the irradiance and temperature to which the measured data is to be
translated. The variable E represents irradiance. All of the temperature coefficients are relative
(percent per degree Celsius).
Actual operating conditions: Each measurement result is compared with a performance prediction
based on actual irradiance and temperature.
Both methods involve translation in one direction or the other, and translation is more accurate if
the raw data was collected at or near STC conditions.
Certain irradiance and temperature effects cannot be removed analytically. For example, if the
measurements were performed under varying irradiance conditions and the sensor readings were not
simultaneous with the electrical measurement, the time delay may be translated into irradiance and
temperature measurement errors. Since these errors are random in magnitude and direction, it is
impossible to remove the errors during data analysis.
Deviations from normal I-V curve shape (this is a new subsection of section 3.8)
Underperforming PV source circuits will exhibit one or more deviations in I-V curve shape, relative
to expectations based on new modules. The following figure shows six classes of I-V curve
deviation that are commonly observed in the field. The deviations are descriptive, and although
each deviation has multiple possible causes, categorizing deviations in this way makes
troubleshooting easier (Hernday, 2014; Solmetric, 2014).
Figure 11: When the measured I-V curve deviates from normal curve shape, the type of deviation
provides insight into possible causes
Commissioning for PV Performance
Best Practice Guide 43 www.sunspec.org
3.9 Test Equipment Considerations
In this section, we review the equipment characteristics that are particularly relevant to array
performance testing in the commissioning application.
I-V curve tracer
The following characteristics of I-V curve tracers are important to accuracy and productivity:
Throughput
Accuracy
Resolution
Ability to measure high efficiency and thin film modules
Throughput
Throughput means the number of PV strings that can be performance-tested per hour, and it is an
important consideration when testing large projects. Throughput depends on several factors. One of
the most basic is the ability of the equipment to dissipate electrical power. All I-V curve tracers
temporarily load the string or module under test. Regardless of the load type – resistive, capacitive,
or electronic – electrical energy is transferred to the curve tracer with every trace, and this energy is
dissipated as heat. If the number of strings measured per hour exceeds the curve tracer’s ability to
shed this heat, its internal temperature may reach a preset limit, causing the unit to shut down. This
is more likely to occur on hot days with the curve tracer exposed to direct sunlight.
Throughput is also affected by the setup time of the equipment, the I-V trace acquisition time, and
the time required to save each trace and to offload data if storage capacity is limited. Setup of the
sensors also factors into throughput. Wireless sensors may allow testing at multiple combiners with
a single deployment of the sensors.
Accuracy
I-V curve tracers have separate accuracy specifications for current and voltage. These
measurement uncertainties should be small relative to the variations of PV string current and
voltage allowed by the commissioning contract.
Resolution
Resolution is the number of I-V measurement pairs or points that make up the I-V curve. More
resolution means a more detailed picture of any deviations from normal curve shape, and more
information for troubleshooting purposes. For example, it is useful to detect steps in the curve
caused by conduction in a single bypass diode. One hundred points is sufficient for commissioning
and most troubleshooting work, although higher resolutions are useful in special troubleshooting
situations.
Ability to measure high-efficiency modules
High efficiency modules have relatively higher electrical capacitance, which means at any given
operating voltage, they store more electrical charge in the cells themselves, compared to ordinary
modules. This charge takes time to redistribute and settle as the cell voltage changes. To measure
the I-V curves of strings of high efficiency modules (or individual modules) accurately, the curve
tracer must allow time for this redistribution. For capacitive load curve tracers, this means using a
relatively large value load capacitor so the voltage rises slowly enough for this redistribution to take
Commissioning for PV Performance
Best Practice Guide 44 www.sunspec.org
place without distorting the I-V curve. For other types of load, it means dwelling at each ‘point’
long enough for the current to stabilize before measuring the current. Curve tracers designed to test
high efficiency modules tend to be slightly larger because of increased load size and/or increased
heat dissipation requirements.
The large amount of stored charge in high-efficiency modules also means that these modules can
deliver a short but very high-current pulse of current at the instant the curve tracer takes its first
point. Curve tracers that are not capable of handling this fast current spike will detect it as an
overcurrent situation and shut down without measuring the I-V curve.
Irradiance sensor
Selection of a suitable irradiance sensor should take these factors into account:
Accuracy
Spectral response
Angle of incidence response
Response time
Accuracy
The published accuracy should be compatible with the overall uncertainty required of the
performance measurement. Irradiance measurement error is typically the largest of the uncertainties
associated with array performance measurement.
Spectral response
The spectral response of the sensor should match as closely as possible the response of the PV
modules under test. The best way to assure this is to use the same technology as the PV modules or
to use a very similar technology with appropriate spectral corrections. For conventional flat plate
silicon modules, this means a silicon reference cell or a properly corrected silicon photodiode
irradiance sensor (sometimes called a ‘photodiode pyranometer’). True ‘black body’ pyranometers
are widely used in measurement of PV plant energy production but are not suitable for array
performance measurement. A reference cell or corrected silicon photodiode are far superior
(Meydbray, et. al., March & October 2012).
Angle of incidence response
Direct sunlight arrives at the PV module at some angle away from the perpendicular, called the
angle of incidence. As the angle of incidence increases, especially past 50 degrees, more light is lost
to reflection from the front surface of the glass. Modules may employ textured glass or
antireflective (AR) coatings to minimize reflections. Although this improves production earlier and
later in the day, it also poses a challenge for irradiance measurement. If the sensor does not have
matching anti-reflective characteristics, at large angles of incidence it will under-predict PV
performance. If the irradiance sensor does not have a matching angle of incidence response, the next
best approach is to correct the sensor data accordingly, to match the modules. Good angle of
incidence match between sensor and modules is also important when measuring under diffuse light
(hazy or high cloud) conditions, in which light arrives from all angles of the sky.
Response time
Under partially cloudy conditions, the irradiance may be ramping up or down while the array
performance measurements are being performed. If there is a time delay between the current or
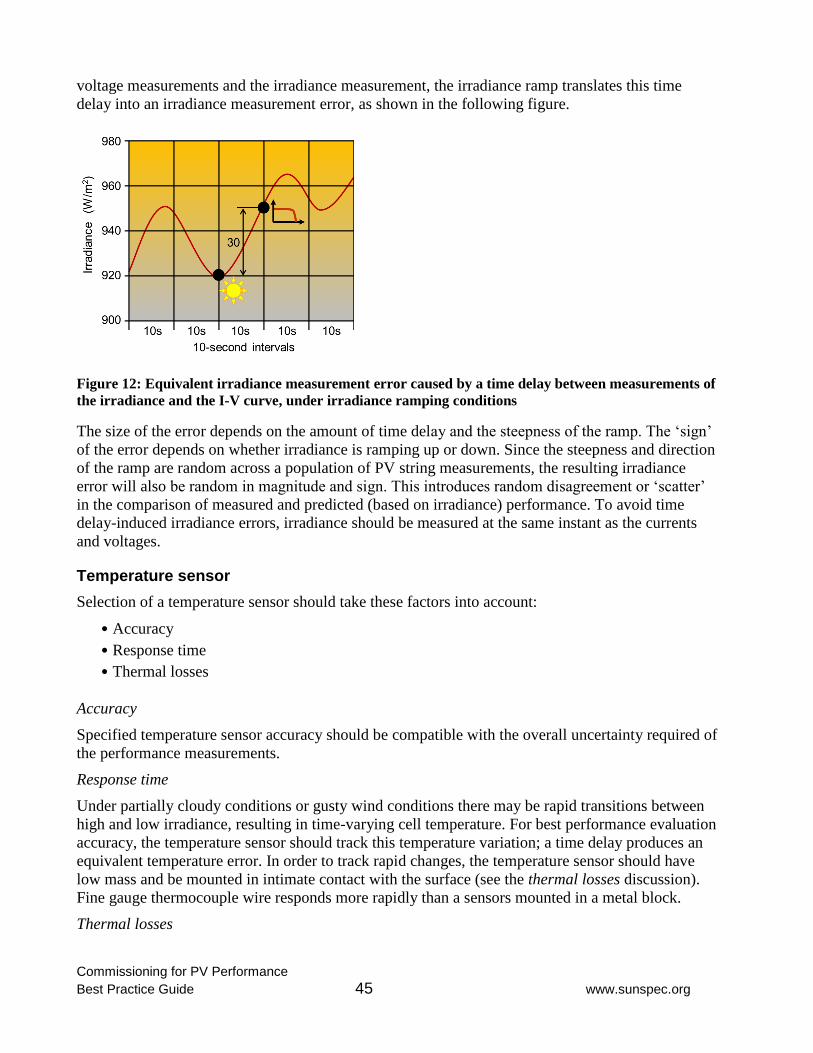
Commissioning for PV Performance
Best Practice Guide 45 www.sunspec.org
voltage measurements and the irradiance measurement, the irradiance ramp translates this time
delay into an irradiance measurement error, as shown in the following figure.
Figure 12: Equivalent irradiance measurement error caused by a time delay between measurements of
the irradiance and the I-V curve, under irradiance ramping conditions
The size of the error depends on the amount of time delay and the steepness of the ramp. The ‘sign’
of the error depends on whether irradiance is ramping up or down. Since the steepness and direction
of the ramp are random across a population of PV string measurements, the resulting irradiance
error will also be random in magnitude and sign. This introduces random disagreement or ‘scatter’
in the comparison of measured and predicted (based on irradiance) performance. To avoid time
delay-induced irradiance errors, irradiance should be measured at the same instant as the currents
and voltages.
Temperature sensor
Selection of a temperature sensor should take these factors into account:
• Accuracy
• Response time
• Thermal losses
Accuracy
Specified temperature sensor accuracy should be compatible with the overall uncertainty required of
the performance measurements.
Response time
Under partially cloudy conditions or gusty wind conditions there may be rapid transitions between
high and low irradiance, resulting in time-varying cell temperature. For best performance evaluation
accuracy, the temperature sensor should track this temperature variation; a time delay produces an
equivalent temperature error. In order to track rapid changes, the temperature sensor should have
low mass and be mounted in intimate contact with the surface (see the thermal losses discussion).
Fine gauge thermocouple wire responds more rapidly than a sensors mounted in a metal block.
Thermal losses
Commissioning for PV Performance
Best Practice Guide 46 www.sunspec.org
This characteristic applies to surface temperature sensors of the type typically mounted on the
backside of PV modules. The materials in which the PV cell is embedded – encapsulant, backsheet,
and glass – have poor thermal conductivity (high thermal resistance), so as heat from the cells flows
outward through these materials, a temperature offset is created. If there is an air gap between the
surface temperature sensor and the module backsheet, an additional temperature drop occurs across
the air gap. For this reason, it is important to keep the surface temperature sensor in intimate contact
with the backsheet. If tape is used to mount the sensor, only high-temperature rated tape such as
Kapton tape should be used, to avoid the sagging that occurs with electrical tape and common duct
tape.
Another thermal loss is caused by heat transfer from the sensor itself to the surrounding air. Bulky
sensors expose more heat transfer area, and this pulls down their temperature. It is also more
difficult to keep a bulky sensor in intimate contact with the backsheet.
3.10 References
Crystalline Silicon Photovoltaic (PV) Array : On-site Measurement of I-V Characteristics. IEC
Standard 1829. Geneva, Switzerland: International Electrotechnical Commission, 1995.
Grid connected photovoltaic systems – Minimum requirements for system documentation,
commissioning tests and inspection. IEC Standard 62446. Geneva, Switzerland:
International Electrotechnical Commission, 2009. [This standard tests functionality;
performance measurements are out of its scope]
Hernday, Paul. “Interpreting I-V Curve Deviations”. SolarPro, Issue 7.5 (2014).
Meydbray, J., K. Emery, and S. Kurtz. 2012. “Pyranometers and Reference Cells, What’s the
Difference?: Preprint”, March. http://www.osti.gov/scitech/servlets/purl/1038336.
“PV Array Performance Troubleshooting Flowchart”, Solmetric. October 14, 2014.
http://www.freesolarposters.com/tools/poster
Shapiro, Finley R., Radibratovic, Brian. “Calculating DC Arc-Flash Hazards in PV Systems”,
SolarPro, Issue 7.2 (2014).
“Solar Noon Calculator”. Earth System Research Laboratory: Global Monitoring Division.
Accessed October 14, 2014. http://www.esrl.noaa.gov/gmd/grad/solcalc/
3.11 Acknowledgments
We thank the following organizations for contributing to the development of this chapter:
Solmetric
4. INSULATION RESISTANCE
4.1 Introduction
In the PV system application, insulation resistance is defined as the measured electrical resistance
between the conductor under test and equipment ground. An insulation failure in a PV system
circuit presents dual hazards of fire and lethal electric shock. Insulation failures can also impact the
energy production of the system by tripping the GFDI (ground fault detection and interruption)
Commissioning for PV Performance
Best Practice Guide 47 www.sunspec.org
device and taking the inverter offline. Insulation integrity is degraded by pinching of array
conductors between modules and racking, slicing of insulation by sharp metal edges in racking and
conduit, ultraviolet exposure, temperature extremes and temperature cycling, moisture ingress,
abrasion – often aggravated by wind or vibration – and rodent chewing. Individual conductors and
components may also have insulation flaws right from the factory.
Insulation integrity must be evaluated on both the ac and the dc sides of new PV systems. Section
110.7 of the 2011 NEC states, "…completed wiring installations shall be free from short circuits,
ground faults, or any connections to ground other than as required or permitted elsewhere in the
Code."
The phenomenon of ground fault ‘blind spots’ (Brooks, 2011) in PV arrays underscores the
importance of insulation resistance testing. In large systems, a ground fault in one of the array’s
grounded conductors is not detected by the inverter GFP (ground fault protection) circuit. When
another ground fault eventually occurs in an ungrounded conductor, the earlier fault provides a
return path, allowing high current to flow though the loop defined by the two faults. Although the
second fault may trip the GFP circuit, removing the ground path at the inverter, Bill Brooks points
out that this is “exactly what should not happen if there is already a fault in the array. Now, instead
of having a large equipment-grounding conductor to carry the fault current, a 10 or 12 AWG
source-circuit conductor has to carry the entire return current”. A ground fault blind spot was the
cause of the Bakersfield fire in 2009 (Brooks, 2011).
Insulation resistance testing is a long-established practice in power distribution, electric motors,
control systems, communications, and other fields. Insulation resistance testers are called IR testers,
or variously megohmmeters, meg testers, or just meggers, because they measure very high values of
resistance (1 megohm = 1,000,000 ohms). In this chapter we use the term ‘meg testing’ as shorthand
for insulation resistance testing.
Adoption of meg testing within the PV industry has been strongest in the commercial and utility
sectors, driven by the need to reduce the investment risk and facilitated by electrical contractors’
familiarity with meg testing equipment and methods. Residential systems are still lagging in
adopting these methods, but there is every reason to meg test residential PV system.
At this time in the evolution of the PV industry there is still a great deal of variation in which parts
of the PV system are tested, how the tests are performed, how the data is interpreted, and how the
pass/fail determination is made. Guidance from PV module manufacturers also varies widely.
Inverters are required to provide ground fault detection and interruption (GFDI). In grounded
systems, a GFDI circuit removes the load and un-grounds the system if the fault detection current
exceeds a preset value, typically 1A in small inverters and 5A in central inverters. In un-grounded
systems, additional ground fault detection schemes are possible. Differential current measurements
replace the traditional GFDI fuse and provide more sensitive (lower current) detection levels.
Another feature tests the array’s insulation resistance in early morning, before production starts.
Both methods bring enhanced levels of safety to the PV array. However, these methods are not a
substitute for insulation resistance testing at the time of array commissioning.
Solar Energy International and some other training organizations offer instruction in meg testing of
PV systems. Some standards documents, including IEC-62446, offer measurement procedures and
test limits. However, it is likely that techniques for interpreting PV array meg test data and
identifying outlier circuits will continue to evolve.
Commissioning for PV Performance
Best Practice Guide 48 www.sunspec.org
4.2 About Insulation Resistance Measurement
How a meg tester works
Meg testers apply a test voltage between a conductor and system ground. The resulting current is
measured and the equivalent resistance is calculated by dividing the test voltage by the resulting
current (Ohm’s Law). Although insulation resistance testers operate on the same principles as
ohmmeters, they apply much higher voltages in order to extend the resistance measurement range
into the 100’s of Gigohms (1 Gigohm = 1000 Megohms = 1000,000,000 ohms). Some instruments,
including PV string checkers, combine the insulation resistance test with other voltage, current, and
ground continuity measurements.
HiPot testers, like meg testers, apply a high test voltage and measure the resulting current. However,
their purpose is generally to assure that at a specified test voltage the current does not exceed a
specified level. HiPot testers are widely used in product safety testing.
Another test method that measures a current in response to a high dc test voltage is the Potential
Induced Degradation susceptibility test. PID is a PV module degradation phenomenon in which
ionic migration is driven by leakage currents from the cells to the module frame. The PID
susceptibility test is typically performed in a laboratory during qualification of new modules or
failure analysis of older modules. The glass face of the module is immersed in a conductive water
solution, a high test voltage is applied to the cells, and the leakage current is monitored. Although
similar in circuit configuration to the meg test, the focus of the PID test, like the HiPot test, is the
level of leakage current that flows in response to the test voltage.
Which current is which?
When a meg test voltage is applied to the circuit under test, the initial current flowing from the
meter has three components: capacitance charging current, absorption current, and conduction
(leakage) current.
The capacitance charging current starts at a high level and drops rapidly as the capacitance between
the conductor under test and the reference conductor charges to the level of the applied voltage.
The absorption current represents the migration of electrons into the insulator material, where it is
loosely bound. This current should also drop shortly after the voltage is applied, when the insulation
has absorbed all the charge it can hold given its formulation and condition. Conduction (leakage)
current represents the movement of charge through or across the surfaces of the insulation under
test. If the insulation has good integrity, the capacitance charging and absorption currents decay
shortly after application of the test voltage, leaving a steady conduction current, which is of primary
interest in most meg testing applications.
The initial current surge that results from the capacitive and absorptive effects causes an initial dip
or under-shoot in the displayed value of insulation resistance. After these transient effects pass, the
meg test meter settles to a stable and higher value of insulation resistance. This dynamic is typically
not seen in ohmmeter tests because these meters lack the sensitivity of a meg tester.
Meg testers can also measure the insulation resistance at pre-chosen time intervals after the test
voltage is applied. These timed methods are beyond the scope of this guide but are well described in
the literature provided with commercial meg testers.
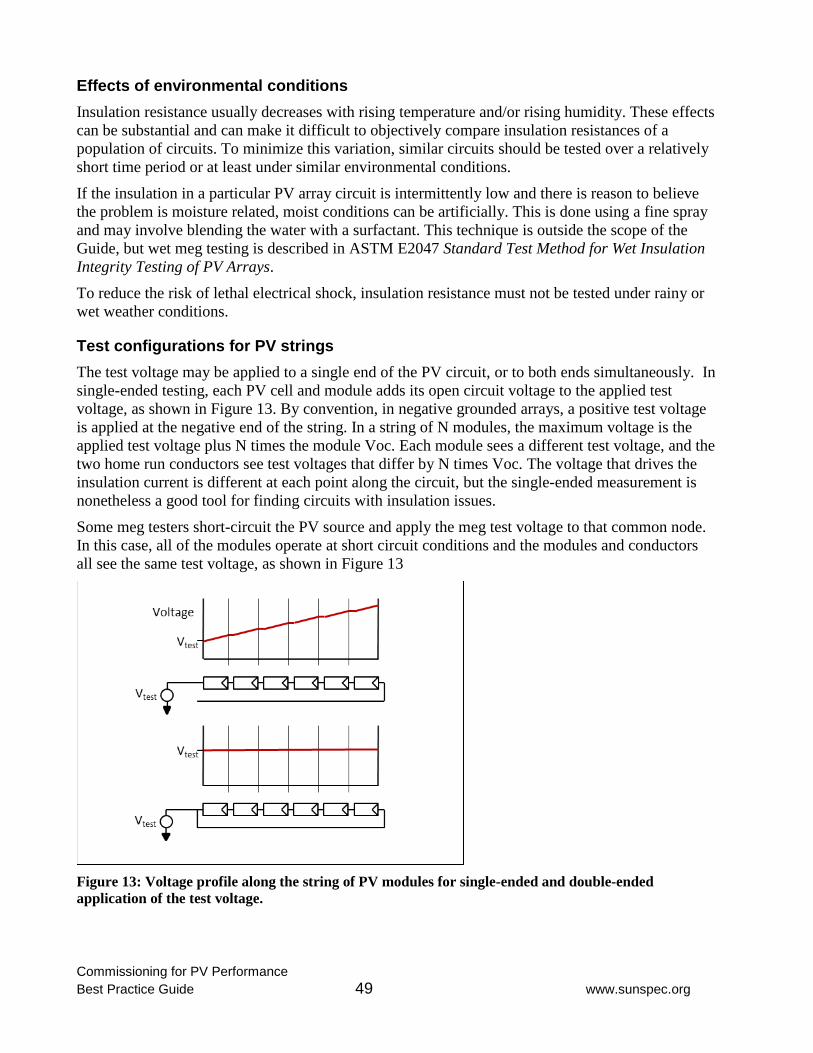
Commissioning for PV Performance
Best Practice Guide 49 www.sunspec.org
Effects of environmental conditions
Insulation resistance usually decreases with rising temperature and/or rising humidity. These effects
can be substantial and can make it difficult to objectively compare insulation resistances of a
population of circuits. To minimize this variation, similar circuits should be tested over a relatively
short time period or at least under similar environmental conditions.
If the insulation in a particular PV array circuit is intermittently low and there is reason to believe
the problem is moisture related, moist conditions can be artificially. This is done using a fine spray
and may involve blending the water with a surfactant. This technique is outside the scope of the
Guide, but wet meg testing is described in ASTM E2047 Standard Test Method for Wet Insulation
Integrity Testing of PV Arrays.
To reduce the risk of lethal electrical shock, insulation resistance must not be tested under rainy or
wet weather conditions.
Test configurations for PV strings
The test voltage may be applied to a single end of the PV circuit, or to both ends simultaneously. In
single-ended testing, each PV cell and module adds its open circuit voltage to the applied test
voltage, as shown in Figure 13. By convention, in negative grounded arrays, a positive test voltage
is applied at the negative end of the string. In a string of N modules, the maximum voltage is the
applied test voltage plus N times the module Voc. Each module sees a different test voltage, and the
two home run conductors see test voltages that differ by N times Voc. The voltage that drives the
insulation current is different at each point along the circuit, but the single-ended measurement is
nonetheless a good tool for finding circuits with insulation issues.
Some meg testers short-circuit the PV source and apply the meg test voltage to that common node.
In this case, all of the modules operate at short circuit conditions and the modules and conductors
all see the same test voltage, as shown in Figure 13
Figure 13: Voltage profile along the string of PV modules for single-ended and double-ended
application of the test voltage.
Commissioning for PV Performance
Best Practice Guide 50 www.sunspec.org
Test voltage level
The test voltage is the potential that the meg tester applies to the circuit under test when the ‘test’
button is pushed. Several factors should be considered when selecting a test voltage.
Are surge arresters installed in the circuits under test?
What is the rated voltage of the components (for example the PV modules)?
What are the module manufacturer’s limitations or recommendations for test voltage?
In the case of PV strings, will the test voltage be applied to one or both ends of the circuit?
Surge arresters
Surge arresters are used to protect the PV system circuits and components from damage due to
electrical transients from lightning or other causes. A meg tester is not capable of supplying
sufficient power to damage a surge arrester, but a surge arrester can easily interfere with a meg test.
As the sum of the applied test voltage and the modules’ Voc values approaches the surge arrester’s
rated voltage the surge arrester begins to conduct. The meg tester registers this increase in current as
a reduction in insulation resistance. To avoid this limitation, the options are to temporarily
disconnect the arresters or to choose a low enough test voltage that the arrester does not conduct.
Rated voltage of PV modules
PV modules are specified with a maximum system voltage. Back when the module was qual tested,
its insulation resistance was measured with a substantially higher voltage, but some module
manufacturers and operators prefer to limit the meg test voltage to the rated system voltage. For
example, consider a single-ended test of a PV string with Voc of 475V and a PV module maximum
system voltage spec of 1000V. Setting the meg tester’s test voltage to 500V will keep all points in
the circuit below 1000V.
Module manufacturers are not consistent in their guidance for choosing the test voltage, and in fact
some manufacturers recommend against meg testing their modules in the field, even if module
voltages are kept below the specified maximum system voltage. In rare cases, you may even find
that your warranty disallows insulation testing. If you experience what you believe to be overly-
restrictive guidance from your PV module manufacturer, it may be that your particular contact is
not actually familiar with the test or is not aware of the meg test voltages that their modules can
withstand.
Granularity
Meg testing should be performed on all AC and DC power conductors as well as the PV sources
(strings of PV modules). The term ‘granularity’ means the depth within a system that
measurements are performed. In the case of meg testing, it refers to the degree to which circuits are
broken down into sub-circuits for testing. More granular measurements provide deeper detail, but
require more labor. For example, measuring PV source circuits individually provides maximum
detail, but takes more time than measuring them as a parallel-connected group.
The choice of granularity should be driven primarily by the goal of revealing insulation resistance
issues, and secondarily by labor considerations. The drawback to measuring multiple circuits in
parallel is that we do not see the variation from circuit to circuit and may not detect one low
resistance string. Taking the concept of parallel testing to an extreme, meg testing a large PV array
Commissioning for PV Performance
Best Practice Guide 51 www.sunspec.org
from the feeder at the inverter would tell us nothing about the distribution of insulation resistance
values across the array and may ‘hide’ individual insulation issues.
Complicating the granularity decision is the fact that measuring individual conductors may require
lifting them from terminal blocks in order to electrically isolate them from neighboring circuits.
Disassembly and reassembly increases shock hazard, opens the door to workmanship problems, and
causes wear and tear on conductors.
4.3 Safety
Measuring PV source circuits exposes the operator to lethal shock and arc flash hazards (Shapiro,
Radibratovic, 2014). Personnel must be properly trained, equipped, and supervised. Safe work
practices, including the use of personal protective equipment (PPE), must be followed. Have a
detailed discussion of safety practices and equipment and the roles of all participants in the testing.
Specific requirements for worker safety are outside the scope of this document and are the
responsibility of the individuals and organizations involved in the project.
4.4 Making Insulation Resistance Measurements
This section outlines the steps for meg testing the ac and dc circuits of a typical commercial PV
system. The discussion covers:
PV source conductors
PV source circuit in a grounded array
PV source circuit in an ungrounded array
Sub-array (combiner box) in a grounded PV array
Sub-array (combiner box) in an ungrounded PV array
PV output circuit (from combiner to inverter)
AC output circuit (from inverter to service)
For each case a typical procedure is presented.
Preparing to test insulation resistance
These are points to consider as you plan your insulation resistance testing for any of the circuits
listed above.
Granularity Identify the granularity of your testing. What conductors can remain connected and be
measured as an extended electrical circuit? Keep in mind that any circuits that measure significantly
lower resistance than the rest of the population can later be broken down to individual conductor
runs and re-tested. Will the PV source circuit conductors be measured separately, or in series with
the PV modules? The choice is an important one, because the insulation resistance of the PV
modules is usually much lower than the resistance of the home run conductors and therefor tends to
‘hide’ variations in the insulation resistance of the conductors.
Test voltage Select your test voltage for each type of circuit to be tested. Consider any limitations
imposed by component maximum voltage specs and manufacturer recommendations, especially for
PV modules.

Commissioning for PV Performance
Best Practice Guide 52 www.sunspec.org
Environmental conditions Plan to test a given type of circuit under relatively uniform temperature
and humidity. This will provide the best basis for identifying unusually low resistance circuits.
Testing during array construction If the testing is integrated with final assembly of the array,
consider measuring individual source circuits before landing their grounded conductors. This can
save time and avoid introducing workmanship issues related to un-landing and re-landing
conductors.
Equipment grounding conductors Inspect the system to verify that the equipment grounding
conductor is properly installed.
Required equipment and materials
The following items are required:
Personal Protective Equipment (PPE) and lockout/tagout gear
Meg tester
Means of recording results
Documentation of the PV system electrical circuits
Basic test procedure
Regardless of the type of circuit being tested, the following steps generally apply:
Isolate the circuit from other sources of electrical power and from circuits that are not part of
the defined test circuit.
Disconnect surge arresters or select a test voltage that is low enough to keep the maximum
circuit voltage well below the level at which the arrester begins conducting. If you are
testing PV strings single-endedly, remember that the string’s open circuit voltage adds to the
applied test voltage.
Check the integrity of the test leads by inspection and by performing an insulation resistance
test with no test circuit connected to the leads.
Connect the test leads to the circuit under test.
If the meg tester indicates stored charge, wait until the instrument discharges the circuit
before performing the test.
Apply the test voltage.
Wait till the resistance measurement value settles
Read and record the insulation resistance.
Overview of procedures for meg testing the PV array
Procedures for meg testing the PV array must take into account these factors:
Will the PV strings be tested single-ended or short-circuited?
If testing is single-ended, will the PV strings be tested individually or connected in parallel?
Is the PV system grounded or ungrounded? In un-grounded systems, both ends of the PV
source circuit are fused, making it easy to electrically isolate source circuits from one
another.
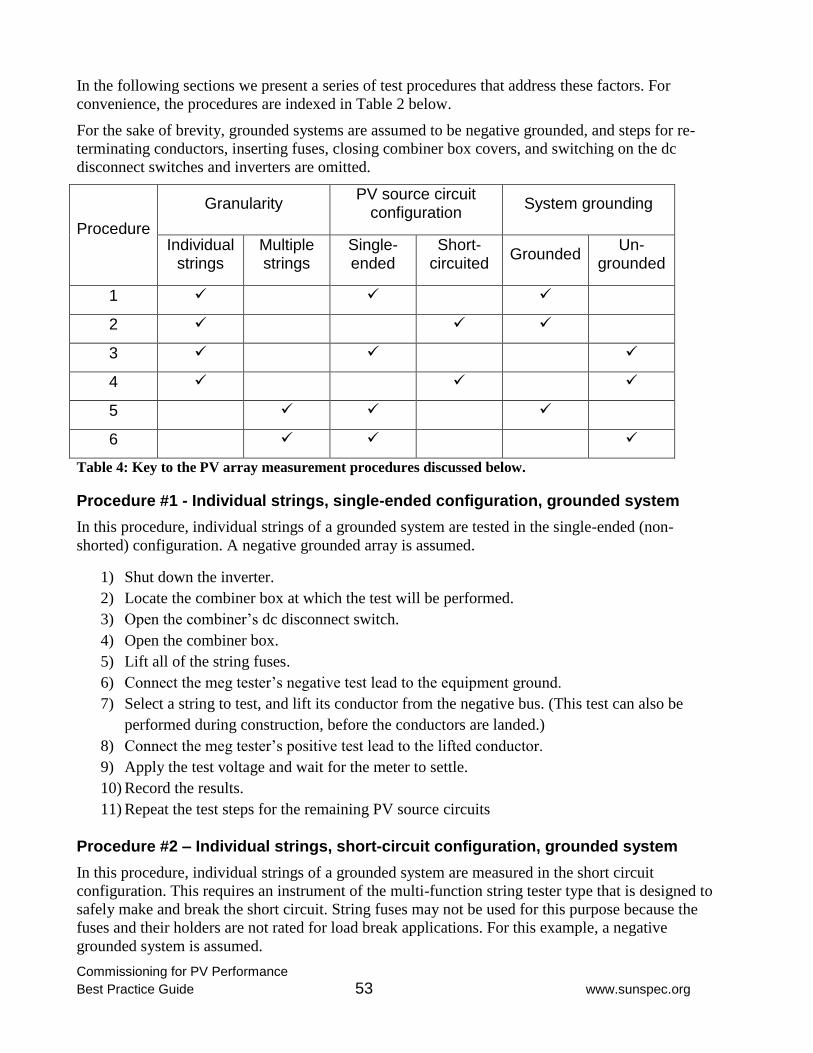
Commissioning for PV Performance
Best Practice Guide 53 www.sunspec.org
In the following sections we present a series of test procedures that address these factors. For
convenience, the procedures are indexed in Table 2 below.
For the sake of brevity, grounded systems are assumed to be negative grounded, and steps for re-
terminating conductors, inserting fuses, closing combiner box covers, and switching on the dc
disconnect switches and inverters are omitted.
Procedure
Granularity PV source circuit
configuration System grounding
Individual strings
Multiple strings
Single-ended
Short-circuited
Grounded Un-
grounded
1
2
3
4
5
6
Table 4: Key to the PV array measurement procedures discussed below.
Procedure #1 - Individual strings, single-ended configuration, grounded system
In this procedure, individual strings of a grounded system are tested in the single-ended (non-
shorted) configuration. A negative grounded array is assumed.
1) Shut down the inverter.
2) Locate the combiner box at which the test will be performed.
3) Open the combiner’s dc disconnect switch.
4) Open the combiner box.
5) Lift all of the string fuses.
6) Connect the meg tester’s negative test lead to the equipment ground.
7) Select a string to test, and lift its conductor from the negative bus. (This test can also be
performed during construction, before the conductors are landed.)
8) Connect the meg tester’s positive test lead to the lifted conductor.
9) Apply the test voltage and wait for the meter to settle.
10) Record the results.
11) Repeat the test steps for the remaining PV source circuits
Procedure #2 – Individual strings, short-circuit configuration, grounded system
In this procedure, individual strings of a grounded system are measured in the short circuit
configuration. This requires an instrument of the multi-function string tester type that is designed to
safely make and break the short circuit. String fuses may not be used for this purpose because the
fuses and their holders are not rated for load break applications. For this example, a negative
grounded system is assumed.
Commissioning for PV Performance
Best Practice Guide 54 www.sunspec.org
1) Shut down the inverter.
2) Locate the combiner box at which the test will be performed.
3) Open the combiner’s dc disconnect switch.
4) Open the combiner box.
5) Lift the fuses for all strings.
6) Lift and cap off the positive feeder (combiner output) conductor.
7) Connect the test lead of the multi-function string tester to the positive bus, observing correct
polarities.
8) Insert the first string fuse.
9) Lift that string’s negative conductor from its bus bar.
10) Connect the other test lead of the multi-function string tester to the lifted conductor.
11) Apply the test voltage to the string negative and wait for the result.
12) Record the results.
13) Lift the tested string’s fuse.
14) Re-terminate the string’s negative conductor at its bus.
15) Repeat the test steps for the remaining negative PV output conductors.
Procedure #3 - Individual strings, single-ended configuration, ungrounded system
In this procedure, individual strings of an ungrounded system are tested in the single-ended (non-
shorted) configuration. Both ends of the PV source circuits are fused, allowing them to be
electrically isolated from one another at both ends.
1) Shut down the inverter.
2) Locate the combiner box at which the test will be performed.
3) Open the combiner’s dc disconnect switch.
4) Open the combiner box.
5) Lift both fuses for all strings.
6) Connect the meg tester’s negative test lead to the equipment ground.
7) Select a string to test, and touch the meg tester’s positive test probe to the negative
conductor, using the fuse terminal as your test point.
8) Apply the test voltage and wait for the meter to settle.
9) Record the results.
10) Repeat the test steps for the remaining PV source circuits
Procedure #4 – Individual strings, short-circuit configuration, ungrounded system
In this procedure, individual strings of an ungrounded system are measured in the short circuit
configuration. This requires an instrument of the multi-function string tester type that is designed to
safely make and break the short circuit. In an ungrounded system, both ends of the string are fused,
and the fuses can be used to electrically isolate the strings from one another and the feeder circuit
for the purposes of meg testing. However, the string fuses may not be used for this purpose because
the fuses and their holders are not rated for load break applications.
1) Shut down the inverter.

Commissioning for PV Performance
Best Practice Guide 55 www.sunspec.org
2) Locate the combiner box at which the test will be performed.
3) Open the combiner’s dc disconnect switch.
4) Open the combiner box.
5) Lift the fuses for all strings.
6) Touch the test probes of the multi-function string tester to the supply-side fuse terminals at
which the first string is terminated, observing correct polarity.
7) Trigger the measurement.
8) Record the result.
9) Repeat the process for the remaining strings.
Procedure #5 – Multiple strings, single-ended configuration, grounded system
In this procedure, all of the strings in the combiner box of a grounded system are tested at once in
the single-ended configuration. For this discussion, a negative grounded system is assumed.
1) Shut down the inverter.
2) Locate the combiner box at which the test will be performed.
3) Open the combiner’s dc disconnect switch.
4) Open the combiner box.
5) Lift all of the string fuses.
6) Lift the feeder (combiner output) conductor from the negative bus and cap it off. This leaves
the string negatives interconnected at their bus but electrically isolated from the rest of the
PV system.
7) Connect the meg tester’s negative test lead to the equipment ground.
8) Connect the meg tester’s positive test lead to the negative bus.
9) Apply the test voltage and wait for the meter to settle.
10) Record the results.
Procedure #6 – Multiple strings, single-ended configuration, ungrounded system
In this procedure, all of the strings in the combiner box of an ungrounded system are meg tested in
parallel, in the single-ended configuration. Note that this procedure involves lifting the negative
feeder. This is time-consuming, causes wear and tear, and can introduce workmanship problems.
Consider measuring the strings individually (procedure #3 or #4).
1) Shut down the inverter.
2) Locate the combiner box at which the test will be performed.
3) Open the combiner’s dc disconnect switch.
4) Open the combiner box.
5) Lift all of the positive conductor fuses. Leave the negative conductor fuses installed.
6) Lift the negative feeder (combiner output) conductor and cap it off. This leaves the string
negatives interconnected at their bus but electrically isolated from the rest of the system.
7) Connect the meg tester’s negative lead to the equipment ground.
8) Connect the meg tester’s positive test lead to the negative bus.
9) Apply the test voltage and wait for the meter to settle.
Commissioning for PV Performance
Best Practice Guide 56 www.sunspec.org
10) Record the results.
Procedures for meg testing PV source circuit conductors (without PV modules)
PV modules typically leak much more current than the home run conductor insulation, unless the
conductors are damaged. This can hide the variation of insulation resistance of the conductors. To
avoid this limitation, it is common to test the home run conductors separately.
It is most convenient to test the home run conductors late in the array construction process. Be sure
the testing is done after clamping the modules in place, because pinched wiring is a leading cause of
damaged conductor insulation.
Alternatively, the conductors can be tested after final assembly. In ungrounded systems, this is
convenient because both conductors of each string are fused; just lift all of the fuses to isolate the
conductors from one another for testing. In grounded systems, you have the choice of un-landing
the individual conductors, or measuring the conductors as a group by applying the test voltage to
their respective bus, after lifting the feeder (combiner output) conductors.
In this example we test multiple strings connected in parallel, in a negative grounded array.
1) Shut down the inverter.
2) Locate the combiner box at which the test will be performed.
3) Open the combiner’s dc disconnect switch.
4) Open the combiner box.
5) Lift all of the positive conductor fuses.
6) Unplug the home run conductors from the PV modules.
7) Lift the negative feeder (combiner output) conductor and cap it off.
8) Lift the positive feeder (combiner output) conductor and cap it off.
9) Re-insert all of the fuses.
10) Connect the meg tester’s negative test lead to the equipment ground in the combiner box.
11) Connect the meg tester’s positive test lead to the negative bus.
12) Apply the test voltage and wait for the meter to settle.
13) Record the results.
14) Connect the meg tester’s positive test lead to the positive bus.
15) Apply the test voltage and wait for the meter to settle.
16) Record the results.
17) Lift all of the fuses
18) Re-land the feeder conductors.
19) Re-connect the home run conductors to the PV modules.
Lifting the positive feeder conductor can be avoided if the positive conductors are tested
individually by lifting their fuses and applying the test voltage at the fuse holders’ supply side
terminals. To test the negative home run conductors individually requires lifting them from their
bus.
In this example we test individual home run conductors in an ungrounded system.
Commissioning for PV Performance
Best Practice Guide 57 www.sunspec.org
1) Shut down the inverter.
2) Locate the combiner box at which the test will be performed.
3) Open the combiner’s dc disconnect switch.
4) Open the combiner box.
5) Lift all of the positive and negative conductor fuses.
6) Unplug the home run conductors from the PV modules.
7) Connect the meg tester’s negative test lead to the equipment ground.
8) Touch the meg tester’s positive test probe to a home run conductor at its fuse terminal.
9) Apply the test voltage and wait for the meter to settle.
10) Record the results.
11) Repeat the process for the remaining positive and negative home run conductors.
Procedure for meg testing dc feeder (combiner output) conductors
It is more convenient to meg test the feeder conductors before they are landed - otherwise
disassembly and reassembly is required. In this example, we meg test before either end of the feeder
conductor is landed.
1) Cap off the feeder conductors at the combiner boxes.
2) At the inverter (or recombiner), connect the meg tester’s negative test lead to the equipment
ground.
3) Connect the meg tester’s positive test lead to a feeder conductor.
4) Apply the test voltage and wait for the meter to settle.
5) Record the results.
6) Repeat the process for the remaining feeder conductors.
If the design of the system allows lifting the conductors between the recombiner and inverter, you
can also test the feeders in parallel connected groups by applying the test voltage to the respective
bus.
Meg testing inverter output conductors
The process for meg testing the inverter AC output conductors is similar to the process for DC
feeder conductors, described above. Disconnect both ends of each conductor and apply the test
voltage between equipment ground and the conductor under test.
4.5 Analyzing and Reporting Meg Test Data
Absolute test limits
The poorly understood dependence of insulation resistance on temperature and humidity makes it
difficult to set absolute pass/fail limits with a high degree of confidence. If the limit is set too high,
all the circuits will pass, but important variations in the data may go unexamined. For this reason,
even if an absolute limit is used, it is also important to examine the variation itself. Some guidance
on absolute test limits is given in IEC62446.
Commissioning for PV Performance
Best Practice Guide 58 www.sunspec.org
Relative test limits
Another way to evaluate test results is to look for outliers in a population of measurements taken on
a single type of circuit, under similar conditions of temperature and humidity. Insulation resistance
values should fall in a roughly bell-shaped distribution. Outliers can be flagged for troubleshooting.
Figure 14: Distributions of insulation resistance measurement data for populations of PV source
circuits.
Reporting your results
The commissioning report should include the following data for each circuit tested:
Identity of the circuit
Measured resistance value
Test voltage
Ambient temperature (approximate)
Humidity (approximate)
Date
Time of day
The commissioning report should also include the following background information:
Brand and model of the meg tester
Description of the temperature measurement method or source
Description of the humidity measurement method or source
It is a best practice to segregate the analysis and reporting based on type of circuit tested, and to
include a statistical summary of the insulation resistance values for each population. These metrics
are helpful:
Histogram (frequency distribution) of data values
Maximum value
Minimum value
Mean value
Standard deviation (a measure of spread in the data)
Still looking for blocks of meg test data for this figure.
Commissioning for PV Performance
Best Practice Guide 59 www.sunspec.org
4.6 Test Equipment Considerations
The meg tester should offer a range of test voltages for flexibility in testing different module
technologies and accommodating module manufacturers’ guidance with respect to maximum meg
test voltage. The maximum test voltage should be at least 500V and preferably 1000V. The
minimum test voltage should be 100V or preferably 50V. Meg testers are usually capable of
sourcing only a few thousandths of an amp to the circuit under test. The option of applying low test
voltages allows you to troubleshoot degraded insulation without exceeding the meter’s current limit.
The meg tester should include a test probe with a ‘test’ control button built into the body of the
probe, for situations that require probing rather than alligator clips. An example is meg testing PV
source circuits at fuse terminals in ungrounded systems. Most full-featured meg testers have this
feature.
The meg tester must be capable of single-point resistance measurements, but most full-featured meg
testers will also be capable of timed measurements. These may be especially useful as systems age
and insulation deteriorates.
Some multi-function testers or string checkers include the meg testing capability. The guidance
above regarding maximum measurable resistance and range of test voltages applies as well to these
instruments. It is also important to understand how and when the various test functions will be
applied, particularly in the case of instruments in which the various functions are automatically
sequenced.
4.7 References
Standards documents
ASTM E2047 Standard Test Method for Wet Insulation Integrity Testing of PV Arrays, ASTM
International, West Conshohocken, PA, www.astm.org
Brooks, Bill. “The Bakersfield Fire: A Lesson in Ground-Fault Protection”. SolarPro, Issue 4.2
(2011).
Grid connected photovoltaic systems – Minimum requirements for system documentation,
commissioning tests and inspection. IEC Standard 62446. Geneva, Switzerland:
International Electrotechnical Commission, 2009.
Haney, J., Burstein, A.,PV System Operation And Maintenance Fundamentals. Solar America
Board for Codes and Standard, 2013.
4.8 Contributors
We thank these organizations for contributing to the development of this chapter:
SMA America
UL
Megger
Solmetric
Centrosolar
San Jose State University
SunSpec Alliance
Commissioning for PV Performance
Best Practice Guide 60 www.sunspec.org
5. INFRARED IMAGING
5.1 Introduction
Infrared (IR) imaging (aka thermal imaging) reveals the thermal processes at work in PV modules
and other system components, locating regions of abnormally high temperature caused by poor
electrical connections or defective PV cells. IR imaging also finds cell groups, strings, and sub-
arrays that are not producing power and therefore run slightly warmer than their neighbors.
Performing infrared imaging at the time of commissioning – and resolving the issues it uncovers –
increases the likelihood that the system will perform as intended right from the start, allowing more
meaningful analysis of plant production and reducing the early O&M burden.
IR imaging is included as an optional measurement in IEC62446 - Minimum requirements for
system documentation, commissioning tests and inspection of grid connected photovoltaic systems.
The authors in this Guide consider it an essential step for commissioning inverters, combiners, and
other devices where circuits are terminated. IR imaging is also an essential tool for O&M work, and
is included as a diagnostic technique for low performance in the SolarABCs report PV System
Operations and Maintenance Fundamentals.
The IR camera is also an important companion to the I-V curve tracer. A module or string that has
thermal anomalies can be I-V curve traced to quantify the performance impact. Conversely, when I-
V curve tracing has identified an underperforming PV circuit, IR imaging can be helpful in locating
the problem module or interconnection.
5.2 How Infrared Imaging Works
Infrared radiation is generated by the motion or vibration of charged particles in matter. Higher
temperatures generate more particle motion and thus more radiation. IR cameras are typically
sensitive to radiation in the 8-14 micron wavelength range of the electromagnetic spectrum. IR
images are typically color coded to represent temperature. The temperature span can be adjusted.
Infrared imaging detects surface temperature. Since different types of surfaces have different
abilities to emit infrared radiation – a property called emissivity – a calibrated temperature
measurement is possible only if the emissivity control of the IR camera is adjusted to match the
emissivity of the surface. Values of emissivity range from 1.0 for a flat black surface to less than 0.1
for polished aluminum or steel. Most IR cameras are shipped with a default emissivity setting of
0.95, and many instruments provide a means to adjust the emissivity setting according to the surface
being measured.
Infrared imaging differs from electroluminescence imaging, which is used in laboratories and
occasionally in the field to identify defects in PV cells. Electroluminescence is radiation-generated
by the recombination (mutual annihilation) of positive and negative charges. It is the principle
behind the light emitting diode, and the leading loss mechanism in PV cells. In the PV application
of EL imaging, current is forced through the PV cells or modules in the ‘reverse’ direction relative
to normal cell operation, which is the ‘forward’ direction when we think of the PV cells as diodes or
light-emitting diodes. This requires a high-voltage, high-current DC power supply. Field
measurements are typically done at night or at twilight, to achieve best sensitivity and resolution.
EL imaging is a very sensitive method for finding cell-level defects, but is not performed during
commissioning.
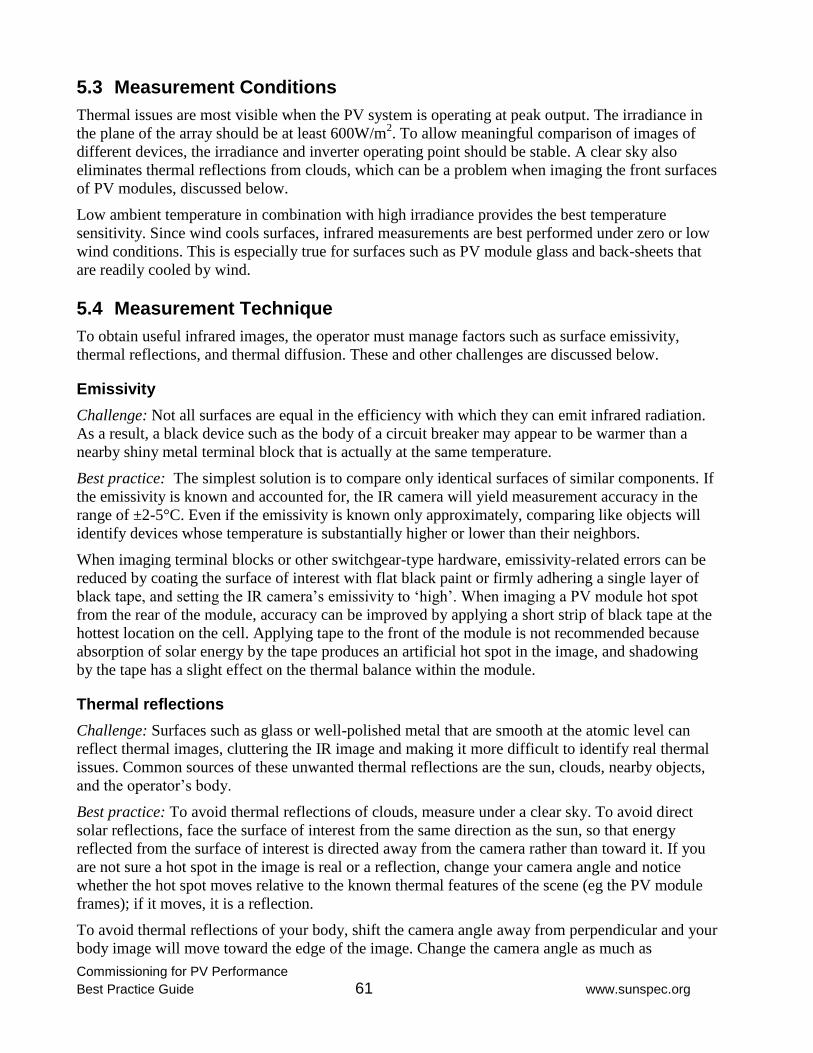
Commissioning for PV Performance
Best Practice Guide 61 www.sunspec.org
5.3 Measurement Conditions
Thermal issues are most visible when the PV system is operating at peak output. The irradiance in
the plane of the array should be at least 600W/m2. To allow meaningful comparison of images of
different devices, the irradiance and inverter operating point should be stable. A clear sky also
eliminates thermal reflections from clouds, which can be a problem when imaging the front surfaces
of PV modules, discussed below.
Low ambient temperature in combination with high irradiance provides the best temperature
sensitivity. Since wind cools surfaces, infrared measurements are best performed under zero or low
wind conditions. This is especially true for surfaces such as PV module glass and back-sheets that
are readily cooled by wind.
5.4 Measurement Technique
To obtain useful infrared images, the operator must manage factors such as surface emissivity,
thermal reflections, and thermal diffusion. These and other challenges are discussed below.
Emissivity
Challenge: Not all surfaces are equal in the efficiency with which they can emit infrared radiation.
As a result, a black device such as the body of a circuit breaker may appear to be warmer than a
nearby shiny metal terminal block that is actually at the same temperature.
Best practice: The simplest solution is to compare only identical surfaces of similar components. If
the emissivity is known and accounted for, the IR camera will yield measurement accuracy in the
range of ±2-5°C. Even if the emissivity is known only approximately, comparing like objects will
identify devices whose temperature is substantially higher or lower than their neighbors.
When imaging terminal blocks or other switchgear-type hardware, emissivity-related errors can be
reduced by coating the surface of interest with flat black paint or firmly adhering a single layer of
black tape, and setting the IR camera’s emissivity to ‘high’. When imaging a PV module hot spot
from the rear of the module, accuracy can be improved by applying a short strip of black tape at the
hottest location on the cell. Applying tape to the front of the module is not recommended because
absorption of solar energy by the tape produces an artificial hot spot in the image, and shadowing
by the tape has a slight effect on the thermal balance within the module.
Thermal reflections
Challenge: Surfaces such as glass or well-polished metal that are smooth at the atomic level can
reflect thermal images, cluttering the IR image and making it more difficult to identify real thermal
issues. Common sources of these unwanted thermal reflections are the sun, clouds, nearby objects,
and the operator’s body.
Best practice: To avoid thermal reflections of clouds, measure under a clear sky. To avoid direct
solar reflections, face the surface of interest from the same direction as the sun, so that energy
reflected from the surface of interest is directed away from the camera rather than toward it. If you
are not sure a hot spot in the image is real or a reflection, change your camera angle and notice
whether the hot spot moves relative to the known thermal features of the scene (eg the PV module
frames); if it moves, it is a reflection.
To avoid thermal reflections of your body, shift the camera angle away from perpendicular and your
body image will move toward the edge of the image. Change the camera angle as much as
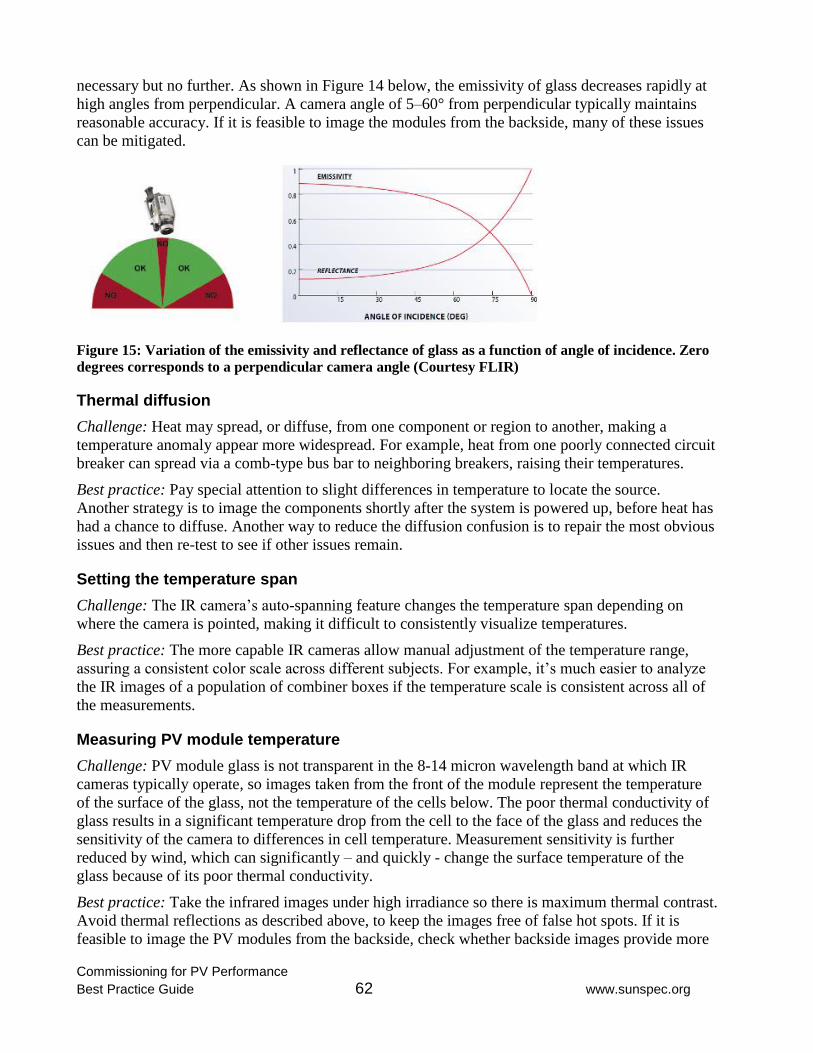
Commissioning for PV Performance
Best Practice Guide 62 www.sunspec.org
necessary but no further. As shown in Figure 14 below, the emissivity of glass decreases rapidly at
high angles from perpendicular. A camera angle of 5–60° from perpendicular typically maintains
reasonable accuracy. If it is feasible to image the modules from the backside, many of these issues
can be mitigated.
Figure 15: Variation of the emissivity and reflectance of glass as a function of angle of incidence. Zero
degrees corresponds to a perpendicular camera angle (Courtesy FLIR)
Thermal diffusion
Challenge: Heat may spread, or diffuse, from one component or region to another, making a
temperature anomaly appear more widespread. For example, heat from one poorly connected circuit
breaker can spread via a comb-type bus bar to neighboring breakers, raising their temperatures.
Best practice: Pay special attention to slight differences in temperature to locate the source.
Another strategy is to image the components shortly after the system is powered up, before heat has
had a chance to diffuse. Another way to reduce the diffusion confusion is to repair the most obvious
issues and then re-test to see if other issues remain.
Setting the temperature span
Challenge: The IR camera’s auto-spanning feature changes the temperature span depending on
where the camera is pointed, making it difficult to consistently visualize temperatures.
Best practice: The more capable IR cameras allow manual adjustment of the temperature range,
assuring a consistent color scale across different subjects. For example, it’s much easier to analyze
the IR images of a population of combiner boxes if the temperature scale is consistent across all of
the measurements.
Measuring PV module temperature
Challenge: PV module glass is not transparent in the 8-14 micron wavelength band at which IR
cameras typically operate, so images taken from the front of the module represent the temperature
of the surface of the glass, not the temperature of the cells below. The poor thermal conductivity of
glass results in a significant temperature drop from the cell to the face of the glass and reduces the
sensitivity of the camera to differences in cell temperature. Measurement sensitivity is further
reduced by wind, which can significantly – and quickly - change the surface temperature of the
glass because of its poor thermal conductivity.
Best practice: Take the infrared images under high irradiance so there is maximum thermal contrast.
Avoid thermal reflections as described above, to keep the images free of false hot spots. If it is
feasible to image the PV modules from the backside, check whether backside images provide more
Commissioning for PV Performance
Best Practice Guide 63 www.sunspec.org
useful images. If absolute temperature values are required, firmly apply black tape to the backside
location being imaged.
Challenge: The temperature pattern changes when the camera or the operator’s body shadows the
module(s) under test.
Best practice: Shading of a module changes its electrical operating point and upsets the normal
temperature pattern. It is a good example of a measurement changing the property being measured.
To avoid this, position the operator and camera to eliminate shadowing of any of the modules being
imaged.
Challenge: Soiling and debris are warmed by the sun, creating hot spots in the thermal image.
Best practice: Before starting the serious imaging, explore the causes of apparent hot spots.
Correlate them with blotches of dirt, bird droppings, or tree litter. Take sample images of these
known effects for reference later when evaluating other images.
Setting limits for acceptable temperature
Challenge: What surface temperatures are acceptable?
Best practice: The answer has two parts. Assuming that the IR camera is adjusted for the emissivity
of the surface and the other best practices are followed, temperature can be measured with accuracy
in the neighborhood of 2-5 °C. To determine whether that temperature is acceptable for a given
component, refer to the component’s specified operating temperature limits. For example, circuit
breakers and fuse holders have specifications for the maximum temperatures of conductors at their
terminals.
The second part of the answer deals with the variation of temperature across the population of
similar devices. A device with abnormally high relative temperature should be investigated even if
its absolute temperature is within the component specifications, because the elevated temperature
may represent the early stages of an emerging thermal problem.
5.5 Procedure
Safety
Measuring AC and DC power circuits exposes the operator to lethal shock and arc flash hazards
(Shapiro, Radibratovic, 2014). Personnel must be properly trained, equipped, and supervised. Safe
work practices, including the use of personal protective equipment (PPE), must be followed.
Specific requirements for worker safety are outside the scope of this document and are the
responsibility of the individuals and organizations involved in the project.
Operating conditions
Perform measurements with the system operating as close as possible to full power. Record the
inverter AC output power at the beginning and end of each measurement session.
Infrared camera settings
Set the camera in the auto-scale mode, set the emissivity to 0.95, and set the temperature units to
Celsius. Select the Rainbow or Iron color palette.
Commissioning for PV Performance
Best Practice Guide 64 www.sunspec.org
Positioning and focusing the camera
Position the camera to capture the enclosure, interconnection, or PV module(s) of interest. If the
camera features manual focus, adjust the focus for best detail.
When imaging PV modules, select the distance and camera angle to avoid thermal reflections of the
operator, sun, or other objects. Also avoid shadowing the module(s) being imaged.
Imaging the array
Using the camera in an autoscale mode, survey the array and note the location of hot spots. Also
note the location of strings/modules/cell groups that are slightly warmer than their neighbors, which
indicates that they may be open circuited or bypassed. Measurements can be taken from the front or
back of the array, or both; the decision is based on physical access and which view affords the best
combination of thermal sensitivity and freedom from confusing artifacts, such as thermal reflections
and artificial hot spots caused by soiling.
After the survey of the array, return to the noted hot spots for more detailed measurements. Select a
fixed temperature span that is wide enough to cover the types of issues observed during the survey,
so that it will be easier to compare your images later. Take images at each location. For each
infrared image, record likely causes and recommended follow-up actions (e.g. clean modules and
re-test, measure performance using I-V curve tracing, re-image a year later, replace module, etc).
Also record the image’s physical location in the site and electrical location in the hierarchy of the
system.
Imaging other system components
Image all other terminating hardware including junction boxes, conductors, combiners, inverter
inputs, service panels, circuit breakers, sub-panels, and so on. Look for hot spots that may indicate
poor connections or failing components. It may be helpful to perform an initial survey with the IR
camera in auto-spanning mode, and then select a narrower fixed span appropriate to the
temperatures you observed in the survey. Use this fixed span for the detailed measurements you
save. Given the wide range of emissivity of system components, care should be taken to optimize
absolute temperature accuracy. See the methods described in Measurement Technique / Emissivity.
For each infrared image, record likely causes and recommended follow-up actions. Also record the
image’s physical location in the site and electrical location in the hierarchy of the system.
5.6 Reporting Infrared Imaging Results
The infrared imaging report should contain the following:
Short introduction identifying the types of components that were imaged and the coverage
factor that is, the percentage of the population that was IR image. 100% is recommended.
Infrared images of all devices measured, labeled with their time and date, physical location
in the site, and electrical location in the hierarchy of the system. Include visible light
photographs where necessary to establish context or identify the hardware being tested.
Discussion of any abnormally hot or cool areas, clearly referenced to the images and
location in the system. In the case of problem PV modules, also record the physical location
in the array.
Operating condition under which the images were collected, including the irradiance and the
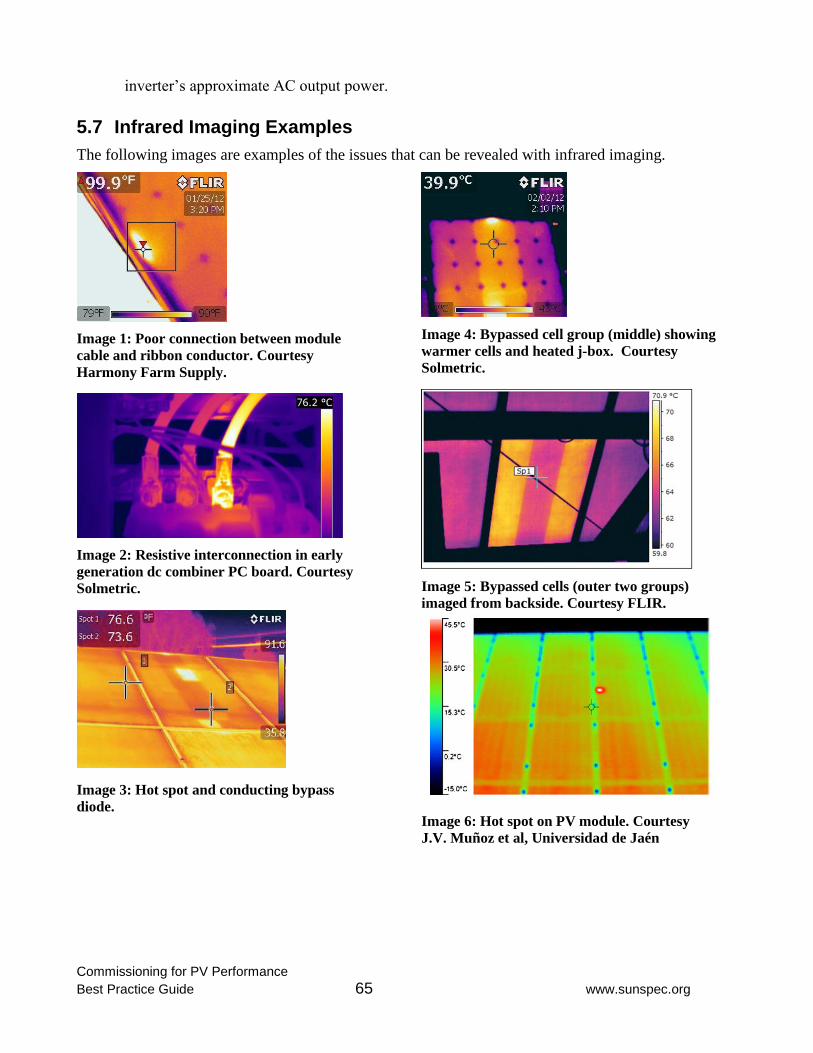
Commissioning for PV Performance
Best Practice Guide 65 www.sunspec.org
inverter’s approximate AC output power.
5.7 Infrared Imaging Examples
The following images are examples of the issues that can be revealed with infrared imaging.
Image 1: Poor connection between module
cable and ribbon conductor. Courtesy
Harmony Farm Supply.
Image 2: Resistive interconnection in early
generation dc combiner PC board. Courtesy
Solmetric.
Image 3: Hot spot and conducting bypass
diode.
Image 4: Bypassed cell group (middle) showing
warmer cells and heated j-box. Courtesy
Solmetric.
Image 5: Bypassed cells (outer two groups)
imaged from backside. Courtesy FLIR.
Image 6: Hot spot on PV module. Courtesy
J.V. Muñoz et al, Universidad de Jaén
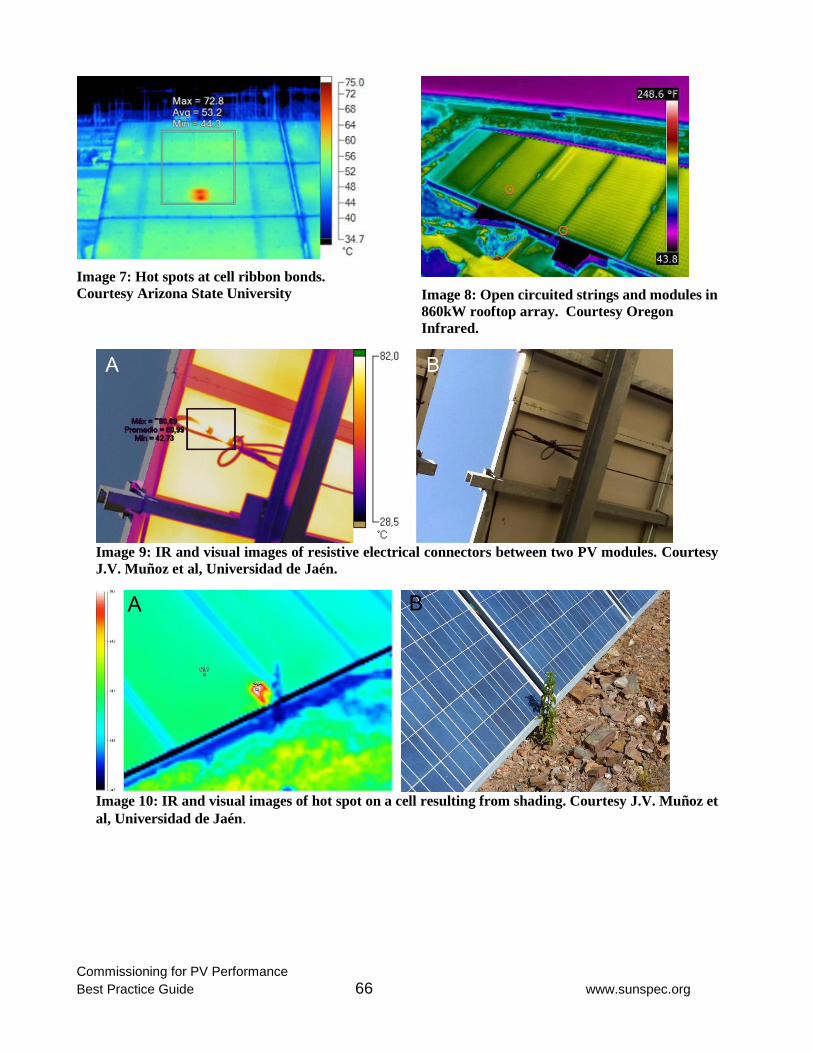
Commissioning for PV Performance
Best Practice Guide 66 www.sunspec.org
Image 7: Hot spots at cell ribbon bonds.
Courtesy Arizona State University
Image 8: Open circuited strings and modules in
860kW rooftop array. Courtesy Oregon
Infrared.
Image 9: IR and visual images of resistive electrical connectors between two PV modules. Courtesy
J.V. Muñoz et al, Universidad de Jaén.
Image 10: IR and visual images of hot spot on a cell resulting from shading. Courtesy J.V. Muñoz et
al, Universidad de Jaén.
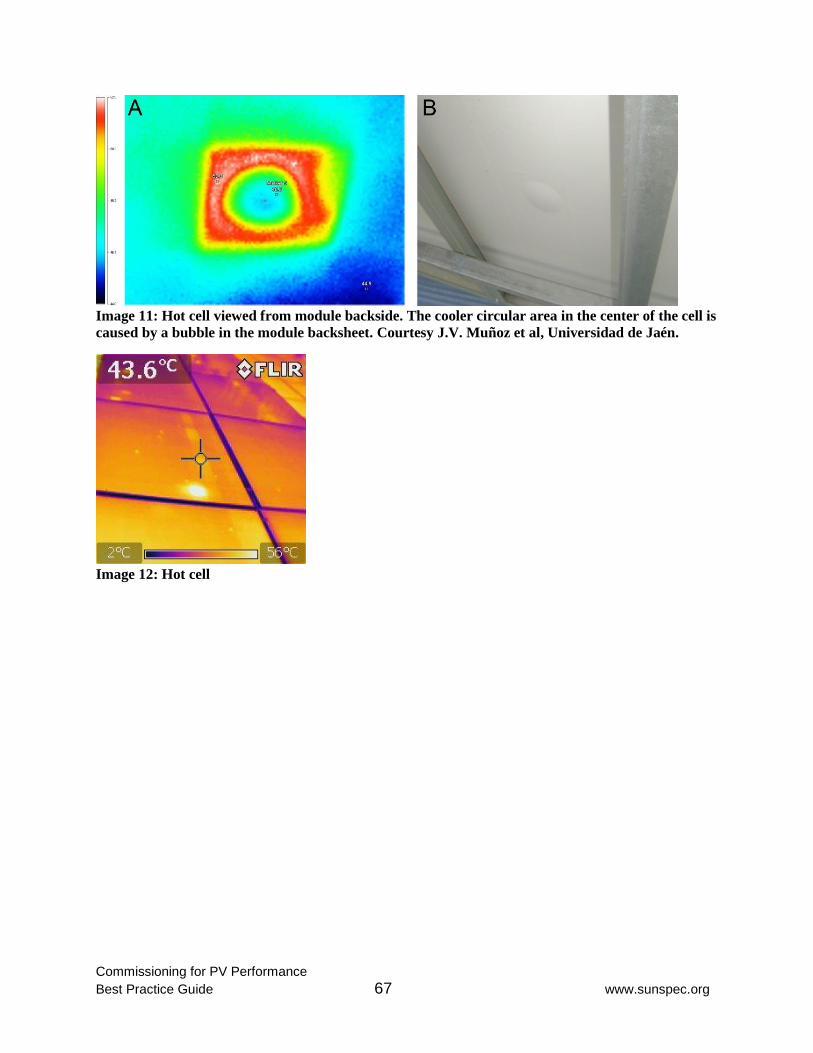
Commissioning for PV Performance
Best Practice Guide 67 www.sunspec.org
Image 11: Hot cell viewed from module backside. The cooler circular area in the center of the cell is
caused by a bubble in the module backsheet. Courtesy J.V. Muñoz et al, Universidad de Jaén.
Image 12: Hot cell
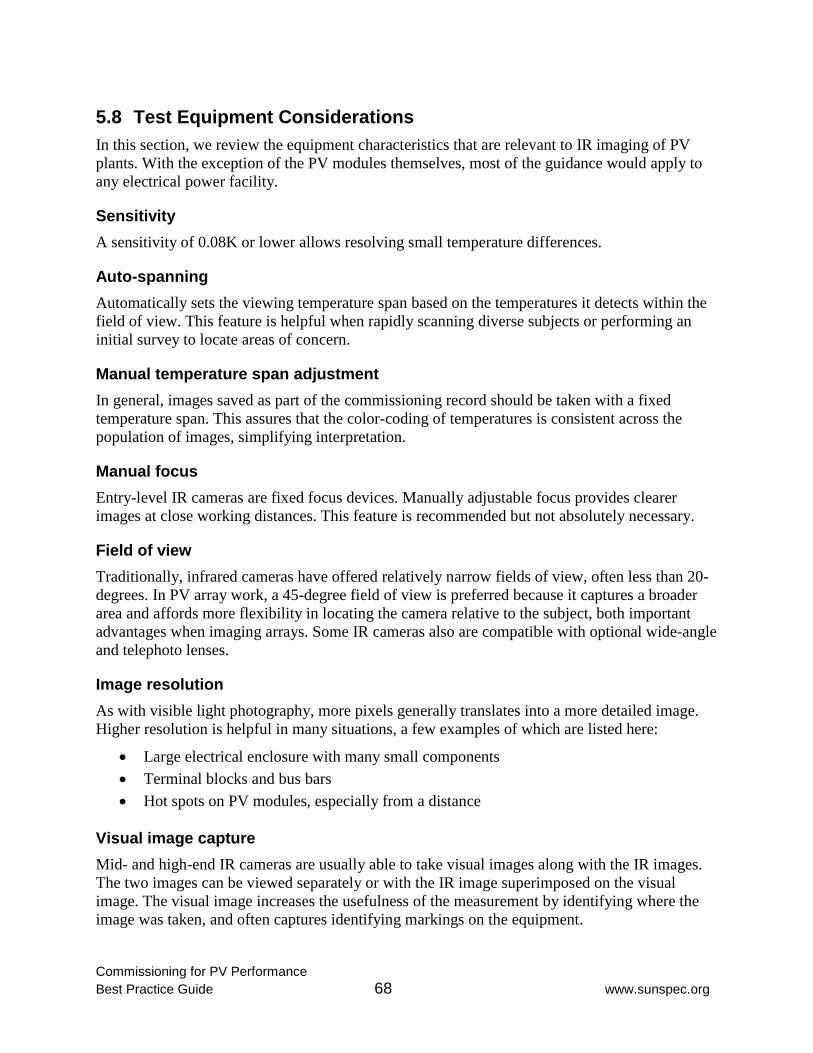
Commissioning for PV Performance
Best Practice Guide 68 www.sunspec.org
5.8 Test Equipment Considerations
In this section, we review the equipment characteristics that are relevant to IR imaging of PV
plants. With the exception of the PV modules themselves, most of the guidance would apply to
any electrical power facility.
Sensitivity
A sensitivity of 0.08K or lower allows resolving small temperature differences.
Auto-spanning
Automatically sets the viewing temperature span based on the temperatures it detects within the
field of view. This feature is helpful when rapidly scanning diverse subjects or performing an
initial survey to locate areas of concern.
Manual temperature span adjustment
In general, images saved as part of the commissioning record should be taken with a fixed
temperature span. This assures that the color-coding of temperatures is consistent across the
population of images, simplifying interpretation.
Manual focus
Entry-level IR cameras are fixed focus devices. Manually adjustable focus provides clearer
images at close working distances. This feature is recommended but not absolutely necessary.
Field of view
Traditionally, infrared cameras have offered relatively narrow fields of view, often less than 20-
degrees. In PV array work, a 45-degree field of view is preferred because it captures a broader
area and affords more flexibility in locating the camera relative to the subject, both important
advantages when imaging arrays. Some IR cameras also are compatible with optional wide-angle
and telephoto lenses.
Image resolution
As with visible light photography, more pixels generally translates into a more detailed image.
Higher resolution is helpful in many situations, a few examples of which are listed here:
Large electrical enclosure with many small components
Terminal blocks and bus bars
Hot spots on PV modules, especially from a distance
Visual image capture
Mid- and high-end IR cameras are usually able to take visual images along with the IR images.
The two images can be viewed separately or with the IR image superimposed on the visual
image. The visual image increases the usefulness of the measurement by identifying where the
image was taken, and often captures identifying markings on the equipment.
Commissioning for PV Performance
Best Practice Guide 69 www.sunspec.org
Image enhancement
Some IR cameras have features for automatically improving the contrast or dynamic range of the
areas of interest, or for accentuating the edges of the components being imaged. These features
take some of the guesswork out of interpreting infrared images.
Light shield
The display screens of IR cameras are typically much less readable than smart phone displays
under bright sunlight. Some cameras have accessory sun shields that can help.
Storage
The camera should have enough storage for a day’s worth of measurements.
Annotation
Some cameras include features for text entry or voice annotation. The alternative is to write
down the image number and subject for each image saved.
Data analysis software
Data management and analysis software is available for most IR cameras. In addition to
organizing the images for easy access and reporting, the software aids in interpreting and
labeling hot spots.
5.9 References
Infrared basics
“Infrared Basics: Infrared Energy, Emissivity, Reflection, and Transmission”. Concord, MA:
Williamson Corporation,
http://www.deltat.com/pdf/Infrared%20Energy,%20Emissivity,%20Reflection%20%26%
20Transmission.pdf
Infrared imaging basics
“Thermal Imaging Cameras: a Fast and Reliable Tool for Testing Solar Panels”. Wilsonville,
OR: FLIR,2014. http://www.flir.com/cs/emea/en/view/?id=41872
Standards documents
Grid connected photovoltaic systems – Minimum requirements for system documentation,
commissioning tests and inspection. IEC Standard 62446. Geneva, Switzerland:
International Electrotechnical Commission, 2009.
Other
Haney, J., Burstein, A.,PV System Operation And Maintenance Fundamentals. Solar America
Board for Codes and Standard, 2013.
5.10 Contributors
We thank these organizations for contributing to the development of this chapter:
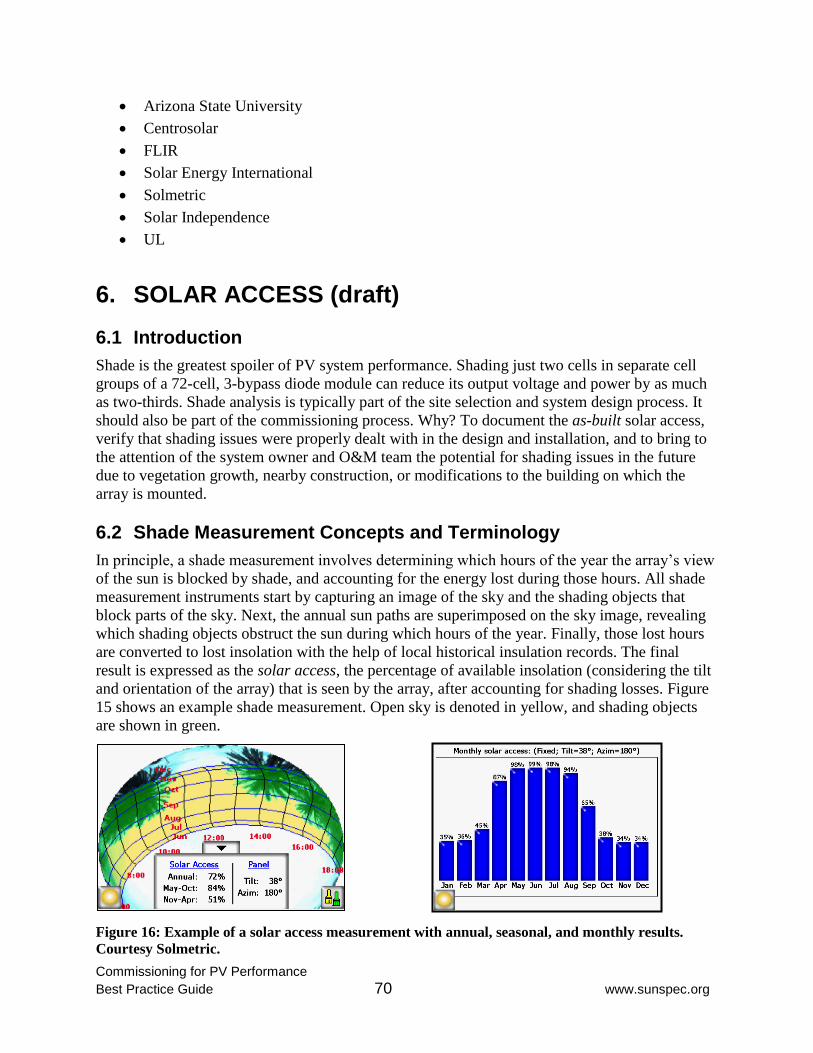
Commissioning for PV Performance
Best Practice Guide 70 www.sunspec.org
Arizona State University
Centrosolar
FLIR
Solar Energy International
Solmetric
Solar Independence
UL
6. SOLAR ACCESS (draft)
6.1 Introduction
Shade is the greatest spoiler of PV system performance. Shading just two cells in separate cell
groups of a 72-cell, 3-bypass diode module can reduce its output voltage and power by as much
as two-thirds. Shade analysis is typically part of the site selection and system design process. It
should also be part of the commissioning process. Why? To document the as-built solar access,
verify that shading issues were properly dealt with in the design and installation, and to bring to
the attention of the system owner and O&M team the potential for shading issues in the future
due to vegetation growth, nearby construction, or modifications to the building on which the
array is mounted.
6.2 Shade Measurement Concepts and Terminology
In principle, a shade measurement involves determining which hours of the year the array’s view
of the sun is blocked by shade, and accounting for the energy lost during those hours. All shade
measurement instruments start by capturing an image of the sky and the shading objects that
block parts of the sky. Next, the annual sun paths are superimposed on the sky image, revealing
which shading objects obstruct the sun during which hours of the year. Finally, those lost hours
are converted to lost insolation with the help of local historical insulation records. The final
result is expressed as the solar access, the percentage of available insolation (considering the tilt
and orientation of the array) that is seen by the array, after accounting for shading losses. Figure
15 shows an example shade measurement. Open sky is denoted in yellow, and shading objects
are shown in green.
Figure 16: Example of a solar access measurement with annual, seasonal, and monthly results.
Courtesy Solmetric.
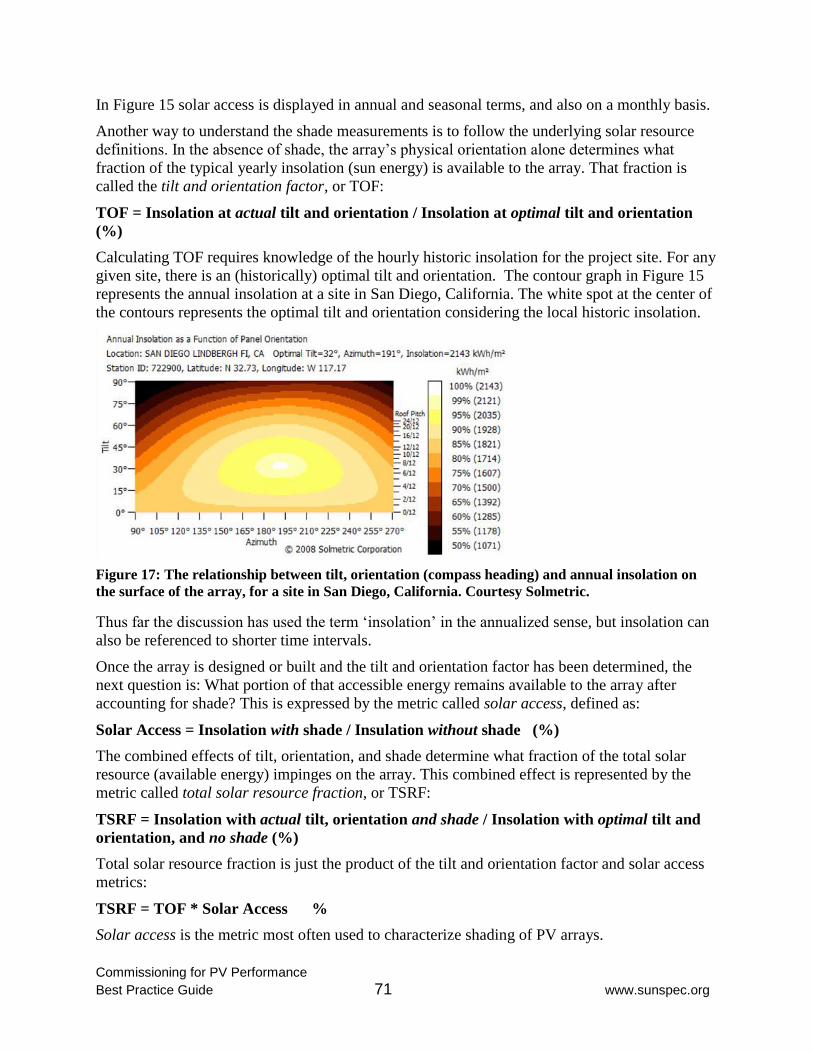
Commissioning for PV Performance
Best Practice Guide 71 www.sunspec.org
In Figure 15 solar access is displayed in annual and seasonal terms, and also on a monthly basis.
Another way to understand the shade measurements is to follow the underlying solar resource
definitions. In the absence of shade, the array’s physical orientation alone determines what
fraction of the typical yearly insolation (sun energy) is available to the array. That fraction is
called the tilt and orientation factor, or TOF:
TOF = Insolation at actual tilt and orientation / Insolation at optimal tilt and orientation
(%)
Calculating TOF requires knowledge of the hourly historic insolation for the project site. For any
given site, there is an (historically) optimal tilt and orientation. The contour graph in Figure 15
represents the annual insolation at a site in San Diego, California. The white spot at the center of
the contours represents the optimal tilt and orientation considering the local historic insolation.
Figure 17: The relationship between tilt, orientation (compass heading) and annual insolation on
the surface of the array, for a site in San Diego, California. Courtesy Solmetric.
Thus far the discussion has used the term ‘insolation’ in the annualized sense, but insolation can
also be referenced to shorter time intervals.
Once the array is designed or built and the tilt and orientation factor has been determined, the
next question is: What portion of that accessible energy remains available to the array after
accounting for shade? This is expressed by the metric called solar access, defined as:
Solar Access = Insolation with shade / Insulation without shade (%)
The combined effects of tilt, orientation, and shade determine what fraction of the total solar
resource (available energy) impinges on the array. This combined effect is represented by the
metric called total solar resource fraction, or TSRF:
TSRF = Insolation with actual tilt, orientation and shade / Insolation with optimal tilt and
orientation, and no shade (%)
Total solar resource fraction is just the product of the tilt and orientation factor and solar access
metrics:
TSRF = TOF * Solar Access %
Solar access is the metric most often used to characterize shading of PV arrays.
Commissioning for PV Performance
Best Practice Guide 72 www.sunspec.org
6.3 Measurement Conditions
Shading measurements can usually be performed under any sky conditions, including overcast
and partly cloudy, so long as there is enough light to capture the difference in brightness between
the shaded and unshaded parts of the sky.
The sun paths and the available energy are known for each hour of the year. This means the
impact of shading for every hour of the year can be determined from a single shading
measurement.
6.4 Measurement Process
Shade analysis instruments measure the solar access metric at the physical point (location and
height) at which the instrument was positioned when the measurement was performed. Since PV
arrays are not points but rather extended objects, a shade study requires repeated measurements
at intervals around, and sometimes across, the area of the array.
Choosing measurement locations
In general, distant obstructions, such as mountains, cast similar shadows across wide areas of an
array, whereas near obstructions such as HVAC units cast localized shadows that may only
impact a few modules. During a (pre-installation) site survey for an industrial rooftop with
shading issues, it is common to define a grid (eg. 20 foot spacing) and make a shade
measurement at each intersection point covering the entire area. However, at commission time it
is difficult to measure shade in the field of the arrays, and typically shading is more of a problem
around the perimeter of a commercial array. Therefore, it is common to measure shade at regular
intervals along the perimeter of the arrays, for example every 20 feet. More shade measurements
should be made closer to nearby shade-causing obstructions such as HVAC units or trees. Shade
measurements are always made at the height of the module’s top surface.
6.5 Data analysis
The shade analysis tools used by PV installers and O&M personnel typically analyze the data
automatically. Solar access data can be exported in quarter-hourly, hourly, daily, or monthly
increments for use in commercial production estimation software or for the purposes of incentive
programs.
Some residential PV incentive programs require averaging the solar access measurements
collected around the perimeter of the array.
In special cases where the obstruction, such as a nearby building, is of a light color that does not
contrast well with the open sky, it may be necessary to edit the shading image to assure that the
shading is properly accounted for. Editing may also be required to fill in the foliage of trees that
were not in leaf at the time the sky image was captured. Sky editing, if required, is typically a
post-measurement step.
Some shade analysis tools also provide data in an elevation angle format, which displays the
elevation of the top of the obstruction for each compass heading.
6.6 Reporting Shade Analysis Results
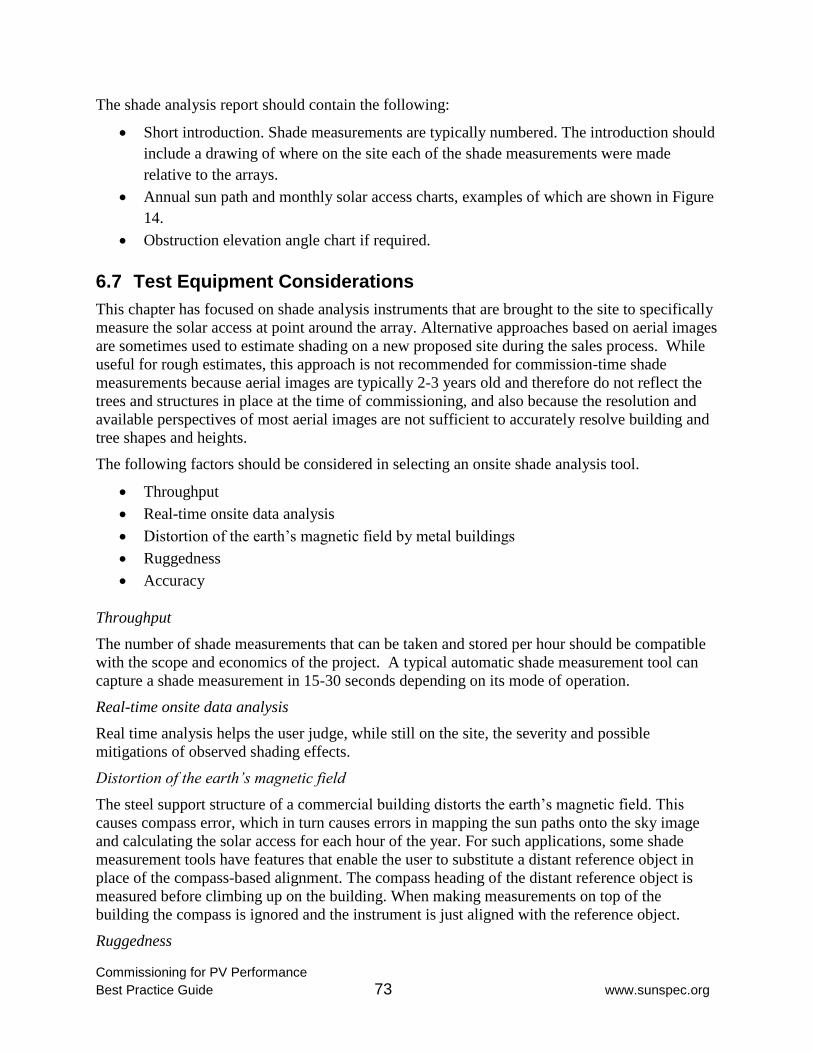
Commissioning for PV Performance
Best Practice Guide 73 www.sunspec.org
The shade analysis report should contain the following:
Short introduction. Shade measurements are typically numbered. The introduction should
include a drawing of where on the site each of the shade measurements were made
relative to the arrays.
Annual sun path and monthly solar access charts, examples of which are shown in Figure
14.
Obstruction elevation angle chart if required.
6.7 Test Equipment Considerations
This chapter has focused on shade analysis instruments that are brought to the site to specifically
measure the solar access at point around the array. Alternative approaches based on aerial images
are sometimes used to estimate shading on a new proposed site during the sales process. While
useful for rough estimates, this approach is not recommended for commission-time shade
measurements because aerial images are typically 2-3 years old and therefore do not reflect the
trees and structures in place at the time of commissioning, and also because the resolution and
available perspectives of most aerial images are not sufficient to accurately resolve building and
tree shapes and heights.
The following factors should be considered in selecting an onsite shade analysis tool.
Throughput
Real-time onsite data analysis
Distortion of the earth’s magnetic field by metal buildings
Ruggedness
Accuracy
Throughput
The number of shade measurements that can be taken and stored per hour should be compatible
with the scope and economics of the project. A typical automatic shade measurement tool can
capture a shade measurement in 15-30 seconds depending on its mode of operation.
Real-time onsite data analysis
Real time analysis helps the user judge, while still on the site, the severity and possible
mitigations of observed shading effects.
Distortion of the earth’s magnetic field
The steel support structure of a commercial building distorts the earth’s magnetic field. This
causes compass error, which in turn causes errors in mapping the sun paths onto the sky image
and calculating the solar access for each hour of the year. For such applications, some shade
measurement tools have features that enable the user to substitute a distant reference object in
place of the compass-based alignment. The compass heading of the distant reference object is
measured before climbing up on the building. When making measurements on top of the
building the compass is ignored and the instrument is just aligned with the reference object.
Ruggedness
Commissioning for PV Performance
Best Practice Guide 74 www.sunspec.org
The tools should be designed for field use and rugged enough to withstand the challenges of
solar sites.
Accuracy
The accuracy of shade measurements is impacted by the accuracy of the compass, inclinometer,
and the method of imaging the sky and shading objects, typically an image sensor. All sensors
should be factory calibrated. The camera and lens calibration should account for lens-to-camera
alignment and lens distortions.
6.8 References
Standards documents
Grid connected photovoltaic systems – Minimum requirements for system documentation,
commissioning tests and inspection. IEC Standard 62446. Geneva, Switzerland:
International Electrotechnical Commission, 2009.
Haney, J., Burstein, A.,PV System Operation And Maintenance Fundamentals. Solar America
Board for Codes and Standard, 2013.
6.9 Contributors
We thank the following organizations for contributing to the development of this chapter:
Solmetric


![Business Sensitive | 1 Horizon Energy Group [Solar PV]x[Microgrids] The Matrix Solution SunSpec Alliance Members Steve Pullins, President February 2013.](https://static.fdocuments.us/doc/165x107/551b79f6550346d31b8b6501/business-sensitive-1-horizon-energy-group-solar-pvxmicrogrids-the-matrix-solution-sunspec-alliance-members-steve-pullins-president-february-2013.jpg)