Commission on Education and Training August 2010...
32
Commission on Education and Training August 2010 Newsletter An occasional electronic newsletter from the Commission. If you have any brief items of interest then please email them to [email protected] . for eCET. If you have more substantial articles please send them to Igor Drecki at [email protected] for the ICA newsletter. Six cartographic commandments: 1. Map Substantial Information 2. Don’t’ Lie with Maps 3. Effectively Label Maps 4. Minimize Map Noise 5. Map Layout Matters 6. Evaluate your Map http://makingmaps.net/2007/08/16/how-useful-is-tufte-for-making-maps/ ICA Map of the Month Carte Géologique des Pyrénées GO TO LINK:> http://icaci.org/map-of-the-month-082010
Transcript of Commission on Education and Training August 2010...

Commission on Education and Training
August 2010 Newsletter An occasional electronic newsletter from the Commission.
If you have any brief items of interest then please email them to [email protected]. for eCET.
If you have more substantial articles please send them to Igor Drecki at [email protected] for the ICA newsletter.
Six cartographic commandments:
1. Map Substantial Information 2. Don’t’ Lie with Maps 3. Effectively Label Maps 4. Minimize Map Noise 5. Map Layout Matters 6. Evaluate your Map
http://makingmaps.net/2007/08/16/how-useful-is-tufte-for-making-maps/
ICA Map of the Month
Carte Géologique des Pyrénées
GO TO LINK:> http://icaci.org/map-of-the-month-082010

ICA CET Workshops Viet Nam workshop – July 2010 Thanks go to Professor Laszlo Zentai (Hungary), Professor Vit.Vozenilek (Czech Rep.), Professor William Cartwright (Australia) and Dipl.-Ing. Manuela Schmidt (Austria) for presenting at the successful Commission on Education and Training workshop in Ho Chi Minh City (19th to 30th July). They gave of their expertise, time, educational resources and finances to make this workshop a great success. Topics covered included cartographic information systems, Internet mapping, 3D maps and Geovisualization. The Ho Chi Minh City Association of Geomatics (HAG) hosted the organisation in collaboration with the HCMC Institute of Resources Geography (HCMIRG). Mr. Lam Dao Nguyen from the GIS & Remote Sensing Research Center (GIRS), Vietnamese Academy of Science and Technology (VAST) was instrumental in organising the funding and logistics for the workshop. The HCMC University of Technology (HCMUT) was also involved in the organisation of the workshop.
Professor Vit.Vozenilek and Professor Laszlo Zentai

Dipl.-Ing. Manuela Schmidt and Professor Dr. Dr. William Cartwright
Report on the first week of the Workshop on WebGIS/Mapping by Professor László Zentai
Ho Chi Minh City, 19-24 July 2010
The 2-week workshop was organized by the ICA Commission in Education and Training (CET).
Due to the lack of funds the invited lecturers had to pay their travel costs and the local organizers covered all the local costs (accommodation etc.). It was not easy to find lecturers who were ready to cover the travel costs, but finally the team of the first week was the following:
• Prof. László Zentai, Eötvös Universiy, Budapest, Hungary (Vice-Chairman of CET) • Prof. Vit Vozenilek, Palacky University Olomouc, Czech Republic.
The local organizers of the workshop were the Ho Chi Minh City University of Technology (HCMUT) and the Ho Chi Minh City Association of Geomatics and Institute for Geography and Resource. During the week the lecturers were accommodated in the Bách Khoá Dormitory. Due to the different duties at home the two lecturers travelled separately (different arrival and departure times).
The program of the workshop was discussed with the local organizers and was practically based on their requests. The presentation files were sent to Vietnam in advance in order the local organizers should provide copies for each participant.
The program of the first week:
• Cartographic Information Systems (Vit Vozenilek) o Basics of CIS o Cartography for GIS o Legend rules o ESRI cartographic tools o Group work

• Internet Mapping (László Zentai) o Overview o Internet mapping – Theories o The evolution of Internet and WWW o Internet mapping – Formats o Internet mapping – Group work
• Atlas Cartography (Vit Vozenilek) o Theory of atlases o Phases of atlas production o Metadescription o Samples
• Prepress and Digital Printing (László Zentai) o Overview o Printer types o Proofing o Page description languages o Color separation o Prepress functions in different software types o Printing types
There was an official opening ceremony on 19 July, where the following people were present:
• Vu Dinh Thanh, Rector of HCMUT • Pham Dinh Tuan, Vice-Rector for foreign affairs • Le Huu Giap, the Director of Ho Chi Minh City Association of Geomatics, Center for
Geomatics Consultations and Inspection
The local organizers provided special computer laboratory for the group work, while the oral lessons were presentations using data projector in a normal classroom. The English language presentations were not translated into Vietnamese – the participants had to understand English. However, we felt that the level of understanding was very different and we were sure that a few percent of participants were not able to follow the presentations.
The number of participants was about 30 people (mostly employees of the university and the association), but the number of participants were varied depending on the modules. For example, the number of participants was around 15 in the last module (Prepress) due to its very special content,
We had some joint dinners together with the HCMUT professors and other GIS experts. At the end of the week the Ho Chi Minh City Association of Geomatics invited the lecturers for a one day tour in the Mekong Delta.
Nevertheless I have to emphasize that my overall impression is very positive, I hope that our workshop helped the development of the Vietnamese cartography.
Budapest, 25 August 2010
László Zentai
================================================================

Indonesia workshop – July-August, 2010 Thanks go to Professor Ferjan Ormeling (The Netherlands), Dr. Gang-Jun Liu (Australia), Professor William Cartwright (Australia) and Dipl.-Ing. Manuela Schmidt (Austria) for presenting at the successful Commission on Education and Training workshop in Jakarta (26th July to 6th August, 2010). They gave of their expertise, time, educational resources and finances to make this workshop a great success. The workshop in Indonesia run over two weeks and Professor Oremling and Dr Liu also presented at the 5th IGTE symposium in Jakarta. Topics covered include computer assisted cartography, GIS visualization, Web-cartography and Geospatial education using ICT. Ms Rizka Windiastuti from the National Coordinating Agency for Surveys and Mapping, (BAKOSURTANAL) is to be congratulated on taking the lead in organising the workshop and Mr. Sukendra Martha, President of the Indonesian Association for Cartography and member of the Commission on Education and Training is also to be thanked for his support of this workshop.
Dr Gang-Jun Liu and Professor Ferjan Ormeling

Dipl.-Ing. Manuela Schmidt and Professor Dr. Dr. William Cartwright
Ms Riszka Windiastuti, Ms Diah K. Kresnawati and Mr. Sukendra Martha from the National Coordinating Agency for Surveys and Mapping, (BAKOSURTANAL), Jakarta.

Conferences Alert!!!!
25th International Cartographic Conference [Second CALL for PAPERS]i 3–11 July 2011 Paris, France Open to researchers, engineers, students, data producers and software suppliers, the ICC 2011 will be held from 4th to 8th July 2011 at the Palais des Congrès in Paris, with simultaneous proceedings in eight meeting rooms. This conference will consider the most wide-ranging issues involving cartography and geomatics. In addition to oral presentations, sessions will be organized for the presentation of work in the form of poster displays. Go to link > http://www.icc2011.fr/
Cartographic Products
National Geographic World Atlas iPhone App • August 8th, 2010 5:57 pm ET
Insert photo caption or credit here

National Geographic as a magazine has been around forever. In 1997 National Geographic premiered their first cable network. Now comes the ultimate in Nat Geo contents...the iPhone App. From iTunes; Description
• Explore your world with National Geographic’s World Atlas for iPhone and iPod Touch!
• Easy-to-use, feature packed, and containing the world’s best maps, the National Geographic World Atlas enables you to browse, search, and zoom detailed maps of the globe.
• Unlike other atlas applications, the National Geographic World Atlas utilizes our highest resolution, “press-ready” images, providing you the same rich detail, accuracy, and artistic beauty found in our award-winning wall maps and bound atlases.
• GO TO LINK:> http://www.examiner.com/iphone-app-in-national/national-geographic-world-atlas-iphone-app
Java based utility for making cave maps on your computer Carto is a free and cross-platform tool for making cave maps. Carto has two main parts. One is a mechanism for warping digitized sketches to fit the survey data, and combining them to form a composite. The other is a CAD program designed specifically for drawing cave maps. Carto can be used to quickly produce and maintain a working map. A composite image of all the sketches can be used as an ugly, but complete, working map. After each survey trip the sketches are scanned and the stations are marked on the images. Carto deforms the raw sketches to fit the processed survey data and superimposes them. This "composite sketch" will not be pretty, it will show mud, grid lines, erasures, and all the idiosyncrasies of the individual sketchers, but it will also contain all the information in the original notes.
GO TO LINK:> http://mac.softpedia.com/get/Utilities/Hartley-Carto.shtml

Cartographic Resources
Go to Link:> http://www.fablevision.com/mappingtheworldbyheart/ Everything Sings: Maps for a Narrative Atlas by Denis Wood Written by siglio Press 22 July 2010 The legendary Boylan Heights maps by iconoclast, geographer, and author Denis Wood are now collected in Everything Sings: Maps for a Narrative Atlas That a cartographer could set out on a mission that's so emotional, so personal, so idiosyncratic, was news to me. IRA GLASS, host of This American Life, from his introduction to Everything Sings: Maps for a Narrative Atlas Imaginative atlases, radical cartography, and experimental geography make up a vibrant world of artists, flaneurs, political activists, psychogeographers, critical cartographers, poets, and others for whom a new way of mapping is equivalent to a new way of seeing and engaging the world. Denis Wood's four decades of work as a geographer and writer has directly influenced the creative, anarchic, and activist spirit that inflects this growing phenomenon. $28 / Paper / 112 pages / 8.5 x 10.75 / 85 b/w illustrations, including more than 50 maps / ISBN: 978-0-9799562-4-9 / Release: November 12, 2010 Advance Review Copies: PDF and digital media kit available now. Bound review copies available August 25.

Limited Edition: A set of six maps from the book printed on vellum in a portfolio case housed with the book, in a signed and numbered edition of 30. Current price: $135. See http://sigliopress.com/books/atlas.htm GO TO LINK:> http://www.gisuser.com/content/view/21030/2/ Smiling Cartographers: Making GIS More Usable for Cartography Authors: Eicher, Cory1; Bedel, Markus2; Neuffer, Dieter3; Kappeler, Stefan4; Neun, Moritz5; Schoening, Reto6 Source: Cartographic Journal, The, Volume 47, Number 2, May 2010 , pp. 173-179(7) Publisher: Maney Publishing Abstract: A software‐usability approach was taken by ESRI Switzerland to design and build a cartographic production system for the Swiss Federal Office of Topography (swisstopo). Building on the strengths of ESRI ArcGIS and ArcMap for data management, symbolisation and intuitive cartographic editing, an analysis was made to improve the general editing environment and provide tools specifically for cartographers. This paper discusses how usability tenets were applied in the design of reusable software components used for the production of multiple map products at swisstopo and other sites. Keywords: usability; quality assurance; swisstopo; ArcGIS; GIS; cartographic production; ESRI Document Type: Research Article DOI: 10.1179/000870410X12644254337900 GO TO LINK:> http://www.ingentaconnect.com/content/maney/caj/2010/00000047/00000002/art00008 Designed Maps: A Sourcebook for GIS Users by Cynthia A Brewer
Book Details
• Media : Paperback • Publisher : ESRI Press (February 29, 2008) • Language : English • ISBN : 1589481607
Customer Review A must have reference book for GIS users I accidently purchased "Designed Maps" thinking I was getting Cynthia Brewers other book "Designing Better Maps", but I stumbled across something great. Brewer does a superb job of illustrating sound and well thought out map design to any level of GIS user. I originally purchased the book when I was taking a cartography course and it was a lifesaver. Anytime I was puzzled as to how I could best present the information at hand, I was able to flip to a similar map in "Designed Maps" in order to get a solid feel for how I could approach the problem. Brewer allows even the most casual GIS user the ability to understand the concepts presented in her examples, breaking down how each of the individual segments can be modified to highlight different cartographic aspects. "Designed Maps" also does a wonderful

job of explaining how the map is intended to be used and what the user is supposed to see. I particularly enjoyed the compare and contrast segments which depicted the ways that the same information could be displayed in different manners to highlight individual components. "Designed Maps" is a must have a for a GIS library. Although the book is published by ESRI Press (it features several tips specific to ArcMap), I found it useful for understanding the specifics of cartographic representation on pretty much any platform. GO TO LINK:> http://www10.giscafe.com/aws/Cynthia-Brewer-Designed-Maps-Sourcebook-GIS-Users/22321/book.html Dasymetric Mapping and Areal Interpolation: Implementation and Evaluation by: Cory L. Eicher, Cynthia A. Brewer Cartography and Geographic Information Science (April 2001), pp. 125-138. Abstract Dasymetric maps display statistical data in meaningful spatial zones. Such maps can be preferable to choropleth maps that show data by enumeration zones, because dasymetric zones more accurately represent underlying data distributions. Though dasymetric mapping has existed for well over a century, the methods for producing these maps have not been thoroughly examined. In contrast, research on areal interpolation has been more thorough and has examined methods of transferring data from one set of map zones to another, an issue that is applicable to dasymetric mapping. Inspired by this work, we tested five dasymetric mapping methods, including methods derived from work on areal interpolation. Dasymetric maps of six socio-economic variables were produced fm a study area of 159 counties in the eastern U.S. using county choropleth data and ancillary land-use data. Both polygonal (vector) and grid (raster) dasymetric methods were tested. We evaluated map accuracy using both statistical analyses and visual presentations of error. A repeated-measures analysis of variance showed that the traditional limiting variable method had significantly lower error than the other four methods. In addition, polygon methods had lower error than their grid-based counterparts, though the difference was not statistically significant. Error maps largely supported the conclusions from the statistical analysis, while also presenting patterns of error that were not obvious from the statistics. GO TO LINK:> http://www.citeulike.org/user/wjmn98/article/7424284 The Look of Maps, the Latest Book from Esri Press Cartographic Classics Series Redlands, California — June 25, 2010 Esri Press is proud to expand its cartographic classics series with The Look of Maps: An Examination of Cartographic Design by Arthur H. Robinson. The series also includes Cartographic Relief Presentation by Eduard Imhof and the soon-to-be-published Semiology of Graphics by Jacques Bertin. Originally published in 1952, The Look of Maps is based on Robinson’s doctoral research, which investigated the relationship between science and art in cartography and the resultant refinement of graphic techniques in mapmaking to present dynamic geographic information. The book examines a wide range of topics related to the visual aspects of cartography including lettering, structure, and color. It is considered by many to have inspired the shift in cartographic research from the simple production of maps to communication and design theory. Robinson authored and coauthored many influential articles and books on cartography including Elements of Cartography, The Nature of Maps, and Early Thematic Mapping in the History of Cartography. In addition, he developed the Robinson projection, which is used to create visually appealing maps of the world by minimizing the distortion inherent in projecting

a spherical image onto a two-dimensional plane. The Look of Maps is a fundamental reference for students and professionals in the field of cartography and cartographic design as well as being an essential resource for map libraries. The Look of Maps: An Examination of Cartographic Design (ISBN-13: 9781589482623, 124 pages, $39.95) is available at online retailers worldwide, at www.esri.com/esripress, or by calling 1-800-447-9778. Outside the United States, visit www.esri.com/esripressorders for complete ordering options, or visit www.esri.com/distributors to contact your local Esri distributor. Interested retailers can contact Esri Press book distributor Ingram Publisher Services. GO TO LINK:> http://www10.giscafe.com/nbc/articles/1/838145/Look-Maps-Latest-Book-Esri-Press-Cartographic-Classics-Series
GI Sciences Education Should I go for a Masters in Geography / GIS? August 3, 2010 8:05 PM Should I go for a Masters in Geography / GIS? What will the future hold career-wise? I have been a graphic designer for the last 7 or 8 years, and have increasingly become disillusioned with the whole marketing/advertising side of design (and design in general). I have always been interested in maps and geography, and have been seriously considering for the past few weeks getting a masters in geography specializing in GIS. I am interested in nature conservation / environmental protection & planning and the mapping aspect of it, and I think this is the route that I would go. Not having any science classes (or math classes) past high school, would/should I go into a Masters program, and would they accept me? It seems like the right choice, instead of getting a second bachelors, but the only grad students I know are lawyers and MBA students, so they aren't much help. Also, is there a future in that career path? Is it even a career path? I can't find any good data on something specialized like that, and it seems like the GIS aspect is fairly new anyways. Everything else I find about GIS seems to be 5 years old. I have a variety of interests that tie in to geography, and its only been in the last two or three weeks that I realize that they all mesh together - cartography, transportation design, emergency planning, geopolitics, etc. I am planning on moving to the Boston area, so I have been looking at colleges in Mass. I've already reached out to a few professors and I have a advising session in a few weeks with a professor where I currently live (NYC), but I'd like to have a firmer grasp as to what I should be asking them about. Any feedback is welcome. Thanks! posted by cavs33 to education (9 comments total) 9 users marked this as a favorite GIS and especially GIS-based data aggregation and interpretation among different sensors is a tremendous career path. Here is a simple example: Silas Hogwinder has a section of land planted in potatoes. He wishes to maximize the profit gained from the land. He notices the yield varies by position within the section. He must decide whether to accept the yield if he applies fertilizer uniformly (cheap) or varies the deposition by position (more expensive, given that GPS is probably the way to figure out

position and thereby vary how much fertilizer goes on each bit of land). Advise Mr. Hogwinder which is the more profitable approach. Now: multiply the simple example by the number of discrete operations on a potato field (planting, tillage, fertilizing, spraying, watering, harvesting, spraying for nematodes) and you wind up with a set of overlays which represent the variation of profit by operation. You have at hand satellite data (free and paid for); yield maps; aerial photography; cartography; perhaps moisture sensors in the field. Farmers cannot do without this information any longer. As farms get bigger and more agri-business-like they increasingly rely on it; and there aren't many people who can gather all these threads and present them to the user in a form that shows what action results in what yield or profit. It is a difficult and under-appreciated milieu. posted by jet_silver at 8:53 PM on August 3 =================================== My fiancee is in a doctorate program for geography, but she's doing human geography and is essentially trying to become a professor - so I have pretty limited information. My fiancee got a bachelor's in art history and a masters in women's studies, so I don't know if science and math are the biggest prerequisites out there, although she was applying as a human geographer. A masters student that started the same year as her recently did an internship at a consulting firm that works with developers and architects. Most of the time that I use GIS (as an architect) is in mapping programs for overlay zones the building department wants us to locate ourselves in, so someone's doing that input work - this is probably your future career path with a masters. When my fiancee was applying, Clark seemed to be a big deal, but she's saying now that most of the really good schools are out on the west coast. posted by LionIndex at 9:05 PM on August 3 ============================================ I am finishing up the final year of a Masters by coursework in geospatial science, and chosing this course was a great decision. I chose to specialize in GIS but there were options to study cartography, remote sensing, natural resource management as well. There'd be lots of ways for someone with a design background to put GIS to good use. There's heaps of demand in the field - GIS seems to be exploding everywhere at the moment. I got a good government job halfway through the course (after 6 classes or the equivalent of a semester and a half full time study). The work is really interesting and varied so far. The course I'm doing is 3 years part time, with many classes running in the evenings after work. The school asked for a Bachelor degree as entry, but they were pretty flexible about what area (and were also happy to consider work/life experience). I did undergrad in maths and earth science, but haven't really needed any of that to complete the coursework so far. This is in Australia however, so YMMV. Can't help you with US schools, sorry. Good luck with whatever you choose! posted by procrastinator_general at 10:02 PM on August 3 =========================================================== We employ many GIS specialists at my department of environment, and there's a big shortage, good employees are hard to come by. They're used for all sorts of conservation

related purposes. posted by wilful at 10:16 PM on August 3 ============================================================ I've been a GIS Specialist / cartographer for about 10 years with no regrets. I set my own timelines, I create my own projects, and my boss and colleagues are always happy with my work as long as they get their maps. The job market has always been excellent, and I'm sure it's still growing. Even municipal governments of towns with 10,000 or less people have GIS departments now. Corporations like WalMart and Starbucks employ GIS Specialists to help determine optimal store locations. I think the CIA employs the most cartographers of any agency in the US. Not to mention all the conservation organizations and engineering firms. I could go on and on. My primary gripe with my job though is that ESRI's GIS software is horribly buggy and glitchy. Learning all the errors and bugs and the workarounds necessary to deal with them is as important as just learning the tools of the software. Seriously, what the fuck does "segmentation violation" mean? Couldn't they program error boxes that even make a little sense? And I really love when I click on a button in 9.x while that globe is spinning and the entire goddam program crashes. Anyway, it's a great field, so I say go for it. posted by Beardsley Klamm at 11:42 PM on August 3 ============================================================== Thanks guys! I was surprised I'd get so many responses by the morning. It makes me feel better about everything. I can understand about esri - I did some 3d modeling for a while and had the same type of problems. We always said "PC load letter? What the fuck does that mean?" Ha ha. I love office space. It's too bad esri has a strangle hold on the industry posted by cavs33 at 6:06 AM on August 4 ============================================================== GIS is huge and it can only get bigger with all our phones and computers becoming location aware. It's definitely in its infancy. But...I wouldn't pursue a degree strictly in GIS. If you're interested in natural area preservation, find a natural resources management degree. If it's social issues, public policy. Cities and development? Urban planning. All those programs will give you as much GIS experience as you want. The risk with focusing on GIS specifically is that you risk getting stuck in that role. Would you rather be an engineer that uses AutoCAD, or a drafter that does nothing but AutoCAD? Would you rather be a photographer that uses Photoshop, or a photo editor who does nothing but Photoshop? A degree focused on GIS would be fine if what you want to do is create better GIS software (god knows we need it) or run a big GIS department somewhere. Otherwise, I'd stay away. No one cares where your software skills come from as long as you have them. You'll pick up GIS just as fast doing it in parallel with whatever your main interest is. Maybe faster. A side benefit is that you'll just be learning the practical aspects of GIS and avoiding some of the more math/computer science heavy stuff. The really nerdy stuff is incredibly interesting, but only useful for 1% of real-world GIS work. Just my $.02. I know a lot of people who have gotten hung up on their career paths because of being pigeonholed as techies. I also know geographers doing very cool stuff that goes way beyond their training...it's not that it's a dead end, just that it might not be the most direct

route to where you want to go. posted by pjaust at 6:17 AM on August 4 =================================================== Being pigeonholed is one thing I'm worried about, so I've been looking at getting a masters in overall geography and maybe getting some kind of certification in Gis concurrently. I'm more interested in using Gis with my job than developing Gis. posted by cavs33 at 6:41 AM on August 4 ======================================================= GIS software keeps getting easier and easier to use. So much so, that I believe a lay person will soon be able to make adequate maps for most tasks. They will be able to do this without the months/years of training it used to take in order to do the job properly. You should try to market yourself as something different than a guy/girl who knows how to work the mapping program if you decide to go down this path. posted by maxpower at 7:10 AM on August 4 http://ask.metafilter.com/161325/Should-I-go-for-a-Masters-in-Geography-GIS
http://www.weirdexistence.com/creative‐ideas‐are‐all‐around‐us/

Technical Issues Presenting tilestache Named in the spirit of the pun-driven life, TileStache is a response to a few years of working with tile-based map geographic data and cartography, and an answer to certain limitations I've encountered in MetaCarta's venerable TileCache. The edges I've bumped into might be esoteric, but I think they're also indicative of our many experiments in tile-based web mapping since 2007. The core functional needs of a tiling system are well handled by existing software: imagery from bitmap sources of aerial and scanned imagery, Mapnik renderings of OpenStreetMap data, and caches of remote WMS tiles. None of this is really the core point of TileStache, though it's all certainly table stakes. The place where I've found a need for a new project is somewhere in the intersection between synthetic imagery, composites of existing imagery, and delivery of raw vector data to browsers.
GO TO LINK:> http://mike.teczno.com/notes/tilestache.html You Learn Something Every Day: "Choropleth" Aug 2 2010, 12:50 PM ET John Gerth, of the computer science department at Stanford, sent a link to a powerful illustration, by Latoya Egwuekwe, of the spreading effects of unemployment across the country during this recession. The animated version is here, and a sample frame, showing conditions back in the palmy days, looks like this:

A great comparison of different mapping ways to show presidential-election results here, including this county-by-county cartogram of the 2008 results:
GO TO LINK:> http://www.theatlantic.com/politics/archive/2010/08/you-learn-something-every-day-choropleth/60720/

Map of the Earth's Gravity By Miss Cellania in Science & Tech on Jul 5, 2010 at 4:08 am
This map, or geoid, shows the contours of the earth in a more precise manner than ever before. It was constructed with measurements taken by Europe’s Goce satellite. Launched in 2009, the sleek satellite flies pole to pole at an altitude of just 254.9km – the lowest orbit of any research satellite in operation today. The spacecraft carries three pairs of precision-built platinum blocks inside its gradiometer instrument that sense accelerations which are as small as 1 part in 10,000,000,000,000 of the gravity experienced on Earth. This has allowed it to map the almost imperceptible differences in the pull exerted by the mass of the planet from one place to the next – from the great mountain ranges to the deepest ocean trenches. Two months of observations have now been fashioned into what scientists call the geoid. This technology allows mapping of places that were too inaccessible for such precision before, such as the Himalayas. The BBC has a lot more on this project. Link -via TYWKIWDBI GO TO LINK:> http://www.neatorama.com/2010/07/05/map-of-the-earths-gravity/
Cartographic Virtual Prisons Monmonier on e-Maps Restricting our Freedom Tuesday, July 6. 2010 He writes in New Scientist. In 2010, however, restrictive cartography is on the verge of more invasive applications as electronic technology replaces graphic lines requiring conscious interpretation with invisible fences, erected by proactive, self-enforcing geographical restrictions. http://apb.directionsmag.com/archives/8247-Monmonier-on-e-Maps-Restricting-our-Freedom.html

Virtual prisons: how e-maps are curtailing our freedom • 06 July 2010 by Mark Monmonier • Magazine issue 2767.
ELECTRONIC maps are arguably the quintessential innovation of 20th-century cartography. Although a few academic cartographers accord the map mystical powers, it is merely a tool, useful for good, evil or both, which citizens can resist or constrain - up to a point. The question is not whether e-maps will restrict where we go and what we do, but to what extent. What I call "restrictive cartography" is not in itself new. Property maps are at least as old as Roman times, and boundary maps no younger than kingdoms and nation states. What is new, however, is the substantial increase in both the number and diversity of restrictive maps. A comparison of mapping in 1900 and 2000 underscores my point. Since 1900, we have used maps to exclude industry from residential neighbourhoods, ban new construction on floodplains, help delineate "historic" districts that constrain a homeowner's choice of paint colour or replacement GO TO LINK:> http://www.newscientist.com/article/mg20727670.900-virtual-prisons-how-emaps-are-curtailing-our-freedom.html
Well, we got that wrong! Google corrects map border error Viet Nam News Updated August, 06 2010 10:15:46 HA NOI — Google has corrected the map it had posted on the Net of the borderline between Viet Nam and China after a complaint by the Ministry of Natural Resources and Environment's Department of Survey and Mapping. The department said the depiction posted on Google Maps incorrectly attributed thousands of square kilometres of Vietnamese territory to China. It placed the borderline from Dien Bien Province to Mong Cai City in Quang Ninh Province in the wrong place and a number of border gates, such as the ones at Tan Thanh and Thanh Thuy, in Chinese territory. However, Dang Thai Son, an official from the ministry's Borderline Centre, said errors still remained in Google's map. "The borderline between the two countries in Lao Cai Province is basically correct but other parts along the northern borderline have yet to be fixed," Son said. He said he hoped that the internet search corporation would promptly correct its map of the region. Viet Nam and China signed a protocol on border demarcation and landmark planting on November 18, 2009, which officially came into effect on July 14 this year and was submitted to the United Nations. The Viet Nam-China border is 1,449.566-km-long and has 1,971 officially recognised landmarks. Dang Hung Vo, chairman of the Viet Nam Association of Geodesy, Cartography and Remote Sensing, said it was vitally important for Viet Nam to ensure that information relating to its borderline was correctly represented to avoid future territorial disputes. — VNS GO TO LINK:> http://vietnamnews.vnagency.com.vn/Social-Isssues/202262/Google-corrects-map-border-error.html

Full steam ahead for China's territorial ambitions July 13, 2010 Peter Hartcher In a famous maxim, China's late leader Deng Xiaoping urged his countrymen to "hide your brightness, bide your time". That was more than 20 years ago. It now seems China's leaders have finished biding their time. In an assertive redefinition of its place in the world, China has put the South China Sea into its "core national interest" category of non-negotiable territorial claims - in the same league as Taiwan and Tibet. China has drawn a red line down the map of Asia and defies anyone to cross it. It brings China into direct conflict with the claims of five neighbours, and challenges the US Navy's dominance of the waters. One-third of all commercial shipping in the world passes through the waters now claimed exclusively by China, the sea bounded by Taiwan in the north, Vietnam in the west, the Philippines in the east and Malaysia and Brunei in the south. It contains oil and gas fields; some Chinese analysts have dubbed it "Asia's Persian Gulf" for its potential oil wealth and its fractiousness. It is particularly inflammatory because China's government is repudiating its non-binding 2002 agreement with its South-East Asian neighbours to solve territorial disputes through peaceful negotiation. GO TO LINK:> http://www.theage.com.au/opinion/politics/full-steam-ahead-for-chinas-territorial-ambitions-20100712-107sp.html The Agnostic Cartographer How Google’s open-ended maps are embroiling the company in some of the world’s touchiest geopolitical disputes. By John Gravois Washington Monthly, July/August 2010
Picturesque but contentious: Google Maps made this village Chinese, temporarily. India wasn’t pleased. Photo: Annabelle Breakey One fateful day in early August, Google Maps turned Arunachal Pradesh Chinese. It happened without warning. One minute, the mountainous border state adjacent to

Tibet was labelled with its usual complement of Indian place-names; the next it was sprinkled with Mandarin characters, like a virtual annex of the People’s Republic. The error could hardly have been more awkward. Governed by India but claimed by China, Arunachal Pradesh has been a source of rankling dispute between the two nations for decades. Google’s sudden relabeling of the province gave the appearance of a special tip of the hat toward Beijing. Its timing, moreover, was freakishly bad: the press noticed that Google’s servers had started splaying Mandarin place-names all over the state only a few hours before Indian and Chinese negotiating teams sat down for talks in New Delhi to work toward resolving the delicate border issue. Google rushed to admit its mistake, but not before a round of angry Indian blog posts and news articles had flourished online. Some commentators posited outright conspiracy between Beijing and the search engine. “Google Maps has always been more biased towards China over the Arunachal Pradesh border dispute,” surmised an Indian blogger. Even more ominously, one former member of Parliament told the Times of India, “The Chinese know how to time their statements ahead of a bilateral meeting.” Google responded in a manner that radiated chilly omnipresence—by posting a statement in the comments section of what appeared to be every single Web site that had discussed the mix-up. “The change was a result of a mistake in our processing of new map data,” Google announced. “We are in the process of reverting the data to its previous state, and expect the change to be visible in the product shortly.” One mystery remained, however: how did such an error happen in “the product” in the first place? Why did Google have that perfect set of Chinese names lying around, ready to swap in for the Indian ones? GO TO LINK:> http://www.washingtonmonthly.com/features/2010/1007.gravois.html
Odd Spot 2 StarChase
Has any thief ever tried to snatch your valuables and got away in a car or Motor Bike? Now, if that happens you can track them down and find wherever they goes. All you need to do is to aim at any vehicle you need to track or follow and shoot it with a GPS transmitter. The system uses a laser to aim at the back of a car, firing a GPS receiver, wireless transmitter, and battery in a little slug that sticks to the outside of the vehicle. Read more: GO TO LINK:> http://www.walyou.com/blog/2008/11/18/cool-spy-gadgets/

Illusion This painting is in the gardens of Suzhou’s (QuFu?) Confucian Temple. The temple was originally established by Fan Zhongyan in the 1035 under the Northern Song Dynasty No matter from what direction you view the painting the path remains central to your field of vision.
One Person’s View On the lighter side: Do you speak map? By Diane Dean-Epps Special to the Sunday Express Sunday, July 11, 2010 The lost art of cartography may be responsible for the fact that an entire quadrant of the population seems to be literally lost. I'm convinced that there must be a whole fleet of pilots flying for “Anytime Airlines” relying upon the minimal skills provided in their babyboomer-era education which turns them into Christopher Columbus in the air as they discover new worlds. “What do you mean I'm in Israel instead of Japan? Hang on. Where‘s that thing? Yeah. You know. That … map. Nope. This doesn't look like any country I've ever seen.”

And now I have a confession to make. I am one of the map illiterates. We are the kids who were schooled some time in the 1960s, 1970s, late-1400s who did not have to painstakingly label and memorize a map for every blessed province, country and area code in the world. At the time we thought it was a good thing that geography was all but abolished due to the ever-changing philosophies of public school system powers-that-be, but then that whole “world market, global citizen” thing stuck and, lo and behold, the powers that be were powers that be wrong. As it turns out, we use map skills as frequently as math. My status of being geographically-challenged became glaringly clear to me when I had a recent discussion with one of my family members living in a different state. We have quite an age difference between one another, so his education had something that mine didn't – map skills. He's a brave man, so one day he took it upon himself to explain to me where the state of Alaska is located (his locale) in relation to California (my hood). This achievement would require over-the-counter medication, a colorful globe and an unlimited long distance calling plan. We began the impromptu lesson when he mentioned the city of Fairbanks and I said something clever like, “Oh, well that's to the right of the state, isn't it?” After he quit laughing he told me to go fetch that beautiful, lighted globe that was currently adding ambiance and direction to my living room, so he could explain to me just exactly how this whole map thing works. As we began the tutorial I noticed that Alaska is “down under,” if you will, and that, of course, led to a lesson on exactly what “down under” means geographically and, as you might expect, the country of Australia came up – or was it down? Well, at any rate, we talked about it. Quite frankly, until Nicole Kidman came on the scene that country hadn't even appeared on my radar. No small wonder. If you don't have map skills, you're probably not dealing in radar either. I volunteered this aside to my relative who patiently guided me back to the task at hand; using a map. After that little segue took place I got all animated about how colorful the globe was and then I built myself into an excited frenzy as I began to understand geography and where Alaska is located, in particular. “So Alaska is the pink state?!” I screamed excitedly, summing up my dawning understanding as I looked at multi-colored states, colorfully shaded bodies of water, all decorated by boldly outlined meridians. I heard a sigh from my military-trained, cartography-minded, solidly left-brained relative, and I couldn't help but torment him with a final question to ponder: “Do you suppose Alaska is the pink state on every globe?” Diane Dean-Epps is a comedienne and writer. Contact her at www.dianedeanepps.com. GO TO LINK:> http://www.theunion.com/ARTICLE/20100711/OPINION/100709748/-1/RSS

Eurocentric Feature Maps
GO TO LINK:> http://www.youtube.com/watch?v=xdReh4le7x0&feature=player_embedded
GO TO LINK:> http://www.youtube.com/watch?v=nq0KNfS_M44&NR=1

GO TO LINK:> http://www.youtube.com/watch?v=MxGKKgax1RA&feature=channel
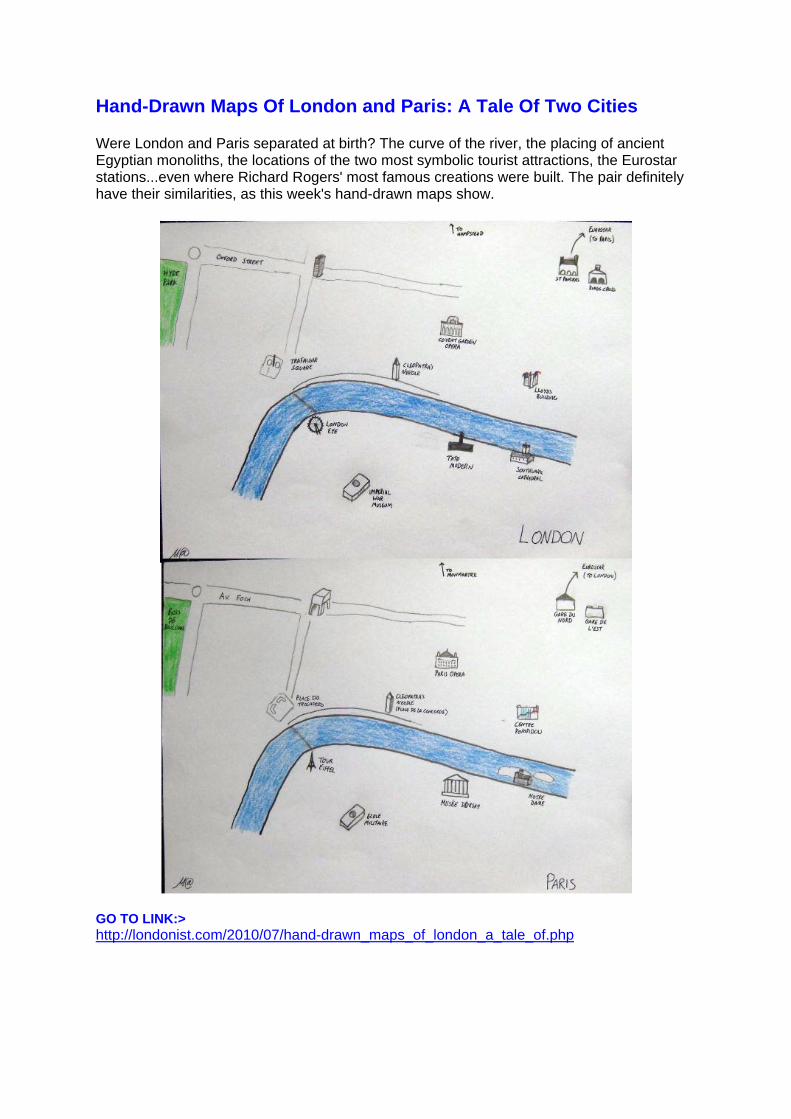
Hand-Drawn Maps Of London and Paris: A Tale Of Two Cities Were London and Paris separated at birth? The curve of the river, the placing of ancient Egyptian monoliths, the locations of the two most symbolic tourist attractions, the Eurostar stations...even where Richard Rogers' most famous creations were built. The pair definitely have their similarities, as this week's hand-drawn maps show.
GO TO LINK:> http://londonist.com/2010/07/hand-drawn_maps_of_london_a_tale_of.php

The Graticule and its uses World Population Map by Longitude By John Farrier in Travel & Places on Aug 12, 2010 at 12:14 pm
Harvard University graduate student Bill Rankin owns the site Radical Cartography. It’s filled with unique and imaginative maps, such as the above world map plotting relative population by lines of longitude. Other maps include displays of an actual cartographic “axis of evil”, US counties named after Presidents, and youth skater culture. GO TO LINK:> http://www.neatorama.com/2010/08/12/world-population-map-by-longitude/
Georgia on my mind Mapping Georgia From Scratch Until an NGO took matters into its own hands, Georgia was literally uncharted territory by Haley Sweetland Edwards, GlobalPost August09, 2010 TSMINDA TSKALI, Georgia — Finding your way around Georgia can be a tricky affair. The only maps available are obsolete Soviet maps, expensive collector maps or nearly-useless outdated tourist maps of the major cities. There are no maps of the bus routes in the capital city. No maps of the new highways. And no comprehensive maps available on the internet. As it is, Google Maps shows Georgia as an empty, light gray swath of territory squeezed between Turkey, Russia and the Black Sea, devoid of highways or train tracks or rivers. Its absence from Google Maps is a dubious honor shared only with North Korea, where an authoritarian regime has refused to share government maps, and actively thwarted cartographers from entering its borders. In Georgia, the lack of data has more to do with the tiny country's history of violence, political unrest and the general disorganization of a post-Soviet state in transition, but regardless of the reasons, one U.S.-funded NGO, Open Maps Caucasus, has taken the mapping of Georgia into its own hands.

The plan? "The idea is to teach people all over Georgia how to make accurate, street-level maps of the places they live," said Austin Cowley, one of five founders of the organization. GO TO LINK:> http://www.boiseweekly.com/boise/mapping-georgia-from-scratch/Content?oid=1722192
Off-Centre Mapping Cartography!: The Map Of Social Networking August 9, 2010 MORE: GO TO LINK:> around the internet in 8 days, cartography, facebook, great but where's the buried treasure?, interesting, map, myspace, pirates, social networking, some of those aren't even social networking, twitter, website, websites are bad
GO TO LINK:> http://www.geekologie.com/2010/08/cartography_the_map_of_social.php

Map-Made Animals Jason LaFerrera Creates Birds and Beasts from Forests and Streets Trendhunter Art & design A mathematician by trade, Jason LaFerrera has begun to dabble in art, and not just any typical forms of art. At first glance, his art pieces may seem like deceptively simple collages, but they were created out of digitally-manipulated maps. Look closely and you’ll be able to see street details. Through ornithology and cartography, Jason LaFerrera manipulates man’s documentation of nature to create nature. It’s rather poetic, as the artist explains: “The patterns of forests and shores often become an animal’s feathers or fur, while the rings of topography often trace out wings or antlers.”
GO TO LINK:> http://www.trendhunter.com/trends/jason-laferrera
Conferences 7th ICA Mountain Cartography Workshop Mountain Mapping and Geospatial Information Retrieval 1–5 September 2010 Borsa, Romania http://www.mountaincartography.org/ GeoCart'2010 ICA Symposium on Cartography for Australasia and Oceania 1-4 September 2010 Auckland, New Zealand The fifth National Cartographic Conference GeoCart'2010 and the first ICA Symposium on Cartography for Australasia and Oceania will convene in Auckland,. http://www.cartography.org.nz/geocart2010/index.htm

Seventh European GIS Education Seminar September 9-12, 2010 Serres, Greece A specialist meeting on GIS education in Europe www.eugises.eu INTERNATIONAL CONFERENCE ON SDI 2010 15-17 Septembar 2010 - SKOPJE [email protected] [email protected] http://sdi2010.evkartenn.com 7th Symposium on LBS and TeleCartography 20-22 September 2010 Guangzhou, China. Go to link > http://www.lbs2010.org/ INTERGEO 2010 5 to 7 October 2010 The (geo) world will come together in Cologne. Around 475 companies from 30 countries will again open up new horizons at the world's leading fair for geodesy, geoinformation and land management. Today, 80 per cent of last year's exhibitors have already booked their trade fair participation http://aktuell.kundeninformation.net/re?l=6mg15oI1u9khtcI1&req=anr%3D 3rd International Symposium of the ICA Commission on the History of Cartography 10-13 October 2010 University of Texas in Arlington, USA The Symposium will be held in conjunction with the 7th Biennial Virginia Garrett Lectures on the History of Cartography (Friday, 8 October 2010) and the Fall Meeting of the Texas Map Society (Saturday, 9 October 2010); www.icahistcarto.org 3rd International Conference on Geoinformation technology 19-20, October, 2010 For Natural Disaster Management and Rehabilitation The Empress Hotel, Chiang Mai, Thailand http://e-geoinfo.net/git4ndm2010/ ICA Commission on National and Regional Atlases October 20-23, 2010 Yogyakarta, Indonesia,. (1) Recent Directions in National Atlas Cartography and (2) National, Regional, City and School Atlases as Expressions and Carriers of Space-related Identity Organized by ICA Commission on National and Regional Atlases National Coordinating Agency for Survey and Mapping, Indonesia International Geographic Union 14-18 November, 2011 Regional Geographic Conference IGU 2011 United and Integrated with the World

www.ugi2011.cl AutoCarto 2010 November 15-18, 2010 Orlando, Florida Sponsored by the Cartography and Geographic Information Society (CaGIS), The 18th in the series, this international research symposium on computer-based cartography and GIScience will be held in conjunction with the American Society for Photogrammetry and Remote Sensing (ASPRS). The International Cartographic Association and the International Society for Photogrammetry and Remote Sensing (ISPRS) Technical Commission IV: Geodatabases and Digital Mapping will also hold a number of commission meetings at AutoCarto 2010. The focus of this joint meeting is Geospatial Data and Geovisualization for the Environments, Security, and Society. http://www.cartogis.org/autocarto The Use of GIS and Remote Sensing for Sustainable Development 29th Nov-03rd Dec, 2010 Tunis We have the honour to invite you to participate in the events of GEOTUNIS International Congress 2010 in its 5th Edition from 29 November to 03 December, 2010 in Tunisia Centred under the theme "The use of GIS and remote sensing for sustainable development ".A fifth GeoTunis session in front of distinguished scientific users of GIS and remote sensing for the most recent experiments and applications in scientific fields. The congress will include 4 major scientific themes that address the various uses and applications of geographic information systems as well as numerous practical workshops supervised by the major international institutions active in the field. Go to link:> www.geotunis.org Defence Geospatial Intelligence (DGI) 2011 24 - 27 January, 2011 QEII Centre London The 7th Annual Geoint Conference & Exhibition Defence Geospatial Intelligence (DGI) is Europe's largest annual gathering dedicated to high-level discussion addressing the major challenges of the defence and government geospatial intelligence community. MSIA 2011 Conference A celebration of 100 years of national topographic mapping 1910-2010 Monday 28th and Tuesday 29th March University House, Australian National University, Canberra. The conference program will comprise papers and activities that will tell the story of 100 years of national topographic mapping. Registration details will be available towards the end of the year. Any inquiries can be directed to the Trevor Menzies, MSIA Heritage Program Manager and Conference Convener at trevor.menzies@ hotmail.com or telephone (08) 8981 3413. ISPRS Joint Workshop on 3D City Modelling & Applications First call for papers and Announcement-ISPRS Joint Workshop on 3D City Modelling & Applications which will be held on 26-27 June, 2011 in Wuhan University, P.R. China. In case of questions, please contact :[email protected]

For more information please consult the workshop website: www.lmars.whu.edu.cn/3DCMA2011.html 25th International Cartographic Conference 3–11 July 2011 Paris, France Open to researchers, engineers, students, data producers and software suppliers, the ICC 2011 will be held from 4th to 8th July 2011 at the Palais des Congrès in Paris, with simultaneous proceedings in eight meeting rooms. This conference will consider the most wide-ranging issues involving cartography and geomatics. In addition to oral presentations, sessions will be organized for the presentation of work in the form of poster displays. Go to link > http://www.icc2011.fr/ MODSIM 2011, International Congress on Modelling and Simulation, 12-16 December, Perth, Australia, mssanz.org.au/modsim2011 NOTE: If you are involved in a workshop, symposium or conference related to cartography please send me brief details for the newsletter.
=====================================================================================
If you have read this far then you deserve to know that:
“There is a city called Rome on every continent.”1
http://www.world‐english.org/facts.htm
and
“Istanbul, Turkey is the only city in the world located on two continents”
http://www.greatfacts.com/