COMMISSION OF THE EUROPEAN COMMUNITIES - salutare.ee Commission background... · COMMISSION OF THE...
45
EN EN COMMISSION OF THE EUROPEAN COMMUNITIES Brussels, BACKGROUND DOCUMENT FOR PRESS PACK – LAUNCH OF COMMISSION COMMUNICATION Solidarity in health: Reducing health inequalities in the EU 20 October 2009
Transcript of COMMISSION OF THE EUROPEAN COMMUNITIES - salutare.ee Commission background... · COMMISSION OF THE...

EN EN
COMMISSION OF THE EUROPEAN COMMUNITIES
Brussels,
BACKGROUND DOCUMENT FOR PRESS PACK – LAUNCH OF COMMISSION COMMUNICATION
Solidarity in health: Reducing health inequalities in the EU
20 October 2009

EN 2 EN
This is a background document produced for the launch of the Commission Communication Solidarity in health: Reducing health inequalities in the EU COM(2009) 567. It contains extracts of information included in the impact assessment for the Communication which will also be published as a staff working document. SEC(2009) 1397

EN 3 EN
1. Health inequalities in the EU........................................................................................5
2. Determinants (drivers or causes) of health inequalities..............................................16
3. What Member States are doing on health inequalities ..............................................34
4. Existing EU action and links to other relevant EU policies .......................................38
5. Bibliography ...............................................................................................................42
6. List of abbreviations ...................................................................................................44

EN 4 EN

EN 5 EN
1. HEALTH INEQUALITIES IN THE EU
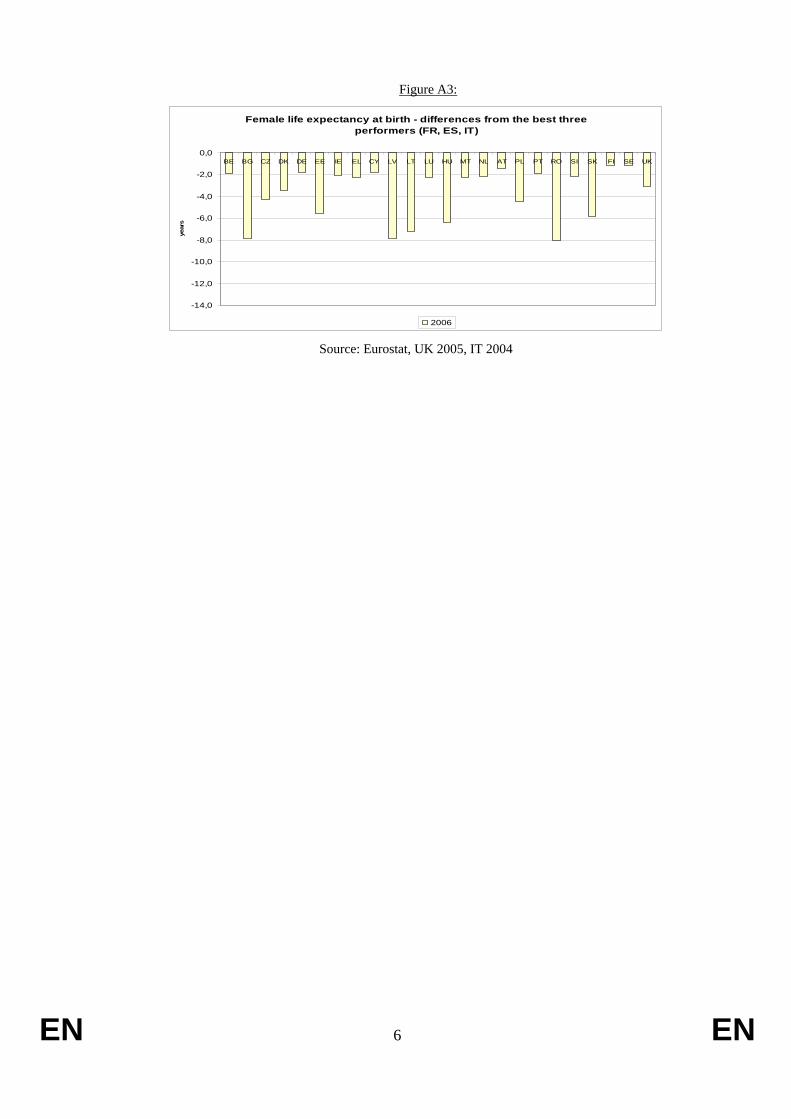
There are substantial differences in life expectancy at birth across the EU Member States, with individuals in many new Member States living shorter lives than their Western counterparts (Figures A1-A5). For example there is an 8-year gap for women (between ES, FR and IT, and BG, on one hand, and LV and RO on the other) and a 14-year gap for men (between CY and SE, on one hand, and LT and LV on the other). In BG, LV, LT, RO, SK, DK, EL and LU the gap between national life expectancy and the EU average has actually increased in the last two decades (Table A1).
Figure A1: Life expectancy at birth, 2006
0
10
20
30
40
50
60
70
80
90
BE BG CZ DK DE EE IE EL ES FR IT CY LV LT LU HU MT NL AT PL PT RO SI SK FI SE UK
men women
Source: Eurostat, UK 2005, IT 2004.
Figure A2:
Female life expectancy at birth - differences from the EU average
-7,0
-6,0
-5,0
-4,0
-3,0
-2,0
-1,0
0,0
1,0
2,0
3,0
BE BG CZ DK DE EE IE EL ES FR IT CY LV LT LU HU MT NL AT PL PT RO SI SK FI SE UK
year
s
2006 Source: Eurostat, UK 2005, IT 2004
EN 6 EN
Figure A3:
Female life expectancy at birth - differences from the best three performers (FR, ES, IT)
-14,0
-12,0
-10,0
-8,0
-6,0
-4,0
-2,0
0,0BE BG CZ DK DE EE IE EL CY LV LT LU HU MT NL AT PL PT RO SI SK FI SE UK
year
s
2006 Source: Eurostat, UK 2005, IT 2004

EN 7 EN
Figure A4:
Male life expectancy at birth - differences from the EU average
-12,0-11,0
-10,0-9,0-8,0
-7,0-6,0
-5,0-4,0-3,0
-2,0-1,00,0
1,02,0
3,04,0
BE BG CZ DK DE EE IE EL ES FR IT CY LV LT LU HU MT NL AT PL PT RO SI SK FI SE UK
year
s
2006 Source: Eurostat, UK 2005, IT 2004
Figure A5:
Male life expectancy at birth - differences from the best three performers (CY, SE, IT)
-14
-12
-10
-8
-6
-4
-2
0BE BG CZ DK DE EE IE EL ES FR LV LT LU HU MT NL AT PL PT RO SI SK FI UK
2006 Source: Eurostat, UK 2005, IT 2004

EN 8 EN
Table A1: Differences in female national life expectancy and the EU average, 1986, 1996 and 2006
Life expectancy 1986
difference toEU average
Life expectancy 1996
difference to EU average
Life expectancy 2006
difference to EU average
AT 77,8 -0,2 80,2 0,9 82,8 0,8
BE 78,2 0,2 80,7 1,4 82,3 0,3
BG 74,8 -3,2 74,5 -4,8 76,3 -5,7
CY 82,4 0,4
CZ 74,7 -3,3 77,5 -1,8 79,9 -2,1
DE 77,7 -0,3 80,1 0,8 82,4 0,4
DK 77,7 -0,3 78,3 -1,0 80,7 -1,3
EE 75,6 -3,7 78,6 -3,4
ES 79,9 1,9 82 2,7 84,4 2,4
FI 78,9 0,9 80,7 1,4 83,1 1,1
FR 79,8 1,8 84,4 2,4
GR 78,8 0,8 80,2 0,9 81,9 -0,1
HU 73,3 -4,7 75 -4,3 77,8 -4,2
IE 76,4 -1,6 78,7 -0,6 82,1 0,1
IT 79,1 1,1 81,8 2,5 83,8 1,8
LT 76,4 -1,6 75,9 -3,4 77 -5,0
LU 78,7 0,7 80,2 0,9 81,9 -0,1
LV 75 -3,0 76,8 -2,5 76,3 -5,7
MT 79,6 0,3 81,9 -0,1
NL 79,7 1,7 80,5 1,2 82 0,0
PL 76,6 -2,7 79,7 -2,3
PT 76,8 -1,2 79 -0,3 82,3 0,3
RO 72,8 -5,2 72,8 -6,5 76,2 -5,8
SE 80,2 2,2 81,7 2,4 83,1 1,1
SI 76,4 -1,6 79 -0,3 82 0,0
SK 75,1 -2,9 77 -2,3 78,4 -3,6
EN 9 EN
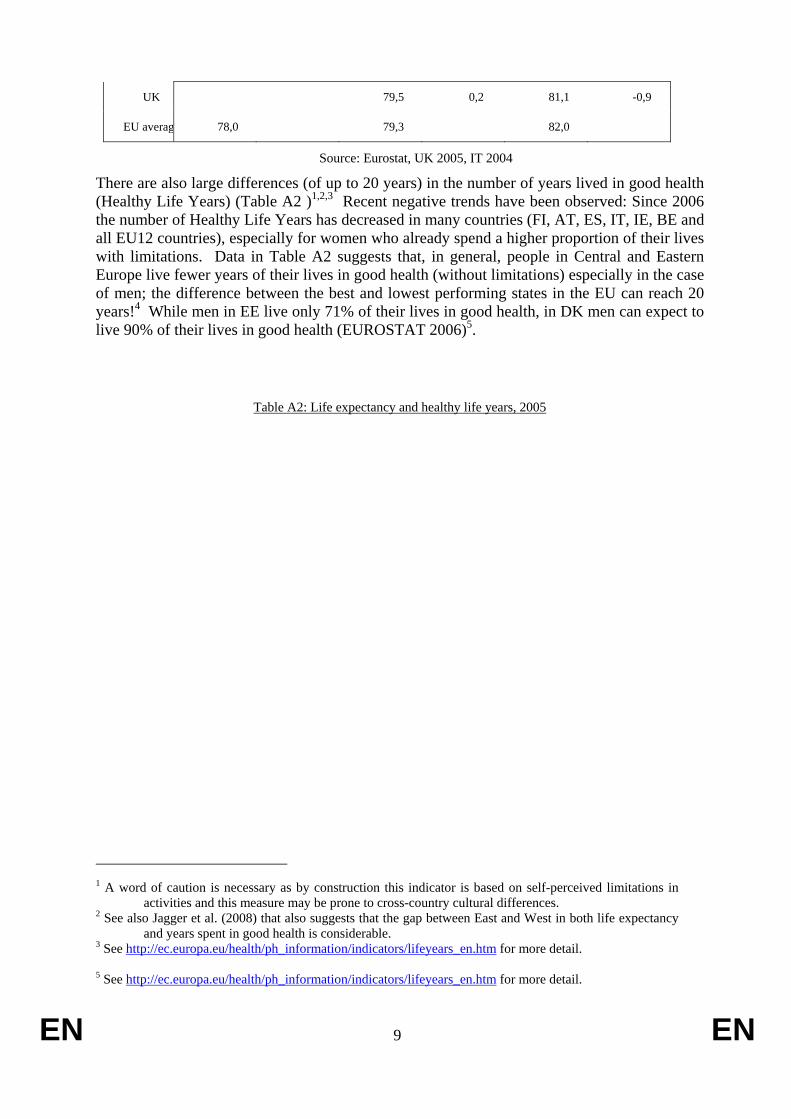
UK 79,5 0,2 81,1 -0,9
EU averag 78,0 79,3 82,0
Source: Eurostat, UK 2005, IT 2004
There are also large differences (of up to 20 years) in the number of years lived in good health (Healthy Life Years) (Table A2 )1,2,3 Recent negative trends have been observed: Since 2006 the number of Healthy Life Years has decreased in many countries (FI, AT, ES, IT, IE, BE and all EU12 countries), especially for women who already spend a higher proportion of their lives with limitations. Data in Table A2 suggests that, in general, people in Central and Eastern Europe live fewer years of their lives in good health (without limitations) especially in the case of men; the difference between the best and lowest performing states in the EU can reach 20 years!4 While men in EE live only 71% of their lives in good health, in DK men can expect to live 90% of their lives in good health (EUROSTAT 2006)5.
Table A2: Life expectancy and healthy life years, 2005
1 A word of caution is necessary as by construction this indicator is based on self-perceived limitations in
activities and this measure may be prone to cross-country cultural differences. 2 See also Jagger et al. (2008) that also suggests that the gap between East and West in both life expectancy
and years spent in good health is considerable. 3 See http://ec.europa.eu/health/ph_information/indicators/lifeyears_en.htm for more detail. 5 See http://ec.europa.eu/health/ph_information/indicators/lifeyears_en.htm for more detail.
EN 10 EN
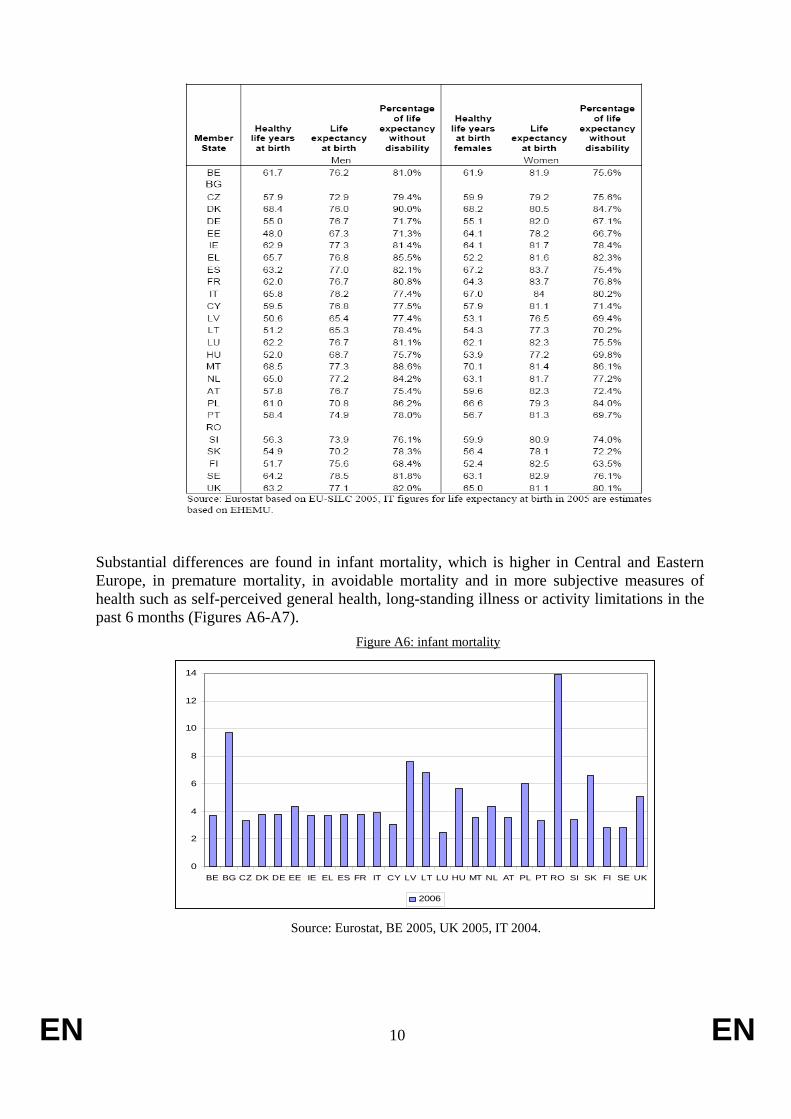
Substantial differences are found in infant mortality, which is higher in Central and Eastern Europe, in premature mortality, in avoidable mortality and in more subjective measures of health such as self-perceived general health, long-standing illness or activity limitations in the past 6 months (Figures A6-A7).
Figure A6: infant mortality
0
2
4
6
8
10
12
14
BE BG CZ DK DE EE IE EL ES FR IT CY LV LT LU HU MT NL AT PL PT RO SI SK FI SE UK
2006
Source: Eurostat, BE 2005, UK 2005, IT 2004.

EN 11 EN
Figure A7: Premature mortality - risk (probability) of dying before the age of 65, 2002
Detailed analysis of the health gap (see Annual Report of the European Observatory on Social Situation and Demography6) between EU-15 (+ MT & CY), and the remaining new Member States shows that differences between Member States are explained partly by high mortality and morbidity in terms of cardiovascular disease, injuries and violence, cancer, and alcohol-related diseases and their underlying risk factors: smoking, diet and alcohol consumption. In some countries, contrary to the general EU trend, some mortality rates have grown during the last decade. For example (EUROSTAT, 2006), death rates due to ischemic heart diseases for women are 12 times higher in LT than in FR (263.2 vs 22.5 deaths per 100,000 inhabitants), death rates due to pneumonia varies 9 fold for men (5.3 in EL vs 46.4 deaths per 100.000 inhabitants in SK), and death rates from cerebrovascular diseases for women are 6 times higher in RO than in FR (184.9 vs 25.9 deaths per 100.000 inhabitants). Death rates from liver cirrhosis for men are 10 times higher in HU or RO than in NL or EL (65 and 52 vs 4.4 and 5.3 per 100,000 inhabitants). Fatal injuries amongst men in the Baltic States (LT, LV, EE) are about 7 fold higher than in the NL and the UK (219, 210 and 206 deaths vs 31 and 33 deaths per 100,000 inhabitants). There are also differences in disease incidence: e.g. the incidence rate of lung cancer for men varies 4.5 fold between EU countries (GLOBOCAN 2002, IARC - International Agency on Research on Cancer). In addition, mortality rates have increased in the poorest Member States since 1996 (EUROSTAT): e.g. the mortality rate due to pneumonia has risen in LT by 52%, in LV by 34%, and in PL by 13%, when many other Member States have actually reduced such mortality rates by up to 50%. Moreover, LV, LT, HU, SK and PL have reduced mortality due to ischaemic heart disease and respiratory diseases by only 5% since 1996 (Inequalities in health outcomes between socio-economic groups within Member States.
6 See http://ec.europa.eu/employment_social/spsi/reports_and_papers_en.htm
Women
25%18%18%17%16%16%16%15%13%13%13%12%11%11%11%11%10%10%10%10%
9%9%9%9%9%8%8%7%
0%20%40%60%80%100%
RussiaRomaniaLatviaHungaryEstoniaBulgariaLithuaniaEU10SlovakiaPolandDenmarkCzech Rep.BelgiumUKNetherlandSloveniaIrelandPortugalLuxembourgGermanyEU15FinlandFranceAustriaSwedenItalyGreeceSpain
Men
59%44%
43%41%
36%36%
33%33%
31%31%
25%25%
22%20%20%20%19%19%18%18%18%18%18%17%17%
16%15%
14%
0% 20% 40% 60% 80% 100%
RussiaLatvia
EstoniaLithuaniaHungary
RomaniaEU10
BulgariaSlovakia
PolandCzech Rep.
SloveniaPortugalBelgium
FranceFinland
LuxembourgDenmarkGermany
AustriaIreland
EU15Spain
UKGreece
NetherlandItaly
Sweden

EN 12 EN
The literature showing socio-economic differences in health in the EU is extensive7. These start at a young age and persist and widen in older ages (SHARE). An analysis (Mackenbach, 2006)8 produced for the UK Presidency9 shows differences in life expectancy at birth and at higher ages between the lowest and the highest socio-economic groups (e.g. between manual and professional occupations; people with primary level and post-secondary education; low and high income quintile) ranging from 4 to 10 years for men and from 2 to 7 years for women. In some countries the gap has widened in the last decades.
Also, despite an overall decline, mortality and infant mortality are higher in the lowest socio-economic groups and relative inequalities have increased in several countries. The risk of dying in the lowest socio-economic groups was found to be 25 to 50 to even 150% more than in higher groups and relative inequalities in mortality have increased in several countries. Inequalities in mortality from cardio-vascular diseases account for about half of the excess mortality in lower socio-economic groups, who also register lower cancer survival. Also, despite an overall decline, infant mortality continues to be higher in lower social-economic groups. In some countries this gap has increased.
Rates of disease and disability also vary substantially by socio-economic group. People with lower education live shorter lives and spend more time in poorer health. For ‘self-perceived general health’ a clear income gradient can be observed in that those in the lowest (poorest) income quintiles more often report very bad health than those in the highest (richest) quintiles (Table A3). In some countries (DK, LT, and SK) the percentage reporting very bad health in the lowest quintile has gone up since 2005.10 Similar conclusions can be drawn when looking at self-perceived activity limitations (Table A4). SHARE data shows that individuals with lower education or lower income are more likely to experience limitations with mobility, arm or motor functions and have a higher prevalence of eyesight, hearing and chewing problems. Several studies (Dastra et al., 2005; Huisman, Kunst et al., 2003; Huisman, Kunst et al., 2004) found socio-economic inequalities for a range of common chronic diseases such as diabetes, arthritis, chronic respiratory and heart diseases (figure A8).
7 See the Health Status & Living Conditions part of the Monitoring Reports from the European Observatory
on Social Situation and Demography reports for a review of the literature at http://ec.europa.eu/employment_social/spsi/reports_and_papers_en.htm
8 See "Health inequalities: Europe in Profile" by Mackenbach (2006) at http://ec.europa.eu/health/ph_determinants/socio_economics/keydo_socioeco_en.htm. Previous important studies include van Doorslaer, Wagstaff et al. (1997), Cavelaars, Kunst et al. (1998), Mackenbach, Cavelaars et al. (2000); Mackenbach, Bos et al. (2003), Avendano, Kunst et al. (2005).
9 See http://www.dh.gov.uk/en/Healthcare/International/EuropeanUnion/EUPresidency2005/DH_4119613 10 A word of caution is needed when looking at these conclusions, as current information covers a maximum
of three years and hence the changes observed may not be a significant sign of a trend.

EN 13 EN
Table A3: Self-perceived general health (very bad health), by income quintile
Source: Eurostat based on EU-SILC 2006 data

EN 14 EN
Table A4: Self-perceived limitations in activities people usually do as a result of health problems and lasting for at least the last 6 months (severely hampered in activities), by income quintile
Source: Eurostat based on EU-SILC 2006 data
Note: DK does not report severe and moderate limitations separately.
Source: SHARE 2005

EN 15 EN
Figure A8: Odds ratios of having a chronic disease between 2004 and 2006 comparing low and middle with high wealth
Source: SHARE 2007. NB: The odds are adjusted for age, gender, country, and the time-interval
between waves
Some vulnerable groups suffer a greater burden of mortality and disease11. These include some migrant and ethnic minority populations, people living in deprived urban and rural areas and in poverty, the unemployed, especially long-term unemployed, those informally employed, seasonal/daily workers and subsistence farmers, those further from the labour market, jobless households, the homeless, the disabled, those suffering from mental or chronic illnesses, elderly pensioners on minimum pensions, and single parents. In rural areas of RO and BG infant mortality is 3 times higher than in the capital. Inequalities between nationals and migrants persist in Europe, in terms of health status and in access to health services (promotion, prevention, treatment and care).12,13 Note for example that migrants may experience greater health risk than the majority population due to greater vulnerability to communicable diseases (TB, HIV/AIDS, hepatitis). They may also face higher risks of non-communicable diseases (cardiovascular disease) and mental health problems due to a combination of the socio-economic and environmental conditions in the origin, transit and host countries (2007 Council Conclusions on Health and Migration in the EU).
11 As indicated in the Joint Report on Social Protection and Social Inclusion and social OMC and equal
opportunities related studies/ networks, the Handbook on Integration for policy-makers and practitioners, the Health and Migration in the EU work under the 2007 PT Presidency, and the work of the International Organisation of Migration.
12 See "Challenges for health in the age of migration" at http://www.eu2007.min-saude.pt/PUE/en/conteudos/programa+da+saude/Publications/Relat%C3%B3rio+Sa%C3%BAde+e+Migra%C3%A7ao.htm
13 See also "Migration and the right to health", IOM, at http://www.iom.int/jahia/webdav/site/myjahiasite/shared/shared/mainsite/published_docs/serial_publications/IML12-MRH%20dec07.pdf and "Quality in and equality of access to healthcare services" at http://ec.europa.eu/employment_social/spsi/studies_en.htm#healthcare

EN 16 EN
The June 2006 Council Conclusions on Women's Health14 recognise the importance of the gender dimension in health. Health inequalities are also a global issue (WHO CSDH, 2008).
Importantly, there appears to be a strong association between within country socio-economic inequalities in health and the overall population health i.e. the higher the socio-economic inequality in health, the poorer the overall population health. Addressing health inequalities within Member States could thus contribute to reducing differences in health outcomes between Member States. The importance of addressing health inequalities as part of overall socio-economic development was highlighted in Council Conclusions under the 2006 Finnish Presidency15 and in the 2008 Joint Report on Social Protection and Social Inclusion.
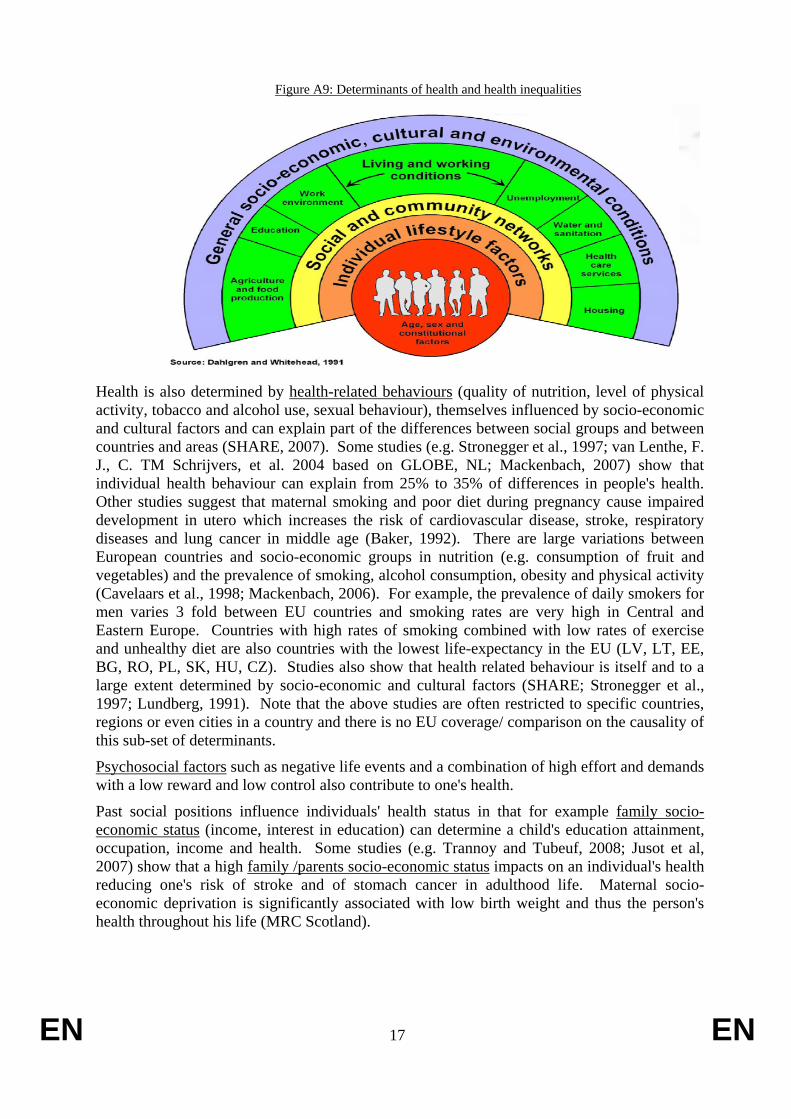
2. DETERMINANTS (DRIVERS OR CAUSES) OF HEALTH INEQUALITIES Several models (varying in complexity and details) synthesize the relation between various determinants (including socio-economic factors) and health (Figure A9). They illustrate the “layered” view of the causation of health inequalities (Mackenbach, 2002): health is not randomly distributed but the result of systematic differences in the distribution of those factors, in a variety of areas, which improve or harm health.
According to these models, while biological factors/ genetic predispositions may explain why one person is more likely to get ill than another in the same circumstances, living and working conditions, as well as exclusion and marginalisation, affect health through direct and indirect physical and psychological mechanisms. Some factors operate over long periods: e.g. poor conditions in childhood can affect health later in life. Depending on where people live and what their situation is, people differ in their exposure to positive and negative factors which influence health.
Indeed, individuals face differences in the quality of their physical and social environments (at home – central heating, insulation, dampness, crowding, at school, in the workplace – exposure to chemicals, accidents and physically hard work; social networks) and are more likely to be in poor health when they live in poor housing/social environments (WHO World Report 2003, WHO CSDH). In relation to housing, for example, people are significantly more likely to be in poor health when they live in housing characterised by poor conditions such as: insufficient protection against noise, vibrations, dampness, droughts, mould, and cold in winter; overcrowding; lack of light or no view of the outside environment; impediments to socialisation (e.g. absence of parks and gardens); vandalism; and other factors which occur more often with low socioeconomic status, such as fear of losing the dwelling, having bad image of the neighbours. In terms of living conditions, the exposure to noise in EU countries for example ranges from 3% up to 18% with possibly big regional/local differences (Table A5). There are sections of the EU population which do not have access to running water, adequate washing and toilet facilities, affordable energy, appropriate housing, heating, new clothes, or safe environment (e.g. EUROFUND – 2008 European Quality of Life Survey16). Some studies (e.g. Trannoy and Tubeuf, 2008; Tubeuf et al., 2008) show a geographic environment (pollution) and a neighbourhood/area (deprivation defined as high unemployment rates, single parent families, high share of individuals with lower education) effect (negative) on the health of individuals independently of each individual characteristics.
14 See http://www.consilium.europa.eu/uedocs/cms_data/docs/pressdata/en/lsa/89830.pdf 15 Council Conclusions on Health in All Policies (HIAP).
http://ec.europa.eu/health/ph_projects/2005/action1/docs/2005_1_18_frep_a8_en.pdf 16 See http://www.eurofound.europa.eu/pubdocs/2008/52/en/1/EF0852EN.pdf
EN 17 EN
Figure A9: Determinants of health and health inequalities
Health is also determined by health-related behaviours (quality of nutrition, level of physical activity, tobacco and alcohol use, sexual behaviour), themselves influenced by socio-economic and cultural factors and can explain part of the differences between social groups and between countries and areas (SHARE, 2007). Some studies (e.g. Stronegger et al., 1997; van Lenthe, F. J., C. TM Schrijvers, et al. 2004 based on GLOBE, NL; Mackenbach, 2007) show that individual health behaviour can explain from 25% to 35% of differences in people's health. Other studies suggest that maternal smoking and poor diet during pregnancy cause impaired development in utero which increases the risk of cardiovascular disease, stroke, respiratory diseases and lung cancer in middle age (Baker, 1992). There are large variations between European countries and socio-economic groups in nutrition (e.g. consumption of fruit and vegetables) and the prevalence of smoking, alcohol consumption, obesity and physical activity (Cavelaars et al., 1998; Mackenbach, 2006). For example, the prevalence of daily smokers for men varies 3 fold between EU countries and smoking rates are very high in Central and Eastern Europe. Countries with high rates of smoking combined with low rates of exercise and unhealthy diet are also countries with the lowest life-expectancy in the EU (LV, LT, EE, BG, RO, PL, SK, HU, CZ). Studies also show that health related behaviour is itself and to a large extent determined by socio-economic and cultural factors (SHARE; Stronegger et al., 1997; Lundberg, 1991). Note that the above studies are often restricted to specific countries, regions or even cities in a country and there is no EU coverage/ comparison on the causality of this sub-set of determinants.
Psychosocial factors such as negative life events and a combination of high effort and demands with a low reward and low control also contribute to one's health.
Past social positions influence individuals' health status in that for example family socio-economic status (income, interest in education) can determine a child's education attainment, occupation, income and health. Some studies (e.g. Trannoy and Tubeuf, 2008; Jusot et al, 2007) show that a high family /parents socio-economic status impacts on an individual's health reducing one's risk of stroke and of stomach cancer in adulthood life. Maternal socio-economic deprivation is significantly associated with low birth weight and thus the person's health throughout his life (MRC Scotland).

EN 18 EN
Table A5: Differences in life-styles and living and working conditions between EU Member States
Source: Eurobarometer 283
Figure A10: regular daily smokers in the population (%), age +15, WHO European Region

EN 19 EN
European Observatory of the Social Situation and Demography
Figure A11: pure alcohol consumption, litres per capita, WHO European Region
European Observatory of the Social Situation and Demography
Figure A12: obesity rates in european countries

EN 20 EN
European Observatory of the Social Situation and Demography
Table A6: Differences in life-styles and living and working conditions by age, gender and socio-economic status
Source: Eurobarometer 283
Table A7:. Socio-economic inequalities in daily smoking in Sweden
Number of daily smokers p1,000 Relative difference Absolute difference
1988-89 1998-99 1988-89 1998-99 1988-89 1998-99
Blue-collar 314 223 1.6 1.7 115 91
White-collar 199 132

EN 21 EN
Men
Poorly educated 327 265 1.6 3.4 118 186
Highly educated 209 79
Blue-collar 328 263 1.8 1.7 144 110
White-collar 184 153
Women
Poorly educated 310 277 2.1 3.0 163 185
Highly educated 147 92
Source: Boström & Rosén, 2003.
Unemployment is associated with increased chance of poor mental health, social exclusion (Kessler et al. 1987; Warr 1987) and suicide (Blakely, 2003). Job quality and working conditions also affect health to a great extent. A good working environment plays a crucial role in terms of ensuring people's health: e.g. differences in exposure to physical, chemical, and biological agents at work lead to differences in health status. A number of studies have suggested that job quality and working conditions affect health to a great extent (e.g. Debrand and Lengagne, 2008; Jusot et al., 2007): low physical pressure and stress, high decision ability and possibilities to develop new skills, a correct monetary reward and having prospects for personal progress contribute to good health status whereas lack of support at work and the feeling of job insecurity increase the risk of ill health, including depression. Occupational health risks vary significantly across sectors and not all workers are equally exposed to occupational hazards (European Agency for Safety and Health at Work)17: e.g. young workers are usually less informed about occupational risks, which makes them overexposed, and workers with a fixed-duration or temporary employment relationship are more exposed to the risk of accidents at work and occupational diseases. The Whitehall-Study (1984) of UK 17.500 civil servants shows a clear gradient between the lowest and the highest professional level of civil servants. The link between type of work and health is related not only to income, but also to type of contract, method of work organization and occupational health and safety.
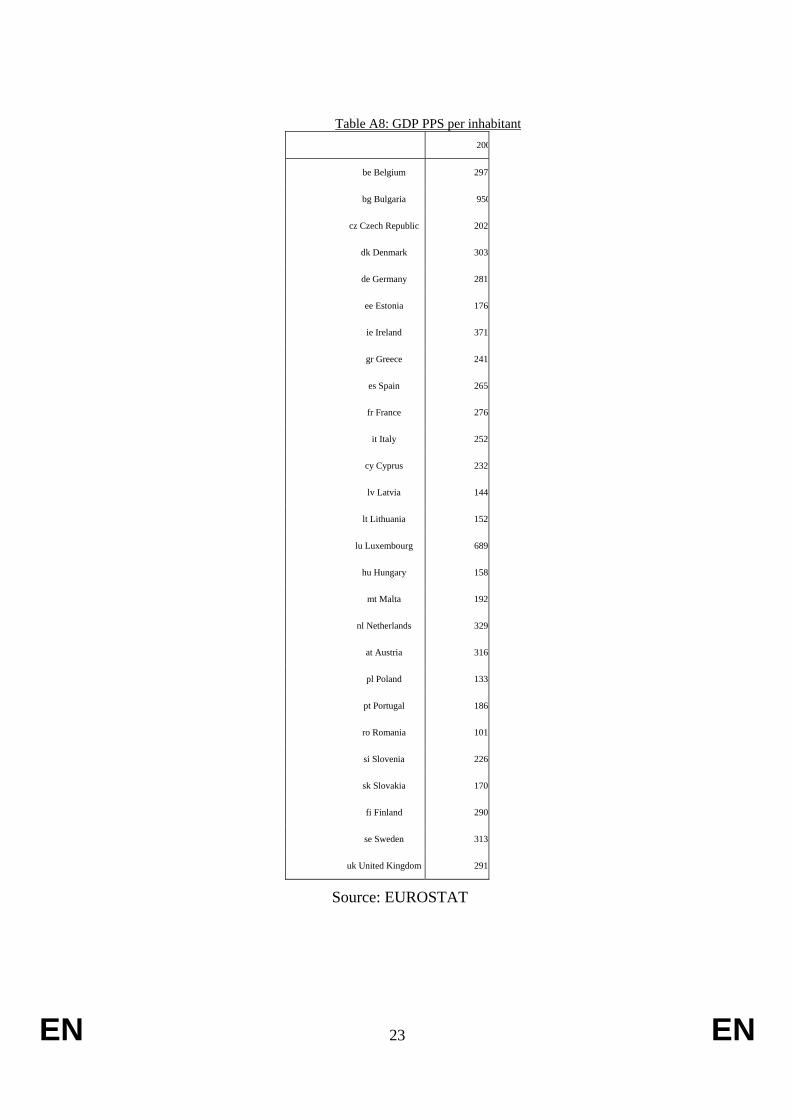
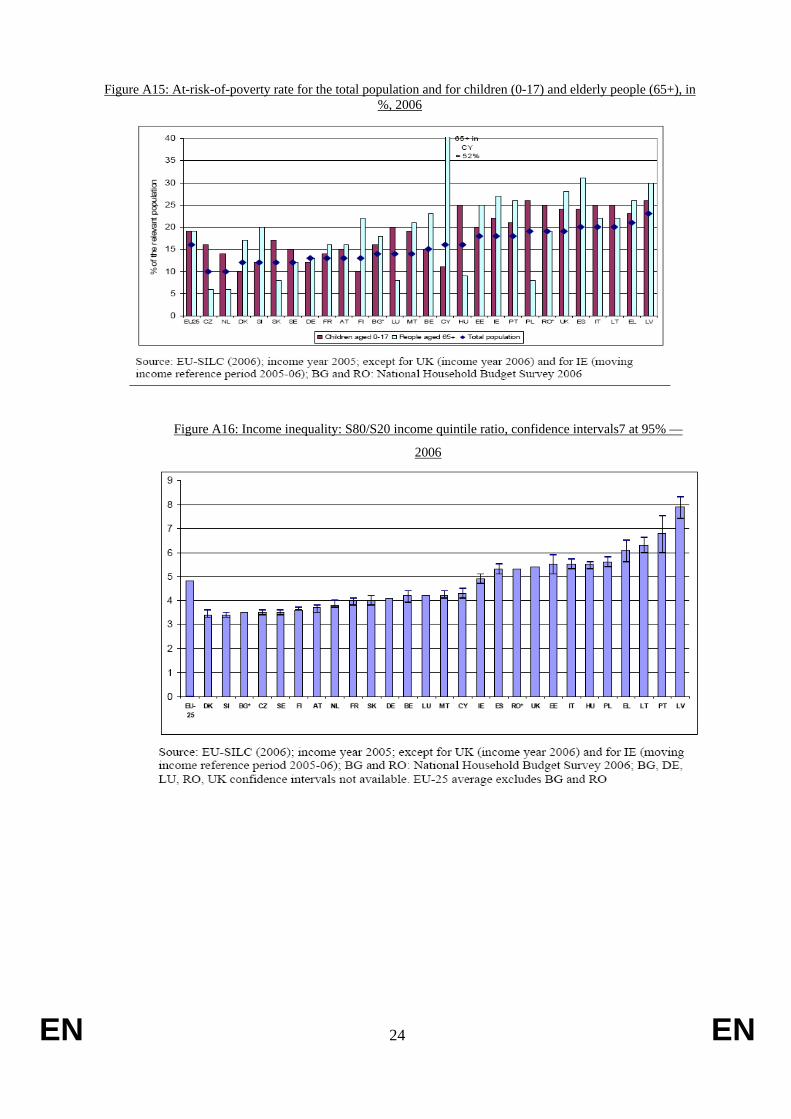
We can indeed observe geographic disparities in employment, unemployment (Figures A13 and A1) and long-term unemployment rates, in working conditions, in continuous life long-training and adult education, in health and safety and health at the workplace practices (e.g. Employment Report18), which might also help explain part of the differences in health between countries. GDP per capita and poverty rates vary across the EU, and substantial income inequality persists (Table A8 and Figures A15-A16). In 2006 the total income received by the 20% of the population with the highest income was 4.8 times higher than that received by the 20% with the lowest income.
17 See e.g. http://osha.europa.eu/en/topics/accident_prevention/risks 18 See http://ec.europa.eu/employment_social/employment_analysis/employ_en.htm

EN 22 EN
Figure A13: employment rates in the EU; total, women and older workers; 2007.
.
Figure A14: Unemployment and youth unemployment; 2000 and 2007.
EN 23 EN
Table A8: GDP PPS per inhabitant
200
be Belgium 2970
bg Bulgaria 950
cz Czech Republic 2020
dk Denmark 3030
de Germany 2810
ee Estonia 1760
ie Ireland 3710
gr Greece 2410
es Spain 2650
fr France 2760
it Italy 2520
cy Cyprus 2320
lv Latvia 1440
lt Lithuania 1520
lu Luxembourg 6890
hu Hungary 1580
mt Malta 1920
nl Netherlands 3290
at Austria 3160
pl Poland 1330
pt Portugal 1860
ro Romania 1010
si Slovenia 2260
sk Slovakia 1700
fi Finland 2900
se Sweden 3130
uk United Kingdom 2910
Source: EUROSTAT
EN 24 EN
Figure A15: At-risk-of-poverty rate for the total population and for children (0-17) and elderly people (65+), in %, 2006
Figure A16: Income inequality: S80/S20 income quintile ratio, confidence intervals7 at 95% —
2006
EN 25 EN
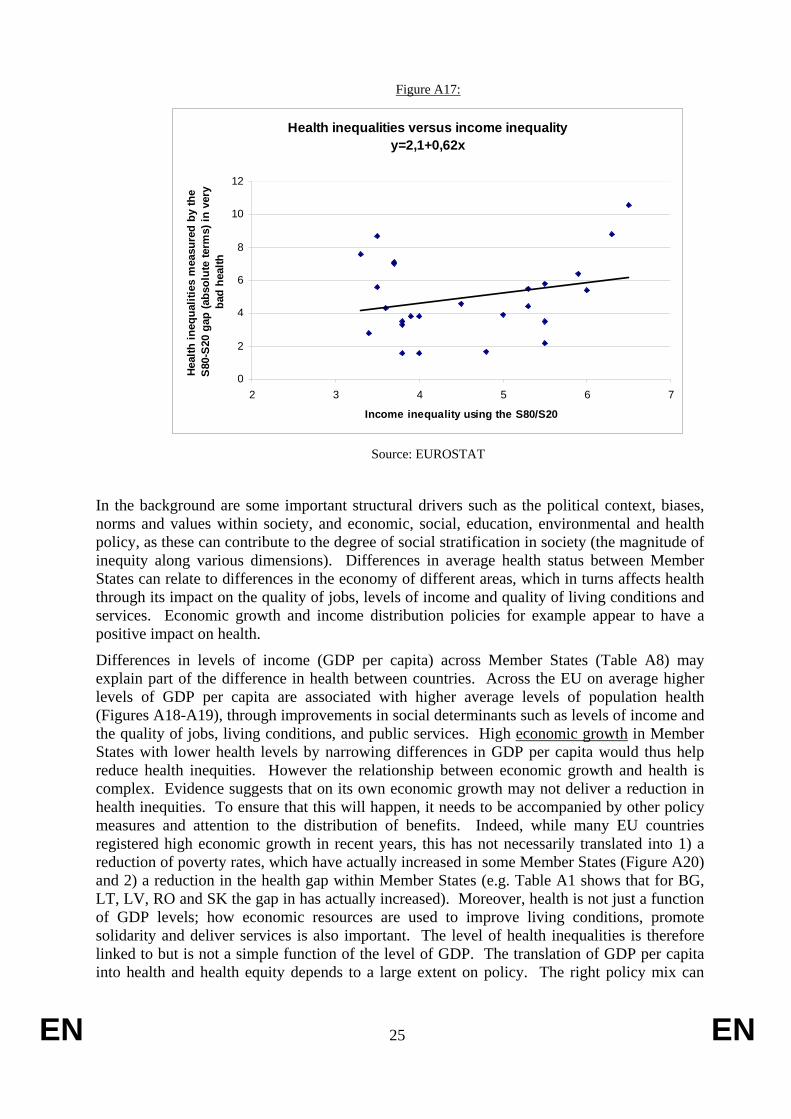
Figure A17:
Health inequalities versus income inequalityy=2,1+0,62x
0
2
4
6
8
10
12
2 3 4 5 6 7
Income inequality using the S80/S20
Heal
th in
equa
litie
s m
easu
red
by th
e S
80-S
20 g
ap (a
bsol
ute
term
s) in
ver
y ba
d he
alth
Source: EUROSTAT
In the background are some important structural drivers such as the political context, biases, norms and values within society, and economic, social, education, environmental and health policy, as these can contribute to the degree of social stratification in society (the magnitude of inequity along various dimensions). Differences in average health status between Member States can relate to differences in the economy of different areas, which in turns affects health through its impact on the quality of jobs, levels of income and quality of living conditions and services. Economic growth and income distribution policies for example appear to have a positive impact on health.
Differences in levels of income (GDP per capita) across Member States (Table A8) may explain part of the difference in health between countries. Across the EU on average higher levels of GDP per capita are associated with higher average levels of population health (Figures A18-A19), through improvements in social determinants such as levels of income and the quality of jobs, living conditions, and public services. High economic growth in Member States with lower health levels by narrowing differences in GDP per capita would thus help reduce health inequities. However the relationship between economic growth and health is complex. Evidence suggests that on its own economic growth may not deliver a reduction in health inequities. To ensure that this will happen, it needs to be accompanied by other policy measures and attention to the distribution of benefits. Indeed, while many EU countries registered high economic growth in recent years, this has not necessarily translated into 1) a reduction of poverty rates, which have actually increased in some Member States (Figure A20) and 2) a reduction in the health gap within Member States (e.g. Table A1 shows that for BG, LT, LV, RO and SK the gap in has actually increased). Moreover, health is not just a function of GDP levels; how economic resources are used to improve living conditions, promote solidarity and deliver services is also important. The level of health inequalities is therefore linked to but is not a simple function of the level of GDP. The translation of GDP per capita into health and health equity depends to a large extent on policy. The right policy mix can

EN 26 EN
achieve reductions in disparities and thus improve general health by optimising the health gain for the resources available. Globally there are examples of countries with high GDP and high health inequalities (USA) or lower health inequalities (Canada).
Figure A18: Life expectancy versus real GDP per capita PPP$
Figure A19: Trends in GDP per capita and life expectancy at birth in 133 countries
grouped by the 1975 GDP, 1975-2005
Source: WHO World Report 2008
0 1 0 0 0 0 2 0 0 0 0 3 0 0 0 0 4 0 0 0 0 5 0 0 0 0 6 0 0 0 0 7 0 0 0 06 0
6 5
7 0
7 5
8 0
8 5 Au s tr iaB e lg iu mB u lg a r iaC yp ru sC ze c h R e p u b l icD e n m a rkE s to n iaF in la n dF ra n c eG e rm a n yG re e c eH u n g a ryIc e la n dIre la n dIta lyL a tviaL i th u a n iaL u xe m b o u rgM a l taN e th e r la n d sN o rw a yP o la n dP o r tu g a lR o m a n iaS lo va k iaS lo ve n iaS p a inS w e d e nT u rk e yU n i te d K in g d o m
Y = 0 . 0 0 0 2 8 3 3 X + 7 0 .0 4Y
X
X - R e a l g ro s s d o m e s tic p ro d u c t, P P P $ p e r c a p i ta , L a s t a va i la b leY - L i fe e xp e c ta n c y a t b i r th , in ye a rs , L a s t a va i la b le
EN 27 EN
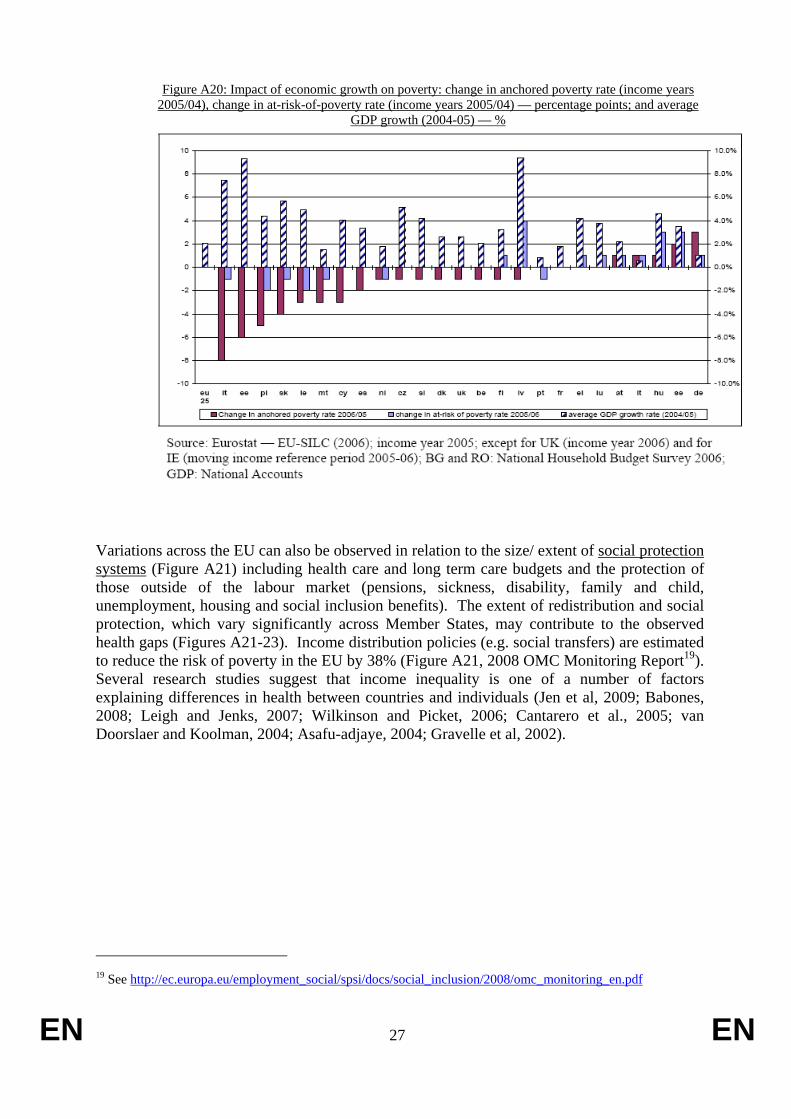
Figure A20: Impact of economic growth on poverty: change in anchored poverty rate (income years 2005/04), change in at-risk-of-poverty rate (income years 2005/04) — percentage points; and average
GDP growth (2004-05) — %
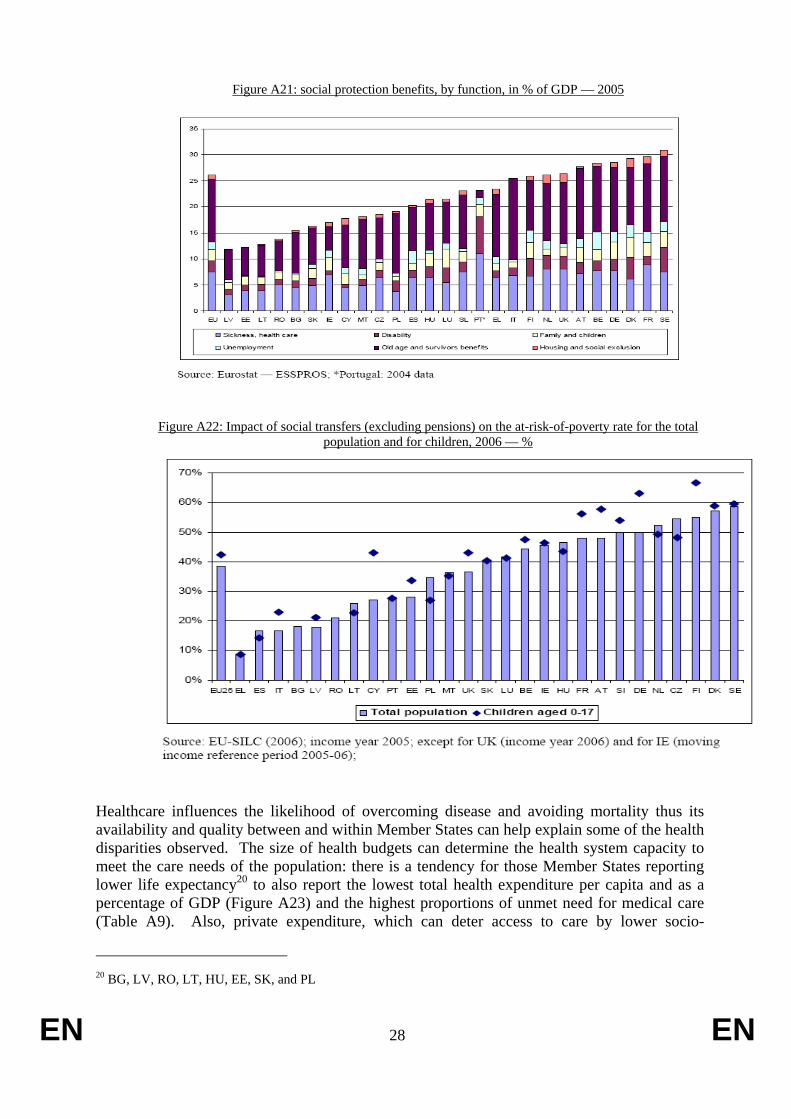
Variations across the EU can also be observed in relation to the size/ extent of social protection systems (Figure A21) including health care and long term care budgets and the protection of those outside of the labour market (pensions, sickness, disability, family and child, unemployment, housing and social inclusion benefits). The extent of redistribution and social protection, which vary significantly across Member States, may contribute to the observed health gaps (Figures A21-23). Income distribution policies (e.g. social transfers) are estimated to reduce the risk of poverty in the EU by 38% (Figure A21, 2008 OMC Monitoring Report19). Several research studies suggest that income inequality is one of a number of factors explaining differences in health between countries and individuals (Jen et al, 2009; Babones, 2008; Leigh and Jenks, 2007; Wilkinson and Picket, 2006; Cantarero et al., 2005; van Doorslaer and Koolman, 2004; Asafu-adjaye, 2004; Gravelle et al, 2002).
19 See http://ec.europa.eu/employment_social/spsi/docs/social_inclusion/2008/omc_monitoring_en.pdf
EN 28 EN
Figure A21: social protection benefits, by function, in % of GDP — 2005
Figure A22: Impact of social transfers (excluding pensions) on the at-risk-of-poverty rate for the total population and for children, 2006 — %
Healthcare influences the likelihood of overcoming disease and avoiding mortality thus its availability and quality between and within Member States can help explain some of the health disparities observed. The size of health budgets can determine the health system capacity to meet the care needs of the population: there is a tendency for those Member States reporting lower life expectancy20 to also report the lowest total health expenditure per capita and as a percentage of GDP (Figure A23) and the highest proportions of unmet need for medical care (Table A9). Also, private expenditure, which can deter access to care by lower socio-
20 BG, LV, RO, LT, HU, EE, SK, and PL

EN 29 EN
economic groups, may be a factor contributing to health inequalities in some countries (2008 OMC monitoring report).
Figure A23: total health expenditure as % of GDP, 2006 or most recent year
Total health expenditure as % of GDP, 2006
0.0
2.0
4.0
6.0
8.0
10.0
12.0fr de be pt at dk nl se el it si es mt
uk hu fi bg ie lx sk cz lv pl cy lt ro ee
%
Public expenditure Private expenditure
Source: OECD Health Data 2008 and WHO, HFA-DB
Table A9: Self-reported unmet need for medical care in the last year, 2006
Source: Eurostat based on EU-SILC 2006 data
Availability (infrastructure, equipment and health professionals), access and quality of healthcare are keys factors determining health and health inequalities as they influence the likelihood of overcoming morbidity and avoiding mortality. Health systems inadequacies
EN 30 EN
include under-resourcing (financial and human21) and uneven geographical coverage. Quality distribution of resources and facilities including poor coverage in some regions and for some disadvantaged social groups such as Roma (e.g. Joint Reports on Social Inclusion and Social Protection). They affect the way diseases are diagnosed and treated and thus population health. The size of national health budgets can determine the capacity of a given health system to meet the needs of the population. The quality of healthcare plays a key role: e.g. every year 3 million patients suffer from healthcare associated infections and 50.000 die from them22. Differences in access to quality care translate into very large differences in treatable mortality i.e. conditions that respond to healthcare intervention (Newey, Nolte, McKee, & Mossialos, 2003, 2008). This is particularly acute in some regions of new Member States which lack high quality health facilities with up to date equipment and well trained staff.
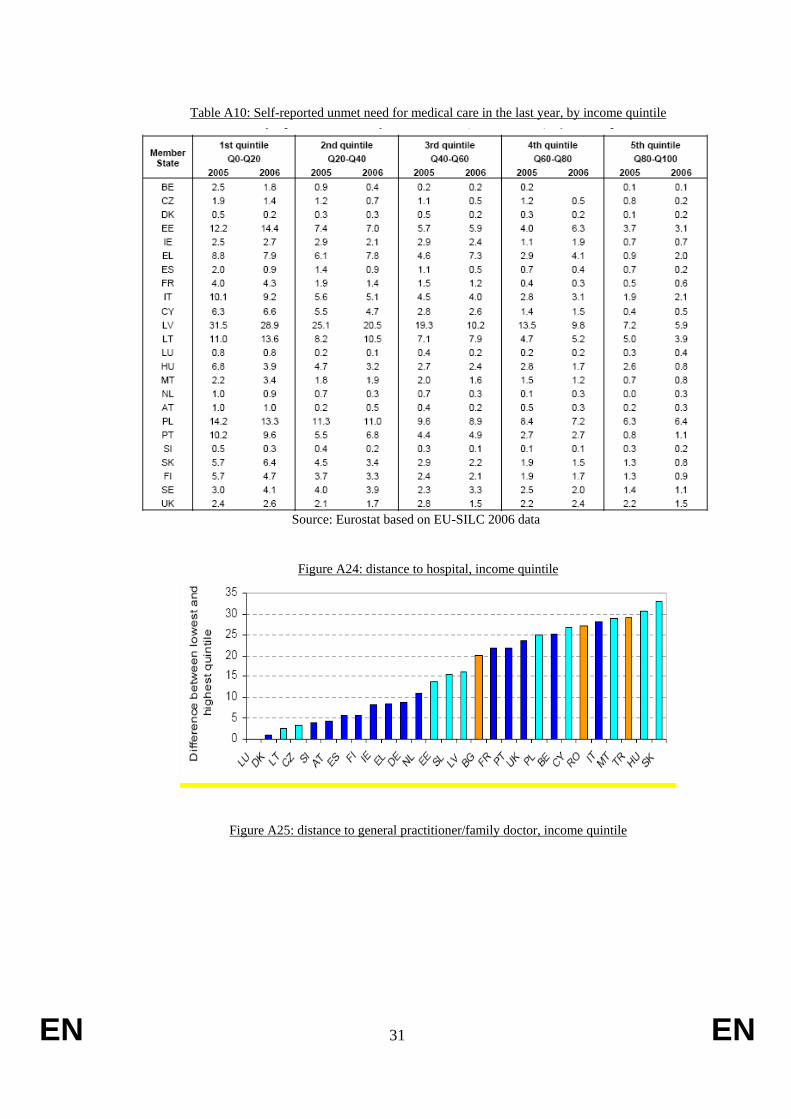
Moreover, socio-economic differences in access to care can be observed (e.g. Alter et al, 1999, 2006). There is a clear income gradient in unmet need for medical care: those in the lowest income quintiles more often report an unmet need due to waiting, the direct financial cost of care and the distance to care (Table A10). Evidence suggests that lower income families have further to travel to hospital or family doctor (Figures A24 and A25) and those with low incomes have a lower chance of being admitted to hospital or be seen by a specialist. Several Joint Reports on Social Protection and Social Inclusion have identified barriers to access: lack of health insurance coverage23, direct financial costs of care, geographical disparities in service availability, waiting times, lack of information, discrimination and language barriers, health literacy and socio-cultural expectations in relation to life and care services.
For example, in most countries, doctors and facilities tend to be concentrated in the capital and richer regions (2009 Joint Report on Social Protection and Social Inclusion). The current healthcare staff shortages, which may increase as a result of ageing, can undermine the quality of healthcare systems24. Finally, health staff may not be trained on issues of equity, social exclusion and discrimination or mental health problems.
Access to healthcare is also affected by gender. A gender-sensitive focus is critical when trying to reduce health inequalities as many are caused by social factors, such as education, employment and family life, where, again, gender has a significant impact.
In general, inequitable access to care appears to be associated with higher health inequalities (Figure A26).
21 When looking at resources, a 2-fold difference in the number of practicing physicians per 100,000
population fold can be found between EU countries. 22 See: The First European Communicable Disease Epidemiological Report, http://www.ecdc.eu.int/pdf/Epi_report_2007.pdf, p. 319. 23 See 2008 OMC Monitoring Report where data and analysis of national strategy reports shows that in
several EU Member States – NL, PL, SK, AT, BE, ES, LU, DE, FR, SI, LT and EE – non-negligible numbers of the population are not covered by public or primary private insurance
24 See: Green Paper on the European Workforce for Health, 2008, http://ec.europa.eu/health/ph_systems/docs/workforce_gp_en.pdf, p. 6.
EN 31 EN
Table A10: Self-reported unmet need for medical care in the last year, by income quintile
Source: Eurostat based on EU-SILC 2006 data
Figure A24: distance to hospital, income quintile
Figure A25: distance to general practitioner/family doctor, income quintile

EN 32 EN
Figure A26:
Health inequalities versus inequitable access to medical carey=-0,76+1,06x
0
2
4
6
8
10
12
0 5 10 15 20 25
Socio-economic (income) inequalities in health measured by the gap (absolute terms) between the highest and the lowest income quintile (S80-S20) in the % of
those reporting unmet need for medical care
Soci
o-ec
onom
ic (i
ncom
e) in
equa
litie
s in
hea
lth m
easu
red
by th
e ga
p (a
bsol
ute
term
s) b
etw
een
the
high
est
and
the
low
est i
ncom
e qu
intil
e (S
80-
S20)
in th
e %
of t
hose
repo
rtin
g ve
ry
bad
heal
th
Source: Eurostat based on EU-SILC 2006 data
EN 33 EN
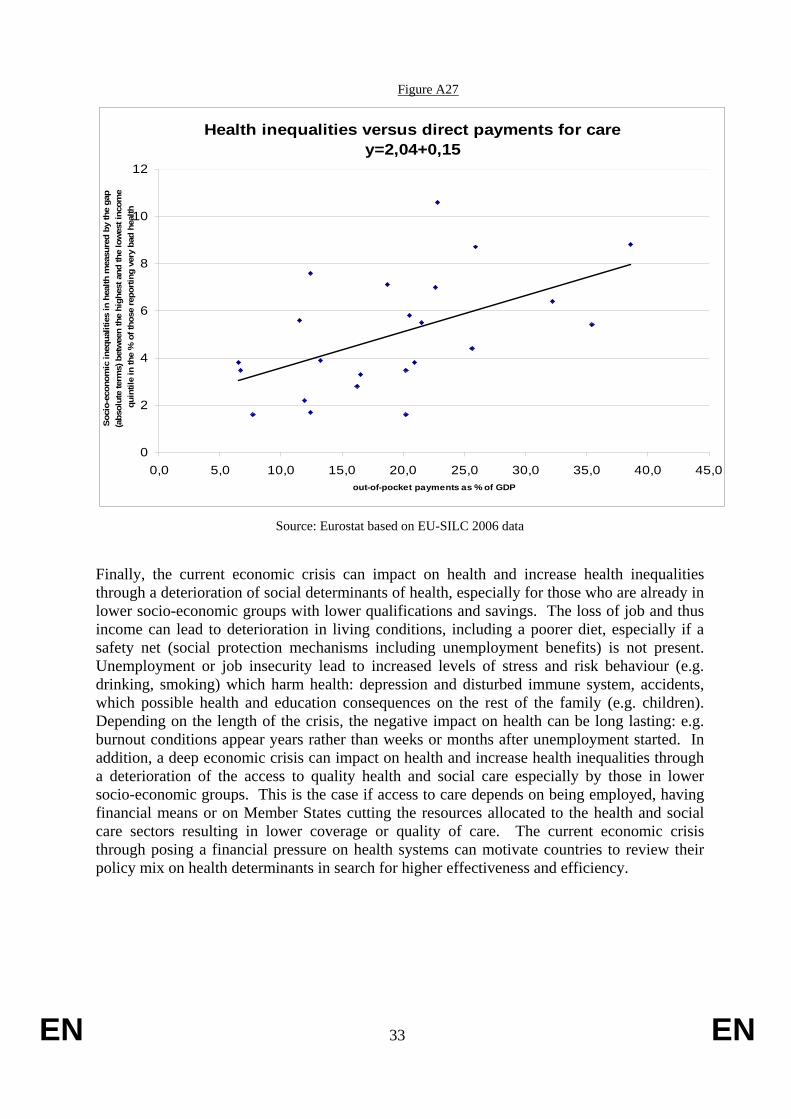
Figure A27
Health inequalities versus direct payments for carey=2,04+0,15
0
2
4
6
8
10
12
0,0 5,0 10,0 15,0 20,0 25,0 30,0 35,0 40,0 45,0out-of-pocket payments as % of GDP
Soci
o-ec
onom
ic in
equa
litie
s in
hea
lth m
easu
red
by th
e ga
p (a
bsol
ute
term
s) b
etw
een
the
high
est a
nd th
e lo
wes
t inc
ome
quin
tile
in th
e %
of t
hose
repo
rting
ver
y ba
d he
alth
Source: Eurostat based on EU-SILC 2006 data
Finally, the current economic crisis can impact on health and increase health inequalities through a deterioration of social determinants of health, especially for those who are already in lower socio-economic groups with lower qualifications and savings. The loss of job and thus income can lead to deterioration in living conditions, including a poorer diet, especially if a safety net (social protection mechanisms including unemployment benefits) is not present. Unemployment or job insecurity lead to increased levels of stress and risk behaviour (e.g. drinking, smoking) which harm health: depression and disturbed immune system, accidents, which possible health and education consequences on the rest of the family (e.g. children). Depending on the length of the crisis, the negative impact on health can be long lasting: e.g. burnout conditions appear years rather than weeks or months after unemployment started. In addition, a deep economic crisis can impact on health and increase health inequalities through a deterioration of the access to quality health and social care especially by those in lower socio-economic groups. This is the case if access to care depends on being employed, having financial means or on Member States cutting the resources allocated to the health and social care sectors resulting in lower coverage or quality of care. The current economic crisis through posing a financial pressure on health systems can motivate countries to review their policy mix on health determinants in search for higher effectiveness and efficiency.

EN 34 EN
The information provided above supports the Council Conclusions of November 200625 that "health determinants are unequally distributed among population groups resulting in health inequalities" and "that policies can have positive or negative impacts on health determinants reflected in the observed health outcomes and the health status of the population". It shows that health inequalities are associated with socio-economic inequalities (e.g. uneven distribution of resources and opportunities which translate into income, education, occupation and environmental differences between and within countries). The above description provides a general outline of the causes of inequalities in health between countries and between social groups. More detailed and specific information is nevertheless still required to be able to establish the effect (causality) and weights of several of those health determinants so that Member States can choose and implement effective action in relation to a particular population group or in relation to a particular determinant.
3. WHAT MEMBER STATES ARE DOING ON HEALTH INEQUALITIES While about half of the EU Member States have activities which address inequalities in health only a small number have developed comprehensive inter-sectoral strategies and even fewer have fully assessed their impact. Hence, information based on comprehensive assessment and evaluation of the effectiveness of actions and strategies is limited. General examples of reductions in gaps in health between regions of Member States include those achieved by FI in the North Karelia project and by DE with a reduction in the mortality rates between new and old Länder since reunification. The UK has recently reported some encouraging signs of narrowing of health gaps between areas and social groups following a period were these inequalities widened.
Despite the limited knowledge, it is possible to establish a list of policy actions which have been judged by Member States as effective to tackle health inequalities. There are a number o f sources of information on effective policy initiatives including the report produced for the 2005 UK Presidency on the topic and entitled "Health Inequalities: a Challenge for Europe"26, the Eurohealthnet coordinated project "Closing the Gap: Strategies for Action to tackle health inequalities", the ongoing Eurohealthnet coordinated project "Determine" and its related web site (www.health-inequalities.eu), which gathers Member States information on strategies to tackle health inequalities. The largest amount of evidence comes from the UK where comprehensive strategies to tackle health inequalities have been developed over more than a decade and where several evaluations have taken place 27.
Reviewing available evidence indicates that many Member States reach a number of general conclusions. Firstly, that in addition to maintaining universal access to a number of key services such as education, social protection and healthcare, access also needs to be intensified and targeted at specific groups (e.g. to mothers and children, young parents, and those over 50) in disadvantaged areas, in vulnerable families and in lower socio-economic groups. For example, health policy actions do not need to be new but redesigned i.e. we need to change the
25 Council Conclusions on Health in All Policies (HIAP).
http://ec.europa.eu/health/ph_projects/2005/action1/docs/2005_1_18_frep_a8_en.pdf 26 See http://ec.europa.eu/health/ph_determinants/socio_economics/documents/ev_060302_rd05_en.pdf 27 See for example "Tackling Health Inequalities: 10 years on", Department of Health, London 2009.
http://www.dh.gov.uk/en/Publicationsandstatistics/Publications/PublicationsPolicyAndGuidance/DH_098936

EN 35 EN
way we deliver health promotion, disease prevention and treatment services. This is particularly the case for health promotion and disease prevention programmes.
Secondly, Member States argue that regional and local action, supported by national and EU actions, is very important to achieve results and local authorities must actively search for the individuals at risk of lower health status in their communities. One effective way to reach those individual is to build neighbourhood and community infrastructures (e.g. communities for health programme in the UK). Building partnerships with the voluntary / third sector and with business can also be effective in raising general awareness and action (e.g. in the UK a social enterprise partner foundation delivers a programme in some disadvantaged areas and in DE the health insurance BKK and the Ministry of Work Health and Social Affairs concluded a partnership to improve the health of the unemployed - JobFit).
Thirdly it is widely accepted that measurement and regular reporting of health inequalities indicators is an essential first step towards effective action. Building information through the development of regular monitoring of health indicators (e.g. the UK has even developed a quite complex composite indicator, the health poverty index), allows for awareness-raising activities (e.g. conferences, seminars, pre and post graduate lectures in CZ, DE, IE, PL) and allows policy makers to identify the extent of the gap and where it lays (types of diseases and causes of mortality). They can then devise strategy to achieve faster decreases in these diseases and mortality in the deprived areas / lower socio-economic groups vis-à-vis the more affluent groups. A good example of the impact of available information and reporting is that of NL where a detailed data analysis of the socio-economic gradient in health identified a 6 year gap for women and a 7 year gap for men. The publication of the report has motivated the development of a policy strategy for tackling health inequalities. Similar conclusions come from EE, ES and BE following the publication of their first report on socio-economic inequalities in health. Data collection, analysis and monitoring must then be accompanied by building scientific knowledge for action (notably through partnerships between national administration and universities), which is gathered and disseminated through a coordination centre (e.g. the policy coordination centre for health equity in BE, the national support team for health inequalities in the UK, the National Institute of Public Health in DK, the National Institute for Health Development in EE, the National Institute for Health Education and Prevention in FR, the internet platform www.gesundheitliche-chancengleichheit in DE, the Institute of Public Health in IE comprising the Population Health Observatory and the All-Ireland Health Library, the Working Group on Health inequalities in the Trentino Region in IT, Inter-sectoral Coordination Commission of Public Health in LV, Health Inequalities Monitor in NL, the National Institute of Public Health in SE, ). This entity can advise local authorities on what are effective actions. Learning quickly from innovation elsewhere is also deemed crucial and several Member States suggest that initiatives linking cities and regions have been very effective in disseminating information (e.g. the city wide initiative in the UK, the Local Government Denmark, the Healthy Cities Network in DK, the National Health Board in DK, the city links initiative in NL). Taking stock of increasing body of evidence on the causes of health inequalities and how they can be influenced is therefore seen as a fundamental and effective step for devising policy action
Fourthly, several Member States (UK, BE, IE) that health impact assessment/health equity test/ health equity audit applied to policies across the board is an effective way to generate inter-sectoral awareness of health inequalities and the social determinants of health and health inequalities.

EN 36 EN
More specific examples of policies considered effective by Member States or research review studies are as follows:
• Improve access to information on the risk of smoking and access to smoking cessation services for those in deprived areas and in lower socio-economic groups which consistently show higher rates of smoking than more affluent groups (UK, NL). To decrease infant mortality and increase life expectancy in these groups it is effective to a) ensure smoking-cessation during pregnancy (which has been shown to be the most significant of very few know modifiable risk factors in the prevention of low birth weight and as a consequence individuals' health throughout their lives – Kramer 2000), b) stop parental smoking (which research has shown is strongly associated with Sudden Infant Death Sindrome) and c) reduce smoking in general for those groups. Smoking was considered by the UK DoH as the single biggest preventable cause of socio-economic gradient in infant mortality and life expectancy through lower birthweight and higher mortality from Cardiovascular disease, stroke and respiratory disease. Studies have showed that NHS stop smoking services were very effective in reducing the number of smokers living in more disadvantaged areas when the access to those services was improved.
• Banning smoking in work places and in public places is effective in reducing smoking rates and passive smoking for all.
• Evidence from the UK, BE, FI, SE and NL also indicate that the use of taxes can make unhealthy items more expensive and reduces consumption while and subsidies for healthy food can increase consumption of these, and can contribute to reducing health inequalities because increasinge the price of tobacco and alcohol for example reduces consumption by lower income groups as these are more price sensitive.
• Improving access to food supplementation (vitamin and folate) for pregnant women in lower socio-economic groups
• Improve antenatal care (screening and immunisation) and post natal care including neonatal screening and parent support (information on nutrition, parental smoking, sleeping positions etc) for those in less affluent areas and in lower socio-economic groups (UK, PL) or migrants (NL) to reduce the gap in neo-natal and infant mortality. This has been done through working with family doctors and hospitals and the Sure Start child centres in the UK (multidisciplinary professionals providing services for families and children of up to 5 years in deprived areas), home visits from early pregnancy till 2 years for vulnerable mothers (young, single, deprived areas) in the UK; through the ONE centres in BE, for example.
• Increase breastfeeding initiation and duration rates in deprived areas and lower socio-economic groups which are currently lower than those of more affluent areas /groups notably through food vouchers for pregnant women in disadvantaged areas/ groups. Breastfeeding reduces the likelihood of gastro and respiratory infections and obesity and mother's likelihood of developing breast and ovarian cancer, all with the exception of breast cancer higher in lower socio-economic groups. See instruments of previous point.
• Improve child immunisation take-up and better follow-up of children's health in deprived areas and lower socio-economic group. An example is the school U-programme (U1-U9) in DE in addition to the instruments of previous point.
• Increase the up-taking of screening and reducing the delays to see a GP and a GP referral in deprived areas
• Managing high blood pressure and reducing cholesterol levels through medical advise and medicines and advise on diet exercise and smoking for those in deprived areas

EN 37 EN
• Increase flu vaccination of those 65+ • Reduce teenage pregnancy and STDs through comprehensive contraceptive advice. • Ensure timely access to effective emergency services in more deprived areas. • Address cultural barriers to care by a) adjusting medical curricula to look the topic of
health inequalities (CZ, NL, PL) by b) using intercultural mediators in the primary and secondary care sector (BE, BG, RO, IT, FI, NL) and by using c) community health trainers (UK); d) medical services including emergency services working with faith/ religious representatives (UK). For example, in the UK the ambulance service is holding a summit with various faith and religious services to foster better understanding and better relationships and reduce discrimination
• Address care supply gaps in some geographic areas by reinforcing primary care services which should work together with community social services and other stakeholders (BE, NL, UK, HU). Investment in ICT in the field of healthcare has been effective to address healthcare gaps in the specific case of outermost regions such as the Canaries in ES, bringing professionals and users closer together.
• Making promotion and prevention interventions part of the basis packages of health insurance (e.g. exercising by prescription, smoking cessation services) in NL. Cervix Mass screening Programme in HU which was accompanied by social marketing to ensure a boost of screening in lower socio-economic groups.
• Fluoridation of water which reduces the socio-economic differences in tooth decay in children as shown by comparing different counties in the UK; Providing meals, fruit and milk at schools (DK, UK, HU), which can reduce socio-economic differences in nutrition (i.e. improve child nutrition in deprived areas and lower socio-economic groups notably in terms of healthy foods).
• Provide affordable pre-school day care for lower socio-economic groups as this increases education and employment attainment, income level and thus health
• Ensure good physical education programmes in schools (UK, NL). • Decrease school drop-outs (IE, NO, FI, UK, NL) notably through the Sure Start scheme
in the UK • Improving work organisation (FI, SE, DE). For example, improving work organisation in a
bus company in DE lead to a significant reduction of sick leave and employee turnover of bus drivers (e.g. Greiner & Syme 1994).
• Improve the physical environment through clean air legislation, green spaces and encouraging more walking more cycling (UK, NL). Improving housing quality (UK, EE) to tackle cold and dampness through improved house building standards and through affordable heating for lower socio-economic groups and measures to reduce accidents at home (smoke alarms, hand rails). A review of UK "area regeneration initiatives" showed that these lead to better education and employment rates, higher household income and housing quality and contributed to improving health.
• Child resistant containers • Improving transport links • Seat belt and speed legislation (UK, BE), • Income support (NL, SE) • Using targets (UK, NL, CZ, FI, Basque Country in ES) has been effective in raising
awareness and motivating policy action. • Partnerships with voluntary sector and community groups including faith / religious
leaders
EN 38 EN
• Partnerships with companies and having public sector giving example for health at work strategies (UK, BE, IE, DE). In DE the health insurance BKK and the Ministry of Work Health and Social Affairs concluded a partnership to improve the health of the unemployed (JobFit). A public health advocacy tool to help develop meaningful partnerships (IE) and training individuals who can raise awareness and advocate from within and beyond their sector (IE).
• An award system to recognise local authorities, local strategies, partnerships or actions to reduce health inequalities has been effective to motivate policy development.
From the above list, several areas can be identified where EU and national action are complementary. The EU can support and complement Member States in the areas of awareness raising and advocacy, data development and monitoring. It supports research (Research and specific action programmes) and the dissemination of information and best-practice exchange (e.g. OMC mechanisms). It provides financial support (e.g. Structural Funds) which can be used for example to develop targeted health promotion and disease prevention interventions and to improve the geographic distribution of primary care. More generally, the EU is striving for better environment (cleaner air), health and safety at work and equal opportunities. The need for a collaborative approach is important as it can help optimizing resources and contribute to tackling common challenges within the EU.
4. EXISTING EU ACTION AND LINKS TO OTHER RELEVANT EU POLICIES
EU strategies: growth, employment, social and health strategies The Lisbon Strategy on growth and jobs can be expected to deliver some positive outcomes on health as growth and more and better jobs improve overall living standards and thus health. Healthy life years has been agreed as one of the structural indicators.
The current European Employment Strategy (EES) entails a number of policy areas that directly or indirectly addresses health inequalities. One of the key objectives in the overarching Employment Guideline 17 is to improve quality and productivity at work and to modernise social protection systems. Health and safety at work is one of the main dimensions of quality at work. It also represents a crucial element in attracting more people into the labour market, in particular in the light of ageing. Moreover, reducing accidents at work, occupational diseases and work-related illnesses for all workers and in particular for workers suffering from the worse working conditions is an important tool to address health inequalities. Employment Guideline 18 on promoting a lifecycle approach calls for support for active ageing including appropriate working conditions and improved occupational health status. It also calls for promoting modern social protection systems including healthcare. The employment guidelines put emphasis on improving the occupational health status with the aim of reducing sickness burdens, increasing labour productivity and prolonging working life. Employment Guideline 21 calls for the promotion and dissemination of innovative and adaptable forms of work organisation to improve quality and productivity at work including health and safety. The employment guidelines also calls for the implementation of integrated flexicurity approaches with the aim of helping workers including low skilled and those at the margins of the labour market to cope with a working life that is becoming more complex, diverse and irregular and therefore demanding. Finally Employment Guideline 23 emphasises the need to focus on new skills for new jobs in order to promote access for all and ensure innovation and quality at work.
EN 39 EN
The EU can support Member States actions to address common challenges through the OMC (employment OMC, social OMC) by facilitating dialogue and the exchange of best-practice and policy coordination with/between Member States and with stakeholder organizations, by supporting the development of innovative good practice through its funding programmes (e.g. PROGRESS). Addressing health inequalities is a common objective under the social OMC. Work under the employment and social OMC, supported by the ESF, has looked at how one can address long-term unemployment and bring those further from the labour market into work, looking at disadvantaged groups and the gender dimension. Under the social OMC and the Council Working Party on Public Health meeting at senior level, supported by the ongoing development of indicators (social OMC common indicators, ECHI) the EU has promoted the monitoring of health and coordination of health policies through information sharing and exchange of good practice. The 2008 social OMC Communication28 proposed that the implementation of the objectives in the field of healthcare be supported by targets on access to healthcare and on health status.
Under the EU Health Strategy, inclusion of equity in health as a key value of the and attention to social determinants as part of the implementation of existing EU health activities, such as those on tobacco, obesity and alcohol, young people and mental health. : As some countries have begun to introduce policies intended to reduce health inequalities, sharing of good practice on national and regional policies to address health inequalities such as for example through the EU Expert Group on Social Determinants and Health Inequalities can provide a good basis for policy improvements. Work on social determinants of health has started to map out health equity related policies, linking up with international organisations such as WHO and the OECD, the Council of Europe and research developments in this area. Commission services (REGIO, SANCO, EMPL) are working together to map out the use of cohesion funds in the field of health.
Common Basic Principles for immigrant integration policy in the EU have been agreed to by the Commission (COM(2005) 389) of which access to services, such as healthcare, is seen as a fundamental elements. The Handbooks on Integration for practitioners and policymakers provide best-practice examples from a number of projects in this area.
EU Funds: The EU's Cohesion Policy is financially supporting Member States to address regional imbalances. Recently, health has been defined as one of the areas of support by the European Regional Development Fund (ERDF) and European Social Fund (ESF) Structural Funds according to the Community Strategic Guidelines for Cohesion 2007-2013.29 Health promotion, disease prevention, transfer of knowledge, training and availability of highly skilled staff and infrastructure in cohesion regions are some of the topical areas qualifying for support. The Guidelines note that there are "major differences in health status and healthcare between EU regions"... thus "it is important for cohesion… to contribute to healthcare
28 "A Renewed commitment to social Europe: Reinforcing the Open Method of Coordination for Social Protection and Social Inclusion". COM(2008) 418/4 at http://ec.europa.eu/social/main.jsp?catId=550&langId=en 29 http://ec.europa.eu/regional_policy/sources/docoffic/2007/osc/l_29120061021en00110032.pdf
EN 40 EN
facilities… Community based health improvement and preventive actions have an important role to play in reducing inequalities".”.30
While the Common Agricultural Policy (CAP) is not a social policy in itself it has elements that may contribute to the reduction of health inequalities such as ensuring a fair standard of living for farmers, assuring the availability of supplies and reasonable prices of consumers. The CAP supports the School Milk Scheme and the distribution of agricultural products to most deprived people. More recently, there was work and discussion on how the CAP could contribute to a more healthy diet by putting more emphasis on fruit and vegetables. To contribute more effectively to the children's healthy diet, a School Fruit Scheme was agreed by the Council in 2008, and which is operational as of the school year 2009-2010.
In addition, the EU rural development policy supports investments and development of social and health care services, technologies and infrastructure in rural areas as well as training and information actions on health and social subjects.
The EU Public Health Programme has been funding action networks, local initiatives, expert reviews, conferences, and policy innovations in the field of public health. PROGRESS funds activities in the area of anti-discrimination (e.g. anti-discrimination training activities)
The European Fund for the Integration of Third Country Nationals supports Member States efforts to facilitate the integration of migrants into European societies. 7% of the total budget of €825M is for Community Actions supporting projects addressing different aspects of integration, including access to healthcare. The remaining 93% is for the Member States to implement an Annual Programme agreed with the Commission.
The EU Framework Programmes for Research also offer possibilities to tackle health inequalities in particular under the 3rd pillar of the Health Theme of the specific Programme "Co-operation" of the 7th EU Framework Programme. This new activity aims at developing new research methods and generating the necessary scientific basis to underpin informed policy decisions and more effective and efficient evidence-based strategies in such areas as health promotion and the wider determinants of health including lifestyle and socio-economic and environmental factors31.
Legislation: The EU has established Community labour law and Community legislation in the field of health and safety at work and monitors its implementation, including some funding of research in the area of occupational safety and health in order to improve working conditions. The implementation in the Member States of the Community Legislation on Health and Safety at Work, as well as all the actions foreseen in the Community Strategy on Health and Safety at Work 2007-2012 is seen to constitute an important contribution to the reduction of health inequalities in the European Union. The active working population is currently 48,3% percent of the total population of the EU. Therefore the improvement of the prevention and the
30 See Annex: Table showing the allocated share of Structural Funds investment in health infrastructure per
MS. 31 COUNCIL DECISION (2006/971/EC) of 19 December 2006 concerning the Specific Programme
"Cooperation" implementing the Seventh Framework Programme of the European Community for research, technological development and demonstration activities (2007 to 2013), OJ L400/127)
EN 41 EN
protection of the worker's health and safety represents a very significant contribution to the overall public health in Europe, and to the reduction of some of the main elements having an impact on health inequalities among countries and citizens of the EU. Directive 91/383/EC aims to ensure that fixed-term workers and temporary agency workers are afforded, as regards safety and health at work, the same level of protection as that of other workers in the user undertaking and/or establishment. A report will be drafted in 2009 on the implementation of Directive 91/383/EC. The report which will cover the period up to 2007 will try to find potential deficiencies in the Directive in order to give guidance for the future action of the Commission in this field. The Impact Assessment to the Community Strategy on health and safety at work 2007-2012 showed that occupational health strategy reduces work accidents, helps accident victims or chronically ill to retain their job or return to work, is a main platforms for integrating migrant workers and can reduce stressful and monotonous working conditions that cause early deterioration of health, and hence, an early exit from working life.
Since 2000, in addition to laws covering the equal treatment of men and women, EU anti-discrimination legislation has been in place to ensure minimum levels of equal treatment and protection for everyone living and working in Europe. These laws are designed to ensure equal treatment irrespective of racial or ethnic origin, religion and belief, disability, sexual orientation, and age in many aspects of daily life - from the workplace, to issues covering education, healthcare and access to goods and services. In 2008 the Commission set up a governmental expert group in the field of non-discrimination and the promotion of equality which examines the impact of national and EU-level non-discrimination measures, validates good practice through peer learning and evaluates the effectiveness of non-discrimination policies.
Internal Market Work on "health-related" infringement procedures for example on the freedom of establishment and provision of services, restrictions to ownership of pharmacies and their location, restrictions to ownership of laboratories and their opening hours, which may lead to sales monopolies and constitute barriers to access, may contribute to lower prices of care and thus particularly benefit citizens from lower social-economic groups.
More broadly, at the EU level all Commission initiatives now undergo an assessment of its likely economic, social and environmental impacts, including in particular the impacts on different social and economic groups and on existing inequalities.
Education and Youth Physical and mental health and healthy lifestyle are promoted as part of Social and civic competences in the Recommendation on key competences32, which invites Member States to develop the provision of key competences for all as part of their lifelong learning strategies. The Commission has also proposed a new EU Strategy for Youth33, which underlines the vulnerability of youth and identifies actions to improve their health, particularly for those at risk of social exclusion.
32 Recommendation of the European Parliament and of the Council of 18 December 2006 on key
competences for lifelong learning (2006/962/EC). 33 COM (2009)200 – 27/04/09 - An EU Strategy for Youth -Investing and Empowering –

EN 42 EN
5. BIBLIOGRAPHY
Avendaño, M., Kunst, A. E., van Lenthe, F. ., Bos, V., Costa, G., Valkonen, T., Cardano, M., Harding, S., Borgan, J-K, Glickman, M., Reid, A., and Mackenbach, J. P., 2005. Trends in socioeconomic disparities in stroke mortality in six European countries between 1981-1985 and 1991-1995. Am J Epidemiol 161 (1):52-61.
Braveman P, Gruskin S., 2003. Defining equity in health. J Epidemiol Community Health. 2003;57:254–258.
Breeze, E., A. E. Fletcher, et al., 2001. Do socioeconomic disadvantages persist into old age? Self-reported morbidity in a 29-year follow-up of the Whitehall Study. Am J Public Health 91 (2):277-83
Jagger, C., Gillies, C., Moscone, F., Cambois, E., Van Oyen, H., Nusselder, W. Robine, J., 2008. Inequalities in healthy life years in the 25 countries of the European Union in 2005: a cross-national meta-regression analysis. The Lancet, Volume 372, Issue 9656, Pages 2124 - 2131
Cavelaars, A. E., Kunst, A. E. et al., 1998. Morbidity differences by occupational class among men in seven European countries: an application of the Erikson-Goldthorpe social class scheme. Int J Epidemiol 27 (2):222-30.
Cavelaars, A.E., Kunst, A.E., Geurts, J.J.M. et al., 2000. Persistent variations in average height between countries and between socio-economic groups: an overview of 10 European countries. Ann Hum Biol, 27(4): 407-421
Dalstra, J.A., Kunst, A.E., Borrell, C., Breeze, E., Cambois, E., Costa G, Geurts, J.J., Lahelma, E., Van Oyen, H., Rasmussen, N.K., Regidor, E., Spadea, T., Mackenbach, J.P., (2005) Socio-economic differences in the prevalence of common chronic diseases: an overview of eight European countries. International journal of epidemiology 34 (2): 316-326
Eurohealthnet, 2007 Closing the Gap – Strategies for Action to tackle Health Inequalities. Taking Action on Health Equity
Huisman, M., A. E. Kunst, et al., 2003. Socioeconomic inequalities in morbidity among the elderly; a European overview. Soc Sci Med 57 (5):861-73.
Huisman, M., A. E. Kunst, et al., 2004. Socioeconomic inequalities in mortality among elderly people in 11 European populations. J Epidemiol Community Health 58 (6):468-75.
Kunst AE, Bos V, Lahelma E et al. Trends in socio-economic inequalities in self-assessed health in 10 European countries. Int.J. Epidemiol 2005; 34 295-305.
Kutzin, J. (2008). Health financing policy: a guide for decision-makers. Geneva, World Health Organization.
Lundberg, O., 1991. Causal explanations for class inequalities in health – an empirical analysis. Social Science & Medicine 32.
Mackenbach, J. P., Meerding, W. J., Kunst, A. E., 2006 Economic implications of socio-economic inequalities in health in the European Union, Erasmus MC, Department of Public Health, Netherlands for the European Commission
EN 43 EN
Mackenbach, J. P., 2006 Health Inequalities: Europe in Profile, 2006, An independent, expert report commissioned by the UK Presidency of the EU
Mackenbach, J. P., V. Bos, et al., 2003. Widening socioeconomic inequalities in mortality in six Western European countries. Int J Epidemiol 32 (5):830-37.
Mackenbach, J. P., A. E. Cavelaars, et al., 2000. Socioeconomic inequalities in cardiovascular disease mortality; an international study. Eur Heart J 21 (14):1141-51.
Newey, C., E. Nolte, et al. 2003. Avoidable mortality in the enlarged European Union. Paris, Institut des Sciences de la Santé.
SHARE - Survey of Health, Ageing and Retirement in Europe Börsch-Supan, A., A. Brugiavini, H. Jürges, J. Mackenbach, J. Siegrist, and G. Weber (eds.), 2005. Health, Ageing and Retirement in Europe – First Results from the Survey of Health, Ageing and Retirement in Europe. Mannheim: Mannheim Research Institute for the Economics of Aging (MEA).
Stronegger, W.J., Freidl W., et al., 1997. Health behavious and risk behaviour: socioeconomic differences in an Austrian county. Social Science & Medicine 44 (3):423-426.
Trannoy, A., S Tubeuf, et al. 2008. Inequality of Opportunities in Health in France: A first pass. York, Health, Econometrics and Data Group Working Paper 08/24.
van Doorslaer, E., A. Wagstaff, et al., 1997. Income-related inequalities in health: some international comparisons. J Health Econ 16 (1):93-112.
van Oort, F. V., F. J. van Lenthe, et al., 2005. Material, psychosocial, and behavioural factors in the explanation of educational inequalities in mortality in The Netherlands. J Epidemiol Community Health 59 (3):214-20.
van Lenthe, F. J., C. TM Schrijvers, et al. 2004. Investigating explanations of socio-economic inequalities in health. The Dutch GLOBE study. European Journal of Public Health 14:63-70.
Whitehead M, 1990 The concepts and principles of equity and health. Copenhagen. WHO Regional Office Europe, 1990
WHO Commission on social determinants of health, 2008, Closing the gap in a generation.
Annex HIs ImpactAssessment-postCIS19Spet
EN 44 EN
6. LIST OF ABBREVIATIONS
AGRI Agriculture and Rural development
AIDCO EuropeAid - Cooperation Office
CAP Common Agriculture Policy
Council WPPH Council Working Party on Public Health at Senior Lev
DEV Development
DG Directorate General
EAC Education and Culture
EAFRD European Agricultural Fund for Rural Development
EAGF European Agricultural Guarantee Fund
ECFIN Economic and Financial Affairs
ECHI European Community Health Indicators
EHIS European Health Interview System
EMPL Employment Social Affairs and Equal Opportunities
EPSCO Employment, Social Policy, Health and ConsumAffairs Council
ERDF European Regional Development Fund
ESF European Social Fund
EUROFUND European Foundation for the Improvement of Liviand Working Conditions
EUROSTAT European Statistical Office
EU-SILC European Union survey on income and living conditio
Expert Group SDH EU Expert Group on Social Determinants of Health
FP7 Research Framework Programme 7
GDP Gross domestic product
HI Health Inequalities
IA ISSG impact assessment inter-service steering group

EN 45 EN
IAB Impact Assessment Board
INFSO Information Society and Media
JLS Justice, Freedom and Security
Joint Report SPSI Joint Reports on Social Protection and Social Inclusion
MARKT Internal Market and Services
MS Member States
NGO Non-governmental organisation
NSR National Strategy Report
PROGRESS EU's employment and social solidarity programme
REGIO Regional Policy
RTD Research
SANCO Health and Consumers
SG Secretariat General
SHARE Survey of Health Ageing and Retirement in Europe
social OMC Open Method of Coordination for Social Protection aSocial Inclusion
SPC Social Protection Committee
WHO CSDH WHO Commission on the Social Determinants Health