Commercial Use of Listed Buildings in Towns and Cities
52
Commercial Use of Listed Buildings in Towns and Cities OCTOBER 2018 PREPARED FOR THE HISTORIC ENGLAND
Transcript of Commercial Use of Listed Buildings in Towns and Cities

Commercial Use of Listed
Buildings in Towns and Cities
OCTOBER 2018
PREPARED FOR THE HISTORIC
ENGLAND

COLLIERS INTERNATIONAL 2 of 52
COLLIERS INTERNATIONAL PROPERTY CONSULTANTS LIMITED
Company registered in England and Wales no. 7996509
Registered office:
9 Marylebone Lane
London W1U 1HL
Tel: +44 20 7935 4499
www.colliers.com/uk
Version Control
Status FINAL
Filename/Document ID Commercial Uses of Listed Buildings in England FINAL.docx
Last Saved 16 November 2018
Owner David Geddes

COLLIERS INTERNATIONAL 3 of 52
TABLE OF CONTENTS 1 Summary 4
2 By Heritage Density 8
3 By Type of Place 13
4 Brands 17
5 Total Uses in England 18
6 Change Since 2012 21
APPENDICES
1 Methodology 28
1 Detailed Data for Uses in 55 Places 35
2 Summarised Data for 55 Places 43
3 Grossing Up 47

COLLIERS INTERNATIONAL 4 of 52
1 SUMMARY This report analyses the number and nature of commercial operations in listed
buildings in 500m radius areas in 55 locations in towns and cities in England and
compares with use of non-listed buildings. It also estimates the total number of
commercial operations in listed buildings in England.
It is a repeat of an analysis done, using similar methodology, for the Heritage
Lottery Fund and Historic England1 in 2012.
It is a companion to a study assessing creative industries in conservation areas.
That work is issued separately to avoid confusion because it uses different data
and a different definition of creative industries2. The research methodology is
described in Appendix 1.
The analysis finds there are approximately 142,000 town centre-type commercial
operations in listed buildings in the England. Figure 1 summarises them.
Figure 1: Estimate of commercial operations in listed buildings in England3
Comparison Retail - Independent 19,082 13%
Retail Services - Independent 16,246 11%
Fashion - Independent 11,688 8%
Convenience Retail - Independent 4,136 3%
Total Independent Retail: 51,151 36%
Comparison Retail - Branded 3,585 3%
Retail Services - Branded 8,402 6%
Fashion - Branded 4,925 3%
Convenience Retail - Branded 1,637 1%
Total Branded Retail: 18,550 13%
Charity Retail 1,616 1%
TOTAL RETAIL: 71,317 50%
Eat and Drink - Independent 21,626 15%
Eat and Drink - Branded 4,754 3%
TOTAL EAT AND DRINK: 26,380 19%
Creative Industries 7,559 5%
Non-Professional Services 9,418 7%
Professional Services 19,772 14%
TOTAL COMMERCIAL: 36,749 26%
Accommodation 3,575 3%
Entertainment 3,823 3%
Place of Worship 376 0%
TOTAL USES: 142,221 100%
1 Called English Heritage at the time. 2 Explained in Appendix 1. 3 Percentages are different to Figure 2 because of the effect of grossing up. Figure 2
is percentages in the 55 places. Figure 1 is percentages when grossed up to all UK.
COLLIERS INTERNATIONAL 5 of 52
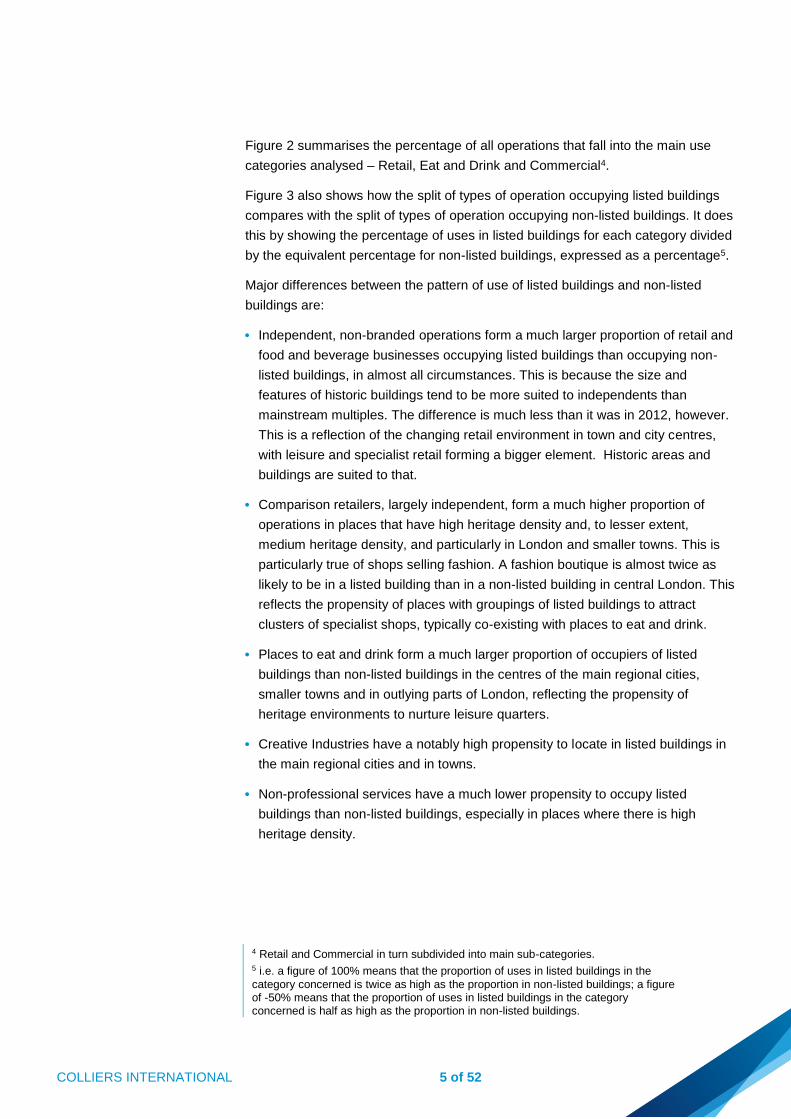
Figure 2 summarises the percentage of all operations that fall into the main use
categories analysed – Retail, Eat and Drink and Commercial4.
Figure 3 also shows how the split of types of operation occupying listed buildings
compares with the split of types of operation occupying non-listed buildings. It does
this by showing the percentage of uses in listed buildings for each category divided
by the equivalent percentage for non-listed buildings, expressed as a percentage5.
Major differences between the pattern of use of listed buildings and non-listed
buildings are:
• Independent, non-branded operations form a much larger proportion of retail and
food and beverage businesses occupying listed buildings than occupying non-
listed buildings, in almost all circumstances. This is because the size and
features of historic buildings tend to be more suited to independents than
mainstream multiples. The difference is much less than it was in 2012, however.
This is a reflection of the changing retail environment in town and city centres,
with leisure and specialist retail forming a bigger element. Historic areas and
buildings are suited to that.
• Comparison retailers, largely independent, form a much higher proportion of
operations in places that have high heritage density and, to lesser extent,
medium heritage density, and particularly in London and smaller towns. This is
particularly true of shops selling fashion. A fashion boutique is almost twice as
likely to be in a listed building than in a non-listed building in central London. This
reflects the propensity of places with groupings of listed buildings to attract
clusters of specialist shops, typically co-existing with places to eat and drink.
• Places to eat and drink form a much larger proportion of occupiers of listed
buildings than non-listed buildings in the centres of the main regional cities,
smaller towns and in outlying parts of London, reflecting the propensity of
heritage environments to nurture leisure quarters.
• Creative Industries have a notably high propensity to locate in listed buildings in
the main regional cities and in towns.
• Non-professional services have a much lower propensity to occupy listed
buildings than non-listed buildings, especially in places where there is high
heritage density.
4 Retail and Commercial in turn subdivided into main sub-categories. 5 i.e. a figure of 100% means that the proportion of uses in listed buildings in the
category concerned is twice as high as the proportion in non-listed buildings; a figure of -50% means that the proportion of uses in listed buildings in the category concerned is half as high as the proportion in non-listed buildings.

Figure 2: % of all businesses occupying listed and non-listed buildings in the 55 places analysed
High Heritage
Density
Medium Heritage
Density
Low Heritage
Density
London Central
Business District
London Non-Central
Business District
Core City Central
Business District
Core City Non-
Business District
Small City-
Large Town Town
RETAIL: NON-BRANDED BUSINESSES LISTED BUILDINGS LISTED BUILDINGS
Comparison (cds, electronics etc). 10% 7% 7% 8% 8% 5% 9% 8% 16% 8%
Retail Services (banks, phone shops etc.) 11% 11% 11% 8% 8% 10% 11% 13% 12% 11%
Fashion (clothing & jewellery) 9% 8% 5% 12% 8% 3% 19% 7% 10% 8%
Convenience (e.g. food stores) 3% 3% 3% 1% 5% 2% 4% 3% 3% 3%
Total Independent Retail: 32% 28% 26% 29% 29% 19% 43% 30% 41% 29%
RETAIL: BRANDED BUSINESSES
Comparison 3% 2% 1% 1% 0% 2% 1% 3% 3% 2%
Retail Services 4% 4% 5% 2% 2% 4% 2% 6% 5% 4%
Fashion 5% 4% 2% 6% 1% 3% 2% 5% 4% 4%
Convenience 1% 1% 1% 0% 1% 1% 0% 1% 1% 1%
Total Branded Retail: 13% 11% 9% 9% 4% 10% 5% 15% 13% 12%
Charity Retail 1% 1% 0% 0% 0% 0% 0% 1% 2% 1%
TOTAL RETAIL: 46% 40% 35% 38% 33% 29% 48% 47% 55% 42%
EAT AND DRINK
Non-Branded Businesses 15% 14% 15% 9% 14% 15% 9% 16% 17% 15%
Branded Businesses 5% 5% 5% 4% 6% 6% 2% 5% 3% 5%
TOTAL EAT AND DRINK: 20% 19% 20% 13% 20% 21% 11% 21% 20% 19%
COMMERCIAL
Creative Industries 5% 7% 8% 5% 15% 6% 12% 5% 4% 6%
Non-Professional Services 7% 8% 10% 11% 12% 10% 11% 6% 5% 8%
Professional Services 16% 21% 22% 27% 16% 27% 15% 16% 10% 19%
TOTAL COMMERCIAL: 28% 36% 40% 43% 43% 43% 38% 27% 19% 34%
OTHER 5% 5% 5% 5% 4% 6% 3% 5% 6% 5%
RETAIL: NON-BRANDED BUSINESSES NON-LISTED BUILDINGS NON-LISTED BUILDINGS
Comparison (cds, electronics etc). 7% 6% 6% 5% 8% 4% 9% 7% 9% 6%
Retail Services (banks, phone shops etc.) 8% 9% 10% 7% 9% 8% 10% 11% 9% 9%
Fashion (clothing & jewellery) 5% 6% 4% 5% 8% 3% 9% 4% 5% 5%
Convenience (e.g. food stores) 2% 2% 3% 1% 2% 2% 2% 3% 3% 2%
Total Independent Retail: 21% 23% 23% 18% 28% 16% 31% 25% 26% 23%
RETAIL: BRANDED BUSINESSES
Comparison 4% 4% 3% 2% 1% 4% 2% 5% 4% 3%
Retail Services 4% 4% 4% 3% 2% 5% 2% 6% 4% 4%
Fashion 8% 6% 5% 7% 1% 8% 1% 8% 4% 6%
Convenience 2% 2% 2% 1% 1% 2% 2% 2% 2% 2%
Total Branded Retail: 17% 15% 14% 13% 5% 20% 6% 21% 14% 15%
Charity Retail 1% 1% 1% 0% 0% 0% 0% 1% 2% 1%
TOTAL RETAIL: 38% 39% 38% 32% 33% 36% 36% 47% 41% 39%
EAT AND DRINK
Non-Branded Businesses 11% 10% 11% 9% 10% 11% 11% 11% 12% 11%
Branded Businesses 5% 4% 4% 6% 4% 6% 2% 4% 2% 5%
TOTAL EAT AND DRINK 16% 15% 15% 16% 14% 18% 13% 15% 13% 15%
COMMERCIAL
Creative Industries 6% 6% 7% 6% 14% 4% 10% 4% 3% 6%
Non-Professional Services 12% 12% 13% 13% 18% 11% 15% 10% 12% 12%
Professional Services 21% 23% 21% 29% 20% 28% 20% 18% 17% 22%
TOTAL COMMERCIAL: 39% 41% 42% 48% 52% 43% 46% 32% 31% 41%
OTHER 7% 5% 6% 4% 4% 6% 5% 6% 12% 6%
By Density of Listed Buildings in the Area By Type of Place
TOTAL

Figure 3: Percentage of all uses by category in listed buildings compared to same percentage for non-listed buildings
LISTED VERSUS NON-LISTED BUILDINGS LISTED BUILDINGS VERSUS NON-LISTED BUILDINGS
High Heritage
Density
Medium Heritage
Density
Low Heritage
Density
London Central
Business District
London Non-Central
Business District
Core City Central
Business District
Core City Non-
Business District
Small City-
Large Town Town
RETAIL: NON-BRANDED BUSINESSES
Comparison (cds, electronics etc). 53% 7% 5% 51% 2% 27% -4% 16% 63% 25%
Retail Services (banks, phone shops etc.) 41% 19% 11% 12% -9% 31% 0% 17% 26% 20%
Fashion (clothing & jewellery) 83% 39% 12% 161% -3% 26% 111% 52% 105% 55%
Convenience (e.g. food stores) 49% 26% 28% -12% 145% 1% 93% 12% 0% 26%
Total Independent Retail: 55% 21% 11% 60% 8% 26% 37% 22% 51% 30%
RETAIL: BRANDED BUSINESSES
Comparison -29% -39% -72% -63% -63% -53% -49% -47% -22% -40%
Retail Services 0% -6% 19% -43% -1% -27% 8% -1% 34% 1%
Fashion -31% -26% -63% -15% -13% -62% 227% -26% -10% -28%
Convenience -29% -50% -46% -65% -39% -55% -75% -43% -45% -45%
Total Branded Retail: -23% -26% -39% -33% -24% -50% -9% -26% -7% -25%
Charity Retail
TOTAL RETAIL: 21% 3% -8% 21% 3% -16% 30% 0% 30% 8%
EAT AND DRINK
Non-Branded Businesses 42% 38% 37% 0% 53% 35% -20% 51% 40% 39%
Branded Businesses -16% 8% 35% -35% 53% 0% -22% 30% 50% 6%
TOTAL EAT AND DRINK 23% 29% 37% -14% 53% 22% -20% 45% 41% 29%
COMMERCIAL
Creative Industries -10% 12% 12% -17% 11% 49% 13% 29% 35% 1%
Non-Professional Services -41% -30% -26% -13% -34% -8% -29% -40% -60% -34%
Professional Services -24% -9% 5% -9% -14% 1% -26% -11% -45% -13%
TOTAL COMMERCIAL: -27% -12% -3% -11% -14% 3% -18% -16% -43% -17%
By Density of Listed Buildings in the Area By Type of Place
TOTAL

COLLIERS INTERNATIONAL 8 of 52
com
me
rcia
l use
s o
f liste
d b
uild
ings in
engla
nd fin
al.d
ocx/2
01
8-1
1-1
6 1
1:5
5
2 BY HERITAGE DENSITY
Figure 4 shows the average number of commercial operations in listed buildings in
500m radius areas of a centre point in the 55 places analysed. The places are
grouped according to their “heritage density”6.
17% of structures that are listed in those areas are not capable of use for
commercial purposes - they are the like of gates, monuments and remnants. A
further 7% are used for non-commercial purposes like schools and government.
Figure 4: Business operations in Listed Buildings – average per place
Number of Places:
USES IN LISTED BUILDINGS
Listed structures
Listed structures that are not buildings
Listed Buildings
% of listed structures that are not buildings
Non-business listed buildings
Non-business listed bldgs as % of total listed bldgs
Retail Businesses in Listed Buildings
Retail as % of uses
Retail per all listed buildings
Brands as % of Retail businesses
Eat and Drink Businesses in Listed Buildings
Eat and Drink as % of uses
Eat and Drink per all listed buildings
Brands as a % of Eat and Drink
Commercial Uses in Listed Buildings
Commercial as % of uses
Commercial per all listed buildings
Other Uses in Listed Buildings
Total Business Uses in Listed Buildings
Total business uses per all listed buildings
USES IN NON-LISTED BUILDINGS
Retail Uses
Retail as % of uses
Brands as % of Retail
Eat and Drink
Eat and Drink as % of uses
Brands as a % of Eat and Drink
Commercial Uses
Commercial as % of Uses
Other Uses
Total Business Uses
64 48 52 53
6 13
367 364 345 359
38% 39% 38% 39%
155 136 136 140
42% 42% 44% 42%
16% 15% 15% 15%
373 379 381 378
59% 22% 19% 27%
39% 41% 42% 41%
959 928 914 930
12 27 16 55
High Heritage
Density
Medium
Heritage Density
Low Heritage
Density AVERAGE
68 36 15 37
429 217 74 221
16% 17% 20% 17%
361 181 59 191
6% 7% 12% 7%
155 83 36 85
46% 40% 35% 42%
196 94 45 102
28% 29% 25% 28%
0.5 0.5 0.8 0.5
20% 19% 20% 19%
84 44 27 48
23% 26% 26% 25%
0.2 0.2 0.5 0.2
28% 36% 40% 34%
119 84 53 82
422 233 131 245
0.3 0.5 0.9 0.4
23 12
1.2 1.3 2.2 1.3
It shows that there are less business operations per all listed buildings in places of
high heritage density than places of medium and low density. The explanation for
this is that there are more residential occupiers in places with many listed buildings
so that listed buildings are less likely, on average, to have a commercial occupier.
6 See Figure 27 for list of places.

COLLIERS INTERNATIONAL 9 of 52
com
me
rcia
l use
s o
f liste
d b
uild
ings in
engla
nd fin
al.d
ocx/2
01
8-1
1-1
6 1
1:5
5
It shows that retail forms a larger percentage of operations in places with high
density than those with medium density, which, in turn have a higher percentage
than places with low density. This is because extensive heritage townscapes
nurture a vibrant retail environment. Places to eat and drink account for about a
fifth of all business uses in every situation.
Retail uses account for about 40% of uses of both listed and non-listed buildings in
town and city centres. The proportion of uses in listed buildings increases with
heritage density.
Figure 5: % of occupiers of buildings that are retailers
The nature of the retail use is different, however. About 28% of retail occupiers of
listed buildings are branded. About 40% of retail occupiers of non-listed buildings
are branded. The proportions do not vary much by heritage density.
Figure 6: % of Retail operations that are Brands
COLLIERS INTERNATIONAL 10 of 52
com
me
rcia
l use
s o
f liste
d b
uild
ings in
engla
nd fin
al.d
ocx/2
01
8-1
1-1
6 1
1:5
5
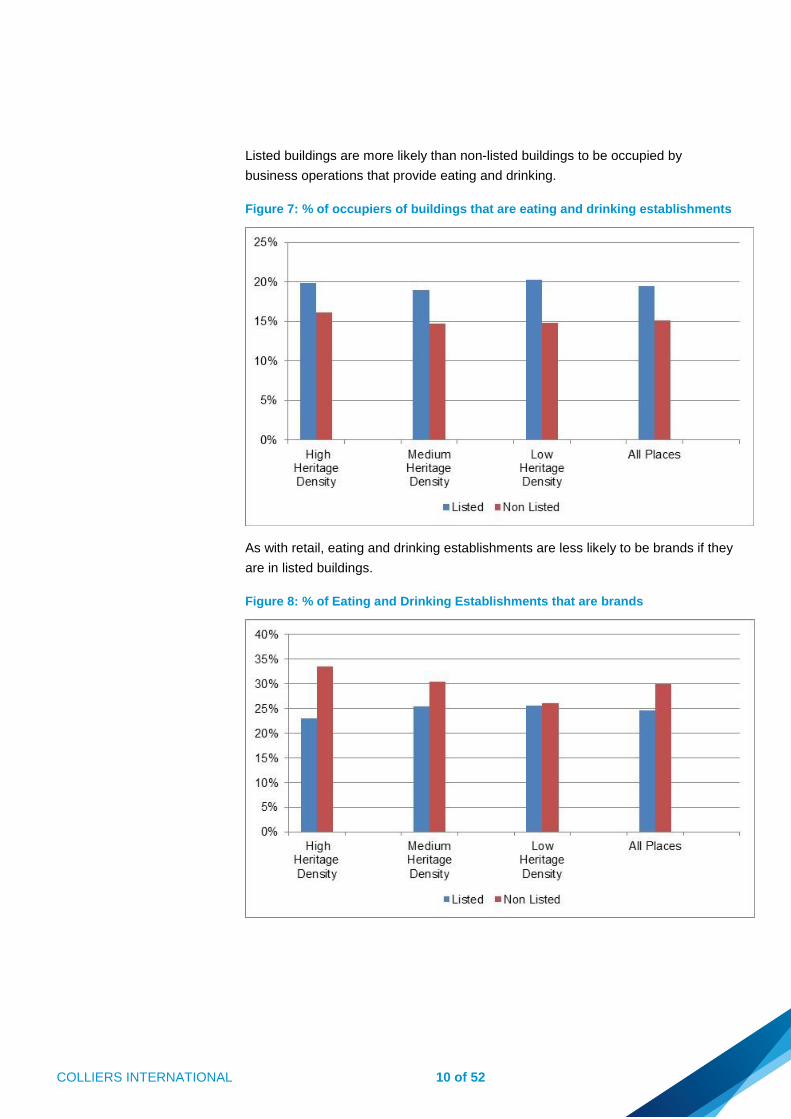
Listed buildings are more likely than non-listed buildings to be occupied by
business operations that provide eating and drinking.
Figure 7: % of occupiers of buildings that are eating and drinking establishments
As with retail, eating and drinking establishments are less likely to be brands if they
are in listed buildings.
Figure 8: % of Eating and Drinking Establishments that are brands

COLLIERS INTERNATIONAL 11 of 52
com
me
rcia
l use
s o
f liste
d b
uild
ings in
engla
nd fin
al.d
ocx/2
01
8-1
1-1
6 1
1:5
5
A lower proportion of occupiers of listed buildings are commercial7 than in non-
listed buildings across all 55 places, but the difference varies substantially by
heritage density. The lower the heritage density, the more likely it is that listed
buildings will have a commercial business operation in them.
Figure 9: % of occupiers of buildings that are Commercial Uses
Figure 10 breaks down the business operation categories into more detail and
compares listed and non-listed buildings.
7 As defined in this study.

COLLIERS INTERNATIONAL 12 of 52
com
me
rcia
l use
s o
f liste
d b
uild
ings in
engla
nd fin
al.d
ocx/2
01
8-1
1-1
6 1
1:5
5
Figure 10: Occupiers of Non-Listed and Listed Buildings
High Heritage
Density
Medium Heritage
Density
Low Heritage
Density TOTAL
Comparison Retail - Independent
Non-Listed Buldings 7% 6% 6% 6%
Listed Buildings 10% 7% 7% 8%
Retail Services - Independent
Non-Listed Buldings 8% 9% 10% 9%
Listed Buildings 11% 11% 11% 11%
Fashion - Independent
Non-Listed Buldings 5% 6% 4% 5%
Listed Buildings 9% 8% 5% 8%
Convenience Retail - Independent
Non-Listed Buldings 2% 2% 3% 2%
Listed Buildings 3% 3% 3% 3%
Total Independent Retail:
Non-Listed Buldings 21% 23% 23% 23%
Listed Buildings 32% 28% 26% 29%
Comparison Retail - Branded
Non-Listed Buldings 4% 4% 3% 3%
Listed Buildings 3% 2% 1% 2%
Retail Services - Branded
Non-Listed Buldings 4% 4% 4% 4%
Listed Buildings 4% 4% 5% 4%
Fashion - Branded
Non-Listed Buldings 8% 6% 5% 6%
Listed Buildings 5% 4% 2% 4%
Convenience Retail - Branded
Non-Listed Buldings 2% 2% 2% 2%
Listed Buildings 1% 1% 1% 1%
Total Branded Retail:
Non-Listed Buldings 17% 15% 14% 15%
Listed Buildings 13% 11% 9% 12%
Charity Retail
Non-Listed Buldings 1% 1% 1% 1%
Listed Buildings 1% 1% 0% 1%
TOTAL RETAIL:
Non-Listed Buldings 38% 39% 38% 39%
Listed Buildings 46% 40% 35% 42%
Eat and Drink - Independent
Non-Listed Buldings 11% 10% 11% 11%
Listed Buildings 15% 14% 15% 15%
Eat and Drink - Branded
Non-Listed Buldings 5% 4% 4% 5%
Listed Buildings 5% 5% 5% 5%
TOTAL EAT AND DRINK:
Non-Listed Buldings 16% 15% 15% 15%
Listed Buildings 20% 19% 20% 19%
Creative Industries
Non-Listed Buldings 6% 6% 7% 6%
Listed Buildings 5% 7% 8% 6%
Non-Professional Services
Non-Listed Buldings 12% 12% 13% 12%
Listed Buildings 7% 8% 10% 8%
Professional Services
Non-Listed Buldings 21% 23% 21% 22%
Listed Buildings 16% 21% 22% 19%
TOTAL COMMERCIAL:
Non-Listed Buldings 39% 41% 42% 41%
Listed Buildings 28% 36% 40% 34%
COLLIERS INTERNATIONAL 13 of 52
com
me
rcia
l use
s o
f liste
d b
uild
ings in
engla
nd fin
al.d
ocx/2
01
8-1
1-1
6 1
1:5
5
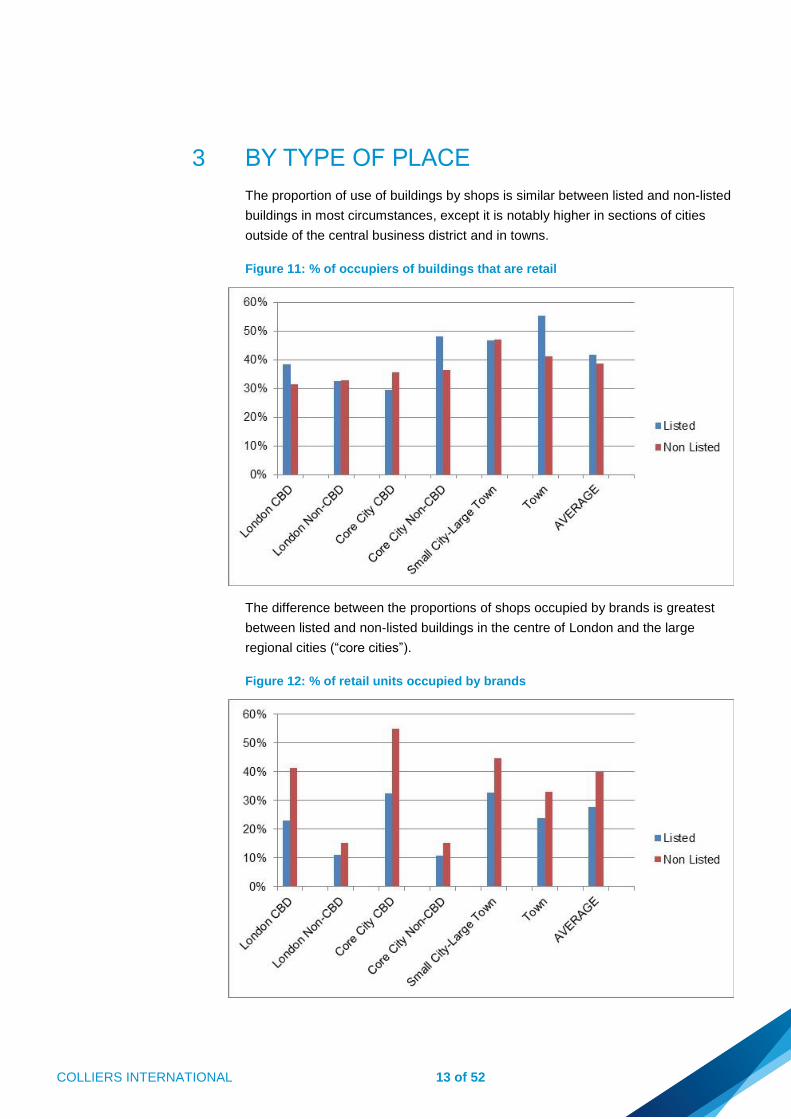
3 BY TYPE OF PLACE
The proportion of use of buildings by shops is similar between listed and non-listed
buildings in most circumstances, except it is notably higher in sections of cities
outside of the central business district and in towns.
Figure 11: % of occupiers of buildings that are retail
The difference between the proportions of shops occupied by brands is greatest
between listed and non-listed buildings in the centre of London and the large
regional cities (“core cities”).
Figure 12: % of retail units occupied by brands

COLLIERS INTERNATIONAL 14 of 52
com
me
rcia
l use
s o
f liste
d b
uild
ings in
engla
nd fin
al.d
ocx/2
01
8-1
1-1
6 1
1:5
5
The proportion of listed buildings occupied by eating and drinking establishments is
higher in the Central Business Districts and in towns; it is lower in central London
and non-CBD areas of Core Cities.
Figure 13: % of occupiers of buildings that are eating and drinking businesses
The proportion of eating and drinking businesses that are brands is higher in non-
listed buildings than in listed buildings in all situations.
Figure 14: Proportion of eating and drinking establishments that are brands

COLLIERS INTERNATIONAL 15 of 52
com
me
rcia
l use
s o
f liste
d b
uild
ings in
engla
nd fin
al.d
ocx/2
01
8-1
1-1
6 1
1:5
5
The proportion of occupiers of listed buildings that are office and studio based
commercial activities is a little lower than for non-listed buildings in most cases.
Figure 15: Proportion of buildings occupied by commercial uses
Figure 19 has more detail of occupiers by type of place.

COLLIERS INTERNATIONAL 16 of 52
com
me
rcia
l use
s o
f liste
d b
uild
ings in
engla
nd fin
al.d
ocx/2
01
8-1
1-1
6 1
1:5
5
Figure 16: Uses of Non-Listed and Listed Buildings
London
CBD
London Non
CBD
Core City
CBD
Core City
Non-CBD
Small City-
Large Town Town TOTAL
Comparison Retail - Independent
Non-Listed Buldings 5% 8% 4% 9% 7% 9% 6%
Listed Buildings 8% 8% 5% 9% 8% 16% 8%
Retail Services - Independent
Non-Listed Buldings 7% 9% 8% 10% 11% 9% 9%
Listed Buildings 8% 8% 10% 11% 13% 12% 11%
Fashion - Independent
Non-Listed Buldings 5% 8% 3% 9% 4% 5% 5%
Listed Buildings 12% 8% 3% 19% 7% 10% 8%
Convenience Retail - Independent
Non-Listed Buldings 1% 2% 2% 2% 3% 3% 2%
Listed Buildings 1% 5% 2% 4% 3% 3% 3%
Total Independent Retail:
Non-Listed Buldings 18% 28% 16% 31% 25% 26% 23%
Listed Buildings 29% 29% 19% 43% 30% 41% 29%
Comparison Retail - Branded
Non-Listed Buldings 2% 1% 4% 2% 5% 4% 3%
Listed Buildings 1% 0% 2% 1% 3% 3% 2%
Retail Services - Branded
Non-Listed Buldings 3% 2% 5% 2% 6% 4% 4%
Listed Buildings 2% 2% 4% 2% 6% 5% 4%
Fashion - Branded
Non-Listed Buldings 7% 1% 8% 1% 8% 4% 6%
Listed Buildings 6% 1% 3% 2% 5% 4% 4%
Convenience Retail - Branded
Non-Listed Buldings 1% 1% 2% 2% 2% 2% 2%
Listed Buildings 0% 1% 1% 0% 1% 1% 1%
Total Branded Retail:
Non-Listed Buldings 13% 5% 20% 6% 21% 14% 15%
Listed Buildings 9% 4% 10% 5% 15% 13% 12%
Charity Retail
Non-Listed Buldings 0% 0% 0% 0% 1% 2% 1%
Listed Buildings 0% 0% 0% 0% 1% 2% 1%
TOTAL RETAIL:
Non-Listed Buldings 32% 33% 36% 36% 47% 41% 39%
Listed Buildings 38% 33% 29% 48% 47% 55% 42%
Eat and Drink - Independent
Non-Listed Buldings 9% 10% 11% 11% 11% 12% 11%
Listed Buildings 9% 14% 15% 9% 16% 17% 15%
Eat and Drink - Branded
Non-Listed Buldings 6% 4% 6% 2% 4% 2% 5%
Listed Buildings 4% 6% 6% 2% 5% 3% 5%
TOTAL EAT AND DRINK:
Non-Listed Buldings 16% 14% 18% 13% 15% 13% 15%
Listed Buildings 13% 20% 21% 11% 21% 20% 19%
Creative Industries
Non-Listed Buldings 6% 14% 4% 10% 4% 3% 6%
Listed Buildings 5% 15% 6% 12% 5% 4% 6%
Non-Professional Services
Non-Listed Buldings 13% 18% 11% 15% 10% 12% 12%
Listed Buildings 11% 12% 10% 11% 6% 5% 8%
Professional Services
Non-Listed Buldings 29% 20% 28% 20% 18% 17% 22%
Listed Buildings 27% 16% 27% 15% 16% 10% 19%
TOTAL COMMERCIAL:
Non-Listed Buldings 48% 52% 43% 46% 32% 31% 41%
Listed Buildings 43% 43% 43% 38% 27% 19% 34%
Other Uses
Non-Listed Buldings 4% 4% 6% 5% 6% 12% 6%
Listed Buildings 5% 4% 6% 3% 5% 6% 5%
TOTAL USES: 100% 100% 100% 100% 100% 100% 100%

COLLIERS INTERNATIONAL 17 of 52
com
me
rcia
l use
s o
f liste
d b
uild
ings in
engla
nd fin
al.d
ocx/2
01
8-1
1-1
6 1
1:5
5
4 BRANDS
Figure 17 shows national multiples which have four or more units in listed buildings
in the 55 places analysed. The large number of units occupied by the coffee chains
is a change since 2012.
Figure 17: Brands with four or more units in listed buildings in the 55 places
CONVENIENCE RETAIL COMPARISON RETAIL EAT AND DRINK
Greggs 14 WH Smith 9 Greene King 24
Tesco Express 7 Roly's Fudge Pantry 7 Marstons 22
Warrens 5 Specsavers 6 Caffe Nero 21
Londis 4 Waterstone's 6 Mitchells & Butler 19
Patisserie Valerie 4 Amplifon 5 Stonegate Pubs 17
Sainsbury's Local 4 Mr Simms 4 Starbucks Coffee 15
RETAIL - FASHION Paperchase 4 Nicholson's Pubs 14
Monsoon 11 CHARITY RETAIL Wetherspoon 14
Jigsaw 7 Oxfam 8 Shepherd Neame 12
The Edinburgh Woollen Mill 7 British Heart Foundation 5 Costa 11
Karen Millen 6 Age UK 4 Pizza Express 11
T M Lewin 6 RETAIL SERVICES Loch Fyne 9
White Stuff 6 Santander 17 Subway 9
Clarks 5 Countrywide 15 Fullers Pubs 8
Country Casuals 5 Lloyds 15 Pret A Manger 7
Goldsmiths 5 NatWest 14 ASK 6
Hobbs 5 Barclays 11 McDonald's 6
Jaeger 5 Royal Mail 10 Zizzi 6
Joules 5 Timpson 10 Cote 5
Mint Velvet 5 HSBC 9 Prezzo 5
Office 5 RBS 8 Slug & Lettuce 5
Pandora 5 Toni & Guy 8 Tokyo Industries 5
Phase Eight 5 TSB 8 Turtle Bay 5
Warehouse 5 Savills - Smiths Gore 7 Realpubs 4
Crabtree & Evelyn 4 Yorkshire Bank 7 Yates's 4
French Connection 4 Co-operative Bank 6 Young's 4
Gap 4 Martin & Co 6 ENTERTAINMENT
H & M 4 Nationwide 6 Ladbrokes 14
H Samuel 4 Mail Boxes Etc 5 Coral 10
Jones Bootmaker 4 O2 5 Betfred 9
Molton Brown 4 The Carphone Warehouse 5 William Hill 7
Moss Bros 4 Bridgfords 4 PROFESSIONAL SERVICES
Oasis 4 STA 4 Hays 15
Russell & Bromley 4 Adecco 4
Superdrug 4 Manpower 4
Sweaty Betty 4 Office Angels 4
Whistles 4 Randstad 4
Relate 4
The Best Connection 4

COLLIERS INTERNATIONAL 18 of 52
com
me
rcia
l use
s o
f liste
d b
uild
ings in
engla
nd fin
al.d
ocx/2
01
8-1
1-1
6 1
1:5
5
5 TOTAL USES IN ENGLAND
The data about uses of listed buildings in 55 places has been grossed up to give
an estimate of how many businesses of the type examined are in listed buildings in
England. The process of grossing up is described in Appendix 3.

Figure 18: Number of commercial operations in listed buildings by place type8
Category Code: A1 A3 A5 A6 B1 B2 B3 B4 B5 B6 C2 C3 C4 C5 C6
Place Type: London
CBD
Core CBD Small
City/Large
Town
Town London
CBD
London Non-
CBD
Core City
CBD
Core City
Non CBD
Small
City/Large
Town
Town London Non-
CBD
Core City Core City
Non CBD
Small
City/Large
Town
Town Other
Places
TOTAL
Heritage Density: High Density High Density High Density High Density Medium
Density
Medium
Density
Medium
Density
Medium
Density
Medium
Density
Medium
Density
Low Density Low Density Low Density Low Density Low Density 15%
Number of Places: 4 3 13 84 1 10 8 8 28 204 24 3 24 128 520 of Total
Comparison Retail - Independent 240 84 640 2,877 7 163 120 115 424 4,641 252 28 254 832 5,915 2,489 19,082
Retail Services - Independent 218 107 709 3,171 12 157 379 181 784 2,601 204 68 259 1,963 3,315 2,119 16,246
Fashion - Independent 366 50 429 2,247 3 157 147 357 437 2,193 240 8 202 533 2,795 1,524 11,688
Convenience Retail - Independent 32 17 208 756 0 120 88 27 166 663 96 6 168 405 845 539 4,136
Total Independent Retail: 856 257 1,986 9,051 22 597 733 680 1,811 10,098 792 110 883 3,733 12,870 6,672 51,151
Comparison Retail - Branded 22 23 189 903 0 10 80 16 179 663 0 6 34 149 845 468 3,585
Retail Services - Branded 38 35 371 1,218 10 30 139 19 312 1,734 72 33 62 1,024 2,210 1,096 8,402
Fashion - Branded 174 41 338 1,008 3 13 157 16 401 816 36 9 82 149 1,040 642 4,925
Convenience Retail - Branded 10 20 72 315 0 7 37 3 73 255 48 6 19 235 325 214 1,637
Total Branded Retail: 244 117 969 3,444 13 60 413 53 965 3,468 156 54 197 1,557 4,420 2,420 18,550
Charity Retail 0 8 88 378 0 3 16 3 58 306 0 2 5 149 390 211 1,616
TOTAL RETAIL: 1,100 381 3,042 12,873 35 660 1,163 736 2,834 13,872 948 166 1,085 5,440 17,680 9,302 71,317
Eat and Drink - Independent 234 201 1,105 3,843 24 253 501 203 976 3,621 564 104 278 2,283 4,615 2,821 21,626
Eat and Drink - Branded 82 75 332 798 22 100 248 27 302 459 204 40 72 789 585 620 4,754
TOTAL EAT AND DRINK: 316 276 1,437 4,641 46 353 749 229 1,277 4,080 768 144 350 3,072 5,200 3,441 26,380
Creative Industries 152 86 302 714 2 273 184 205 338 1,275 540 46 254 576 1,625 986 7,559
Non-Professional Services 286 123 306 966 29 203 309 259 396 1,479 456 60 259 1,173 1,885 1,228 9,418
Professional Services 626 228 689 2,751 96 300 1,131 413 1,111 2,448 600 201 322 3,157 3,120 2,579 19,772
TOTAL COMMERCIAL: 1,064 437 1,297 4,431 127 777 1,624 877 1,846 5,202 1,596 307 835 4,907 6,630 4,793 36,749
Accommodation 18 15 107 882 2 7 40 13 112 765 12 4 29 128 975 466 3,575
Entertainment 118 57 140 441 6 70 160 67 172 561 96 26 77 619 715 499 3,823
Place of Worship 8 3 39 42 0 7 5 5 30 51 24 0 5 43 65 49 376
TOTAL USES: 2,624 1,169 6,061 23,310 216 1,873 3,741 1,928 6,272 24,531 3,444 647 2,381 14,208 31,265 18,551 142,221
8 The category codes are Colliers codes for categorising places by type

Figure 19: % of all commercial uses of listed buildings by place type
Category Code: A1 A3 A5 A6 B1 B2 B3 B4 B5 B6 C2 C3 C4 C5 C6
Place Type: London
CBD
Core CBD Small
City/Large
Town
Town London
CBD
London Non-
CBD
Core City
CBD
Core City
Non CBD
Small
City/Large
Town
Town London Non-
CBD
Core City Core City
Non CBD
Small
City/Large
Town
Town Other
Places
TOTAL
Heritage Density: High Density High Density High Density High Density Medium
Density
Medium
Density
Medium
Density
Medium
Density
Medium
Density
Medium
Density
Low Density Low Density Low Density Low Density Low Density
Number of Places: 4 3 13 84 1 10 8 8 28 204 24 3 24 128 520
Comparison Retail - Independent 1% 0% 3% 15% 0% 1% 1% 1% 2% 24% 1% 0% 1% 4% 31% 13% 100%
Retail Services - Independent 1% 1% 4% 20% 0% 1% 2% 1% 5% 16% 1% 0% 2% 12% 20% 13% 100%
Fashion - Independent 3% 0% 4% 19% 0% 1% 1% 3% 4% 19% 2% 0% 2% 5% 24% 13% 100%
Convenience Retail - Independent 1% 0% 5% 18% 0% 3% 2% 1% 4% 16% 2% 0% 4% 10% 20% 13% 100%
Total Independent Retail: 2% 1% 4% 18% 0% 1% 1% 1% 4% 20% 2% 0% 2% 7% 25% 13% 100%
Comparison Retail - Branded 1% 1% 5% 25% 0% 0% 2% 0% 5% 18% 0% 0% 1% 4% 24% 13% 100%
Retail Services - Branded 0% 0% 4% 14% 0% 0% 2% 0% 4% 21% 1% 0% 1% 12% 26% 13% 100%
Fashion - Branded 4% 1% 7% 20% 0% 0% 3% 0% 8% 17% 1% 0% 2% 3% 21% 13% 100%
Convenience Retail - Branded 1% 1% 4% 19% 0% 0% 2% 0% 4% 16% 3% 0% 1% 14% 20% 13% 100%
Total Branded Retail: 1% 1% 5% 19% 0% 0% 2% 0% 5% 19% 1% 0% 1% 8% 24% 13% 100%
Charity Retail 0% 0% 5% 23% 0% 0% 1% 0% 4% 19% 0% 0% 0% 9% 24% 13% 100%
TOTAL RETAIL: 2% 1% 4% 18% 0% 1% 2% 1% 4% 19% 1% 0% 2% 8% 25% 13% 100%
Eat and Drink - Independent 1% 1% 5% 18% 0% 1% 2% 1% 5% 17% 3% 0% 1% 11% 21% 13% 100%
Eat and Drink - Branded 2% 2% 7% 17% 0% 2% 5% 1% 6% 10% 4% 1% 2% 17% 12% 13% 100%
TOTAL EAT AND DRINK: 1% 1% 5% 18% 0% 1% 3% 1% 5% 15% 3% 1% 1% 12% 20% 13% 100%
Creative Industries 2% 1% 4% 9% 0% 4% 2% 3% 4% 17% 7% 1% 3% 8% 21% 13% 100%
Non-Professional Services 3% 1% 3% 10% 0% 2% 3% 3% 4% 16% 5% 1% 3% 12% 20% 13% 100%
Professional Services 3% 1% 3% 14% 0% 2% 6% 2% 6% 12% 3% 1% 2% 16% 16% 13% 100%
TOTAL COMMERCIAL: 3% 1% 4% 12% 0% 2% 4% 2% 5% 14% 4% 1% 2% 13% 18% 13% 100%
TOTAL USES: 2% 1% 4% 16% 0% 1% 3% 1% 4% 17% 2% 0% 2% 10% 22% 13% 100%

COLLIERS INTERNATIONAL 21 of 52
com
me
rcia
l use
s o
f liste
d b
uild
ings in
engla
nd fin
al.d
ocx/2
01
8-1
1-1
6 1
1:5
5
6 CHANGE SINCE 2012 Figure 20 shows the difference in operations in listed and unlisted buildings
compared to the previous study in 20129. It suggests there has been a large
increase in all activities, even in the retail sector10.
Figure 20: Business operations by main category
2018 2012 Change
RETAIL
Non-Listed Buildings 18,703 16,982 10%
Listed Buildings 5,411 5,327 2%
EATING AND DRINKING
Non-Listed Buildings 7,252 6,111 19%
Listed Buildings 2,556 2,214 15%
COMMERCIAL
Non-Listed Buildings 18,998 11,646 63%
Listed Buildings 4,386 2,924 50%
TOTAL
Non-Listed Buildings 44,953 34,739 29%
Listed Buildings 12,353 10,465 18%
Figure 21 shows a big increase in branded retailers and places to eat and drink
occupying listed buildings at, apparently, the expense of independents.
Figure 21: Number of operations in non-listed and listed buildings in 50 places
2018 2012 Change 2018 2012 Change
Independent retail 10,663 9,476 13% 3,762 4,609 -18%
Branded retail 7,763 7,209 8% 1,549 611 154%
Charity retail 277 297 -7% 100 107 -7%
Independent eating/drinking 5,007 4,768 5% 1,921 1,981 -3%
Branded eating/drinking 2,245 1,343 67% 635 233 173%
Creative industries 2,683 2,173 23% 790 629 26%
Non-professional services 5,704 3,980 43% 1,042 674 55%
Professional services 10,611 5,493 93% 2,554 1,621 58%
TOTAL 44,953 34,739 29% 12,353 10,465 18%
NON-LISTED LISTED
Figure 23 shows the change in the number of operations in listed buildings by
heritage density. It suggests that places with the highest heritage density have had
the biggest increase in number of business operations in listed buildings, with
especially large increases in commercial services and branded retail.
9 Excludes Entertainment, Accommodation & Places of Worship, which were not
included in 2012. It removes the five additional places which were included in 2018. 10 The capacity for increase in business uses is, of course, less for listed buildings
than non-listed buildings because there is little or no opportunity to increase the amount of space provided in listed buildings.

COLLIERS INTERNATIONAL 22 of 52
com
me
rcia
l use
s o
f liste
d b
uild
ings in
engla
nd fin
al.d
ocx/2
01
8-1
1-1
6 1
1:5
5
Figure 22: Uses in listed buildings, 2018 compared to 2012
Comparison Retail - Independent
Retail Services - Independent
Fashion - Independent
Convenience Retail - Independent
Total Independent Retail:
Comparison Retail - Branded
Retail Services - Branded
Fashion - Branded
Convenience Retail - Branded
Total Branded Retail:
Charity Retail
TOTAL RETAIL:
Eat and Drink - Independent
Eat and Drink - Branded
TOTAL EAT AND DRINK:
Creative Industries
Non-Professional Services
Professional Services
TOTAL COMMERCIAL:
TOTAL USES:
-11%
20%
10%
-19%
-31%
-10%
-7%
-31%
99%
103%
81%
41%
-45%
-21%
-13%
-33%
-28%
61%
2%
27%
16%
182%
34%
23%
3%
79%
435%
213%
267%
214%
35%
5%
-39%
-26%
-50%
-53%
-37%
-15%
667%
46%
-16%
153%
1%
23%
45%
36%
679%
46%
100%
117%
-13%
-11%
24%
42%
19%
72%
51%
14%
91%
146%
-18%
-17%
0%
223%
55%
58%
50%
18%
-7%
2%
-3%
173%
15%
26%
-18%
59%
562%
94%
144%
154%
High Heritage
Density
Medium Heritage
Density
Low Heritage
Density TOTAL
Figure 24 suggests that the pattern in different with non-listed buildings, with
growth higher in areas with low heritage density than high heritage density. This
may be because, however, the higher the heritage density in an area, the less
capacity there is for growth in space that can accommodate business activity.
Figure 25 shows how city centres have been achieving the greatest growth of
operations in listed buildings. The data suggests a great increase in branded retail
services in all areas.
It is especially notable that:
• The proportion of listed buildings occupied by retail brands appears to be
increasing at a fast pace, especially in areas of high heritage density. This could
be because niche brands are less affected by on-line shopping than mainstream
brands and, often, like the size and ambience that historic buildings provide.
• The number of listed buildings occupied by branded restaurants has increased
very fast, especially in areas of medium heritage density. This reflects the boom
in coffee and casual dining chains, reflected in the list in Figure 17.

Figure 23: Change in uses in listed buildings by density of heritage
2012 2018 Change 2012 2018 Change 2012 2018 Change 2012 2018 Change
Comparison Retail - Independent 573 510 -11% 779 432 -45% 141 86 -39% 1,493 1,028 -31%
Retail Services - Independent 458 549 20% 868 684 -21% 253 187 -26% 1,579 1,420 -10%
Fashion - Independent 412 455 10% 557 485 -13% 92 46 -50% 1,061 986 -7%
Convenience Retail - Independent 156 127 -19% 252 169 -33% 68 32 -53% 476 328 -31%
Total Independent Retail: 1,599 1,641 3% 2,456 1,770 -28% 554 351 -37% 4,609 3,762 -18%
Comparison Retail - Branded 71 127 79% 84 135 61% 20 17 -15% 175 279 59%
Retail Services - Branded 40 214 435% 33 257 679% 12 92 667% 85 563 562%
Fashion - Branded 85 266 213% 188 274 46% 24 35 46% 297 575 94%
Convenience Retail - Branded 15 55 267% 28 56 100% 11 21 91% 54 132 144%
Total Branded Retail: 211 662 214% 333 722 117% 67 165 146% 611 1,549 154%
Charity Retail 49 50 2% 47 41 -13% 11 9 -18% 107 100 -7%
TOTAL RETAIL: 1,859 2,353 27% 2,836 2,533 -11% 632 525 -17% 5,327 5,411 2%
Eat and Drink - Independent 666 774 16% 1,057 888 -16% 258 259 0% 1,981 1,921 -3%
Eat and Drink - Branded 82 231 182% 120 304 153% 31 100 223% 233 635 173%
TOTAL EAT AND DRINK: 748 1,005 34% 1,177 1,192 1% 289 359 24% 2,214 2,556 15%
Creative Industries 211 260 23% 335 412 23% 83 118 42% 629 790 26%
Non-Professional Services 183 365 99% 356 516 45% 135 161 19% 674 1,042 55%
Professional Services 398 808 103% 980 1,329 36% 243 417 72% 1,621 2,554 58%
TOTAL COMMERCIAL: 792 1,433 81% 1,671 2,257 35% 461 696 51% 2,924 4,386 50%
TOTAL USES: 3,399 4,791 41% 5,684 5,982 5% 1,382 1,580 14% 10,465 12,353 18%
Medium Heritage Density High Heritage Density Low Heritage Density TOTAL

Figure 24: Change in uses in non-listed buildings by density of heritage
2012 2018 Change 2012 2018 Change 2012 2018 Change 2012 2018 Change
Comparison Retail - Independent 791 756 -4% 1,240 1,602 29% 537 612 14% 2,568 2,970 16%
Retail Services - Independent 1,102 885 -20% 1,827 2,285 25% 760 1,138 50% 3,689 4,308 17%
Fashion - Independent 624 566 -9% 1,297 1,383 7% 483 428 -11% 2,404 2,377 -1%
Convenience Retail - Independent 209 194 -7% 407 533 31% 199 281 41% 815 1,008 24%
Total Independent Retail: 2,726 2,401 -12% 4,771 5,803 22% 1,979 2,459 24% 9,476 10,663 13%
Comparison Retail - Branded 453 404 -11% 830 881 6% 370 452 22% 1,653 1,737 5%
Retail Services - Branded 637 485 -24% 1,263 1,086 -14% 550 547 -1% 2,450 2,118 -14%
Fashion - Branded 817 876 7% 1,171 1,464 25% 481 663 38% 2,469 3,003 22%
Convenience Retail - Branded 84 175 108% 343 449 31% 210 281 34% 637 905 42%
Total Branded Retail: 1,991 1,940 -3% 3,607 3,880 8% 1,611 1,943 21% 7,209 7,763 8%
Charity Retail 71 62 -13% 137 137 0% 89 78 -12% 297 277 -7%
TOTAL RETAIL: 4,788 4,403 -8% 8,515 9,820 15% 3,679 4,480 22% 16,982 18,703 10%
Eat and Drink - Independent 1,431 1,237 -14% 2,363 2,560 8% 974 1,210 24% 4,768 5,007 5%
Eat and Drink - Branded 445 622 40% 676 1,123 66% 222 500 125% 1,343 2,245 67%
TOTAL EAT AND DRINK: 1,876 1,859 -1% 3,039 3,683 21% 1,196 1,710 43% 6,111 7,252 19%
Creative Industries 681 658 -3% 1,161 1,462 26% 331 563 70% 2,173 2,683 23%
Non-Professional Services 1,324 1,416 7% 1,991 2,947 48% 665 1,341 102% 3,980 5,704 43%
Professional Services 1,590 2,404 51% 3,071 5,827 90% 832 2,380 186% 5,493 10,611 93%
TOTAL COMMERCIAL: 3,595 4,478 25% 6,223 10,236 64% 1,828 4,284 134% 11,646 18,998 63%
TOTAL USES: 10,259 10,740 5% 17,777 23,739 34% 6,703 10,474 56% 34,739 44,953 29%
High Heritage Density Medium Heritage Density Low Heritage Density TOTAL

Figure 25: Change in number of operations in listed buildings by place type
2012 2018 Change 2012 2018 Change 2012 2018 Change 2012 2018 Change 2012 2018 Change 2012 2018 Change 2012 2018 Change
Comparison Retail - Independent 140 127 -9% 75 56 -25% 225 144 -36% 42 40 -5% 711 459 -35% 300 202 -33% 1,493 1,028 -31%
Retail Services - Independent 133 121 -9% 50 52 4% 293 308 5% 42 63 50% 879 729 -17% 182 147 -19% 1,579 1,420 -10%
Fashion - Independent 102 186 82% 33 48 45% 147 105 -29% 71 137 93% 530 384 -28% 178 126 -29% 1,061 986 -7%
Convenience Retail - Independent 18 16 -11% 29 42 45% 115 58 -50% 10 3 -70% 225 169 -25% 79 40 -49% 476 328 -31%
Total Independent Retail: 393 450 15% 187 198 6% 780 615 -21% 165 243 47% 2,345 1,741 -26% 739 515 -30% 4,609 3,762 -18%
Comparison Retail - Branded 4 11 175% 2 3 50% 33 57 73% 0 4 104 164 58% 32 40 25% 175 279 59%
Retail Services - Branded 3 29 867% 3 11 267% 15 111 640% 0 13 52 332 538% 12 67 458% 85 563 562%
Fashion - Branded 19 90 374% 4 6 50% 57 100 75% 8 18 125% 181 316 75% 28 45 61% 297 575 94%
Convenience Retail - Branded 0 5 0 5 23 34 48% 1 1 0% 27 71 163% 3 16 433% 54 132 144%
Total Branded Retail: 26 135 419% 9 25 178% 128 302 136% 9 36 300% 364 883 143% 75 168 124% 611 1,549 154%
Charity Retail 0 0 1 1 0% 13 14 8% 1 0 -100% 62 65 5% 30 20 -33% 107 100 -7%
TOTAL RETAIL: 419 585 40% 197 224 14% 921 931 1% 175 279 59% 2,771 2,689 -3% 844 703 -17% 5,327 5,411 2%
Eat and Drink - Independent 165 141 -15% 126 93 -26% 489 481 -2% 71 52 -27% 869 936 8% 261 218 -16% 1,981 1,921 -3%
Eat and Drink - Branded 22 63 186% 11 43 291% 65 192 195% 2 11 450% 123 293 138% 10 33 230% 233 635 173%
TOTAL EAT AND DRINK: 187 204 9% 137 136 -1% 554 673 21% 73 63 -14% 992 1,229 24% 271 251 -7% 2,214 2,556 15%
Creative Industries 80 78 -3% 84 102 21% 156 199 28% 50 75 50% 211 282 34% 48 54 13% 629 790 26%
Non-Professional Services 116 172 48% 51 80 57% 216 312 44% 35 70 100% 220 347 58% 36 61 69% 674 1,042 55%
Professional Services 307 409 33% 98 124 27% 462 863 87% 66 103 56% 599 933 56% 89 122 37% 1,621 2,554 58%
TOTAL COMMERCIAL: 503 659 31% 233 306 31% 834 1,374 65% 151 248 64% 1,030 1,562 52% 173 237 37% 2,924 4,386 50%
TOTAL USES: 1,109 1,448 31% 567 666 17% 2,309 2,978 29% 399 590 48% 4,793 5,480 14% 1,288 1,191 -8% 10,465 12,353 18%
Small City-Large Town Town TOTALCore City Non-CBDCore City CBDLondon Non-CBDLondon CBD

Figure 26: Change in number of operations in non-listed buildings by place type
2012 2018 Change 2012 2018 Change 2012 2018 Change 2012 2018 Change 2012 2018 Change 2012 2018 Change 2012 2018 Change
Comparison Retail - Independent 356 409 15% 303 507 67% 362 415 15% 128 165 29% 1,157 1,260 9% 262 214 -18% 2,568 2,970 16%
Retail Services - Independent 663 527 -21% 455 529 16% 678 858 27% 214 208 -3% 1,457 1,985 36% 222 201 -9% 3,689 4,308 17%
Fashion - Independent 402 347 -14% 407 553 36% 384 305 -21% 215 262 22% 891 804 -10% 105 106 1% 2,404 2,377 -1%
Convenience Retail - Independent 149 89 -40% 126 133 6% 136 209 54% 43 27 -37% 331 481 45% 30 69 130% 815 1,008 24%
Total Independent Retail: 1,570 1,372 -13% 1,291 1,722 33% 1,560 1,787 15% 600 662 10% 3,836 4,530 18% 619 590 -5% 9,476 10,663 13%
Comparison Retail - Branded 165 143 -13% 43 67 56% 406 439 8% 19 25 915 975 7% 105 88 -16% 1,653 1,737 5%
Retail Services - Branded 313 248 -21% 86 131 52% 581 552 -5% 55 38 1,249 1,063 -15% 166 86 -48% 2,450 2,118 -14%
Fashion - Branded 409 514 26% 37 63 70% 668 958 43% 14 17 21% 1,233 1,365 11% 108 86 -20% 2,469 3,003 22%
Convenience Retail - Branded 20 69 46 80 175 273 56% 41 38 -7% 305 395 30% 50 50 0% 637 905 42%
Total Branded Retail: 907 974 7% 212 341 61% 1,830 2,222 21% 129 118 -9% 3,702 3,798 3% 429 310 -28% 7,209 7,763 8%
Charity Retail 6 3 4 7 75% 50 35 -30% 9 5 -44% 183 191 4% 45 36 -20% 297 277 -7%
TOTAL RETAIL: 2,483 2,349 -5% 1,507 2,070 37% 3,440 4,044 18% 738 785 6% 7,721 8,519 10% 1,093 936 -14% 16,982 18,703 10%
Eat and Drink - Independent 875 688 -21% 583 583 0% 967 1,302 35% 266 193 -27% 1,796 1,973 10% 281 268 -5% 4,768 5,007 5%
Eat and Drink - Branded 357 472 32% 125 259 107% 352 704 100% 35 56 60% 439 716 63% 35 38 9% 1,343 2,245 67%
TOTAL EAT AND DRINK: 1,232 1,160 -6% 708 588 -17% 1,319 1,816 38% 301 249 -17% 2,235 2,689 20% 316 306 -3% 6,111 7,252 19%
Creative Industries 539 456 -15% 644 753 17% 318 486 53% 177 222 25% 439 697 59% 56 69 23% 2,173 2,683 23%
Non-Professional Services 955 963 1% 561 1,075 92% 823 1,243 51% 182 312 71% 1,130 1,847 63% 329 264 -20% 3,980 5,704 43%
Professional Services 1,676 2,178 30% 701 1,201 71% 1,376 3,132 128% 232 388 67% 1,316 3,332 153% 192 380 98% 5,493 10,611 93%
TOTAL COMMERCIAL: 3,170 3,597 13% 1,906 3,029 59% 2,517 4,861 93% 591 922 56% 2,885 5,876 104% 577 713 24% 11,646 18,998 63%
TOTAL USES: 6,885 7,106 3% 4,121 5,687 38% 7,276 10,721 47% 1,630 1,956 20% 12,841 17,084 33% 1,986 1,955 -2% 34,739 44,953 29%
Core City Non-CBD Small City-Large Town Town TOTALLondon CBD London Non-CBD Core City CBD

commercial uses of listed buildings in england final.docx/2018-11-16 11:55
APPENDICES

commercial uses of listed buildings in england final.docx/2018-11-16 11:55
1 METHODOLOGY The research methodology for assessing the nature of uses in listed buildings
involved obtaining databases with relevant information and analysing them. Two
databases were used:
• The National Heritage List for England, a list of all listed buildings nationwide,
collated by Historic England. The study focuses on uses in listed buildings
because there is no database of un-listed historic buildings.
• A list of all the non-residential uses that take place in buildings, called PointX,
which is collated by Ordinance Survey11. It has data about 4 million places
across Great Britain “that can be visited, for business and pleasure”. It is
compiled from various different data suppliers such as the Local Data Company
and Experian.
The approach was to examine areas of a radius of 500 m from a mid-point in the
town / city. The rationale is:
• It is easiest to obtain and analyse the data within a circular area. ProMap has an
online service that makes it possible to look at the listed buildings, plus other
information, within a radius area on a map. Looking at many different towns and
city centres on ProMap showed that, in most places, a 500m radius covers the
core of the central business district and most listed buildings in commercial use.
• It provides a standard framework for comparing places. It is possible to compare
different places on the basis of the number of listed buildings per 500m radius
area, and to assess differences in circumstances between places that have
different densities of listed buildings.
The nature of the use of listed buildings has been examined in 55 places, shown in
Figure 27. They include just over 12,000 listed structures12 in the 500m radius
areas. The places are categorised in two dimensions.
Their “Heritage Density”, as measured by the number of listed structures per 500m
radius. They are divided into three groups: High Density (300+ listed buildings per
500m radius), Medium Density (150+ listed buildings per 500m radius), and Low
Density (less than 150 listed buildings per 500m radius).
Nature of Place. This is split into six groups: London Central Business District,
London Non-Central Business District, Core Cities13 Central Business District, Core
Cities Non-Central Business District, Small Cities/Large Towns and Towns.
11 The data was purchased from the Landmark Information Group under licence to
Colliers International. 12 In all uses. 13 The term given to the eight largest cities outside London: Birmingham, Bristol,
Leeds, Liverpool, Manchester, Newcastle, Nottingham and Sheffield. All are included in the study.

commercial uses of listed buildings in england final.docx/2018-11-16 11:55
Figure 27: Places Analysed
AREA Category
Listed
Structures Region AREA Category
Listed
Structures Region
SMALL CITIES/LARGE TOWNS (continued)
26 Colchester B5 232 East of England
LONDON CENTRAL BUSINESS DISTRICT 27 Exeter B5 295 South West
1 Mayfair & Marylebone A1 314 London 28 Guildford B5 173 South East
2 Soho A1 394 London 29 Kingston upon Hull B5 208 Yorkshire
CORE CITIES CENTRAL BUSINESS DISTRICT 30 Huddersfield B5 294 Yorkshire
3 Bristol Central A3 330 South West 31 Lancaster B5 234 North West
4 Nottingham A3 296 East Midlands 32 Leicester B5 163 East Midlands
SMALL CITIES/LARGE TOWNS 33 Lincoln B5 290 East Midlands
5 Canterbury A5 564 South East 34 St Albans B5 200 East of England
6 Norwich A5 467 East of England 35 Truro B5 251 South West
7 Winchester A5 320 South East TOWNS
8 York A5 661 Yorkshire 36 Dorchester B6 213 South West
TOWNS 37 Hexham B6 176 North East
9 Bury St Edmunds A6 590 East of England 38 Rye B6 279 South East
10 Richmond A6 316 Yorkshire 39 St Ives B6 169 South West
11 Shrewsbury A6 508 West Midlands
12 Whitby A6 375 Yorkshire
LONDON NON-CENTRAL BUSINESS DISTRICT
40 Borough C2 97 London
LONDON CENTRAL BUSINESS DISTRICT 41 Shoreditch C2 123 London
13 City B1 238 London CORE CITIES CBD
LONDON NON-CENTRAL BUSINESS DISTRICT 42 Birmingham Central C3 112 West Midlands
14 Clerkenwell B2 176 London 43 Liverpool CBD C3 142 North West
15 Islington B2 169 London 44 Sheffield C3 116 Yorkshire
16 Spitalifields B2 157 London CORE CITIES NON-CENTRAL BUSINESS DISTRICT
CORE CITIES CENTRAL BUSINESS DISTRICT 45 Leeds East / South East C4 45 Yorkshire
17 Leeds B3 238 Yorkshire 46 Manchester Northern Qtr/Ancoats C4 122 North West
18 Manchester Central B3 211 North West 47 Newcastle Byker C4 78 North East
19 Newcastle B3 273 North East 48 Nottingham Derby Road C4 67 East Midlands
CORE CITIES NON-CENTRAL BUSINESS DISTRICT 49 Sheffield Kelham Island C4 50 Yorkshire
20 Bristol Clifton B4 189 South West SMALL CITIES/LARGE TOWNS
21 Liverpool - Cathedral Quarter B4 231 North West 50 Bolton C5 62 North West
22 Birmingham Jewellery Quarter B4 188 West Midlands 51 Bradford C5 125 Yorkshire
SMALL CITIES/LARGE TOWNS 52 Doncaster C5 115 North East
23 Brighton B5 262 South East 53 Derby C5 128 East Midlands
24 Carlisle B5 193 North West 54 Northampton C5 72 East Midlands
25 Cheltenham B5 259 South West 55 Stafford C5 86 West Midlands
Total Listed Structures: 12,109
A. HIGH HERITAGE INTENSITY
300+ LISTED STRUCTURES IN 500M RADIUS OF CENTRAL POINT
B. MEDIUM HERITAGE INTENSITY
150-300 LISTED STRUCTURES PER 500M RADIUS
C. LOW HERITAGE INTENSITY
<150 LISTED STRUCTURES / 500M RADIUS OF CENTRAL POINT
Each point of interest on the Point X database is classified into one of more than
600 types, which are combined into 9 different sets: accommodation, eating and
drinking; attractions; commercial services; education and health; manufacturing
and production; public infrastructure; retail; sport and entertainment; and transport.
Five of those categories were analysed for the study: accommodation, eating and
drinking; commercial services; retail; and sport and entertainment.
The points of interest were then re-categorised into a smaller number in order to
reduce the complexity and make it easier to see patterns. They were reorganised
into the following categories:
RETAIL
Convenience – mainly food shops and newsagents.
Fashion – clothing, jewellery, shoe and cosmetic stores.
Retail Services14 – hairdressers, phone shops etc.
Comparison – antiques, gifts, photographic equipment etc.
Charity
LEISURE
Eat and Drink – pubs, restaurants and takeaways.
COMMERCIAL
14 Many of these are included in the Commercial rather than Retail in the Point of
Interest categorisation.

commercial uses of listed buildings in england final.docx/2018-11-16 11:55
Professional Services – accountants, employment agents, lawyers etc.
Creative Industries – architects, designers, artists, marketing agencies etc.
Non-Professional Services – building repairs, dating agencies etc.
OTHER
Accommodation – hotels, guest houses etc.
Entertainment
Places of Worship
Figure 28 shows how the Point X types were allocated between these categories.
The Creative Industries study which accompanies this study uses the formal
definition provided by the Department of Culture Media and Sport (DCMS), which
constitutes a set of standard industry classification (SIC codes). It can do that
because it uses data from Companies House which is categorised using SIC
codes. This study uses Point X data which does not have SIC codes.
The most challenging and time consuming aspect of the analysis was matching the
locations on the two data bases. Both databases were entered into the Colliers GIS
system. They both contain addresses, but in different format. They do not match.
We used the GIS system to convert postcodes on the Point X database to spatial
points and identified the closest points between both databases. Listed buildings
has coordinates which provide the exact spatial point. This method returned about
50% of the matches. We then split up the addresses into separate parts in Excel
(house number, street name, postcode) for both PointX and Listed buildings, and
matched that way. We then checked the matches to verify that both related to the
same building.
Bristol Central was used as a sample to check that the procedures had worked and
the data was reliable.
The result of the matching of the data was a set of uses that take place in listed
buildings, divided into Point of Interest Categories, as described above. The data
was then sorted and analysed in Excel.
The Point X data was categorised in the same way. The number of uses in non-
listed buildings was obtained by subtracting the number in listed buildings from the
total number.
The process does not provide information about the number of buildings that are
not listed. That could be done by identifying unique addresses using the PointX
database, but was not high priority for this study.

commercial uses of listed buildings in england final.docx/2018-11-16 11:55
Figure 28: Grouping of Point of Interest Categories
ACCOMMODATION 66 General Construction Supplies
1 Camping, Caravanning, Mobile Homes, Holiday Parks 67 General Purpose Machinery
2 Bed and Breakfast and Backpacker Accommodation 68 Glass
3 Hostels and Refuges For The Homeless 69 Horticultural Equipment
4 Hotels, Motels, Country Houses and Inns 70 Industrial Coatings and Finishings
5 Self Catering 71 Tools Including Machine Shops
6 Timeshare 72 Lifting and Handling Equipment
7 Youth Accommodation 73 Lubricants and Lubricating Equipment
8 CHARITY RETAIL 74 Marine Equipment Including Boats and Ships
9 COMPARISON RETAIL 75 Measurement and Inspection Equipment
10 Baby, Nursery and Playground Equipment 76 Medical Equipment, Supplies and Pharmaceuticals
11 Beds and Bedding 77 Metals Manufacturers, Fabricators and Stockholders
12 Brushes 78 Moulds, Dies and Castings
13 Candles 79 Office and Shop Equipment
14 Canvas Goods 80 Ovens and Furnaces
15 Carpets, Flooring, Rugs and Soft Furnishings 81 Packaging
16 Medals, Trophies, Ceremonial and Religious Goods 82 Paints, Varnishes and Lacquers
17 China and Glassware 83 Pesticides
18 Cookers and Stoves - Non Electrical 84 Printing Related Machinery
19 Curtains and Blinds 85 Published Goods
20 Cutlery and Tableware 86 Pumps and Compressors
21 Disability and Mobility Equipment 87 Radar and Telecommunications Equipment
22 Refrigeration and Freezing Appliances 88 Road Maintenance Equipment
23 Furniture 89 Ropes, Nets and Cordage
24 Garden Goods 90 Rubber, Silicones and Plastics
25 Giftware 91 Seals, Tapes, Taps and Valves
26 Hobby, Sports and Pastime Products 92 Signs
27 Disposable Products 93 Special Purpose Machinery and Equipment
28 Lampshades and Lighting 94 Textiles, Fabrics, Silk and Machinery
29 Leather Products 95 Stationery, Stamps, Tags and Labels
30 Luggage, Bags, Umbrellas & Travel Accessories 96 General Manufacturing
31 Musical Instruments 97 Vehicle Bodybuilders
32 Photographic and Optical Equipment 98 Vehicle Components
33 Saunas and Sunbeds 99 Vehicles
34 Tents, Marquees and Camping Equipment 100 Wood Products Inc Charcoal, Paper, Card & Board
35 Tobacco Products 101 Workwear
36 Fireplaces and Mantelpieces 102 Educational Equipment and Supplies
37 Conservatories 103 Ice
38 Bathroom Fixtures, Fittings and Sanitary Equipment 104 Fences, Gates and Railings
39 Alcoholic Drinks 105 Access Equipment
40 Animal Feeds, Pet Foods, Hay and Straw 106 Car Ports and Steel Buildings
41 Baking and Confectionery 107 Waste Collection, Processing & Disposal Equipment
42 Non Alcoholic Drinks 108 Glass Fibre Services
43 Catering and Non Specific Food Products 109 Shelving, Storage, Safes and Vaults
44 Abrasive Products and Grinding Equipment 110 Baby and Nursery Equipment & Children's Clothes
45 Adhesives and Sealants 111 Confectioners
46 Aeroplanes 112 Green and New Age Goods
47 Agricultural Machinery and Goods 113 Alcoholic Drinks Inc Off Licences & Wholesalers
48 Air and Water Filtration 114 Markets
49 Arms and Ammunition 115 Tea and Coffee Merchants
50 Bearing, Gear and Drive Elements 116 Supermarket Chains
51 Beekeeping Supplies 117 Books and Maps
52 Bricks, Tiles, Clay and Ceramic Products 118 Carpets, Rugs, Soft Furnishings & Needlecraft
53 Cable, Wire and Fibre Optics 119 China and Glassware
54 Colours, Chemicals & Water Softeners & Supplies 120 Craft Supplies
55 Cleaning Equipment and Supplies 121 Cycles and Accessories
56 Concrete Products 122 DIY and Home Improvement
57 Cooling and Refrigeration 123 Furniture
58 Electrical Components 124 Garden Centres and Nurseries
59 Electrical Motors and Generators 125 Garden Machinery and Furniture
60 Electrical Production and Manipulation Equipment 126 General Household Goods
61 Electronic Equipment 127 Hobby, Sports and Pastime Products
62 Electronic Media 128 Leather Goods, Luggage & Travel Accessories
63 Engines 129 Lighting
64 Fertilisers 130 Music and Video
65 Food and Beverage Industry Machinery 131 Musical Instruments

commercial uses of listed buildings in england final.docx/2018-11-16 11:55
132 Pets, Supplies and Services 11 Archaeological Sites
133 Camping and Caravanning 12 Battlefields
134 Department Stores 13 Historic Buildings Including Castles, Forts and Abbeys
135 Discount Stores 14 Historic and Ceremonial Structures
136 Mail Order and Catalogue Stores 15 Historical Ships
137 Shopping Centres and Retail Parks 16 Museums
138 Surplus Goods 17 Art Galleries
139 Art and Antiques 18 Commons
140 Florists 19 Country and National Parks
141 Gifts and Cards 20 Picnic Areas
142 Party Goods and Novelties 21 Playgrounds
143 Secondhand Goods 22 Municipal Parks and Gardens
144 Domestic Appliances 23 Designated Scenic Features
145 Electrical Goods and Components 24 Trigonometric Points
146 Photographic and Optical Equipment 25 Laseria, Observatories and Planetaria
147 Stationery and Office Supplies 26 Model Villages
148 Adult Shops 27 Railways (Heritage, Steam and Miniature)
149 Comics Bookshops 28 Theme and Adventure Parks
150 Computer Shops 29 Siteseeing, Tours, Viewing and Visitor Centres
151 Potteries 30 Information Centres
152 New Vehicles 31 Unspecified and Other Attractions
153 Secondhand Vehicles 32 Ponds
154 Vehicle Auctions 33 Lakes and Waters
155 Vehicle Parts and Accessories 34 Lochs and Lochans
CONVENIENCE RETAIL 35 Tarns, Pools and Meres
1 PayPoint Locations 36 Reservoirs
2 Dairy Products 37 Settling, Balancing and Silt Ponds
3 Fish, Meat and Poultry Products 38 Children's Activity Centres
4 Milling, Refining and Food Additives 39 Entertainment Services
5 Bakeries 40 Firework Related Services
6 Butchers 41 Funfair Services
7 Delicatessens 42 Mobile Discos
8 Fishmongers 43 Motorsport Services
9 Frozen Foods 44 Amusement Parks and Arcades
10 Grocers, Farm Shops and Pick Your Own 45 Bingo Halls
11 Herbs and Spices 46 Bookmakers
12 Organic, Health, Gourmet and Kosher Foods 47 Casinos
13 Convenience Stores and Independent Supermarkets 48 Pools Promoters
14 Livestock Markets 49 Angling and Sports Fishing
15 Cash and Carry 50 Combat, Laser and Paintball Games
CREATIVE INDUSTRIES 51 Hot Air Ballooning
1 Metalworkers Including Blacksmiths 52 Parachuting and Bungee Jumping
2 Architectural and Building-Related Consultants 53 Paragliding and Hang Gliding
3 Modelling and Theatrical Agencies 54 Watersports
4 Advertising Services 55 Riding Schools, Livery Stables and Equestrian Centres
5 Artists, Illustrators and Calligraphers 56 Outdoor Pursuit Organisers and Equipment
6 Electronic and Internet Publishers 57 Athletics Facilities
7 Internet Services 58 Bowling Facilities
8 Literary Services 59 Climbing Facilities
9 Marketing Services 60 Golf Ranges, Courses, Clubs and Professionals
10 Recording Studios and Record Companies 61 Gymnasiums, Sports Halls and Leisure Centres
11 Television and Radio Services 62 Ice Rinks
12 Photographic Services 63 Motorsport Venues
13 Sculptors, Wood Workers and Stone Masons 64 Racecourses and Greyhound Tracks
14 Design Services 65 Shooting Facilities
EAT AND DRINK 66 Ski Infrastructure and Aerial Cableways
1 Banqueting and Function Rooms 67 Snooker and Pool Halls
2 Cafes, Snack Bars and Tea Rooms 68 Sports Grounds, Stadia and Pitches
3 Fast Food and Takeaway Outlets 69 Squash Courts
4 Fast Food Delivery Services 70 Swimming Pools
5 Fish and Chip Shops 71 Tennis Facilities
6 Internet Cafes 72 Velodromes
7 Pubs, Bars and Inns 73 Cinemas
8 Restaurants 74 Discos
ENTERTAINMENT 75 Nightclubs
1 Zoos and Animal Collections 76 Social Clubs
2 Spas 77 Theatres and Concert Halls
3 Bouncy Castles and Inflatables Hire 78 Conference and Exhibition Centres
4 Aquaria and Sea Life Centres 79 Adult Venues
5 Bird Reserves, Collections and Sanctuaries FASHION
6 Butterfly Farms 1 Clothing, Components and Accessories
7 Farm Based Attractions 2 Cosmetics, Toiletries and Perfumes
8 Horticultural Attractions 3 Footwear
9 Salmon Ladders 4 Jewellery, Gems, Clocks and Watches
10 Zoos and Animal Collections 5 Lingerie and Hosiery

commercial uses of listed buildings in england final.docx/2018-11-16 11:55
6 Clothing 61 Pet Cemeteries and Crematoria
7 Footwear 62 Veterinarians and Animal Hospitals
8 Jewellery and Fashion Accessories 63 Veterinary Pharmacies
9 Lingerie and Hosiery 64 Education Authorities
10 Cosmetics, Toiletries, Perfumes & Hairdressing Supplies 65 Education Services
NON PROFESSIONAL SERVICES 66 Examination Boards
1 Construction Completion Services 67 Alternative, Natural and Complementary
2 Construction Plant 68 Foot Related Services
3 Cutting, Drilling and Welding Services 69 Homeopaths
4 Demolition Services 70 Speech Therapists
5 Diving Services 71 Clinics and Health Centres
6 Electrical Contractors 72 Nursing and Residential Care Homes
7 Gardening, Landscaping & Tree Surgery Services 73 Parenting and Childcare Services
8 Glaziers 74 Day and Care Centres
9 Painting and Decorating Services 75 Ballet and Dance Schools
10 Plasterers 76 Beauty and Hairdressing Schools
11 Plumbing and Heating Services 77 Diving Schools
12 Pool and Court Construction 78 Drama Schools
13 Roofing and Chimney Services 79 Driving and Motorcycle Schools
14 Fencing and Drystone Walling Services 80 First Aid Training
15 Building and Component Suppliers 81 Flying Schools
16 Security Consultants 82 Language Schools
17 Domestic Staff and Home Help 83 Martial Arts Instruction
18 Driver Agencies 84 Music Teachers and Schools
19 Agricultural Contractors 85 Nursery Schools & Pre / After School Care
20 Display and Window Dressers 86 Sailing Schools
21 Drain and Sewage Clearance 87 Sports and Fitness Coaching
22 Linen Hire and Washroom Services 88 Training Providers and Centres
23 Office Services 89 Telecommunications Companies
24 Packers 90 Utility Companies and Brokers
25 Computer Security 91 Animal Welfare Organisations
26 Computer Systems Services 92 Fan Clubs and Associations
27 Concert/Exhibition Organisers and Services 93 Sports Clubs and Associations
28 Database Services 94 Institutes and Professional Organisations
29 Desktop Publishing Services 95 Political Parties and Related Organisations
30 Film and Video Services 96 Religious Organisations
31 General Computer Services 97 Youth Organisations
32 Event Ticket Agents and Box Office 98 Community Networks and Projects
33 Astrologers, Clairvoyants and Palmists 99 Charitable Organisations
34 Customer Service Centres 100 Conservation Organisations
35 CV Writers 101 Coal Mining
36 Headquarters, Administration and Central Offices 102 Oil & Gas Extraction, Refinery & Product Manufacture
37 Motoring Organisations 103 Ore Mining
38 Party Organisers 104 Peat Extraction
39 Sports Services 105 Sand, Gravel and Clay Extraction and Merchants
40 Weather Services 106 Stone Quarrying and Preparation
41 Window Cleaners 107 Unspecified Quarries or Mines
42 Musicians, Orchestras and Composers 108 Business Parks and Industrial Estates
43 Vehicle Breakdown and Recovery Services 109 Fuel Distributors and Suppliers
44 Sewage Services PLACE OF WORSHIP
45 Printing On Garments PROFESSIONAL SERVICES
46 Commercial Property Letting 1 Business-Related Consultants
47 Recycling, Reclamation and Disposal 2 Computer Consultants
48 Rag Merchants 3 Construction Service Consultants
49 Clearance and Salvage Dealers 4 Feng Shui Consultants, Furnishers & Shop Fitters
50 Scrap Metal Dealers and Breakers Yards 5 Food Consultants
51 Waste Paper Merchants 6 Image Consultants
52 Building Repairs 7 Interpretation and Translation Consultants
53 Household Repairs and Restoration 8 Traffic Mgment & Transport Related Consultants
54 Industrial Repairs and Servicing 9 Careers Offices & Armed Forces Recruitment
55 Vehicle Repair, Testing and Servicing 10 Employment Agencies
56 Distribution and Haulage 11 Nursing Agencies
57 Import and Export Services 12 Aviation Engineers
58 Removals and Shipping Agents 13 Chemical Engineers
59 Taxi Services 14 Civil Engineers
60 Clothing Hire 15 Electrical and Electronic Engineers

commercial uses of listed buildings in england final.docx/2018-11-16 11:55
16 Hydraulic Engineers 88 Courts, Court Services and Tribunals
17 Industrial Engineers 89 Driving Test Centres
18 Instrumentation Engineers 90 Embassies and Consulates
19 Marine Engineers and Services 91 Fire Brigade Stations
20 Mechanical Engineers 92 Central Government
21 Pneumatic Engineers 93 Local Government
22 Precision Engineers 94 Revenue and Customs Offices
23 Structural Engineers 95 Job Centres
24 Aircraft Charters 96 Members of Parliament / European Parliament
25 Catering Services 97 Police Stations
26 Contract Cleaning Services 98 Prisons
27 Mailing and Other Information Services 99 Probation Offices & Police Support Services
28 Plate Makers, Print Finishers and Type Setters 100 Registrars Offices
29 Press and Journalism Services 101 Social Service Activities
30 Accountants and Auditors 102 Tribunals
31 Auctioneers, Auction Rooms and Valuers 103 Foreign Country Support Activities
32 Company Registration and Trademarks 104 Electrical Features
33 Copyright and Patent 105 Fire Safety Features
34 Credit Reference Agencies 106 Gas Features
35 Debt Collecting Agencies 107 Meteorological Features
36 Financial Advice Services RETAIL SERVICES
37 Fundraising Services 1 Building Contractors
38 Insurers and Support Activities 2 Restoration and Preservation Services
39 Solicitors, Advocates and Notaries Public 3 Road Construction Services
40 Stocks, Shares and Unit Trusts 4 Telecommunications Consultants
41 Commodity Dealers 5 Pest and Vermin Control
42 Franchise and Holding Company Services 6 Printing and Photocopying Services
43 Pension and Fund Management 7 Telephone, Telex and Fax Services
44 Detective and Investigation Agencies 8 Banks and Building Societies
45 Funeral and Associated Services 9 Currency Conversion and Money Transfers
46 Historical Research 10 Cheque Cashing
47 Estate and Property Management 11 Mortgage and Financial Lenders
48 Property Development Services 12 Pawnbrokers
49 Property Information Services 13 Hotel Booking Agencies
50 Research Services 14 Hair and Beauty Services
51 Testing and Analysis Services 15 Cleaning Services
52 Airlines and Airline Services 16 Lock, Key and Security Services
53 Railway Related Services 17 Message and Greeting Services
54 Sound, Light & Vision Service & Equipment Hire 18 Personalisation
55 Dental Technicians 19 Tattooing and Piercing Services
56 Dieticians and Nutritionists 20 Trophies and Engraving Services
57 Midwifery 21 Vehicle Cleaning Services
58 Optometrists and Opticians 22 Wedding Services
59 Physical Therapy 23 Tailoring and Clothing Alteration
60 Surgeons and Cosmetic Surgeries 24 Slimming Clubs and Services
61 Chemists and Pharmacies 25 Adult Services
62 Dental and Medical Laboratories 26 Property Sales
63 Dental Surgeries 27 Property Letting
64 Doctors Surgeries 28 Electrical Equipment Repair and Servicing
65 Hospices 29 Service Industry Equipment Repairs
66 Hospitals 30 Sports and Leisure Equipment Repair
67 Mental Health Centres and Practitioners 31 Tool Repairs
68 Accident and Emergency Hospitals 32 Shoe Repairs
69 Walk-In Centre 33 Animal Transportation
70 Ambulance and Medical Transportation Services 34 Courier, Delivery and Messenger
71 Blood Transfusion Service 35 Ferry and Cruise Companies
72 Counselling and Advice Services 36 Boat Hiring Services
73 Health Authorities 37 Construction and Tool Hire
74 Medical Waste Disposal Services 38 Leisure Equipment Hirings
75 Pregnancy Related Services and Help Centres 39 Renting and Leasing of Personal and Household Goods
76 X-Ray Services 40 Vehicle Hire and Rental
77 First, Primary and Infant Schools 41 Animal Clipping and Grooming
78 Further Education Establishments 42 Dog Training
79 Independent and Preparatory Schools 43 Horse Training
80 Broad Age Range and Secondary State Schools 44 Kennels and Catteries
81 Special Schools and Colleges 45 Secure Units
82 Higher Education Establishments 46 Medical Equipment Rental and Leasing
83 Unspecified and Other Schools 47 Travel Agencies
84 Pupil Referral Units 48 Computer Supplies
85 Armed Services 49 Telephones and Telephone Cards
86 Coastal Safety 50 Post Offices
87 Consular Services 51 Garages, Garden and Portable Buildings

commercial uses of listed buildings in england final.docx/2018-11-16 11:55
1 DETAILED DATA FOR USES IN
55 PLACES The tables below show the full data by place for the business uses that take place
in listed and non-listed buildings in 500m radius areas of a central point in the 55
places analysed.

com
me
rcia
l use
s o
f liste
d b
uild
ings in
engla
nd fin
al.d
ocx/2
01
8-1
1-1
6 1
1:5
5
CO
LLIE
RS
INT
ER
NA
TIO
NA
L
36 o
f 52
Figure 29: Number of business uses in non-listed and listed buildings – High Heritage Density
Ma
yfa
ir
Soho
Bristo
l
Ce
ntr
al
No
ttin
gha
m
No
rwic
h
Win
ch
este
r
York
Ca
nte
rbury
Ric
hm
on
d
Wh
itb
y
Bury
St
Edm
unds
Shre
wsbury
TO
TA
L
% O
F
TO
TA
L
USES IN NON-LISTED BUILDINGS
Comparison Retail - Independent 148 200 41 73 85 32 49 20 11 30 26 41 756 7%
Retail Services - Independent 160 194 55 131 99 37 56 30 16 18 39 50 885 8%
Fashion - Independent 181 151 26 47 55 16 24 1 7 14 18 26 566 5%
Convenience Retail - Independent 17 57 22 16 19 5 14 7 2 12 9 14 194 2%
Total Independent Retail: 506 602 144 267 258 90 143 58 36 74 92 131 2,401 21%
Comparison Retail - Branded 52 53 38 50 41 25 35 38 5 10 31 26 404 4%
Retail Services - Branded 90 53 38 81 54 36 34 33 5 13 27 21 485 4%
Fashion - Branded 293 115 47 122 63 28 69 62 1 6 38 32 876 8%
Convenience Retail - Branded 19 24 27 40 17 6 11 5 4 7 7 8 175 2%
Total Branded Retail: 454 245 150 293 175 95 149 138 15 36 103 87 1,940 17%
Charity Retail 3 0 2 8 7 7 2 7 3 8 7 8 62 1%
TOTAL RETAIL: 963 847 296 568 440 192 294 203 54 118 202 226 4,403 38%
Eat and Drink - Independent 139 401 123 184 72 39 98 28 14 57 36 46 1,237 11%
Eat and Drink - Branded 102 206 39 99 41 16 53 26 2 5 19 14 622 5%
TOTAL EAT AND DRINK: 241 607 162 283 113 55 151 54 16 62 55 60 1,859 16%
Creative Industries 108 288 61 59 40 25 26 13 4 2 17 15 658 6%
Non-Professional Services 328 428 121 149 80 64 65 41 17 26 49 48 1,416 12%
Professional Services 725 519 240 221 164 94 117 80 32 33 97 82 2,404 21%
TOTAL COMMERCIAL: 1,161 1,235 422 429 284 183 208 134 53 61 163 145 4,478 39%
Accommodation 14 20 10 11 2 8 14 5 2 60 1 2 149 1%
Entertainment 53 176 34 56 27 16 24 14 5 13 13 37 468 4%
Place of Worship 5 9 16 11 19 16 23 15 4 9 11 9 147 1%
TOTAL USES: 2,437 2,894 940 1,358 885 470 714 425 134 323 445 479 11,504 100%
USES IN LISTED BUILDINGS
Comparison Retail - Independent 72 48 34 22 43 23 91 40 12 50 26 49 510 10%
Retail Services - Independent 49 60 37 34 55 20 75 68 20 15 55 61 549 11%
Fashion - Independent 119 64 9 24 46 6 53 27 5 32 24 46 455 9%
Convenience Retail - Independent 3 13 4 7 13 3 30 18 8 10 9 9 127 3%
Total Independent Retail: 243 185 84 87 157 52 249 153 45 107 114 165 1,641 32%
Comparison Retail - Branded 6 5 1 14 7 6 32 13 3 1 16 23 127 3%
Retail Services - Branded 12 7 6 17 23 20 49 22 8 3 25 22 214 4%
Fashion - Branded 38 49 2 25 19 12 52 21 1 2 19 26 266 5%
Convenience Retail - Branded 1 4 6 7 0 4 15 3 6 3 4 2 55 1%
Total Branded Retail: 57 65 15 63 49 42 148 59 18 9 64 73 662 13%
Charity Retail 0 0 1 4 5 2 13 7 4 2 4 8 50 1%
TOTAL RETAIL: 300 250 100 154 211 96 410 219 67 118 182 246 2,353 46%
Eat and Drink - Independent 24 93 82 52 76 15 158 91 24 50 36 73 774 15%
Eat and Drink - Branded 12 29 18 32 19 15 45 23 3 1 14 20 231 5%
TOTAL EAT AND DRINK: 36 122 100 84 95 30 203 114 27 51 50 93 1,005 20%
Creative Industries 33 43 24 33 31 21 25 16 4 9 5 16 260 5%
Non-Professional Services 69 74 48 34 27 17 33 17 8 1 14 23 365 7%
Professional Services 219 94 79 73 73 47 54 38 8 6 57 60 808 16%
TOTAL COMMERCIAL: 321 211 151 140 131 85 112 71 20 16 76 99 1,433 28%
Accommodation 4 5 4 6 7 3 15 8 11 15 4 12 94 2%
Entertainment 11 48 19 19 12 9 20 2 5 2 6 8 161 3%
Place of Worship 3 1 2 0 9 0 2 1 0 0 2 0 20 0%
TOTAL USES: 675 637 376 403 465 223 762 415 130 202 320 458 5,066 100%

com
me
rcia
l use
s o
f liste
d b
uild
ings in
engla
nd fin
al.d
ocx/2
01
8-1
1-1
6 1
1:5
5
CO
LLIE
RS
INT
ER
NA
TIO
NA
L
37 o
f 52
Figure 30: Business uses in non-listed and listed buildings, % of total – Medium Heritage Density
Ma
yfa
ir
Soho
Bristo
l
Ce
ntr
al
No
ttin
gha
m
No
rwic
h
Win
ch
este
r
York
Ca
nte
rbury
Ric
hm
on
d
Wh
itb
y
Bury
St
Edm
unds
Shre
wsbury
TO
TA
L
USES IN NON-LISTED BUILDINGS
Comparison Retail - Independent 6% 7% 4% 5% 10% 7% 7% 5% 8% 9% 6% 9% 7%
Retail Services - Independent 7% 7% 6% 10% 11% 8% 8% 7% 12% 6% 9% 10% 8%
Fashion - Independent 7% 5% 3% 3% 6% 3% 3% 0% 5% 4% 4% 5% 5%
Convenience Retail - Independent 1% 2% 2% 1% 2% 1% 2% 2% 1% 4% 2% 3% 2%
Total Independent Retail: 21% 21% 15% 20% 29% 19% 20% 14% 27% 23% 21% 27% 21%
Comparison Retail - Branded 2% 2% 4% 4% 5% 5% 5% 9% 4% 3% 7% 5% 4%
Retail Services - Branded 4% 2% 4% 6% 6% 8% 5% 8% 4% 4% 6% 4% 4%
Fashion - Branded 12% 4% 5% 9% 7% 6% 10% 15% 1% 2% 9% 7% 8%
Convenience Retail - Branded 1% 1% 3% 3% 2% 1% 2% 1% 3% 2% 2% 2% 2%
Total Branded Retail: 19% 8% 16% 22% 20% 20% 21% 32% 11% 11% 23% 18% 17%
Charity Retail 0% 0% 0% 1% 1% 1% 0% 2% 2% 2% 2% 2% 1%
TOTAL RETAIL: 40% 29% 31% 42% 50% 41% 41% 48% 40% 37% 45% 47% 38%
Eat and Drink - Independent 6% 14% 13% 14% 8% 8% 14% 7% 10% 18% 8% 10% 11%
Eat and Drink - Branded 4% 7% 4% 7% 5% 3% 7% 6% 1% 2% 4% 3% 5%
TOTAL EAT AND DRINK: 10% 21% 17% 21% 13% 12% 21% 13% 12% 19% 12% 13% 16%
Creative Industries 4% 10% 6% 4% 5% 5% 4% 3% 3% 1% 4% 3% 6%
Non-Professional Services 13% 15% 13% 11% 9% 14% 9% 10% 13% 8% 11% 10% 12%
Professional Services 30% 18% 26% 16% 19% 20% 16% 19% 24% 10% 22% 17% 21%
TOTAL COMMERCIAL: 48% 43% 45% 32% 32% 39% 29% 32% 40% 19% 37% 30% 39%
TOTAL USES: 100% 100% 100% 100% 100% 100% 100% 100% 100% 100% 100% 100% 100%
Accommodation 1% 1% 1% 1% 0% 2% 2% 1% 1% 19% 0% 0% 1%
Entertainment 2% 6% 4% 4% 3% 3% 3% 3% 4% 4% 3% 8% 4%
Place of Worship 0% 0% 2% 1% 2% 3% 3% 4% 3% 3% 2% 2% 1%
TOTAL USES: 100% 100% 100% 100% 100% 100% 100% 100% 100% 100% 100% 100% 100%
USES IN LISTED BUILDINGS
Comparison Retail - Independent 11% 8% 9% 5% 9% 10% 12% 10% 9% 25% 8% 11% 10%
Retail Services - Independent 7% 9% 10% 8% 12% 9% 10% 16% 15% 7% 17% 13% 11%
Fashion - Independent 18% 10% 2% 6% 10% 3% 7% 7% 4% 16% 8% 10% 9%
Convenience Retail - Independent 0% 2% 1% 2% 3% 1% 4% 4% 6% 5% 3% 2% 3%
Total Independent Retail: 36% 29% 22% 22% 34% 23% 33% 37% 35% 53% 36% 36% 32%
Comparison Retail - Branded 1% 1% 0% 3% 2% 3% 4% 3% 2% 0% 5% 5% 3%
Retail Services - Branded 2% 1% 2% 4% 5% 9% 6% 5% 6% 1% 8% 5% 4%
Fashion - Branded 6% 8% 1% 6% 4% 5% 7% 5% 1% 1% 6% 6% 5%
Convenience Retail - Branded 0% 1% 2% 2% 0% 2% 2% 1% 5% 1% 1% 0% 1%
Total Branded Retail: 8% 10% 4% 16% 11% 19% 19% 14% 14% 4% 20% 16% 13%
Charity Retail 0% 0% 0% 1% 1% 1% 2% 2% 3% 1% 1% 2% 1%
TOTAL RETAIL: 44% 39% 27% 38% 45% 43% 54% 53% 52% 58% 57% 54% 46%
Eat and Drink - Independent 4% 15% 22% 13% 16% 7% 21% 22% 18% 25% 11% 16% 15%
Eat and Drink - Branded 2% 5% 5% 8% 4% 7% 6% 6% 2% 0% 4% 4% 5%
TOTAL EAT AND DRINK: 5% 19% 27% 21% 20% 13% 27% 27% 21% 25% 16% 20% 20%
Creative Industries 5% 7% 6% 8% 7% 9% 3% 4% 3% 4% 2% 3% 5%
Non-Professional Services 10% 12% 13% 8% 6% 8% 4% 4% 6% 0% 4% 5% 7%
Professional Services 32% 15% 21% 18% 16% 21% 7% 9% 6% 3% 18% 13% 16%
TOTAL COMMERCIAL: 48% 33% 40% 35% 28% 38% 15% 17% 15% 8% 24% 22% 28%
Accommodation 1% 1% 1% 1% 2% 1% 2% 2% 8% 7% 1% 3% 2%
Entertainment 2% 8% 5% 5% 3% 4% 3% 0% 4% 1% 2% 2% 3%
Place of Worship 0% 0% 1% 0% 2% 0% 0% 0% 0% 0% 1% 0% 0%
TOTAL USES: 100% 100% 100% 100% 100% 100% 100% 100% 100% 100% 100% 100% 100%

com
me
rcia
l use
s o
f liste
d b
uild
ings in
engla
nd fin
al.d
ocx/2
01
8-1
1-1
6 1
1:5
5
CO
LLIE
RS
INT
ER
NA
TIO
NA
L
38 o
f 52
Figure 31: Number of business uses in non-listed and listed buildings – Medium Heritage Density
City o
f
London
Cle
rke
nw
ell
Islin
gto
n
Spitalfie
lds
Leeds
Ma
nch
este
r
Ce
ntr
al
Ne
wca
stle
Bristo
l
Clif
ton
Liv
erp
ool
Ca
the
dra
l
Qrt
Birm
ingham
Jew
elle
ry
Qtr
Brighto
n
Ca
rlis
le
Ch
elte
nh
am
Co
lch
este
r
Exete
r
Guiil
dfo
rd
Hu
ll
Hu
dd
ers
fie
l
d Lancaste
r
Leic
este
r
Lin
coln
Tru
ro
St A
lbans
St Iv
es
Rye
He
xh
am
Do
rch
este
r
TO
TA
L
% O
F
TO
TA
L
USES IN NON-LISTED BUILDINGS
Comparison Retail - Independent 61 201 90 131 46 49 45 17 26 77 133 61 53 54 70 36 44 52 59 46 29 57 33 31 27 35 39 1,602 6%
Retail Services - Independent 173 131 99 206 108 123 80 34 34 65 116 89 121 116 90 45 63 82 61 124 67 57 84 22 27 29 39 2,285 9%
Fashion - Independent 15 387 34 124 42 26 22 7 15 178 110 19 40 38 30 22 27 33 31 50 24 32 18 24 9 11 15 1,383 6%
Convenience Retail - Independent 15 41 24 42 30 19 25 5 29 8 43 18 13 39 14 10 15 25 19 32 8 8 10 14 9 7 11 533 2%
Total Independent Retail: 264 760 247 503 226 217 172 63 104 328 402 187 227 247 204 113 149 192 170 252 128 154 145 91 72 82 104 5,803 23%
Comparison Retail - Branded 38 14 22 14 78 38 56 9 9 4 77 45 49 50 54 48 34 46 35 22 29 28 35 2 2 14 29 881 4%
Retail Services - Branded 105 25 47 36 86 62 48 21 10 10 60 36 44 53 55 64 36 47 35 56 32 28 43 10 6 22 9 1,086 4%
Fashion - Branded 106 5 27 26 210 81 138 11 3 4 128 65 73 72 105 73 64 63 23 24 45 26 45 12 0 14 21 1,464 6%
Convenience Retail - Branded 26 14 15 24 37 22 30 3 15 8 25 14 17 26 14 17 23 17 13 20 18 12 8 11 4 8 8 449 2%
Total Branded Retail: 275 58 111 100 411 203 272 44 37 26 290 160 183 201 228 202 157 173 106 122 124 94 131 35 12 58 67 3,880 15%
Charity Retail 0 0 7 0 3 1 4 2 2 0 6 8 8 12 13 6 3 7 8 11 9 5 5 3 2 3 9 137 1%
TOTAL RETAIL: 539 818 365 603 640 421 448 109 143 354 698 355 418 460 445 321 309 372 284 385 261 253 281 129 86 143 180 9,820 39%
Eat and Drink - Independent 148 151 113 203 155 118 115 55 164 36 243 77 77 90 75 41 76 79 71 138 67 60 57 60 33 27 31 2,560 10%
Eat and Drink - Branded 164 59 50 86 129 91 62 29 26 5 81 19 32 33 33 51 24 17 17 39 19 13 27 3 2 3 9 1,123 4%
TOTAL EAT AND DRINK: 312 210 163 289 284 209 177 84 190 41 324 96 109 123 108 92 100 96 88 177 86 73 84 63 35 30 40 3,683 15%
Creative Industries 60 407 73 107 42 95 40 24 32 85 99 18 76 26 28 31 19 15 27 46 16 20 28 8 8 19 13 1,462 6%
Non-Professional Services 207 404 154 233 133 183 106 66 61 120 170 50 127 85 107 76 37 72 67 125 61 69 61 19 32 64 58 2,947 12%
Professional Services 934 463 130 319 512 683 203 92 72 179 243 101 221 147 235 139 87 120 107 228 100 119 160 31 41 66 95 5,827 23%
TOTAL COMMERCIAL: 1,201 1,274 357 659 687 961 349 182 165 384 512 169 424 258 370 246 143 207 201 399 177 208 249 58 81 149 166 10,236 41%
Accommodation 6 12 4 13 8 9 14 8 16 7 27 5 13 2 8 5 5 1 4 11 9 4 6 30 7 5 4 243 1%
Entertainment 51 51 34 44 63 44 40 25 26 8 70 37 27 26 35 18 29 26 23 38 28 12 18 7 12 18 13 823 3%
Place of Worship 0 6 7 10 6 6 9 8 7 5 11 12 10 14 21 11 0 11 16 15 11 9 7 8 6 8 9 243 1%
TOTAL USES: 2,109 2,371 930 1,618 1,688 1,650 1,037 416 547 799 1,642 674 1,001 883 987 693 586 713 616 1,025 572 559 645 295 227 353 412 25,048 100%
USES IN LISTED BUILDINGS
Comparison Retail - Independent 7 20 13 16 10 16 19 6 9 28 34 9 18 11 16 7 7 24 10 4 24 14 19 28 31 11 21 432 7%
Retail Services - Independent 12 19 18 10 39 46 57 9 18 41 29 33 45 26 45 14 11 49 26 10 13 39 24 5 7 16 23 684 11%
Fashion - Independent 3 34 8 5 18 14 23 3 6 125 54 8 13 9 20 6 3 17 7 3 21 24 18 16 10 11 6 485 8%
Convenience Retail - Independent 0 25 7 4 4 6 23 3 5 2 6 5 3 6 4 2 9 24 7 6 2 1 2 4 2 5 2 169 3%
Total Independent Retail: 22 98 46 35 71 82 122 21 38 196 123 55 79 52 85 29 30 114 50 23 60 78 63 53 50 43 52 1,770 28%
Comparison Retail - Branded 0 1 1 1 11 7 12 5 1 0 2 4 16 3 12 11 4 6 2 1 6 11 5 1 1 5 6 135 2%
Retail Services - Branded 10 3 5 1 22 14 16 2 1 4 7 12 21 10 9 17 2 12 12 7 10 17 9 1 4 8 21 257 4%
Fashion - Branded 3 0 3 1 21 24 14 5 0 1 12 2 24 5 8 69 9 9 1 2 8 31 6 4 2 4 6 274 4%
Convenience Retail - Branded 0 2 0 0 5 5 4 0 1 0 5 4 1 1 8 0 2 2 0 1 5 3 2 2 0 1 2 56 1%
Total Branded Retail: 13 6 9 3 59 50 46 12 3 5 26 22 62 19 37 97 17 29 15 11 29 62 22 8 7 18 35 722 11%
Charity Retail 0 1 0 0 1 0 5 0 1 0 1 3 3 4 1 1 0 3 2 1 1 7 0 1 1 2 2 41 1%
TOTAL RETAIL: 35 105 55 38 131 132 173 33 42 201 150 80 144 75 123 127 47 146 67 35 90 147 85 62 58 63 89 2,533 40%
Eat and Drink - Independent 24 29 22 25 49 60 79 13 42 21 50 33 41 43 38 12 32 54 30 26 40 35 19 13 25 15 18 888 14%
Eat and Drink - Branded 22 11 12 7 37 23 33 5 4 1 21 8 10 9 19 12 11 17 4 10 6 6 7 2 0 1 6 304 5%
TOTAL EAT AND DRINK: 46 40 34 32 86 83 112 18 46 22 71 41 51 52 57 24 43 71 34 36 46 41 26 15 25 16 24 1,192 19%
Creative Industries 2 44 18 20 15 28 26 13 14 50 20 5 26 3 17 7 9 8 11 7 8 18 18 3 11 4 7 412 7%
Non-Professional Services 29 27 12 22 40 37 39 15 39 43 24 14 19 11 25 3 6 16 18 8 7 14 19 1 5 10 13 516 8%
Professional Services 96 45 22 23 153 178 93 41 45 69 44 38 67 36 51 38 35 43 47 23 14 48 32 3 6 9 30 1,329 21%
TOTAL COMMERCIAL: 127 116 52 65 208 243 158 69 98 162 88 57 112 50 93 48 50 67 76 38 29 80 69 7 22 23 50 2,257 36%
Accommodation 2 0 0 2 4 3 8 0 4 1 10 5 6 7 3 1 2 3 6 2 3 3 1 8 4 2 1 91 1%
Entertainment 6 7 5 9 18 21 21 10 8 7 12 6 8 4 5 3 6 13 5 4 8 5 1 2 2 4 3 203 3%
Place of Worship 0 2 0 0 1 0 1 0 2 0 1 3 2 1 1 2 0 1 1 0 2 0 0 0 0 1 0 21 0%
TOTAL USES: 216 270 146 146 448 482 473 130 200 393 332 192 323 189 282 205 148 301 189 115 178 276 182 94 111 109 167 6,297 100%

com
me
rcia
l use
s o
f liste
d b
uild
ings in
engla
nd fin
al.d
ocx/2
01
8-1
1-1
6 1
1:5
5
CO
LLIE
RS
INT
ER
NA
TIO
NA
L
39 o
f 52
Figure 32: Business uses in non-listed and listed buildings, % of total – Medium Heritage Density
City o
f
London
Cle
rke
nw
ell
Islin
gto
n
Spitalfie
lds
Leeds
Ma
nch
este
r
Ce
ntr
al
Ne
wca
stle
Bristo
l
Clif
ton
Liv
erp
ool
Ca
the
dra
l
Qrt
Birm
ingham
Jew
elle
ry
Qtr
Brighto
n
Ca
rlis
le
Ch
elte
nh
am
Co
lch
este
r
Exete
r
Guiil
dfo
rd
Hu
ll
Hu
dd
ers
fie
l
d Lancaste
r
Leic
este
r
Lin
coln
Tru
ro
St A
lbans
St Iv
es
Rye
He
xh
am
Do
rch
este
r
TO
TA
L
USES IN NON-LISTED BUILDINGS
Comparison Retail - Independent 3% 8% 10% 8% 3% 3% 4% 4% 5% 10% 8% 9% 5% 6% 7% 5% 8% 7% 10% 4% 5% 10% 5% 11% 12% 10% 9% 6%
Retail Services - Independent 8% 6% 11% 13% 6% 7% 8% 8% 6% 8% 7% 13% 12% 13% 9% 6% 11% 12% 10% 12% 12% 10% 13% 7% 12% 8% 9% 9%
Fashion - Independent 1% 16% 4% 8% 2% 2% 2% 2% 3% 22% 7% 3% 4% 4% 3% 3% 5% 5% 5% 5% 4% 6% 3% 8% 4% 3% 4% 6%
Convenience Retail - Independent 1% 2% 3% 3% 2% 1% 2% 1% 5% 1% 3% 3% 1% 4% 1% 1% 3% 4% 3% 3% 1% 1% 2% 5% 4% 2% 3% 2%
Total Independent Retail: 13% 32% 27% 31% 13% 13% 17% 15% 19% 41% 24% 28% 23% 28% 21% 16% 25% 27% 28% 25% 22% 28% 22% 31% 32% 23% 25% 23%
Comparison Retail - Branded 2% 1% 2% 1% 5% 2% 5% 2% 2% 1% 5% 7% 5% 6% 5% 7% 6% 6% 6% 2% 5% 5% 5% 1% 1% 4% 7% 4%
Retail Services - Branded 5% 1% 5% 2% 5% 4% 5% 5% 2% 1% 4% 5% 4% 6% 6% 9% 6% 7% 6% 5% 6% 5% 7% 3% 3% 6% 2% 4%
Fashion - Branded 5% 0% 3% 2% 12% 5% 13% 3% 1% 1% 8% 10% 7% 8% 11% 11% 11% 9% 4% 2% 8% 5% 7% 4% 0% 4% 5% 6%
Convenience Retail - Branded 1% 1% 2% 1% 2% 1% 3% 1% 3% 1% 2% 2% 2% 3% 1% 2% 4% 2% 2% 2% 3% 2% 1% 4% 2% 2% 2% 2%
Total Branded Retail: 13% 2% 12% 6% 24% 12% 26% 11% 7% 3% 18% 24% 18% 23% 23% 29% 27% 24% 17% 12% 22% 17% 20% 12% 5% 16% 16% 15%
Charity Retail 0% 0% 1% 0% 0% 0% 0% 0% 0% 0% 0% 1% 1% 1% 1% 1% 1% 1% 1% 1% 2% 1% 1% 1% 1% 1% 2% 1%
TOTAL RETAIL: 26% 35% 39% 37% 38% 26% 43% 26% 26% 44% 43% 53% 42% 52% 45% 46% 53% 52% 46% 38% 46% 45% 44% 44% 38% 41% 44% 39%
Eat and Drink - Independent 7% 6% 12% 13% 9% 7% 11% 13% 30% 5% 15% 11% 8% 10% 8% 6% 13% 11% 12% 13% 12% 11% 9% 20% 15% 8% 8% 10%
Eat and Drink - Branded 8% 2% 5% 5% 8% 6% 6% 7% 5% 1% 5% 3% 3% 4% 3% 7% 4% 2% 3% 4% 3% 2% 4% 1% 1% 1% 2% 4%
TOTAL EAT AND DRINK: 15% 9% 18% 18% 17% 13% 17% 20% 35% 5% 20% 14% 11% 14% 11% 13% 17% 13% 14% 17% 15% 13% 13% 21% 15% 8% 10% 15%
Creative Industries 3% 17% 8% 7% 2% 6% 4% 6% 6% 11% 6% 3% 8% 3% 3% 4% 3% 2% 4% 4% 3% 4% 4% 3% 4% 5% 3% 6%
Non-Professional Services 10% 17% 17% 14% 8% 11% 10% 16% 11% 15% 10% 7% 13% 10% 11% 11% 6% 10% 11% 12% 11% 12% 9% 6% 14% 18% 14% 12%
Professional Services 44% 20% 14% 20% 30% 41% 20% 22% 13% 22% 15% 15% 22% 17% 24% 20% 15% 17% 17% 22% 17% 21% 25% 11% 18% 19% 23% 23%
TOTAL COMMERCIAL: 57% 54% 38% 41% 41% 58% 34% 44% 30% 48% 31% 25% 42% 29% 37% 35% 24% 29% 33% 39% 31% 37% 39% 20% 36% 42% 40% 41%
TOTAL USES: 100% 100% 100% 100% 100% 100% 100% 100% 100% 100% 100% 100% 100% 100% 100% 100% 100% 100% 100% 100% 100% 100% 100% 100% 100% 100% 100% 100%
Accommodation 0% 1% 0% 1% 0% 1% 1% 2% 3% 1% 2% 1% 1% 0% 1% 1% 1% 0% 1% 1% 2% 1% 1% 10% 3% 1% 1% 1%
Entertainment 2% 2% 4% 3% 4% 3% 4% 6% 5% 1% 4% 5% 3% 3% 4% 3% 5% 4% 4% 4% 5% 2% 3% 2% 5% 5% 3% 3%
Place of Worship 0% 0% 1% 1% 0% 0% 1% 2% 1% 1% 1% 2% 1% 2% 2% 2% 0% 2% 3% 1% 2% 2% 1% 3% 3% 2% 2% 1%
TOTAL USES: 100% 100% 100% 100% 100% 100% 100% 100% 100% 100% 100% 100% 100% 100% 100% 100% 100% 100% 100% 100% 100% 100% 100% 100% 100% 100% 100% 100%
USES IN LISTED BUILDINGS
Comparison Retail - Independent 3% 7% 9% 11% 2% 3% 4% 5% 5% 7% 10% 5% 6% 6% 6% 3% 5% 8% 5% 3% 13% 5% 10% 30% 28% 10% 13% 7%
Retail Services - Independent 6% 7% 12% 7% 9% 10% 12% 7% 9% 10% 9% 17% 14% 14% 16% 7% 7% 16% 14% 9% 7% 14% 13% 5% 6% 15% 14% 11%
Fashion - Independent 1% 13% 5% 3% 4% 3% 5% 2% 3% 32% 16% 4% 4% 5% 7% 3% 2% 6% 4% 3% 12% 9% 10% 17% 9% 10% 4% 8%
Convenience Retail - Independent 0% 9% 5% 3% 1% 1% 5% 2% 3% 1% 2% 3% 1% 3% 1% 1% 6% 8% 4% 5% 1% 0% 1% 4% 2% 5% 1% 3%
Total Independent Retail: 10% 36% 32% 24% 16% 17% 26% 16% 19% 50% 37% 29% 24% 28% 30% 14% 20% 38% 26% 20% 34% 28% 35% 56% 45% 39% 31% 28%
Comparison Retail - Branded 0% 0% 1% 1% 2% 1% 3% 4% 1% 0% 1% 2% 5% 2% 4% 5% 3% 2% 1% 1% 3% 4% 3% 1% 1% 5% 4% 2%
Retail Services - Branded 5% 1% 3% 1% 5% 3% 3% 2% 1% 1% 2% 6% 7% 5% 3% 8% 1% 4% 6% 6% 6% 6% 5% 1% 4% 7% 13% 4%
Fashion - Branded 1% 0% 2% 1% 5% 5% 3% 4% 0% 0% 4% 1% 7% 3% 3% 34% 6% 3% 1% 2% 4% 11% 3% 4% 2% 4% 4% 4%
Convenience Retail - Branded 0% 1% 0% 0% 1% 1% 1% 0% 1% 0% 2% 2% 0% 1% 3% 0% 1% 1% 0% 1% 3% 1% 1% 2% 0% 1% 1% 1%
Total Branded Retail: 6% 2% 6% 2% 13% 10% 10% 9% 2% 1% 8% 11% 19% 10% 13% 47% 11% 10% 8% 10% 16% 22% 12% 9% 6% 17% 21% 11%
Charity Retail 0% 0% 0% 0% 0% 0% 1% 0% 1% 0% 0% 2% 1% 2% 0% 0% 0% 1% 1% 1% 1% 3% 0% 1% 1% 2% 1% 1%
TOTAL RETAIL: 16% 39% 38% 26% 29% 27% 37% 25% 21% 51% 45% 42% 45% 40% 44% 62% 32% 49% 35% 30% 51% 53% 47% 66% 52% 58% 53% 40%
Eat and Drink - Independent 11% 11% 15% 17% 11% 12% 17% 10% 21% 5% 15% 17% 13% 23% 13% 6% 22% 18% 16% 23% 22% 13% 10% 14% 23% 14% 11% 14%
Eat and Drink - Branded 10% 4% 8% 5% 8% 5% 7% 4% 2% 0% 6% 4% 3% 5% 7% 6% 7% 6% 2% 9% 3% 2% 4% 2% 0% 1% 4% 5%
TOTAL EAT AND DRINK: 21% 15% 23% 22% 19% 17% 24% 14% 23% 6% 21% 21% 16% 28% 20% 12% 29% 24% 18% 31% 26% 15% 14% 16% 23% 15% 14% 19%
Creative Industries 1% 16% 12% 14% 3% 6% 5% 10% 7% 13% 6% 3% 8% 2% 6% 3% 6% 3% 6% 6% 4% 7% 10% 3% 10% 4% 4% 7%
Non-Professional Services 13% 10% 8% 15% 9% 8% 8% 12% 20% 11% 7% 7% 6% 6% 9% 1% 4% 5% 10% 7% 4% 5% 10% 1% 5% 9% 8% 8%
Professional Services 44% 17% 15% 16% 34% 37% 20% 32% 23% 18% 13% 20% 21% 19% 18% 19% 24% 14% 25% 20% 8% 17% 18% 3% 5% 8% 18% 21%
TOTAL COMMERCIAL: 59% 43% 36% 45% 46% 50% 33% 53% 49% 41% 27% 30% 35% 26% 33% 23% 34% 22% 40% 33% 16% 29% 38% 7% 20% 21% 30% 36%
Accommodation 1% 0% 0% 1% 1% 1% 2% 0% 2% 0% 3% 3% 2% 4% 1% 0% 1% 1% 3% 2% 2% 1% 1% 9% 4% 2% 1% 1%
Entertainment 3% 3% 3% 6% 4% 4% 4% 8% 4% 2% 4% 3% 2% 2% 2% 1% 4% 4% 3% 3% 4% 2% 1% 2% 2% 4% 2% 3%
Place of Worship 0% 1% 0% 0% 0% 0% 0% 0% 1% 0% 0% 2% 1% 1% 0% 1% 0% 0% 1% 0% 1% 0% 0% 0% 0% 1% 0% 0%
TOTAL USES: 100% 100% 100% 100% 100% 100% 100% 100% 100% 100% 100% 100% 100% 100% 100% 100% 100% 100% 100% 100% 100% 100% 100% 100% 100% 100% 100% 100%

com
me
rcia
l use
s o
f liste
d b
uild
ings in
engla
nd fin
al.d
ocx/2
01
8-1
1-1
6 1
1:5
5
CO
LLIE
RS
INT
ER
NA
TIO
NA
L
40 o
f 52
Figure 33: Number of business uses in non-listed and listed buildings – Low Heritage Density
Boro
ugh
London
Shore
ditch
Birm
ingham
CB
D
Liv
erp
ool
CB
D
Sheffie
ld
Ma
nch
este
r
No
rth
ern
Qtr
Leeds -
East / S
outh
East
Ne
wca
stle
-
Byker
No
ttin
gha
m -
De
rby R
oad
Sheffie
ld -
Kelh
am
Isla
nd
Bolton
Bra
dfo
rd
Do
nca
ste
r
De
rby
No
rth
am
pto
n Sta
fford
TO
TA
L
% O
F
TO
TA
L
USES IN NON-LISTED BUILDINGS
Comparison Retail - Independent 85 169 35 43 40 88 36 25 32 62 54 54 61 77 33 42 936 6%
Retail Services - Independent 93 167 106 118 69 143 49 3 61 40 88 93 138 118 98 74 1,458 10%
Fashion - Independent 8 127 31 56 33 84 19 3 6 11 40 37 30 60 28 21 594 4%
Convenience Retail - Independent 26 44 20 28 15 19 16 2 19 9 33 34 36 43 19 8 371 3%
Total Independent Retail: 212 507 192 245 157 334 120 33 118 122 215 218 265 298 178 145 3,359 23%
Comparison Retail - Branded 17 12 51 75 35 21 17 6 3 1 37 50 47 42 43 34 491 3%
Retail Services - Branded 23 18 82 67 57 28 13 0 4 5 55 36 35 58 56 50 587 4%
Fashion - Branded 5 16 118 164 64 13 4 0 0 0 40 64 51 54 57 33 683 5%
Convenience Retail - Branded 27 17 33 37 29 30 9 3 6 4 23 22 21 27 24 8 320 2%
Total Branded Retail: 72 63 284 343 185 92 43 9 13 10 155 172 154 181 180 125 2,081 14%
Charity Retail 0 0 2 3 8 5 1 0 0 0 7 8 9 16 11 9 79 1%
TOTAL RETAIL: 284 570 478 591 350 431 164 42 131 132 377 398 428 495 369 279 5,519 38%
Eat and Drink - Independent 116 211 113 156 119 157 83 1 52 47 97 75 101 129 88 59 1,604 11%
Eat and Drink - Branded 64 43 89 95 45 51 14 0 6 2 28 29 18 28 32 21 565 4%
TOTAL EAT AND DRINK: 180 254 202 251 164 208 97 1 58 49 125 104 119 157 120 80 2,169 15%
Creative Industries 166 378 42 49 42 137 54 25 16 29 22 21 27 32 14 11 1,065 7%
Non-Professional Services 284 397 170 124 130 192 66 45 45 55 64 74 89 96 57 61 1,949 13%
Professional Services 289 394 492 363 254 209 102 29 97 83 123 122 157 158 94 119 3,085 21%
TOTAL COMMERCIAL: 739 1169 704 536 426 538 222 99 158 167 209 217 273 286 165 191 6,099 42%
Accommodation 16 10 22 24 7 15 9 0 6 2 3 5 4 9 7 3 142 1%
Entertainment 43 85 40 59 43 44 21 6 19 11 38 40 36 44 34 16 579 4%
Place of Worship 8 8 7 5 10 7 4 5 6 5 14 4 9 14 0 5 111 1%
TOTAL USES: 1,270 2,096 1,453 1,466 1,000 1,243 517 153 378 366 766 768 869 1,005 695 574 14,619 100%
USES IN LISTED BUILDINGS
Comparison Retail - Independent 7 14 4 20 4 12 24 0 5 12 3 8 11 10 3 4 141 7%
Retail Services - Independent 5 12 21 33 14 22 23 1 7 1 3 22 15 30 12 10 231 11%
Fashion - Independent 1 19 2 4 2 12 29 0 1 0 3 3 5 9 2 3 95 5%
Convenience Retail - Independent 6 2 1 3 2 1 32 1 1 0 2 2 6 7 1 1 68 3%
Total Independent Retail: 19 47 28 60 22 47 108 2 14 13 11 35 37 56 18 18 535 26%
Comparison Retail - Branded 0 0 2 2 2 4 2 0 1 0 0 1 2 1 0 3 20 1%
Retail Services - Branded 2 4 12 14 7 9 3 0 0 1 0 11 10 12 10 5 100 5%
Fashion - Branded 2 1 5 3 1 17 0 0 0 0 0 1 3 0 0 3 36 2%
Convenience Retail - Branded 3 1 1 3 2 1 3 0 0 0 0 1 5 2 2 1 25 1%
Total Branded Retail: 7 6 20 22 12 31 8 0 1 1 0 14 20 15 12 12 181 9%
Charity Retail 0 0 0 0 2 0 1 0 0 0 0 4 2 0 0 1 10 0%
TOTAL RETAIL: 26 53 48 82 36 78 117 2 15 14 11 53 59 71 30 31 726 35%
Eat and Drink - Independent 17 30 24 51 29 31 20 1 5 1 5 17 29 31 17 8 316 15%
Eat and Drink - Branded 13 4 15 14 11 10 5 0 0 0 4 1 8 14 5 5 109 5%
TOTAL EAT AND DRINK: 30 34 39 65 40 41 25 1 5 1 9 18 37 45 22 13 425 20%
Creative Industries 20 25 16 25 5 25 14 1 3 10 2 9 2 10 3 1 171 8%
Non-Professional Services 19 19 19 33 8 27 6 4 6 11 8 19 6 11 8 3 207 10%
Professional Services 34 16 75 94 32 34 9 3 9 12 23 50 18 24 23 10 466 22%
TOTAL COMMERCIAL: 73 60 110 152 45 86 29 8 18 33 33 78 26 45 34 14 844 40%
Accommodation 0 1 0 3 1 5 0 0 1 0 0 2 2 2 0 0 17 1%
Entertainment 2 6 4 11 11 9 3 1 0 3 6 2 5 6 7 3 79 4%
Place of Worsjip 0 2 0 0 0 0 1 0 0 0 1 0 1 0 0 0 5 0%
TOTAL USES: 131 156 201 313 133 219 175 12 39 51 60 153 130 169 93 61 2,096 100%

com
me
rcia
l use
s o
f liste
d b
uild
ings in
engla
nd fin
al.d
ocx/2
01
8-1
1-1
6 1
1:5
5
CO
LLIE
RS
INT
ER
NA
TIO
NA
L
41 o
f 52
Figure 34: Businesses uses in non-listed and listed buildings, % of total – Low Heritage Density
Boro
ugh
London
Shore
ditch
Birm
ingham
CB
D
Liv
erp
ool
CB
D
Sheffie
ld
Ma
nch
este
r
No
rth
ern
Qtr
Leeds -
East /
South
East
Ne
wca
stle
-
Byker
No
ttin
gha
m -
De
rby R
oad
Sheffie
ld -
Kelh
am
Isla
nd
Bolton
Bra
dfo
rd
Do
nca
ste
r
De
rby
No
rth
am
pto
n Sta
fford
TO
TA
L
NON-LISTED BUILDINGS
Comparison Retail - Independent 7% 8% 2% 3% 4% 7% 7% 16% 8% 17% 7% 7% 7% 8% 5% 7% 6%
Retail Services - Independent 7% 8% 7% 8% 7% 12% 9% 2% 16% 11% 11% 12% 16% 12% 14% 13% 10%
Fashion - Independent 1% 6% 2% 4% 3% 7% 4% 2% 2% 3% 5% 5% 3% 6% 4% 4% 4%
Convenience Retail - Independent 2% 2% 1% 2% 2% 2% 3% 1% 5% 2% 4% 4% 4% 4% 3% 1% 3%
Total Independent Retail: 17% 24% 13% 17% 16% 27% 23% 22% 31% 33% 28% 28% 30% 30% 26% 25% 23%
Comparison Retail - Branded 1% 1% 4% 5% 4% 2% 3% 4% 1% 0% 5% 7% 5% 4% 6% 6% 3%
Retail Services - Branded 2% 1% 6% 5% 6% 2% 3% 0% 1% 1% 7% 5% 4% 6% 8% 9% 4%
Fashion - Branded 0% 1% 8% 11% 6% 1% 1% 0% 0% 0% 5% 8% 6% 5% 8% 6% 5%
Convenience Retail - Branded 2% 1% 2% 3% 3% 2% 2% 2% 2% 1% 3% 3% 2% 3% 3% 1% 2%
Total Branded Retail: 6% 3% 20% 23% 19% 7% 8% 6% 3% 3% 20% 22% 18% 18% 26% 22% 14%
Charity Retail 0% 0% 0% 0% 1% 0% 0% 0% 0% 0% 1% 1% 1% 2% 2% 2% 1%
TOTAL RETAIL: 22% 27% 33% 40% 35% 35% 32% 27% 35% 36% 49% 52% 49% 49% 53% 49% 38%
Eat and Drink - Independent 9% 10% 8% 11% 12% 13% 16% 1% 14% 13% 13% 10% 12% 13% 13% 10% 11%
Eat and Drink - Branded 5% 2% 6% 6% 5% 4% 3% 0% 2% 1% 4% 4% 2% 3% 5% 4% 4%
TOTAL EAT AND DRINK: 14% 12% 14% 17% 16% 17% 19% 1% 15% 13% 16% 14% 14% 16% 17% 14% 15%
Creative Industries 13% 18% 3% 3% 4% 11% 10% 16% 4% 8% 3% 3% 3% 3% 2% 2% 7%
Non-Professional Services 22% 19% 12% 8% 13% 15% 13% 29% 12% 15% 8% 10% 10% 10% 8% 11% 13%
Professional Services 23% 19% 34% 25% 25% 17% 20% 19% 26% 23% 16% 16% 18% 16% 14% 21% 21%
TOTAL COMMERCIAL: 58% 56% 48% 37% 43% 43% 43% 65% 42% 46% 27% 28% 31% 28% 24% 33% 42%
TOTAL USES: 100% 100% 100% 100% 100% 100% 100% 100% 100% 100% 100% 100% 100% 100% 100% 100% 100%
Accommodation 1% 0% 2% 2% 1% 1% 2% 0% 2% 1% 0% 1% 0% 1% 1% 1% 1%
Entertainment 3% 4% 3% 4% 4% 4% 4% 4% 5% 3% 5% 5% 4% 4% 5% 3% 4%
Place of Worship 1% 0% 0% 0% 1% 1% 1% 3% 2% 1% 2% 1% 1% 1% 0% 1% 1%
TOTAL USES: 100% 100% 100% 100% 100% 100% 100% 100% 100% 100% 100% 100% 100% 100% 100% 100% 100%
USES IN LISTED BUILDINGS
Comparison Retail - Independent 5% 9% 2% 6% 3% 5% 14% 0% 13% 24% 5% 5% 8% 6% 3% 7% 7%
Retail Services - Independent 4% 8% 10% 11% 11% 10% 13% 8% 18% 2% 5% 14% 12% 18% 13% 16% 11%
Fashion - Independent 1% 12% 1% 1% 2% 5% 17% 0% 3% 0% 5% 2% 4% 5% 2% 5% 5%
Convenience Retail - Independent 5% 1% 0% 1% 2% 0% 18% 8% 3% 0% 3% 1% 5% 4% 1% 2% 3%
Total Independent Retail: 15% 30% 14% 19% 17% 21% 62% 17% 36% 25% 18% 23% 28% 33% 19% 30% 26%
Comparison Retail - Branded 0% 0% 1% 1% 2% 2% 1% 0% 3% 0% 0% 1% 2% 1% 0% 5% 1%
Retail Services - Branded 2% 3% 6% 4% 5% 4% 2% 0% 0% 2% 0% 7% 8% 7% 11% 8% 5%
Fashion - Branded 2% 1% 2% 1% 1% 8% 0% 0% 0% 0% 0% 1% 2% 0% 0% 5% 2%
Convenience Retail - Branded 2% 1% 0% 1% 2% 0% 2% 0% 0% 0% 0% 1% 4% 1% 2% 2% 1%
Total Branded Retail: 5% 4% 10% 7% 9% 14% 5% 0% 3% 2% 0% 9% 15% 9% 13% 20% 9%
Charity Retail 0% 0% 0% 0% 2% 0% 1% 0% 0% 0% 0% 3% 2% 0% 0% 2% 0%
TOTAL RETAIL: 20% 34% 24% 26% 27% 36% 67% 17% 38% 27% 18% 35% 45% 42% 32% 51% 35%
Eat and Drink - Independent 13% 19% 12% 16% 22% 14% 11% 8% 13% 2% 8% 11% 22% 18% 18% 13% 15%
Eat and Drink - Branded 10% 3% 7% 4% 8% 5% 3% 0% 0% 0% 7% 1% 6% 8% 5% 8% 5%
TOTAL EAT AND DRINK: 23% 22% 19% 21% 30% 19% 14% 8% 13% 2% 15% 12% 28% 27% 24% 21% 20%
Creative Industries 15% 16% 8% 8% 4% 11% 8% 8% 8% 20% 3% 6% 2% 6% 3% 2% 8%
Non-Professional Services 15% 12% 9% 11% 6% 12% 3% 33% 15% 22% 13% 12% 5% 7% 9% 5% 10%
Professional Services 26% 10% 37% 30% 24% 16% 5% 25% 23% 24% 38% 33% 14% 14% 25% 16% 22%
TOTAL COMMERCIAL: 56% 38% 55% 49% 34% 39% 17% 67% 46% 65% 55% 51% 20% 27% 37% 23% 40%
Accommodation 0% 1% 0% 1% 1% 2% 0% 0% 3% 0% 0% 1% 2% 1% 0% 0% 1%
Entertainment 2% 4% 2% 4% 8% 4% 2% 8% 0% 6% 10% 1% 4% 4% 8% 5% 4%
Place of Worship 0% 1% 0% 0% 0% 0% 1% 0% 0% 0% 2% 0% 1% 0% 0% 0% 0%
TOTAL USES: 100% 100% 100% 100% 100% 100% 100% 100% 100% 100% 100% 100% 100% 100% 100% 100% 100%


commercial uses of listed buildings in england final.docx/2018-11-16 11:55
COLLIERS INTERNATIONAL 43 of 52
2 SUMMARISED DATA FOR 55
PLACES

DR
AFT
com
me
rcia
l use
s o
f liste
d b
uild
ings in
engla
nd fin
al.d
ocx/2
01
8-1
1-1
6 1
1:5
5
CO
LLIE
RS
INT
ER
NA
TIO
NA
L
44 o
f 52
Figure 35: Number of businesses uses in non-listed and listed buildings – High Heritage Density
Ma
yfa
ir
Soho
Bristo
l
Ce
ntr
al
No
ttin
gha
m
No
rwic
h
Win
ch
este
r
York
Ca
nte
rbury
Ric
hm
on
d
Wh
itb
y
Bury
St
Edm
unds
Shre
wsbury
TO
TA
L
USES IN NON-LISTED BUILDINGS
INDEPENDENTS
Retail 506 602 144 267 258 90 143 58 36 74 92 131 2,401
Eating & Drinking 139 401 123 184 72 39 98 28 14 57 36 46 1,237
Total 645 1003 267 451 330 129 241 86 50 131 128 177 3,638
BRANDS
Retail 454 245 150 293 175 95 149 138 15 36 103 87 1,940
Eating & Drinking 102 206 39 99 41 16 53 26 2 5 19 14 622
Total 556 451 189 392 216 111 202 164 17 41 122 101 2,562
TOTAL
Retail 960 847 294 560 433 185 292 196 51 110 195 218 4,341
Eating & Drinking 241 607 162 283 113 55 151 54 16 62 55 60 1,859
Total 1201 1454 456 843 546 240 443 250 67 172 250 278 6,200
% OF EATING & DRINKING & RETAIL
Independents 54% 69% 59% 53% 60% 54% 54% 34% 75% 76% 51% 64% 59%
Brands 46% 31% 41% 47% 40% 46% 46% 66% 25% 24% 49% 36% 41%
USES IN LISTED BUILDINGS
INDEPENDENTS
Retail 243 185 85 91 162 54 262 160 49 109 118 173 1,691
Eating & Drinking 24 93 82 52 76 15 158 91 24 50 36 73 774
Total 267 278 167 143 238 69 420 251 73 159 154 246 2,465
BRANDS
Retail 57 65 15 63 49 42 148 59 18 9 64 73 662
Eating & Drinking 12 29 18 32 19 15 45 23 3 1 14 20 231
Total 69 94 33 95 68 57 193 82 21 10 78 93 893
TOTAL
Retail 300 250 100 154 211 96 410 219 67 118 182 246 2,353
Eating & Drinking 36 122 100 84 95 30 203 114 27 51 50 93 1,005
Total 336 372 200 238 306 126 613 333 94 169 232 339 3,358
% OF EATING & DRINKING & RETAIL
Independents 79% 75% 84% 60% 78% 55% 69% 75% 78% 94% 66% 73% 73%
Brands 21% 25% 17% 40% 22% 45% 31% 25% 22% 6% 34% 27% 27%

DR
AFT
com
me
rcia
l use
s o
f liste
d b
uild
ings in
engla
nd fin
al.d
ocx/2
01
8-1
1-1
6 1
1:5
5
CO
LLIE
RS
INT
ER
NA
TIO
NA
L
45 o
f 52
Figure 36: Number of business uses in non-listed and listed buildings – Medium Heritage Density
City o
f
London
Cle
rke
nw
ell
Islin
gto
n
Spitalfie
lds
Leeds
Ma
nch
este
r
Ce
ntr
al
Ne
wca
stle
Bristo
l
Clif
ton
Liv
erp
ool
Ca
the
dra
l
Qrt
Birm
ingham
Jew
elle
ry
Qtr
Brighto
n
Ca
rlis
le
Ch
elte
nh
am
Co
lch
este
r
Exete
r
Guiil
dfo
rd
Hu
ll
Hu
dd
ers
fie
ld
Lancaste
r
Leic
este
r
Lin
coln
Tru
ro
St A
lbans
St Iv
es
Rye
He
xh
am
Do
rch
este
r
TO
TA
L
USES IN NON-LISTED BUILDINGS
INDEPENDENTS
Retail 264 760 247 503 226 217 172 63 104 328 402 187 227 247 204 113 149 192 170 252 128 154 145 91 72 82 104 5,803
Eating & Drinking 148 151 113 203 155 118 115 55 164 36 243 77 77 90 75 41 76 79 71 138 67 60 57 60 33 27 31 2,560
Total 412 911 360 706 381 335 287 118 268 364 645 264 304 337 279 154 225 271 241 390 195 214 202 151 105 109 135 8,363
BRANDS
Retail 275 58 111 100 411 203 272 44 37 26 290 160 183 201 228 202 157 173 106 122 124 94 131 35 12 58 67 3,880
Eating & Drinking 164 59 50 86 129 91 62 29 26 5 81 19 32 33 33 51 24 17 17 39 19 13 27 3 2 3 9 1,123
Total 439 117 161 186 540 294 334 73 63 31 371 179 215 234 261 253 181 190 123 161 143 107 158 38 14 61 76 5,003
TOTAL
Retail 539 818 358 603 637 420 444 107 141 354 692 347 410 448 432 315 306 365 276 374 252 248 276 126 84 140 171 9,683
Eating & Drinking 312 210 163 289 284 209 177 84 190 41 324 96 109 123 108 92 100 96 88 177 86 73 84 63 35 30 40 3,683
Total 851 1028 521 892 921 629 621 191 331 395 1016 443 519 571 540 407 406 461 364 551 338 321 360 189 119 170 211 13,366
% OF EATING & DRINKING & RETAIL
Independents 48% 89% 69% 79% 41% 53% 46% 62% 81% 92% 63% 60% 59% 59% 52% 38% 55% 59% 66% 71% 58% 67% 56% 80% 88% 64% 64% 63%
Brands 52% 11% 31% 21% 59% 47% 54% 38% 19% 8% 37% 40% 41% 41% 48% 62% 45% 41% 34% 29% 42% 33% 44% 20% 12% 36% 36% 37%
USES IN LISTED BUILDINGS
INDEPENDENTS
Retail 22 99 46 35 72 82 127 21 39 196 124 58 82 56 86 30 30 117 52 24 61 85 63 54 51 45 54 1,811
Eating & Drinking 24 29 22 25 49 60 79 13 42 21 50 33 41 43 38 12 32 54 30 26 40 35 19 13 25 15 18 888
Total 46 128 68 60 121 142 206 34 81 217 174 91 123 99 124 42 62 171 82 50 101 120 82 67 76 60 72 2,699
BRANDS
Retail 13 6 9 3 59 50 46 12 3 5 26 22 62 19 37 97 17 29 15 11 29 62 22 8 7 18 35 722
Eating & Drinking 22 11 12 7 37 23 33 5 4 1 21 8 10 9 19 12 11 17 4 10 6 6 7 2 0 1 6 304
Total 35 17 21 10 96 73 79 17 7 6 47 30 72 28 56 109 28 46 19 21 35 68 29 10 7 19 41 1,026
TOTAL
Retail 35 105 55 38 131 132 173 33 42 201 150 80 144 75 123 127 47 146 67 35 90 147 85 62 58 63 89 2,533
Eating & Drinking 46 40 34 32 86 83 112 18 46 22 71 41 51 52 57 24 43 71 34 36 46 41 26 15 25 16 24 1,192
Total 81 145 89 70 217 215 285 51 88 223 221 121 195 127 180 151 90 217 101 71 136 188 111 77 83 79 113 3,725
% OF EATING & DRINKING & RETAIL
Independents 57% 88% 76% 86% 56% 66% 72% 67% 92% 97% 79% 75% 63% 78% 69% 28% 69% 79% 81% 70% 74% 64% 74% 87% 92% 76% 64% 72%
Brands 43% 12% 24% 14% 44% 34% 28% 33% 8% 3% 21% 25% 37% 22% 31% 72% 31% 21% 19% 30% 26% 36% 26% 13% 8% 24% 36% 28%

DR
AFT
com
me
rcia
l use
s o
f liste
d b
uild
ings in
engla
nd fin
al.d
ocx/2
01
8-1
1-1
6 1
1:5
5
CO
LLIE
RS
INT
ER
NA
TIO
NA
L
46 o
f 52
Figure 37: Number of business uses in non-listed and listed buildings – Low Heritage Density
Boro
ugh
London
Shore
ditch
Birm
ingham
CB
D
Leeds -
East
/ S
outh
East
Liv
erp
ool
CB
D
Sheffie
ld
Sheffie
ld -
Kelh
am
Isla
nd
Ma
nch
este
r
No
rth
ern
Qtr
Ne
wca
stle
-
Byker
No
ttin
gha
m -
De
rby R
oad
Bolton
Bra
dfo
rd
Do
nca
ste
r
De
rby
No
rth
am
pto
n
Sta
fford
TO
TA
L
USES IN NON-LISTED BUILDINGS
INDEPENDENTS
Retail 212 507 192 120 245 157 122 334 33 118 215 218 265 298 178 145 3,359
Eating & Drinking 116 211 113 83 156 119 47 157 1 52 97 75 101 129 88 59 1,604
Total 328 718 305 203 401 276 169 491 34 170 312 293 366 427 266 204 4,963
BRANDS
Retail 72 63 284 43 343 185 10 92 9 13 155 172 154 181 180 125 2,081
Eating & Drinking 64 43 89 14 95 45 2 51 0 6 28 29 18 28 32 21 565
Total 136 106 373 57 438 230 12 143 9 19 183 201 172 209 212 146 2,646
TOTAL
Retail 284 570 476 163 588 342 132 426 42 131 370 390 419 479 358 270 5,440
Eating & Drinking 180 254 202 97 251 164 49 208 1 58 125 104 119 157 120 80 2,169
Total 464 824 678 260 839 506 181 634 43 189 495 494 538 636 478 350 7,609
% OF EATING & DRINKING & RETAIL
Independents 71% 87% 45% 78% 48% 55% 93% 77% 79% 90% 63% 59% 68% 67% 56% 58% 65%
Brands 29% 13% 55% 22% 52% 45% 7% 23% 21% 10% 37% 41% 32% 33% 44% 42% 35%
USES IN LISTED BUILDINGS
INDEPENDENTS
Retail 19 47 28 60 24 47 109 2 14 13 11 39 39 56 18 19 545
Eating & Drinking 17 30 24 51 29 31 20 1 5 1 5 17 29 31 17 8 316
Total 36 77 52 111 53 78 129 3 19 14 16 56 68 87 35 27 861
BRANDS
Retail 7 6 20 22 12 31 8 0 1 1 0 14 20 15 12 12 181
Eating & Drinking 13 4 15 14 11 10 5 0 0 0 4 1 8 14 5 5 109
Total 20 10 35 36 23 41 13 0 1 1 4 15 28 29 17 17 290
TOTAL
Retail 26 53 48 82 36 78 117 2 15 14 11 53 59 71 30 31 726
Eating & Drinking 30 34 39 65 40 41 25 1 5 1 9 18 37 45 22 13 425
Total 56 87 87 147 76 119 142 3 20 15 20 71 96 116 52 44 1,151
% OF EATING & DRINKING & RETAIL
Independents 64% 89% 60% 76% 70% 66% 91% 100% 95% 93% 80% 79% 71% 75% 67% 61% 75%
Brands 36% 11% 40% 24% 30% 34% 9% 0% 5% 7% 20% 21% 29% 25% 33% 39% 25%

commercial uses of listed buildings in england final.docx/2018-11-16 11:55
COLLIERS INTERNATIONAL 47 of 52
3 GROSSING UP The methodology for grossing up the results from the 55 places to a national
estimate of the number of commercial users of listed buildings has been to
categorise other places across England on the same basis as for the 55 places in
terms of type of place and heritage density (see the process described in the
methodology in Appendix 1 and the classification shown in Figure 27, which shows
the letter / number categories) This section describes how it has been done for
each type of place.
LONDON
London is especially difficult to deal with because concentrations of listed buildings
are scattered and difficult to identify. There are surprisingly few intense
concentrations, however, outside the central area. Figure 38 shows how the 32
London Boroughs have been categorised.
Figure 38: Categorisation of the London Boroughs
1 Kensington & Chelsea A2 9 Hammersmith and Fulham B2 17 Newham C2 25 Harrow C2
2 Westminster B1 10 Croydon C2 18 Hillingdon C2 26 Hackney C2
3 Ealing B2 11 Barnet C2 19 Redbridge C2 27 Tower Hamlets C2
4 Lambeth B2 12 Bromley C2 20 Havering C2 28 Merton C2
5 Greenwich B2 13 Enfield C2 21 Waltham Forest C2 29 Sutton C2
6 Camden B2 14 Brent C2 22 Haringey C2 30 Richmond upon Thames C2
7 Islington B2 15 Wandsworth C2 23 Hounslow C2 31 Barking and Dagenham C2
8 Southwark B2 16 Lewisham C2 24 Bexley C2 32 Kingston upon Thames C2
“CORE CITIES” (MAIN REGIONAL CITIES)
All the large English cities are included in the basic analysis. It has been assumed
that there are 2 low density non-Central Business District areas for each city (24 in
total) and 8 medium density non-CBD areas in total.
LARGE TOWNS AND SMALL CITIES
A list of towns and cities, with their estimated population at the 2011 census, was
obtained from the Office of National Statistics. All those over 50,000 people were
categorised as large towns or small cities15, 151 in addition to the 50 analysed in
the study. ProMap was used to find the number of listed structures within 500m of
a central point.
The charts overleaf show the categorisation.
15 This is crude because the population of the administrative district that represents
the town/city is often not a good reflection of the population of its catchment area.

commercial uses of listed buildings in england final.docx/2018-11-16 11:55
COLLIERS INTERNATIONAL 48 of 52
Figure 39: England Large Towns and Cities by Category
Town/City Population Listed Buildings
in 500m
Heritage
Density
Category
1 Bath 90,000 550 High A5
2 Cambridge 113,000 363 High A5
3 Chester 80,000 470 High A5
4 Chichester 24,000 394 High A5
5 Gloucester 123,000 301 High A5
6 Hastings 86,000 353 High A5
7 Oxford 143,000 500 High A5
8 Salisbury 40,000 488 High A5
9 Worcester 94,000 309 High A5
10 Durham 43,000 300 Medium B5
11 Grimsby 88,000 158 Medium B5
12 Guildford 69,000 177 Medium B5
13 Hereford 56,000 263 Medium B5
14 Ipswich 139,000 266 Medium B5
15 Kings Lynn 43,000 240 Medium B5
16 Lichfield 31,000 212 Medium B5
17 Maidstone 90,000 183 Medium B5
18 Margate 58,000 194 Medium B5
19 Poole 145,000 162 Medium B5
20 Preston 184,000 180 Medium B5
21 Royal Leamington Spa 62,000 206 Medium B5
22 Warwick 280 Medium B5
23 Aldershot 58,000 15 Low C5
24 Ashford 59,000 95 Low C5
25 Aylesbury 69,000 146 Low C5
26 Barnsley 72,000 45 Low C5
27 Basildon 100,000 2 Low C5
28 Basingstoke 90,000 38 Low C5
29 Bedford 82,000 73 Low C5
30 Birkenhead 84,000 51 Low C5
31 Blackburn 105,000 34 Low C5
32 Blackpool 142,000 14 Low C5
33 Bognor Regis 62,000 24 Low C5
34 Bootle 59,000 2 Low C5
35 Bournemouth 168,000 46 Low C5
36 Bracknell 71,000 8 Low C5
37 Bromley 309,000 20 Low C5
38 Burnley 73,000 64 Low C5
39 Bury 61,000 30 Low C5
40 Cannock 65,000 13 Low C5
41 Chatham 73,000 19 Low C5
42 Chelmsford 100,000 72 Low C5
43 Chesterfield 70,000 99 Low C5

commercial uses of listed buildings in england final.docx/2018-11-16 11:55
COLLIERS INTERNATIONAL 49 of 52
Figure 40: UK Large Towns and Cities by Category
Town/City Population Listed Buildings
in 500m
Heritage
Density
Category
44 Clacton-on-Sea 51,000 4 Low C5
45 Coventry 303,000 74 Low C5
46 Crawley 101,000 17 Low C5
47 Crewe 68,000 15 Low C5
48 Crosby 52,000 52 Low C5
49 Darlington 86,000 116 Low C5
50 Dartford 57,000 37 Low C5
51 Dewsbury 54,000 49 Low C5
52 Dover 28,000 63 Low C5
53 Dudley 195,000 72 Low C5
54 Dunstable 51,000 56 Low C5
55 Eastbourne 107,000 29 Low C5
56 Eastleigh 53,000 2 Low C5
57 Ellesmere Port 66,000 1 Low C5
58 Fareham 56,000 113 Low C5
59 Farnborough 57,000 3 Low C5
60 Folkestone 45,000 67 Low C5
61 Gateshead 78,000 24 Low C5
62 Gosport 69,000 39 Low C5
63 Gravesend 53,000 84 Low C5
64 Grays 64,000 7 Low C5
65 Great Yarmouth 58,000 142 Low C5
66 Halesowen 55,000 14 Low C5
67 Halifax 84,000 93 Low C5
68 Harlow 88,000 3 Low C5
69 Harrogate 72,000 51 Low C5
70 Hartlepool 86,000 29 Low C5
71 Hemel Hempstead 83,000 64 Low C5
72 High Wycombe 77,000 73 Low C5
73 Hove 72,000 75 Low C5
74 Kettering 51,000 27 Low C5
75 Kidderminster 55,000 53 Low C5
76 Kingston upon Thames 160,000 53 Low C5
77 Littlehampton 56,000 34 Low C5
78 Liverpool 469,000 139 Low C5
79 Loughborough 55,000 21 Low C5
80 Lowestoft 68,000 13 Low C5
81 Luton 186,000 52 Low C5
82 Macclesfield 51,000 102 Low C5
83 Maidenhead 59,000 12 Low C5
84 Mansfield 70,000 93 Low C5
85 Middlesborough 143,000 38 Low C5
86 Milton Keynes 185,000 1 Low C5
87 Newcastle-under-Lyme 74,000 54 Low C5

commercial uses of listed buildings in england final.docx/2018-11-16 11:55
COLLIERS INTERNATIONAL 50 of 52
Figure 41: UK Large Towns and Cities by Category
Town/City Population Listed Buildings
in 500m
Heritage
Density
Category
88 Nuneaton 71,000 12 Low C5
89 Oldham 104,000 27 Low C5
90 Peterborough 136,000 105 Low C5
91 Plymouth 244,000 138 Low C5
92 Portsmouth 187,000 105 Low C5
93 Reading 233,000 133 Low C5
94 Redditch 75,000 12 Low C5
95 Rochdale 96,000 34 Low C5
96 Rotherham 117,000 23 Low C5
97 Royal Tunbridge Wells 60,000 143 Low C5
98 Rugby 62,000 82 Low C5
99 Runcorn 60,000 12 Low C5
100 Scarborough 50,000 105 Low C5
101 Scunthorpe 73,000 1 Low C5
102 Slough 126,000 10 Low C5
103 Solihull 95,000 28 Low C5
104 South Shields 83,000 39 Low C5
105 Southampton 234,000 92 Low C5
106 Southend-on-Sea 160,000 4 Low C5
107 Southport 94,000 78 Low C5
108 St Helens 103,000 10 Low C5
109 Stafford 64,000 87 Low C5
110 Stevenage 81,000 3 Low C5
111 Stockport 136,000 63 Low C5
112 Stockton-on-Tees 80,000 85 Low C5
113 Stoke-on-Trent (Hanley) 259,000 13 Low C5
114 Stroud 23,000 140 Low C5
115 Sunderland 178,000 83 Low C5
116 Sutton Coldfield 105,000 34 Low C5
117 Swindon 155,000 59 Low C5
118 Tamworth 72,000 9 Low C5
119 Telford 138,000 0 Low C5
120 Torquay 64,000 98 Low C5
121 Wakefield 77,000 97 Low C5
122 Walford 121,000 34 Low C5
123 Wallasey 59,000 3 Low C5
124 Walsall 171,000 40 Low C5
125 Warrington 81,000 73 Low C5
126 Washington 53,000 9 Low C5
127 Waterlooville 64,000 2 Low C5
128 West Bromwich 137,000 12 Low C5
129 Weston-super-Mare 78,000 15 Low C5
130 Widnes 56,000 3 Low C5
131 Wigan 81,000 72 Low C5
132 Woking 101,000 2 Low C5
133 Wolverhampton 251,000 102 Low C5
134 Worthing 97,000 82 Low C5

commercial uses of listed buildings in england final.docx/2018-11-16 11:55
COLLIERS INTERNATIONAL 51 of 52
TOWNS
940 places in England are categorised as towns16. About 140 of them are included
in the large towns category.
It has been assumed that there are 800 in total over and above those in the 55
analysed in the study, that 10% (80) have high heritage density, 25% (200) have
medium heritage density and the remainder (520) have low density.
16 Historically, towns were any settlement with a charter, including market towns and
ancient boroughs. The process of incorporation was reformed in 1835 and many more places received borough charters, whilst others were lost. All existing boroughs were abolished on 1 April 1974 and borough status was reformed as a civic honour
for local government districts. Since 1 April 1974 any parish council in England has the right to resolve to call itself a town and several communities have taken up this right, including areas that preserved continuity with charter trustees.

CONTACT DETAILS
Tel: (020) 7935 4499
Dir: (020) 7344 6582
Colliers International
Destination Consulting
9 Marylebone Lane
London W1U 1HL
All information, analysis and recommendations made for clients by Colliers International are made in good faith and represent
Colliers International’s professional judgement on the basis of information obtained from the client and elsewhere during the course
of the assignment. However, since the achievement of recommendations, forecasts and valuations depends on factors outside
Colliers International’s control, no statement made by Colliers International may be deemed in any circumstances to be a
representation, undertaking or warranty, and Colliers International cannot accept any liability should such statements prove to be
inaccurate or based on incorrect premises. In particular, and without limiting the generality of the foregoing, any projections, financial
and otherwise, in this report are intended only to illustrate particular points of argument and do not constitute forecasts of actual
performance.
Colliers International is the licensed trading name of Colliers International Property Consultants Limited.
Company registered in England & Wales no. 7996509. Registered office: 9 Marylebone Lane, London W1U 1HL. www.colliers.com/uk