![[Challenge:Future] Join Us for The Future Ride](https://static.fdocuments.us/doc/165x107/58f0907e1a28abbc638b45bb/challengefuture-join-us-for-the-future-ride.jpg)
COME ALONG FOR THE RIDE! THE 2015 US MEDIA LANDSCAPE · COME ALONG FOR THE RIDE! THE 2015 US MEDIA...
19
Brian Fuhrer SVP – Product Leadership January 20, 2015 COME ALONG FOR THE RIDE! THE 2015 US MEDIA LANDSCAPE
-
Upload
truongtruc -
Category
Documents
-
view
217 -
download
4
Transcript of COME ALONG FOR THE RIDE! THE 2015 US MEDIA LANDSCAPE · COME ALONG FOR THE RIDE! THE 2015 US MEDIA...

Brian Fuhrer
SVP – Product Leadership
January 20, 2015
COME ALONG FOR THE RIDE! THE 2015 US MEDIA LANDSCAPE

Co
py
rig
ht
©2
01
4 T
he
Nie
lse
n C
om
pa
ny
. C
on
fid
en
tia
l a
nd
pro
pri
eta
ry.
2
Thank you Finland!
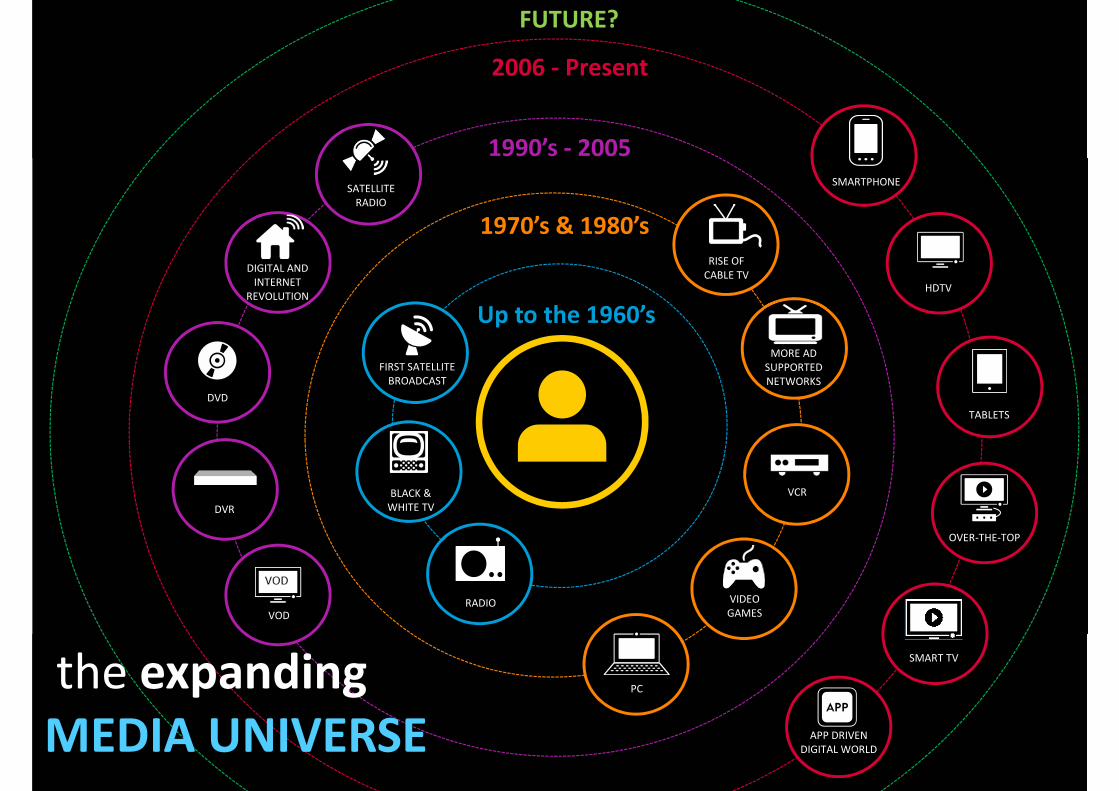
Up to the 1960’s
FIRST SATELLITE
BROADCAST
BLACK &
WHITE TV
1970’s & 1980’s
RISE OF
CABLE TV
MORE AD
SUPPORTED
NETWORKS
VCR
VIDEO
GAMES
1990’s - 2005
2006 - Present
DIGITAL AND
INTERNET
REVOLUTION
DVD
DVR
VOD
SMARTPHONE
HDTV
TABLETS
OVER-THE-TOP
SMART TV
APP DRIVEN
DIGITAL WORLD
the expanding
MEDIA UNIVERSE
FUTURE?
RADIO
SATELLITE
RADIO
PC

Co
py
rig
ht
©2
01
4 T
he
Nie
lse
n C
om
pa
ny
. C
on
fid
en
tia
l a
nd
pro
pri
eta
ry.
4

Co
py
rig
ht
©2
01
4 T
he
Nie
lse
n C
om
pa
ny
. C
on
fid
en
tia
l a
nd
pro
pri
eta
ry.
5
DISTRIBUTION SHIFTING FROM WIRED CABLEPercent of Total US
Source: Nielsen NPM, data from the 15th of each month, based on scaled installed counts.
Percent of Total US is based on a sum of the four breaks listed and is slightly higher than total Composite households.
Broadband Only Households broken out from the ADS bucket
9,2 9,4 10,1 10,6
52,4 50,2 47,4 45,2
7,6 9,0 10,8 11,5
30,9 31,3 30,4 30,1
1,2 2,7
Nov '11 Nov '12 Nov '13 Nov '14
Broadband Only
ADS
Telco
Wired Cable
Broadcast Only

Co
py
rig
ht
©2
01
4 T
he
Nie
lse
n C
om
pa
ny
. C
on
fid
en
tia
l a
nd
pro
pri
eta
ry.
6
6,7%
10,9%11,8%
7,7%
3,7%
8,7%
21,1%
15,5%
9,9%
4,6%
Composite HOH <25 HOH 25-34 HOH 35-54 HOH 55+
HOUSEHOLDS WITH INTERNET AND NO CABLECord-nevers meet the cord-cutters?
Jan 2014
Jan 2015

Co
py
rig
ht
©2
01
4 T
he
Nie
lse
n C
om
pa
ny
. C
on
fid
en
tia
l a
nd
pro
pri
eta
ry.
7
HOUSEHOLDS WITH INTERNET AND NO CABLEA trending perspective…
4,5%
6,6% 6,5%
4,6%
3,4%
5,0%
9,2%
7,4%
5,2%
3,4%
5,4%
8,5% 8,6%
5,9%
3,4%
5,4%
8,9%8,4%
6,1%
3,3%
6,7%
10,9%
11,8%
7,7%
3,7%
8,7%
21,1%
15,5%
9,9%
4,6%
Composite HOH <25 HOH 25-34 HOH 35-54 HOH 55+
Jan-10 Jan-11 Jan-12 Jan-13 Jan-14 Jan-15

Co
py
rig
ht
©2
01
4 T
he
Nie
lse
n C
om
pa
ny
. C
on
fid
en
tia
l a
nd
pro
pri
eta
ry.
8
VIEWING ON THE TELEVISION SCREEN IS CHANGINGA look at traditional television viewing and total television screen time
All devices must be connected to the TV to be captured within HUT/PUT or Non HUT Sources
Non HUT Sources:
Unencoded content
being viewed on the TV
through these devices
would credit to these
sources
LIVE TV - Encoded Live TV content
originating from the TV set or any device
connected to the TV (DVD player, game
console, internet connected device, audio-
video), AOT, encoded Cross Platform VOD
TIME SHIFTED TV - DVR,
encoded Recently Telecast
VOD,DVD recorders, server
based DVR’s, services like Start
Over
INTERNET CONNECTED
DEVICES - OTT streaming
devices (Apple TV, Roku,
Google Chromecast, etc.) or
Smartphone connected to
the TV
GAME CONSOLES -
Includes when a game
console is being used to
play a video game, watch a
movie, stream content,
etc.
DVD - Includes when
the device is being
used to playback a
DVD/Blu-Ray,
connected players
streaming content, etc.
AUDIO-VIDEO - Computers,
tablets, karaoke machines,
video camcorders,
security/digital
cameras connected to the TV
A/V

Co
py
rig
ht
©2
01
4 T
he
Nie
lse
n C
om
pa
ny
. C
on
fid
en
tia
l a
nd
pro
pri
eta
ry.
9
LOWER PUTS ACROSS DEMOGRAPHICSActual use of television glass to view Live or time-shifted content
HUT/PUT includes Live usage plus any playback viewing within the measurement period. Time-shifted TV is playback primarily on a DVR but includes playback from encoded Recently Telecast
VOD, DVD recorders, server based DVR’s and services like Start Over
Source: NPOWER, Dual Feed
Interval P2+ P2-11 P12-17 P18-34 P18-49 P25-54 P55+
09/23/2013 - 12/01/2013 20.5 14.5 12.1 15.9 18.0 20.1 28.7
09/22/2014 - 11/30/2014 19.5 13.2 10.9 14.0 16.6 19.1 28.4
Percent Change -5% -8% -9% -12% -8% -5% -1%
Composite, PUT Viewing Source
M-Su 6AM-6AM

Co
py
rig
ht
©2
01
4 T
he
Nie
lse
n C
om
pa
ny
. C
on
fid
en
tia
l a
nd
pro
pri
eta
ry.
10
TOTAL USE ON TV SCREEN BRIDGES GAP WITH TV…but still lower across demographics
Source: NPOWER, Dual Feed, Total Use of TV includes time spent using non-Hut devices connected to the television set (DVD, Game Consoles, Over the top devices, etc…)
Composite, PUT Viewing Source
M-Su 6AM-6AM
Interval P2+ P2-11 P12-17 P18-34 P18-49 P25-54 P55+
09/23/2013 - 12/01/2013 22.4 17.4 14.9 19.0 20.4 22.1 29.3
09/22/2014 - 11/30/2014 21.7 16.4 14.1 17.6 19.4 21.3 29.2
Percent Change -3% -6% -6% -7% -5% -4% 0%

Co
py
rig
ht
©2
01
4 T
he
Nie
lse
n C
om
pa
ny
. C
on
fid
en
tia
l a
nd
pro
pri
eta
ry.
11
76%
40%
SVOD
TECHNOLOGY DELIVERING MORE OPTIONS
Source: NPOWER HHLD, Custom Data Smart TV - November 2014, Mobile Insights P13+ - October 2014
% Diff for SVOD based on January 2014
% diff
YOY
46%
0%
48%
+53%
14%+72%+19%
18%
+15% +64%
SMARTPHONES MULTIMEDIA DEVICES TABLETS
GAME CONSOLES SUBSCRIPTION VIDEO ON DEMAND ENABLED SMART TVS

Co
py
rig
ht
©2
01
4 T
he
Nie
lse
n C
om
pa
ny
. C
on
fid
en
tia
l a
nd
pro
pri
eta
ry.
12
SMART TV PENETRATIONEnabled Smart TV Continues to increase year over year
Source: Nielsen Custom Data HHLD
November 2013 November 2014
83% 9% 8% 78% 9% 14%

Co
py
rig
ht
©2
01
4 T
he
Nie
lse
n C
om
pa
ny
. C
on
fid
en
tia
l a
nd
pro
pri
eta
ry.
13
UPTICK FOR OVER-THE-TOP USE Traditional sources lower year over year
Source: Nielsen, NPOWER, HHLD, Prime, L+7
First 9 weeks of the Broadcast Season (2013 VS. 2014)
Persons 18-49 Persons 25-54
2013 2014 % Diff 2013 2014 % Diff
PUT Viewing Source 34.5 32.1 -7% 39.1 37.1 -5%
Premium Pay 1.2 1.0 -12% 1.4 1.2 -14%
AOT 1.8 1.8 1% 1.8 1.9 7%
Time-Shifting 5.3 5.4 2% 6.2 6.3 2%
DVD Playback 1.6 1.4 -11% 1.6 1.5 -9%
Video Game Console 2.4 2.6 9% 1.7 1.8 4%
Internet Connected
Devices0.5 1.0 121% 0.5 0.9 93%

Co
py
rig
ht
©2
01
4 T
he
Nie
lse
n C
om
pa
ny
. C
on
fid
en
tia
l a
nd
pro
pri
eta
ry.
14
MEDIA TIME INCREASINGLY FUELED BY DIGITALAverage Daily Time Spent (Hours)
Source: The Nielsen Cross-Platform Report Quarter 3 2014
0
1
2
3
4
6
7
8
2013 2014 2013 2014 2013 2014
p18-49 p25-54 p55+
TV Screen Digital Video
+53%+62%
+55%
-3% -2% 0%

Co
py
rig
ht
©2
01
4 T
he
Nie
lse
n C
om
pa
ny
. C
on
fid
en
tia
l a
nd
pro
pri
eta
ry.
15
YEAR OVER YEAR GROWTH OF SVOD SERVICESUS household penetration in December 2013 and December 2014
8,6%
4,9%
29,0%
13,3%
6,4%
36,2%
AmazonPrime HuluPlus Netflix

Co
py
rig
ht
©2
01
4 T
he
Nie
lse
n C
om
pa
ny
. C
on
fid
en
tia
l a
nd
pro
pri
eta
ry.
16
SUBSCRIPTION VIDEO ON DEMAND PENETRATIONHouseholds with access to Amazon Prime, HuluPlus, or Netflix video services
Source: Npower, NPM
Data Interval: 01/01/2015
41,1%
58,6% 56,5%50,9%
26,7%
Composite HOH <25 HOH 25-34 HOH 35-54 HOH 55+

Co
py
rig
ht
©2
01
2 T
he
Nie
lse
n C
om
pa
ny
. C
on
fid
en
tia
l a
nd
pro
pri
eta
ry.
17
KEYS DRIVERS FOR VIDEO CONSUMPTION
CONTENT ACCESSIBILITY INTERFACE SUCCESS

Co
py
rig
ht
©2
01
2 T
he
Nie
lse
n C
om
pa
ny
. C
on
fid
en
tia
l a
nd
pro
pri
eta
ry.
18
IN SUMMARY What does this change mean?
Live TV will exist as long as there are big events, live sports and news,
but for other types of programs, consumers are increasingly adopting
VOD platforms.
Mobile devices (smartphone and tablets) will play an increasing role
in video consumption, but will likely be complementary as opposed
to substitutive.
Subscription VOD will continue in popularity due to convenience
and ease of use, but ongoing sustainability will be dependent on
content acquisition, and bandwidth considerations.
Content owners will look more closely at distribution deals to
understand relationship and impact on traditional revenue models
given expansion and penetration implications.