Combustion Testing and Analysis of an Extreme-States ... · be used as the basis of an engine that...
24
Combustion Testing and Analysis of an Extreme-States Approach to Low-Irreversibility Engines Investigators Chris F. Edwards, Associate Professor, Mechanical Engineering; Matthew N. Svrcek, Greg Roberts, Sankaran Ramakrishnan, Graduate Researchers, Stanford University Abstract In this report we describe our continuing efforts to develop ultra-high efficiency chemical engines. This work is based on what we have termed the ‘extreme-states principle’—that reducing efficiency losses due to unrestrained combustion requires performing the reaction at the highest possible internal energy state. In the exploration of batch processes, we previously completed construction of a free- piston device capable of hosting combustion at volumetric compression ratios in excess of 100:1, with the goal of achieving 60% thermal efficiency. Our work for this past year has included the following: repetition of our initial series of combustion tests in order to confirm the high efficiency levels first reported (60% indicated), addition of a gas emissions measurement system for collection of NO, CO, and HC emissions, addition of an in-situ soot measurement system for particulates, and measurement of combustion efficiency and emissions with isooctane and diesel fuels under direct-injection conditions. The results of these tests showed that a direct injection strategy has NO emission much lower than had been anticipated, that combustion efficiency is not impeded by our rapid expansion (it exceeds 99% under most conditions), and that a direct injection strategy can be used as the basis of an engine that could meet U.S. Tier 3 stationary engine emissions standards. Our theoretical work focused on establishing optimal architectures for steady-flow (e.g. gas turbine) engines and extending prior results to engines that include regenerative energy transfers (both heat and work). The results of this work have shown how to extend the optimal architecture beyond a simple-cycle engine into regenerative cycles, and that in doing so, engines with efficiencies in the 50’s, 60’s, and even 70% can be realized. The key is to understand how to minimize irreversibility through identification of optimal architecture. Extreme Compression, Free-Piston Combustion This project has focused on demonstrating the feasibility of achieving simple-cycle engine efficiencies approaching 60%, by employing extremely high compression ratios, up to 100:1. In particular, a long-stroke, free-piston architecture is used to improve performance at the very high temperatures and pressures resulting from such high compression ratios. As part of our previous efforts in this area, a single-shot free-piston research device was constructed and tested. The ability to repeatably achieve compression ratios up to 100:1 was demonstrated. Previous research focused on characterizing the compression-expansion behavior of the free-piston, measuring the indicated efficiency of Diesel-style combustion at lean equivalence ratios, and optically studying the behavior of single-plume Diesel sprays at extreme compression ratios. See our previous GCEP reports for further details of these prior studies.
Transcript of Combustion Testing and Analysis of an Extreme-States ... · be used as the basis of an engine that...
Combustion Testing and Analysis of an Extreme-States Approach to Low-Irreversibility Engines
Investigators Chris F. Edwards, Associate Professor, Mechanical Engineering; Matthew N. Svrcek, Greg Roberts, Sankaran Ramakrishnan, Graduate Researchers, Stanford University Abstract
In this report we describe our continuing efforts to develop ultra-high efficiency chemical engines. This work is based on what we have termed the ‘extreme-states principle’—that reducing efficiency losses due to unrestrained combustion requires performing the reaction at the highest possible internal energy state.
In the exploration of batch processes, we previously completed construction of a free-piston device capable of hosting combustion at volumetric compression ratios in excess of 100:1, with the goal of achieving 60% thermal efficiency. Our work for this past year has included the following: repetition of our initial series of combustion tests in order to confirm the high efficiency levels first reported (60% indicated), addition of a gas emissions measurement system for collection of NO, CO, and HC emissions, addition of an in-situ soot measurement system for particulates, and measurement of combustion efficiency and emissions with isooctane and diesel fuels under direct-injection conditions. The results of these tests showed that a direct injection strategy has NO emission much lower than had been anticipated, that combustion efficiency is not impeded by our rapid expansion (it exceeds 99% under most conditions), and that a direct injection strategy can be used as the basis of an engine that could meet U.S. Tier 3 stationary engine emissions standards.
Our theoretical work focused on establishing optimal architectures for steady-flow (e.g. gas turbine) engines and extending prior results to engines that include regenerative energy transfers (both heat and work). The results of this work have shown how to extend the optimal architecture beyond a simple-cycle engine into regenerative cycles, and that in doing so, engines with efficiencies in the 50’s, 60’s, and even 70% can be realized. The key is to understand how to minimize irreversibility through identification of optimal architecture.
Extreme Compression, Free-Piston Combustion This project has focused on demonstrating the feasibility of achieving simple-cycle
engine efficiencies approaching 60%, by employing extremely high compression ratios, up to 100:1. In particular, a long-stroke, free-piston architecture is used to improve performance at the very high temperatures and pressures resulting from such high compression ratios. As part of our previous efforts in this area, a single-shot free-piston research device was constructed and tested. The ability to repeatably achieve compression ratios up to 100:1 was demonstrated. Previous research focused on characterizing the compression-expansion behavior of the free-piston, measuring the indicated efficiency of Diesel-style combustion at lean equivalence ratios, and optically studying the behavior of single-plume Diesel sprays at extreme compression ratios. See our previous GCEP reports for further details of these prior studies.
Recently, our research has focused on characterizing and developing the combustion process at extreme compression ratios. The single-plume Diesel spray study mentioned above was the first step in this process. More recent work has focused on adding the ability to measure both gaseous and particulate emissions from combustion at extreme compression ratios. This section of the report describes the experimental apparatus developed for these emissions measurements, as well as results for emissions from Diesel-style combustion.
Lean-Diesel Efficiency The implementation of emissions measurement (discussed below) revealed that the
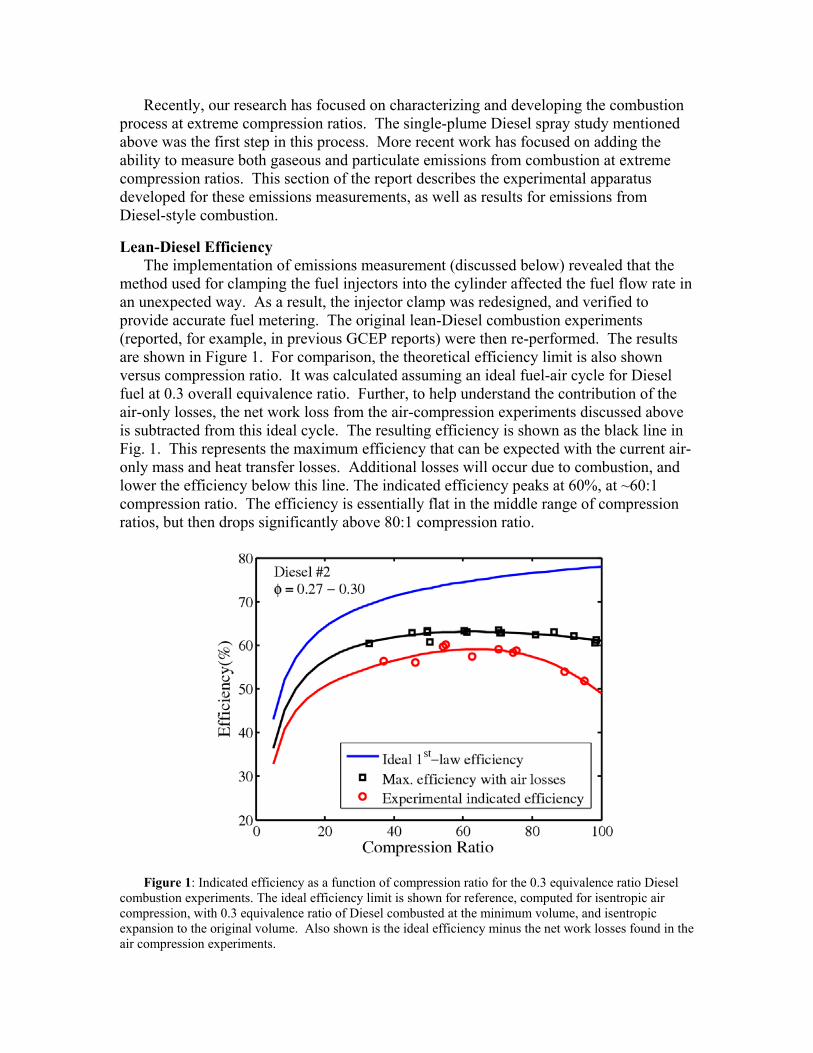
method used for clamping the fuel injectors into the cylinder affected the fuel flow rate in an unexpected way. As a result, the injector clamp was redesigned, and verified to provide accurate fuel metering. The original lean-Diesel combustion experiments (reported, for example, in previous GCEP reports) were then re-performed. The results are shown in Figure 1. For comparison, the theoretical efficiency limit is also shown versus compression ratio. It was calculated assuming an ideal fuel-air cycle for Diesel fuel at 0.3 overall equivalence ratio. Further, to help understand the contribution of the air-only losses, the net work loss from the air-compression experiments discussed above is subtracted from this ideal cycle. The resulting efficiency is shown as the black line in Fig. 1. This represents the maximum efficiency that can be expected with the current air-only mass and heat transfer losses. Additional losses will occur due to combustion, and lower the efficiency below this line. The indicated efficiency peaks at 60%, at ~60:1 compression ratio. The efficiency is essentially flat in the middle range of compression ratios, but then drops significantly above 80:1 compression ratio.
Figure 1: Indicated efficiency as a function of compression ratio for the 0.3 equivalence ratio Diesel
combustion experiments. The ideal efficiency limit is shown for reference, computed for isentropic air compression, with 0.3 equivalence ratio of Diesel combusted at the minimum volume, and isentropic expansion to the original volume. Also shown is the ideal efficiency minus the net work losses found in the air compression experiments.

Extreme-Compression Emissions Measurement The ability to measure NOx, CO, CO2, O2, hydrocarbons, and soot was added to the
extreme compression apparatus. For the first set of experiments with this new system, a combustion mode of direct injection near TDC at a modest compression ratio, CR ~35, was chosen. This is similar to a conventional Diesel engine. In this way a point of reference is obtained for an initial characterization of the emissions system, and of Diesel-style combustion in the free-piston engine. For these initial reference experiments, a single-component fuel was desirable for interpreting the emissions results—isooctane was chosen in this case. A few experiments with #2 Diesel injection at compression ratios up to 100:1 were also performed.
Gaseous Emissions Measurement Setup This section describes the development and operation of the system for measuring
gaseous exhaust species. An experiment in the extreme compression device consists of a single compression-combustion-expansion cycle, and the thermal mass of the cylinder walls is large relative to the energy in a single combustion event. As a result the cylinder walls naturally remain at room temperature, allowing water and heavy hydrocarbons in the combustion products to condense. For this reason, electrical-resistance band heaters were placed at six locations along the length of the cylinder, with a seventh, larger heater around the combustor. The heater locations are shown in Fig. 2. The heaters and cylinder are wrapped in foam insulation. The band heaters are held at a fixed temperature via thermocouples and feedback control.
Figure 2: Gas emissions measurement system schematic
The gas emissions measurement system is shown schematically in Fig. 2. Combustion products exit the combustor through the high-pressure exhaust valve in the base section (not shown in this diagram). Outside of the combustor, the exhaust sample line splits into two branches. One branch leads to the hydrocarbon analyzer and is heated to 110oC, in order to prevent condensation of water and/or hydrocarbon species in the sample line. In contrast, the other four gas analyzers require a dry sample (negligible water). Hence the second branch runs through a heat exchanger maintained near 0 ºC, forcing water to condense out of the exhaust sample. This line then leads into a Tedlar sample bag, in which the dry exhaust gases are collected. The hydrocarbon analyzer is a heated flame ionization detector (HFID) that measures the total concentration of carbon atoms in the sample. It is a stand-alone unit with an integrated sample pump. The NOx, CO, CO2, and O2 analyzers are part of a Horiba emissions bench, with a single sample pump feeding all four analyzers. The single-shot nature of these experiments precludes acquisition of separate NO and NOx measurements and so, only total NOx was measured for all experiments.
Measurement of gas emissions with the above system proceeds as follows: Prior to the experiment, the emissions analyzers are warmed up, and zeroed and spanned using the calibration gases. The valve to the combustor is closed, and a vacuum pump evacuates both sample lines as well as the sample bag. The experiment is then conducted and the piston stopped with the combustion products remaining in the cylinder. The vacuum pump is closed off from the sample lines, and the valve to the combustor is opened—filling the heated sample line for the HC analyzer. The piston is then driven down towards the bottom of the cylinder, pushing the exhaust products into the sample bag. Once filled, the sample bag is closed and disconnected, and then connected to the sample pump for the Horiba. At this point, the bag contains ~4 liters of dry sample, and the heated sample line contains ~0.5 liter of wet sample at atmospheric pressure. The sample pumps are activated, and the analog outputs of all analyzers are recorded.
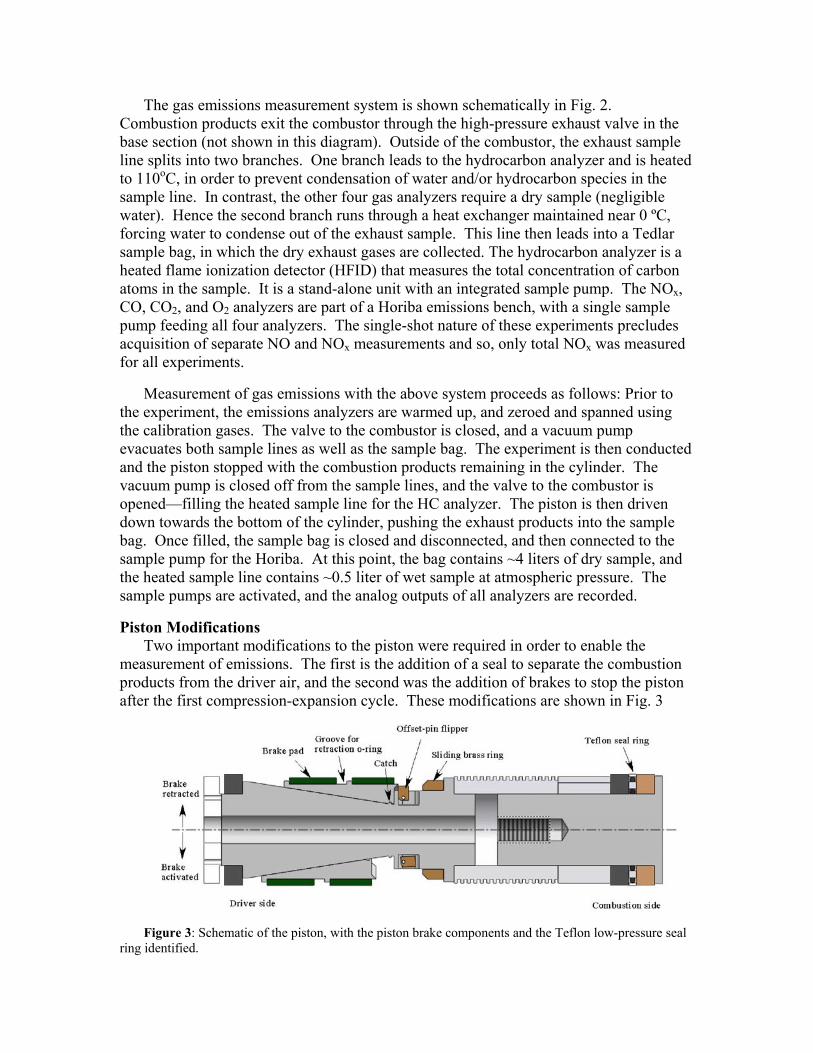
Piston Modifications Two important modifications to the piston were required in order to enable the
measurement of emissions. The first is the addition of a seal to separate the combustion products from the driver air, and the second was the addition of brakes to stop the piston after the first compression-expansion cycle. These modifications are shown in Fig. 3
Figure 3: Schematic of the piston, with the piston brake components and the Teflon low-pressure seal
ring identified.

As discussed in Chapter 2, the overall sealing strategy of the current piston design is one of clearance control. Rather than attempt a positive seal, a fixed solid ring provides a close fit to the cylinder in order to reduce, but not eliminate, gas blow-by. As a result, air from the driver side can flow past the piston into the combustor side whenever the driver side pressure is higher. In particular, after expansion and prior to exhaust extraction, this driver air can dilute the combustion products by an unknown amount, thus confounding the concentration measurements. Because the driver side pressure never exceeds 60 bar, a positive seal is only necessary below this pressure. This sidesteps the much more difficult problem of positive sealing at the very high peak combustor pressures. The resulting design is shown in Fig. 3, and consists of a Teflon ring energized by an elastomer o-ring. This ring setup was proven to provide a near-zero-leak seal at pressures up to 60 bar, to survive the piston velocity achieved during the run, and to allow accurate emissions measurements.
The necessity of the second modification, brakes to stop the piston, can be seen by looking at a sample combustor pressure trace from an experiment, shown on the left in Fig. 4. As initially designed, the piston undergoes several oscillations before coming to rest, reaching a significant fraction of the peak pressure on the second compression. The second stroke compresses the gas to high enough temperature that the combustion products from the first cycle are given a second opportunity to react. For example, CO can react with excess oxygen to produce CO2, and unburned hydrocarbons and soot particles can be oxidized.
Figure 4: Pressure as a function of time, with and without piston brake.
To solve this problem, a friction brake was designed to stop the piston at the end of the first expansion. The brake is shown in Fig. 3. The wedge-shaped brake shoes are initially held in a retracted position (not touching the cylinder wall), by an o-ring around the outside, and a catch on the inner side of the shoes. In Fig. 3 the upper shoe/pad assembly is shown in the retracted position, while the lower one is shown in the actuated position. During the first part of compression the piston acceleration is directed towards the front of the piston, and two offset-pin ‘flippers’ stop the brass ring from sliding into the brake shoes. For the last half of the compression and first half of the expansion, the acceleration points towards the back (driver side) of the piston, causing the flippers to
retract. Inertia keeps the shoes and brass ring retracted. On the last half of the expansion, acceleration reverses again, and the brass ring slides into the shoes and lifts them off of the catch, pushing them back and out. Finally, when the piston turns around at BDC, the velocity and acceleration align and the shoes wedge into the cylinder wall. The inner side of the shoes ride on a Teflon sheet, while the outer brake pad is made of a high-friction brake material—the friction differential pulls the pads further into the wall until the piston stops. A resulting pressure-time trace is given on the right in Fig. 4, showing that the brake successfully arrests the piston just after the first expansion. The brake can then be unlocked (post-firing) by removing pressure from the driver side of the piston. After unlocking, the pads remain retracted allowing the piston to be driven down the cylinder to expel the combustion products.
Soot Measurement In addition to the gas-phase species discussed in the earlier portion of this chapter,
hydrocarbon combustion can also produce solid-phase particulate matter. This particulate, commonly referred to as soot, presents a respiratory health hazard and is a regulated pollutant. Measuring particulate level is therefore an important aspect of determining the performance of the engine combustion process. This section describes the system developed for measuring particulate emissions.
The single-shot nature of the extreme compression device makes ex-situ measurement techniques unworkable, such as weighing of particulate trapped on filter paper, due to the small amount of soot produced in a single combustion event. For this reason, use of an in-cylinder technique capable of detecting soot from a single combustion event was necessary. One common method is to project light across the combustion chamber, and measure attenuation of the beam due to scattering and absorption by the soot particles. The implementation of such a system in the extreme compression device is shown in Fig. 5. The basic function is to project light across the diameter of the combustor and measure the intensity of the beam received on the other side. The implementation details arise from the following considerations: First, the combustor moves significantly during the experiment due to compression of the support structure. Optical fibers were thus necessary to couple the light source and detector to the combustion chamber. Aspherical lenses collimate the light exiting the transmitter fiber, and focus light into the core of the receiving fiber. A multi-mode fiber with a large core diameter and acceptance angle was necessary on the receiver side in order to reduce the effects of beam-steering due to density gradients in the chamber (beam-steering is discussed further below). However, multi-mode fibers suffer from mode dispersion when used with a coherent light source, which can cause the output to be affected by movement of the fiber. For this reason, a broadband light source was used, in particular, a tungsten lamp. The resulting system is unaffected by vibration of the combustor during the experiment. However, the use of a white light source introduces the possibility of undesirable cross-detection of NO2 by the soot system. NO2 has a significant absorption cross section in the visible and UV, for wavelengths shorter than 600 nm. To eliminate detection of NO2 a long-pass filter was added with a cut-on wavelength of 630 nm. The resulting sensitivity of the system to NO2was tested using 5000 ppm NO2 calibration gas---no discernable beam attenuation was measured. Sapphire windows provide the interface to the combustion chamber, as they are capable of withstanding the temperature and pressure within the combustor. The
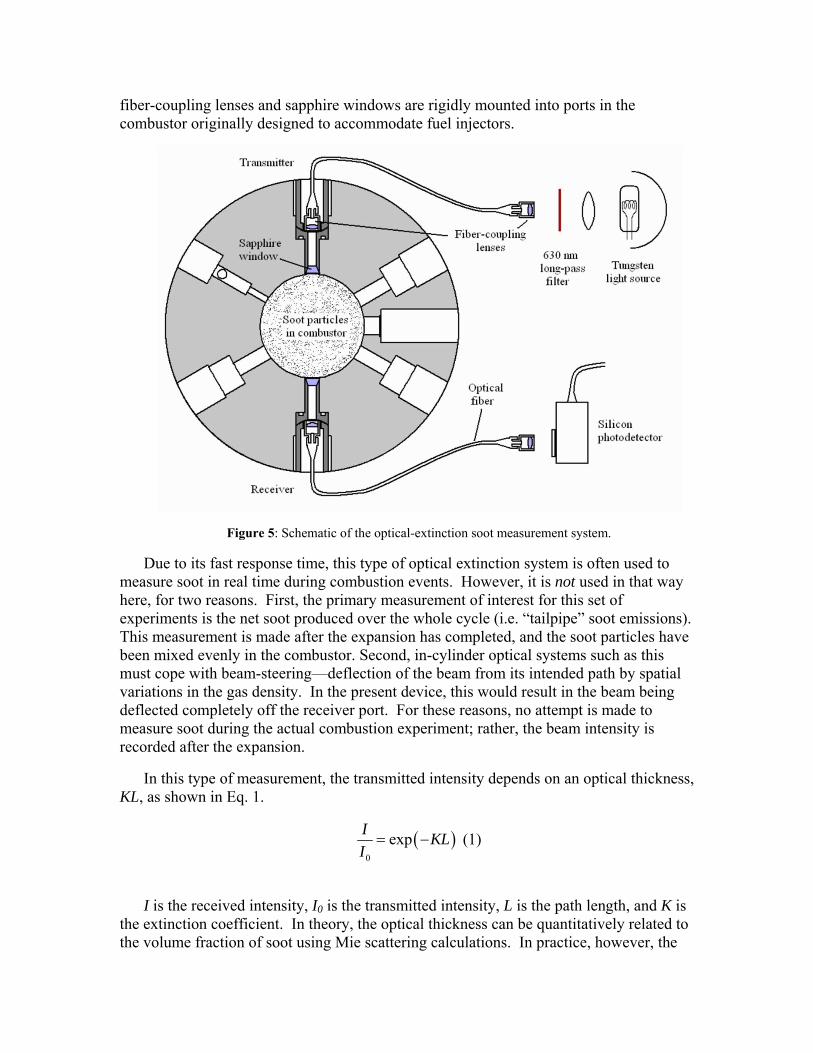
fiber-coupling lenses and sapphire windows are rigidly mounted into ports in the combustor originally designed to accommodate fuel injectors.
Figure 5: Schematic of the optical-extinction soot measurement system.
Due to its fast response time, this type of optical extinction system is often used to measure soot in real time during combustion events. However, it is not used in that way here, for two reasons. First, the primary measurement of interest for this set of experiments is the net soot produced over the whole cycle (i.e. “tailpipe” soot emissions). This measurement is made after the expansion has completed, and the soot particles have been mixed evenly in the combustor. Second, in-cylinder optical systems such as this must cope with beam-steering—deflection of the beam from its intended path by spatial variations in the gas density. In the present device, this would result in the beam being deflected completely off the receiver port. For these reasons, no attempt is made to measure soot during the actual combustion experiment; rather, the beam intensity is recorded after the expansion.
In this type of measurement, the transmitted intensity depends on an optical thickness, KL, as shown in Eq. 1.
( )0
expI KLI= − (1)
I is the received intensity, I0 is the transmitted intensity, L is the path length, and K is the extinction coefficient. In theory, the optical thickness can be quantitatively related to the volume fraction of soot using Mie scattering calculations. In practice, however, the
relationship between attenuation and volume fraction depends on specific qualities of the soot particles, such as size and morphology. No attempt is made to quantify particle geometry in the present study, which would reduce the confidence in an attempt to define a soot volume fraction from the extinction measurements. Instead, as discussed in a later section, a correlation between fuel carbon fraction in the gaseous exhaust and the extinction signal will be used to derive a measure of soot carbon mass. However, it is still of interest to perform a volume fraction calculation assuming typical values for soot properties from the literature. The volume fraction, fv, is calculated in this case with a broad-spectrum light source from the measured transmittance by solving Eq. 2
0,
0 0
( ) 6 ( , )exp dvII LE m fI I
λ λ π λ λλ
⎛ ⎞= −⎜ ⎟⎝ ⎠∫ (2)
The unattenuated, wavelength-dependent spectral intensity, 0, ( ),I λ λ is computed from the known spectral profiles of the light source, long-pass filter, fiber-optic components, and photodetector. ( , )E m λ is the wavelength-dependent soot absorption refractive index function. The unattenuated total intensity, I0, is the integral over all wavelengths of
0, ( )I λ λ The resulting soot volume fraction was converted to mass of soot using a typical value for soot density of 1.89 g/cm3. The soot mass computed in this way via volume fraction is compared to the soot carbon mass calculated from the carbon balance in the later discussion of the isooctane results, in particular in Fig. 6.
Isooctane Diesel-Style Combustion at 35:1 Compression Ratio A set of results was obtained with direct injection of iso-octane near TDC over a
range of equivalence ratios. A low compression ratio (for this device) of 35:1 was chosen, with the intention of obtaining conditions comparable to existing high-pressure Diesel engines. In this way, the results from this data set can help provide understanding that the emissions system is behaving as expected, as well as determine if there are any unexpected behaviors in the extreme compression apparatus—for example, as a result of having a free piston.
Use of a single-component fuel was desired to facilitate calculation of a carbon balance, as discussed below. Isooctane was chosen in this case. The injector setup consists of two diametrically-opposed injectors having seven holes each. The overall fuel-air equivalence ratio was varied from 0.38 to 0.77 by changing the duration of the single injection, from 2.28 ms to 4.39 ms. Injection timing was chosen to correspond to peak efficiency, with the start of injection varying from 1.4 ms to 2.2 ms before TDC, moving earlier with increasing injection duration.
Carbon Balance One goal of this data set was to determine the ability to accurately perform a carbon
balance. This is a comparison of the total carbon present in gaseous exhaust species—CO, CO2, and hydrocarbons—to the fuel carbon injected into the cylinder. Each of the two injectors was gravimetrically calibrated for isooctane. The calibration was performed for each of the injection durations used, with the injectors clamped in place in
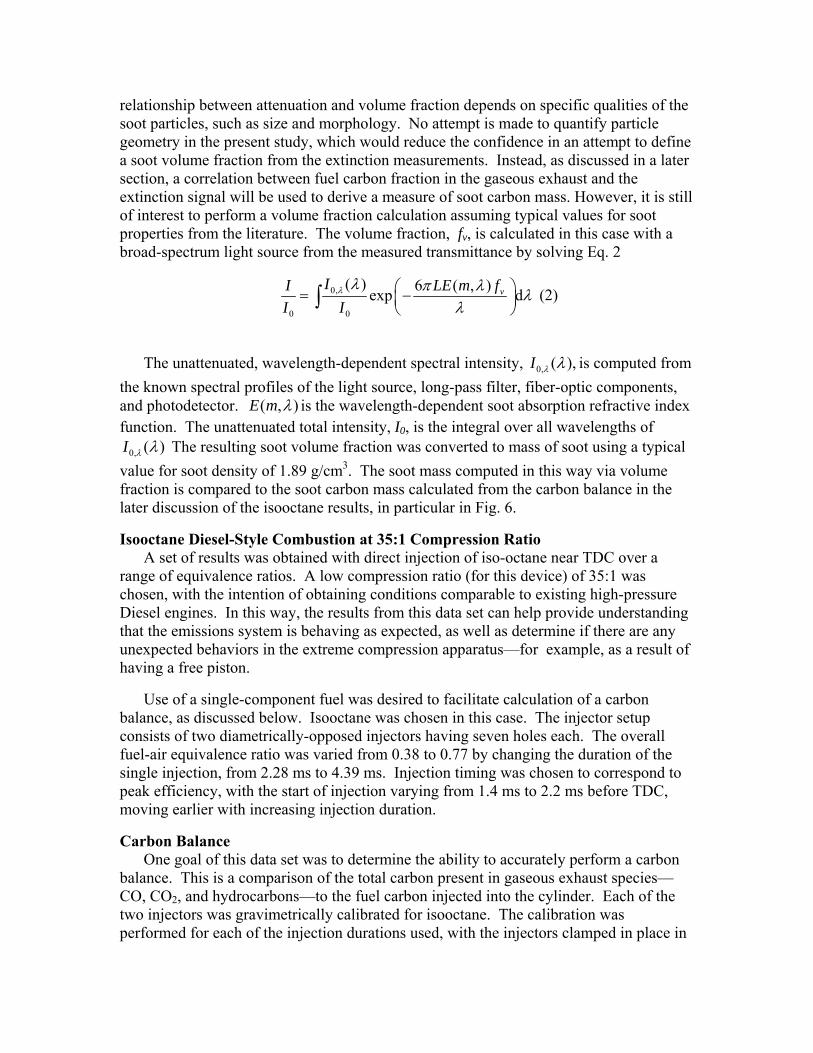
the combustor. In this way the total mass of fuel injected, and therefore total carbon, was known for each experiment. On the exhaust side, the analyzers measure concentrations of each species, and not amount directly. However, if the amount of air in the cylinder is also known, then the measured concentrations can easily be converted to total carbon. Note that as long as the combustion products are sufficiently well mixed, the carbon can be correctly determined even if only a portion of the exhaust gas is sampled. The initial air loading was determined via the ideal gas law by measuring the temperature of the gas in the steady-state heated cylinder, venting the cylinder to atmospheric pressure prior to the experiment, and using the known cylinder volume.
Figure 6: Exhaust carbon fraction as a function of overall equivalence ratio for isooctane-air
combustion.
Figure 6 shows the resulting carbon balance as a function of equivalence ratio. At the lower equivalence ratios the carbon is balanced within ± 1%. The close agreement found here provides further confidence in the single-shot emissions measurement system. At the highest equivalence ratio, the carbon mass measured in the gas phase drops significantly, as seen in Fig. 6. Especially given the accuracy of the balance at the lower equivalence ratios, the drop-off in mass at high equivalence ratio is likely due to carbon leaving the gas phase, i.e. condensing into solid-phase particulate. As will be seen in the soot discussion below, there is indeed a correlation between the soot signal and the carbon balance.
Soot Emissions Results The soot signal was recorded for each of the experiments using the method discussed
previously. In Fig. 7 the soot signal is related to the mass of carbon in soot using the carbon balance reported above. Due to the ability to determine the carbon balance within ~1%, it is possible to observe a correlation between carbon missing from the gas phase exhaust and the soot signal (left plot of Fig. 7). If the carbon missing from the gas phase is assumed to have all condensed into soot, then the slope of the linear fit shown in Fig. 7 provides a calibration of the soot signal in terms of the fraction of fuel carbon mass contained in soot. Note that using only the slope assumes that zero soot signal

corresponds to zero soot mass—this assumption was shown to be reasonable in the testing of the soot system discussed previously. The standard deviation for the slope of the linear regression is 15%, and the 95% confidence interval is ± 35% of the nominal slope. This gives an estimate of the uncertainty in the conversion from soot signal to soot carbon mass. To make the expected accuracy more explicit, error bars for the resulting soot carbon emissions are shown in the right plot in Fig. 7.
Figure 7: Left plot - Percent of fuel carbon missing from gas phase exhaust versus soot signal. Right
plot - Mass of carbon in soot per indicated net work output versus equivalence ratio. Soot mass calculated using the volume fraction method is shown for comparison.
The conversion enables reporting of the measured soot in terms of specific soot-carbon emissions (grams soot carbon/kiloWatt-hour indicated work). The results are shown in the right plot in Fig. 7. For comparison, soot specific emissions are also shown computed via the volume fraction method described earlier. To compare the soot-carbon emissions to total soot, an assumption must be made about the mass fraction of carbon in the soot. The soot carbon mass fraction can vary with combustion parameters, but is typically near 90%. Therefore the total specific soot emissions would be ~10% higher than the soot-carbon specific emissions plotted in Fig. 7. Note that this difference is smaller than the ± 35% accuracy of the soot signal to soot-carbon mass conversion.The soot mass calculated via the volume fraction is about 20% higher than the soot mass via carbon balance, assuming 90% carbon mass fraction. This is within the uncertainty range for the soot signal to soot-carbon conversion.
Gaseous Emissions Results Gaseous exhaust species, CO2, O2, CO, NOx, and unburned hydrocarbons (HC), were
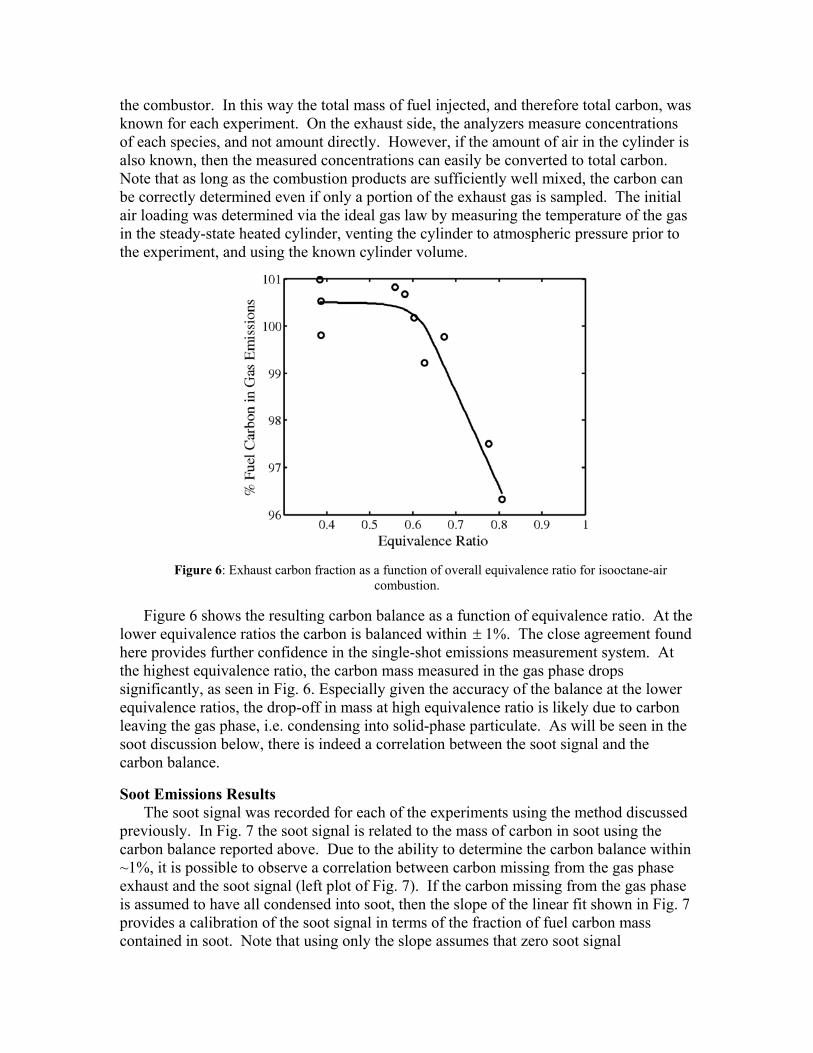
also measured for this set of experiments. The results are reported here as specific emissions—normalizing the mass of emissions by the work output of the engine, or as an emissions index—mass of species per mass of fuel. Measured emissions of NOx, CO, and HC are shown as specific emissions in Fig. 8. Because NO and NO2 were not measured separately, only total NOx an assumption must be made in converting measured NOx mole fraction to a mass basis. The results are reported here assuming all NO, i.e., the molar mass of the NOx is assumed to be 30 g/mol. The composition of unburned hydrocarbons must also be assumed since the FID only measures carbon atoms. For
these results, the hydrocarbons were assumed to have the same H/C ratio as the fuel (9/4 for isooctane).
Figure 8: Indicated-specific emissions of CO, NOx, and HC versus equivalence ratio.
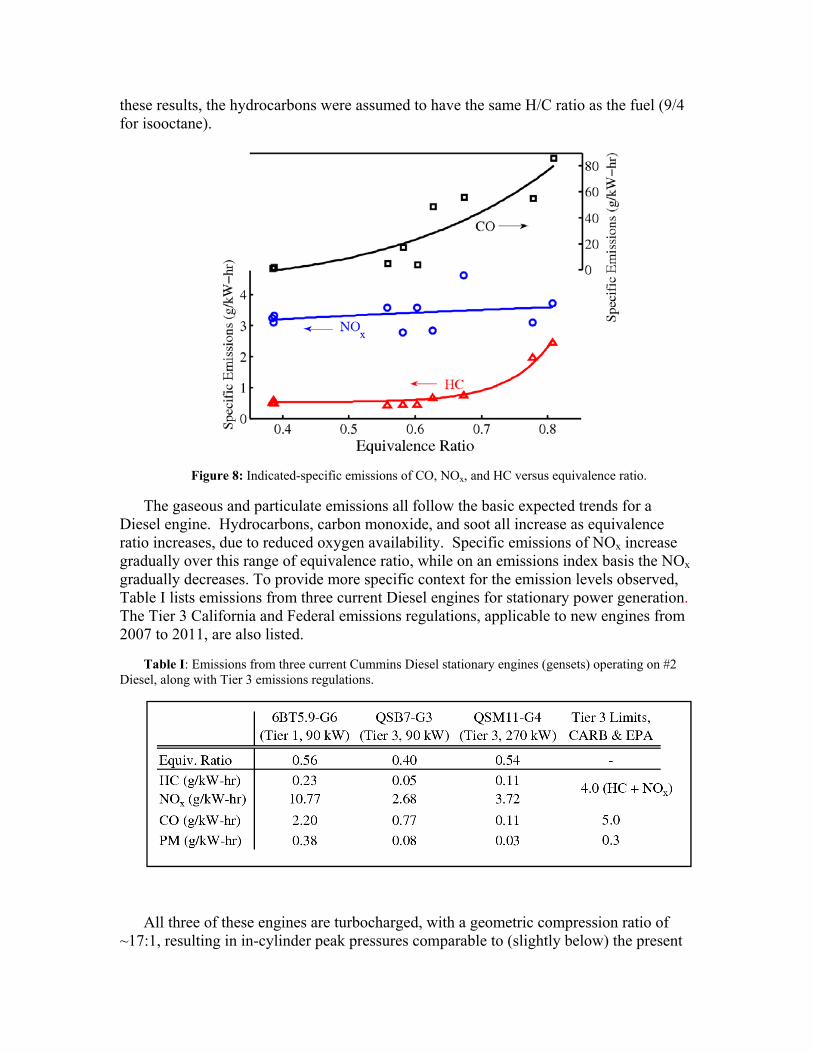
The gaseous and particulate emissions all follow the basic expected trends for a Diesel engine. Hydrocarbons, carbon monoxide, and soot all increase as equivalence ratio increases, due to reduced oxygen availability. Specific emissions of NOx increase gradually over this range of equivalence ratio, while on an emissions index basis the NOx gradually decreases. To provide more specific context for the emission levels observed, Table I lists emissions from three current Diesel engines for stationary power generation. The Tier 3 California and Federal emissions regulations, applicable to new engines from 2007 to 2011, are also listed.
Table I: Emissions from three current Cummins Diesel stationary engines (gensets) operating on #2 Diesel, along with Tier 3 emissions regulations.
All three of these engines are turbocharged, with a geometric compression ratio of ~17:1, resulting in in-cylinder peak pressures comparable to (slightly below) the present

experiments. The emissions levels reported in the table were measured at the rated load of the engines. To facilitate comparison to the present experimental results, the overall equivalence ratio for these engines was back-calculated from the manufacturer's specifications for air and fuel consumption rates at rated load.
At 0.4 equivalence ratio, the CO and HC emissions from isooctane combustion shown in Fig. 8 and the soot-carbon emissions shown in Fig. 7, are comparable to those of the Tier-3-rated engine that operates at 0.4 equivalence ratio. Note that as mentioned earlier, the total PM specific emissions would be about 10\% higher than the carbon-only PM emissions in Fig. 7. At 0.55 equivalence ratio, the CO, HC, and PM emissions from the present study, especially CO and PM, rise dramatically. They are significantly higher than the two gensets which operate at 0.55 equivalence ratio, including the engine rated only to Tier 1 standards. In contrast, the NOx emissions measured in this study are comparable to the conventional engines. This is especially interesting in comparison to the Tier-3-rated engines, that, unlike the extreme compression device, use exhaust gas recirculation (EGR) to reduce NOx emissions.
Three conclusions can be drawn from the above observations: First, it is clear that the Diesel-style combustion is not fully optimized in the extreme compression device. The HC, CO, and PM emissions rise to unacceptable levels at a lower equivalence ratio than for conventional engines. This is not unexpected, given that no optimization was performed for the combustion chamber geometry and injector spray pattern and location. Second, it appears there is a trade-off between oxidation and reduction in the current data. NOx emissions match the conventional engines, even given their use of EGR, while the CO, HC, and PM emissions are much higher. This suggests moving the injection timing earlier or introducing multiple injections—both strategies which would increase NOx but could decrease HC, CO, and PM. Finally, it is worth noting that even with a sub-optimal combustion process and without EGR, the engine would meet Tier 3 requirements if operated at 0.4 equivalence ratio. This is not an unreasonable operating condition, as demonstrated by the QSB7 engine in Table I. A conclusion that might be drawn from these observations is that, despite the differences in fuel, piston dynamics, and combustor geometry, the results at lean equivalence ratio appear to agree with prior conventional engine research in the literature.

Figure 9: Combustion efficiency as a function of equivalence ratio.
A final metric of interest is the combustion efficiency, a measure of what fraction of the fuel energy was converted to sensible energy during the combustion process. The combustion efficiency for these experiments is shown in Fig. 9 versus equivalence ratio. The drop in combustion efficiency as equivalence ratio increases is primarily driven by the increase in measured carbon monoxide (and hence hydrogen). The combustion efficiency is very high, around 99%, at equivalence ratio = 0.4, then drops as CO, HC, and soot increase with increasing equivalence ratio, such that at 0.8 around 15% of the fuel energy is not converted into sensible energy. Considered relative to conventional Diesel engines, this is a greater drop in combustion efficiency at the higher equivalence ratios than normal—to be expected given the dramatic increase in CO and HC discussed above for the emissions results.
High Compression Ratio Diesel Emissions In the initial lean-Diesel combustion tests in the extreme compression device, the
overall efficiency tracked the efficiency computed from the air-compression losses, but somewhat lower. With emission measurements in place, it is interesting to explore what role, if any, combustion efficiency has to play in this loss. The effect of extreme compression on NOx emissions is also of interest. To investigate this, a small number of experiments were performed at compression ratios up to 100:1 with #2 Diesel fuel. The equivalence ratio was 0.48 for these tests—comparable to the conventional stationary Diesel engines discussed in the previous section.
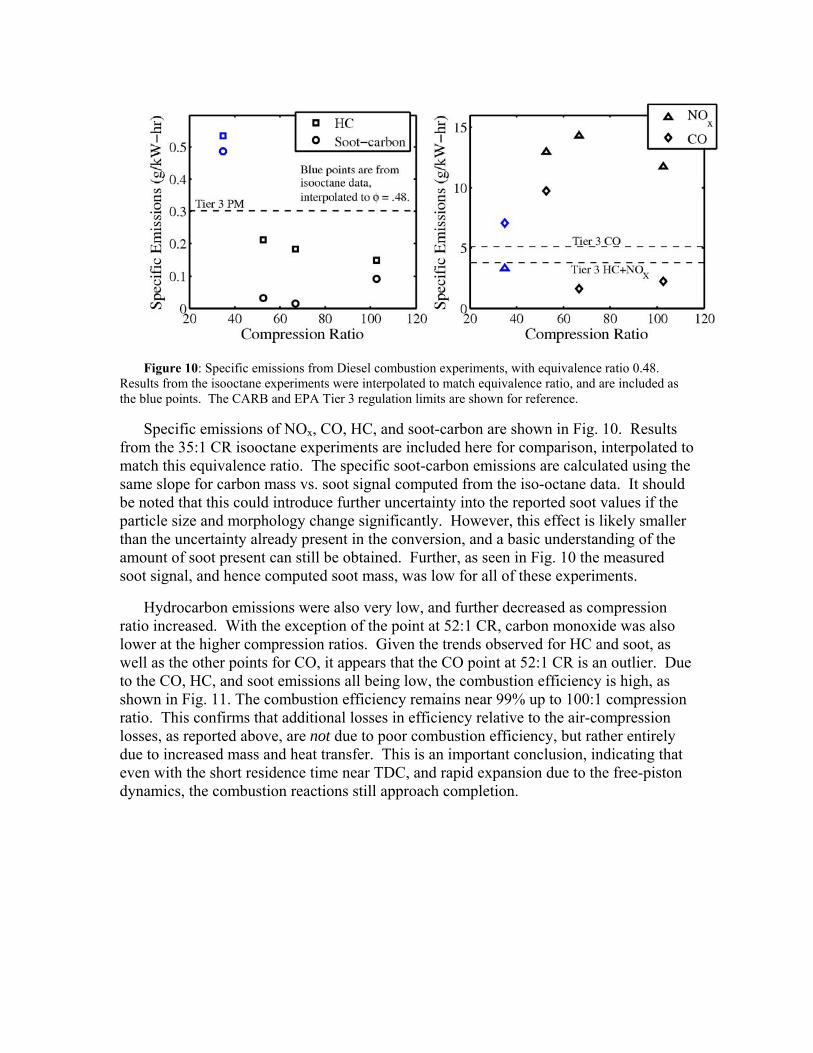
Figure 10: Specific emissions from Diesel combustion experiments, with equivalence ratio 0.48.
Results from the isooctane experiments were interpolated to match equivalence ratio, and are included as the blue points. The CARB and EPA Tier 3 regulation limits are shown for reference.
Specific emissions of NOx, CO, HC, and soot-carbon are shown in Fig. 10. Results from the 35:1 CR isooctane experiments are included here for comparison, interpolated to match this equivalence ratio. The specific soot-carbon emissions are calculated using the same slope for carbon mass vs. soot signal computed from the iso-octane data. It should be noted that this could introduce further uncertainty into the reported soot values if the particle size and morphology change significantly. However, this effect is likely smaller than the uncertainty already present in the conversion, and a basic understanding of the amount of soot present can still be obtained. Further, as seen in Fig. 10 the measured soot signal, and hence computed soot mass, was low for all of these experiments.
Hydrocarbon emissions were also very low, and further decreased as compression ratio increased. With the exception of the point at 52:1 CR, carbon monoxide was also lower at the higher compression ratios. Given the trends observed for HC and soot, as well as the other points for CO, it appears that the CO point at 52:1 CR is an outlier. Due to the CO, HC, and soot emissions all being low, the combustion efficiency is high, as shown in Fig. 11. The combustion efficiency remains near 99% up to 100:1 compression ratio. This confirms that additional losses in efficiency relative to the air-compression losses, as reported above, are not due to poor combustion efficiency, but rather entirely due to increased mass and heat transfer. This is an important conclusion, indicating that even with the short residence time near TDC, and rapid expansion due to the free-piston dynamics, the combustion reactions still approach completion.
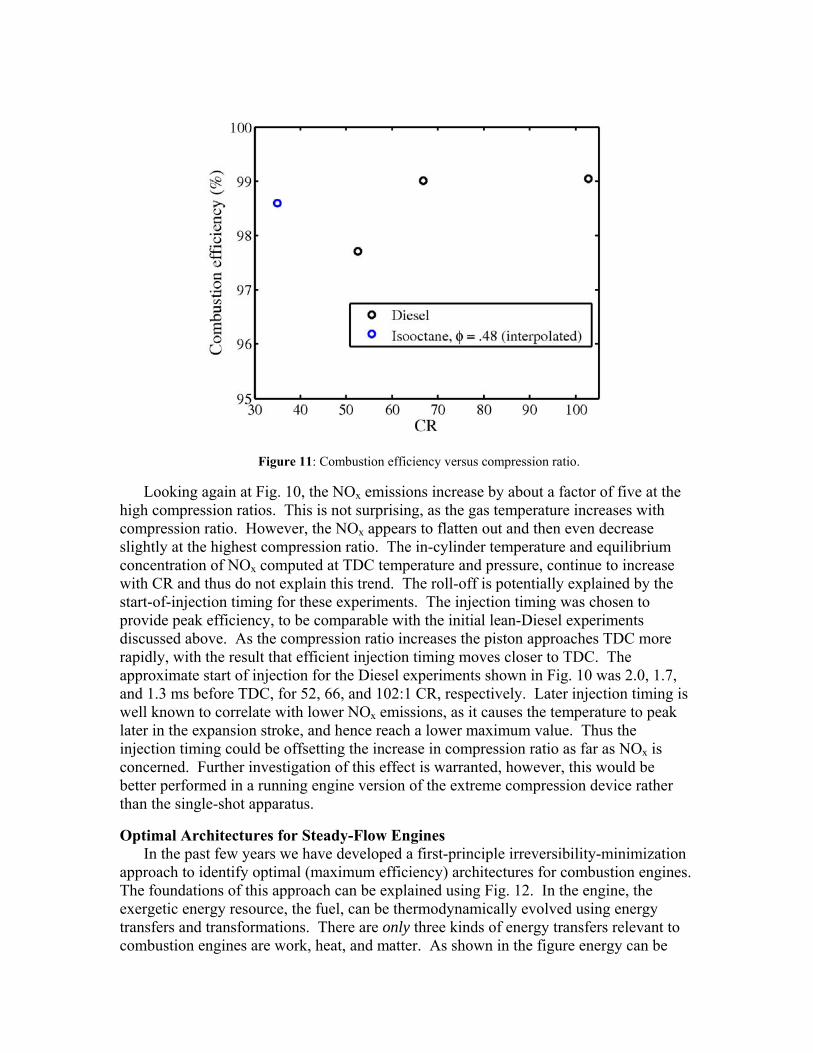
Figure 11: Combustion efficiency versus compression ratio.
Looking again at Fig. 10, the NOx emissions increase by about a factor of five at the high compression ratios. This is not surprising, as the gas temperature increases with compression ratio. However, the NOx appears to flatten out and then even decrease slightly at the highest compression ratio. The in-cylinder temperature and equilibrium concentration of NOx computed at TDC temperature and pressure, continue to increase with CR and thus do not explain this trend. The roll-off is potentially explained by the start-of-injection timing for these experiments. The injection timing was chosen to provide peak efficiency, to be comparable with the initial lean-Diesel experiments discussed above. As the compression ratio increases the piston approaches TDC more rapidly, with the result that efficient injection timing moves closer to TDC. The approximate start of injection for the Diesel experiments shown in Fig. 10 was 2.0, 1.7, and 1.3 ms before TDC, for 52, 66, and 102:1 CR, respectively. Later injection timing is well known to correlate with lower NOx emissions, as it causes the temperature to peak later in the expansion stroke, and hence reach a lower maximum value. Thus the injection timing could be offsetting the increase in compression ratio as far as NOx is concerned. Further investigation of this effect is warranted, however, this would be better performed in a running engine version of the extreme compression device rather than the single-shot apparatus.
Optimal Architectures for Steady-Flow Engines In the past few years we have developed a first-principle irreversibility-minimization
approach to identify optimal (maximum efficiency) architectures for combustion engines. The foundations of this approach can be explained using Fig. 12. In the engine, the exergetic energy resource, the fuel, can be thermodynamically evolved using energy transfers and transformations. There are only three kinds of energy transfers relevant to combustion engines are work, heat, and matter. As shown in the figure energy can be

transferred between the working fluid at two different locations in the engine (internal- regenerative transfer) or between the working fluid and the environment (external transfer). The energy transformations relevant to gas turbine engines are species mixing, chemical reaction, kinetic to sensible energy conversion and vice-versa, and kinetic energy dissipation.
Figure 12: Thermodynamic representation of a generic combustion engine
In performing these energy transfers and transformations irreversibility is incurred both inside (e.g., combustion irreversibility due to chemical reactions) and outside (e.g., exhaust exergy is destroyed in the environment) the engine. The main objective of this research is to provably establish the optimal sequence of these energy transfers and transformations that minimizes the total irreversibility—thereby defining the most efficient engine architecture. In doing so, hardware imperfections (e.g., heat-exchanger effectiveness, polytropic turbomachinery, etc.) and constraints (e.g., material temperature limits) are also considered. It must be noted that this approach is not a parametric optimization of an existing or newly conceived cycle. Instead, this approach is to establish the most efficient architecture starting with no assumptions, just the relevant physics.
Past Work: The Basis for Efforts in the Previous Year The final goal of this research is to optimize the generic engine shown in Fig. 12 with
all the permissible energy interactions. To achieve this we have taken a step-by-step approach in the past few years starting with an optimal control study to minimize only combustion irreversibility in piston engines [1]. This was followed by the development of optimal architectures for piston engines [2, 3], simple-cycle gas turbine engines, and propulsion engines [4]. Piston engines and simple-cycle gas turbine engines have internally regenerative work, but no regenerative heat and matter transfers.
The main roadblock to increasing efficiency of simple-cycle engines is considered to be the non-availability of materials that can withstand higher temperature. Regardless of the actual temperature limit value, the Brayton-cycle architecture that is assumed for simple-cycle engines is non-optimal. The optimal simple-cycle gas turbine architecture
was shown to be a ( )nCB TB T architecture, where the notations “C”, “B”, and “T” stand for a compressor, adiabatic burner, and turbine respectively. This device-based notation scheme to refer to engine architectures was developed by Horlock [5]. In this architecture the working fluid is compressed, a part of the fuel is mixed and combusted such that the temperature reaches the maximum permissible temperature (blade material limit), followed by an n-staged expansion-combustion process maintaining the temperature at the limit, and finally expanded in a turbine after complete combustion. The compression pressure ratio is much higher than that permitted by the Brayton architecture, but work extraction is used to prevent the temperature from exceeding the limit during combustion.
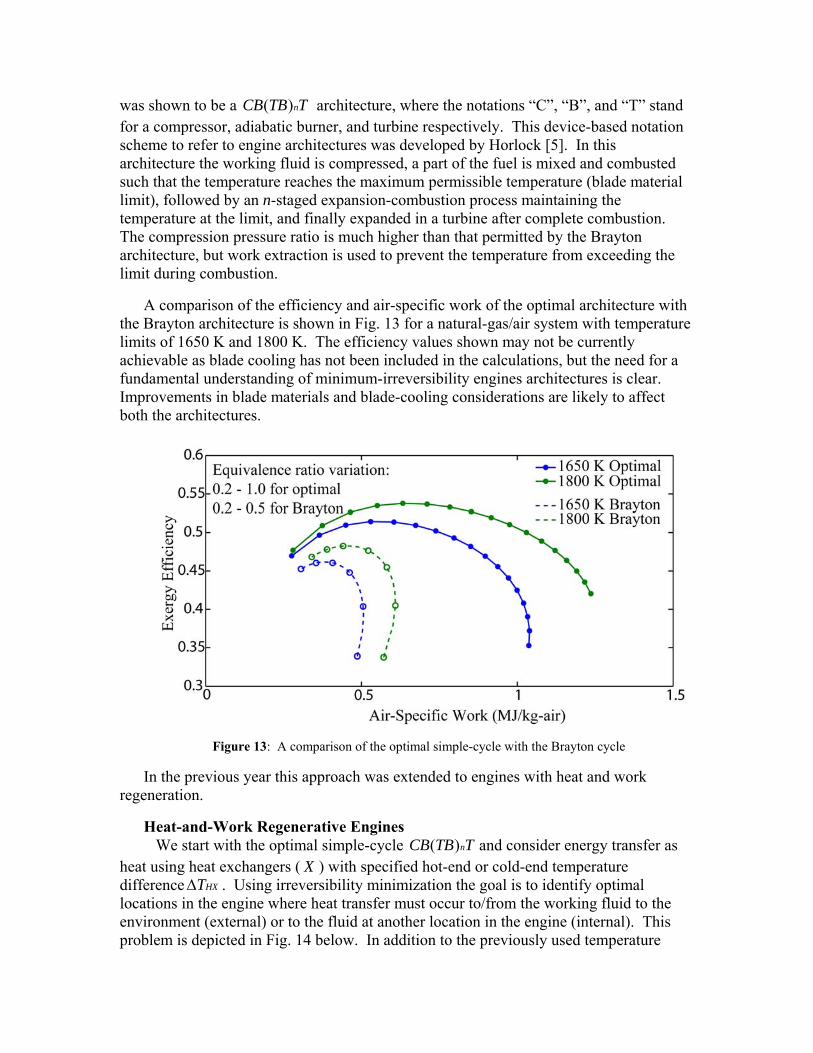
A comparison of the efficiency and air-specific work of the optimal architecture with the Brayton architecture is shown in Fig. 13 for a natural-gas/air system with temperature limits of 1650 K and 1800 K. The efficiency values shown may not be currently achievable as blade cooling has not been included in the calculations, but the need for a fundamental understanding of minimum-irreversibility engines architectures is clear. Improvements in blade materials and blade-cooling considerations are likely to affect both the architectures.
Figure 13: A comparison of the optimal simple-cycle with the Brayton cycle
In the previous year this approach was extended to engines with heat and work regeneration.
Heat-and-Work Regenerative Engines We start with the optimal simple-cycle ( )nCB TB T and consider energy transfer as
heat using heat exchangers ( X ) with specified hot-end or cold-end temperature difference HXTΔ . Using irreversibility minimization the goal is to identify optimal locations in the engine where heat transfer must occur to/from the working fluid to the environment (external) or to the fluid at another location in the engine (internal). This problem is depicted in Fig. 14 below. In addition to the previously used temperature
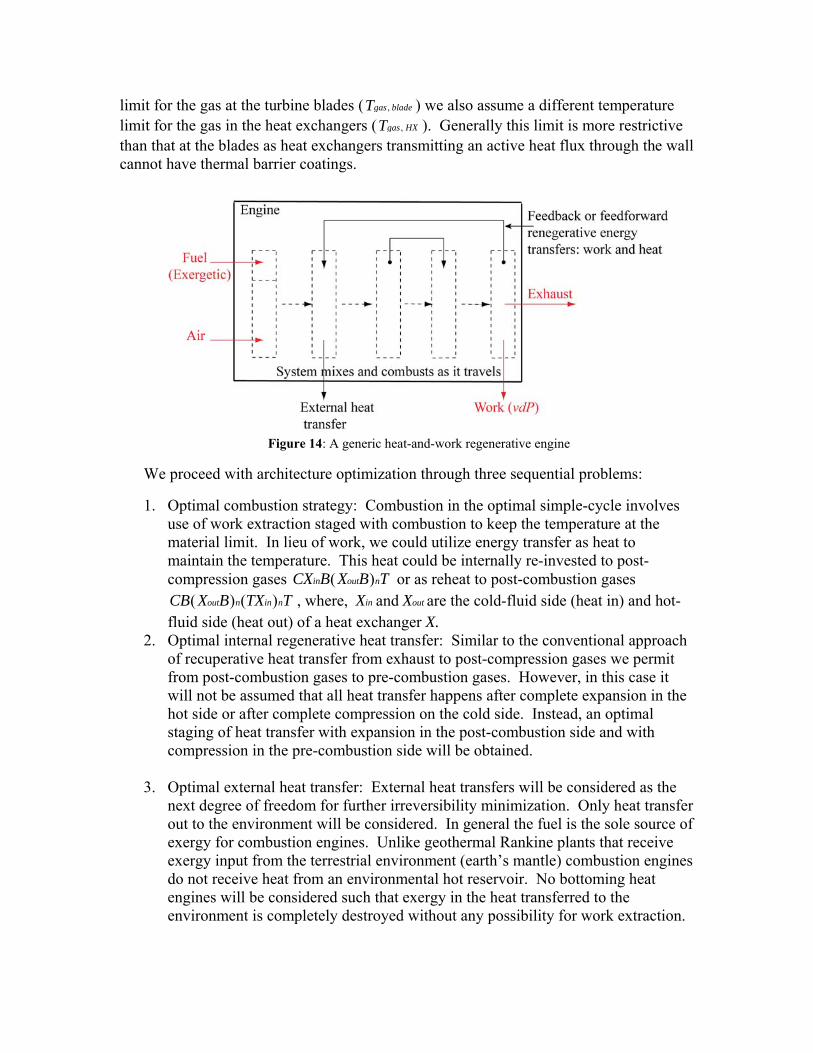
limit for the gas at the turbine blades ( ,gas bladeT ) we also assume a different temperature limit for the gas in the heat exchangers ( ,gas HXT ). Generally this limit is more restrictive than that at the blades as heat exchangers transmitting an active heat flux through the wall cannot have thermal barrier coatings.
Figure 14: A generic heat-and-work regenerative engine
We proceed with architecture optimization through three sequential problems:
1. Optimal combustion strategy: Combustion in the optimal simple-cycle involves use of work extraction staged with combustion to keep the temperature at the material limit. In lieu of work, we could utilize energy transfer as heat to maintain the temperature. This heat could be internally re-invested to post-compression gases ( )in out nCX B X B T or as reheat to post-combustion gases
( ) ( )out n in nCB X B TX T , where, inX and outX are the cold-fluid side (heat in) and hot-fluid side (heat out) of a heat exchanger X.
2. Optimal internal regenerative heat transfer: Similar to the conventional approach of recuperative heat transfer from exhaust to post-compression gases we permit from post-combustion gases to pre-combustion gases. However, in this case it will not be assumed that all heat transfer happens after complete expansion in the hot side or after complete compression on the cold side. Instead, an optimal staging of heat transfer with expansion in the post-combustion side and with compression in the pre-combustion side will be obtained.
3. Optimal external heat transfer: External heat transfers will be considered as the
next degree of freedom for further irreversibility minimization. Only heat transfer out to the environment will be considered. In general the fuel is the sole source of exergy for combustion engines. Unlike geothermal Rankine plants that receive exergy input from the terrestrial environment (earth’s mantle) combustion engines do not receive heat from an environmental hot reservoir. No bottoming heat engines will be considered such that exergy in the heat transferred to the environment is completely destroyed without any possibility for work extraction.

Heat-engines will be considered in the future when matter transfers such as secondary working fluids (e.g., steam) will be considered.
In the following sections key results from these sequential problems will be presented with explanations.
Optimal Combustion Strategy
In the optimal simple-cycle, work extraction is used to maintain the temperature at its maximum value during combustion. Instead, heat can be transferred out during combustion to maintain constant temperature. This heat from the multi-staged combustor can be re-invested in the working fluid either at a pre-combustion or post-combustion location leading to two distinct architectures, ( )in out nCX B X B T and ( ) ( )out n in nCB X B TX T
In the former case, ( )in out nCX B X B T , the total irreversibility of the engine can be shown to be identical to a maximum efficiency Brayton cycle (post-combustion temperature (TIT) same as the ,gas bladeT ). Thus this strategy will provide the same efficiency as the most-efficient Brayton cycle. The optimal simple-cycle involving work-staged combustion has already been shown to have a greater efficiency than the maximum efficiency Brayton cycle. Therefore, this heat-transfer based strategy is non-optimal.
In the latter case, heat is transferred to the post-combustion gases as a reheat expansion, i.e., ( ) ( )out n in nCB X B TX T . It must be noted that the use of the word “reheat” is different from common practice. The practice of using multiple fuel-injection and combustion stages is usually termed as reheat. This proposed architecture has such a multi-staged combustion process ( )out nX B , but we use reheat here to refer to an additional multi-stage heat-exchange between the system in the burners to the system downstream between turbines ( )in nTX , and not the exothermicity of combustion. We understand that such an architecture is impractical for hardware implementation as the temperature of 1650 K or 1800 K in the combustor section is beyond the temperature limit for usual heat-exchange surfaces ( ,gas HXT is typically below 1200 K). However, in the interest of a systematic approach we must evaluate the theoretical performance of this combustion strategy.
It can be shown that for very effective heat-exchange this combustion strategy can be more efficient than the work-staged combustion. This comparison is shown in Fig. 15. The reheat-based combustion ( ) ( )out n in nCB X B TX T strategy is about 0.5% more efficient than work-staged combustion ( )nCB TB T for the natural-gas/air system chosen for the simulation if the temperature difference in the heat exchangers is maintained around 10 K. As mentioned above, this particular analysis has been performed in the interest of evaluating distinct architectures permissible by physics, and is unlikely to be of engineering interest. We therefore conclude that the optimal combustion strategy is the work-staged combustion as that in the simple-cycle.

Figure 15: Comparison of work-staged combustion with heat-staged combustion with reheat
of the post-combustion gases.
Optimal Regenerative Heat Transfer We have analyzed heat transfer fro m the reactive part of the engine architecture an d
concluded that any improvement in efficiency over a work-staged com bustion strategy is negligible. We now consider regenerative heat transfer from the post-combustion gases to pre-combustion gases for optimization. We will not assume that all of the heat transfer is performed after work extraction. Instead th e aim is an optim al evolution from a
( )nCB TB T architecture to a ...... ( )in in in n out out out outCX CX CX CB TB TX TX TX TX T , i.e., an optimal staging of heat exchan gers between the co mpressors and turbines such that total irreversibility is minimized.
Work-Heat Staging
The tem perature d ifference in heat exchange rs is both the driving factor for heat transfer as well as a source of irreversibility. In order to achieve adequate heat transfer in a finite-sized heat exch anger, a temperature mismatch HXTΔ is designed between the two streams at the hot-sid e or cold-s ide entry (the end where the hot fluid enters or the cold-fluid enters in a counter-flow heat exchanger) . This designed m ismatch is a m easure of the heat-exchanger effectiveness and is chos en on the basis of engineering constraints such as designed surface area, heat-transfer rate, etc., or on th e basis of capital cost. The irreversibility due to this temperature difference is unavoidable.
While the m ismatch is designated at one end, the tem perature difference increases
along the heat exchanger unless the heat capac ity of the two stream s is equal throughout the heat exchanger. In the case of a gas tu rbine engine, the pre-combustion stream to be heated is air (and unmixed fuel if fuel pre-heating is considered) and the post-combustion stream consists of combustion products. The heat capacities of these streams are likely to be different, causing an increase in tem perature difference between the streams from the chosen HXTΔ , and causing an increase in irreversib ility along the heat exchanger. This irreversibility can be minimized if the temperature change of the hi gh-capacity stream as it flows through the heat exchanger is increase d to m atch the tem perature change of the
low-capacity stream using work extraction or compression. This can be done if the heat exchange process is staged with work-extra ction stages (turbine) or work-investm ent stages (com pressors) su ch that temperatur e change of the high- temperature s tream (combustion products) or low-tem perature stre am (air) can be respectively m atched to that of its counterpart. Base d on this observation the architec ture can be reduced to one of the two following cases:
1. High-temperature stream has higher capacity: Work extraction must be performed
from the high-capacity stream between heat-exchanger stages to increase the change in temperature of the stream. By doing so that the temperature between the hot and cold-side stream entering the every heat exchanger stage remains at the designed HXTΔ . The cold post-compression stream can move directly through a contiguous heat-exchanger path. For an architecture with m stages of heat-transfer this can be depicted as , 1 , 2 ... ,( ) ( )in m n out out out out mC X B TB TX TX TX TX T .
2. Low-temperature stream has higher capacity: Work investment must be
performed between heat-exchanger stages to match its temperature change with that of the hot stream, while the hot post-combustion stream can move directly through a contiguous heat-exchanger path. For an architecture with m stages of heat-transfer this can be depicted as , 1 , 2 , 3 ,... ( ) ( )in in in in m n out mCX CX CX CX B TB T X T .
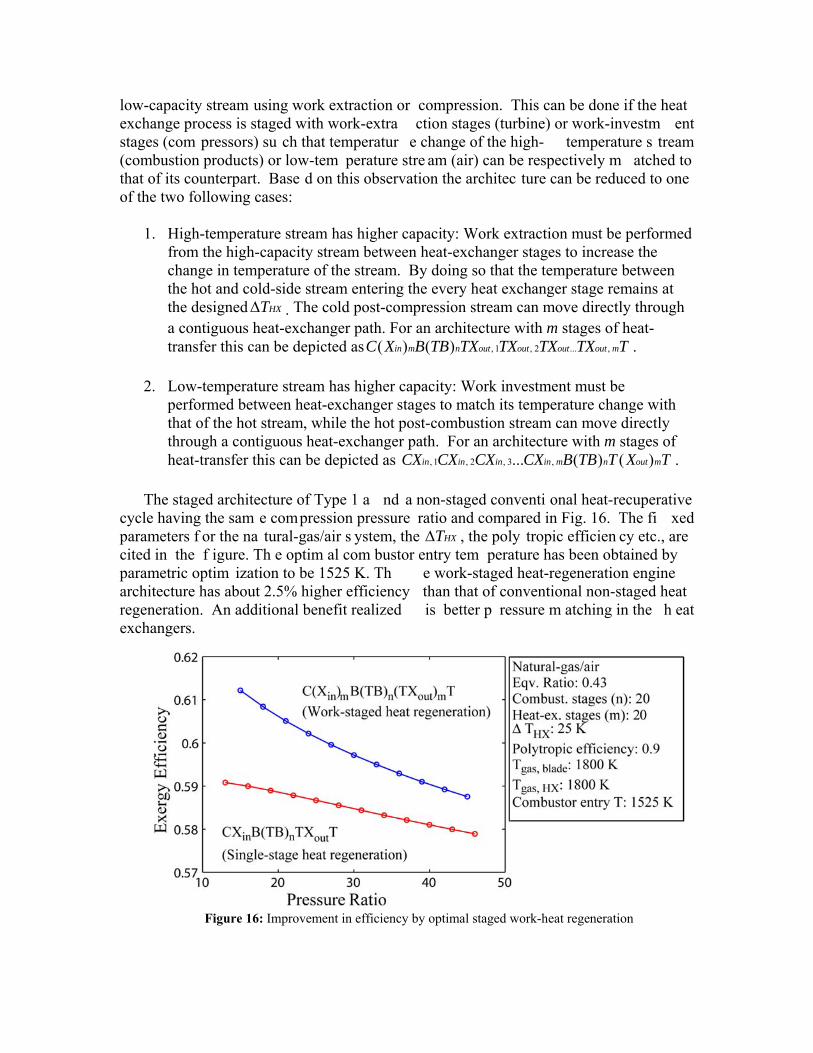
The staged architecture of Type 1 a nd a non-staged conventi onal heat-recuperative
cycle having the sam e compression pressure ratio and compared in Fig. 16. The fi xed parameters f or the na tural-gas/air s ystem, the HXTΔ , the poly tropic efficien cy etc., are cited in the f igure. Th e optim al com bustor entry tem perature has been obtained by parametric optim ization to be 1525 K. Th e work-staged heat-regeneration engine architecture has about 2.5% higher efficiency than that of conventional non-staged heat regeneration. An additional benefit realized is better p ressure m atching in the h eat exchangers.
Figure 16: Improvement in efficiency by optimal staged work-heat regeneration

Heat Exchanger Temperature Limit
The optimal pre-combustion temperature to which the system is preheated in the illustration above is 1525 K. The reason for such a high pre-combustion temperature is that combustion irreversibility is reduced when combustion is performed at high enthalpy states (extreme states principle explained in [2]). However, heat exchanger surfaces cannot survive such high temperatures and are limited to lower temperatures (~1100 K). In the previous section (and Fig. 16) we have not imposed this constraint; we have chosen a ,gas HXT of 1800 K. Now if the limit of 1100 K is imposed, post-compression heat transfer must cease at 1100 K. However, beyond 1100 K we still have compression work as an energy transfer to raise the enthalpy of the system to that corresponding to 1525 K. Compression after heating requires more work for the same increase in pressure and thus might appear to be non-optimal. However irreversibility minimization and the extreme-state principle suggest that this higher compression work would still result in an overall increase in efficiency. Therefore, the optimal architecture must be,
( ) ( ) ( ) High-temperature fluid has higher heat capacity
( ) ( ) ( ) Low-temperature fluid has higher heat capacityin m n out m
in m n out m
C X B TB TX TCX B TB T T
CC X
where, the additional post-heating compressor is shown in red. In the following figure we illustrate the work-staged architecture from Fig. 16, now having restricted heat-transfer to 1100 K with no compressor beyond that (dashed curve). Also illustrated is the above-mentioned architecture with the extra compressor taking the system to 1525 K from 1100 K (dotted curve). The original but non-permissible ( ,gas HXT = 1800 K) architecture from Fig. 16 (solid curve) is also shown.
Figure 17: The effect of heat-exchanger surface temperature limit and optimal architecture after
consideration of the limit. Restricting the heat transfer to 1100 K reduces the efficiency of the staged work-heat
regenerative engine by about 6%. However, the optimal architecture that involves compression after heating recovers a part of this lost efficiency to achieve an overall

optimal efficiency in this system of about 57%. This is about 3-4% higher than the optimal simple-cycle engine. The pressure ratio depicted in the figure is only that corresponding to the pre-heating compression. The overall pressure ratio for the optimal architecture with post-heating compression lies in the range 50:1 to 80:1
Optimal Heat-and-Work Regenerative Engine with External Heat Transfer
In this section we present the last aspect of heat-and-work regenerative engine optimization, i.e., optimization with external heat transfer to the environment. After permitting the external transfer, the optimal architecture from the preceding section remains the same except for the addition of intercooling during the initial compression process. The details of this result are not discussed here, but the efficiency-work carpet plot of the optimal architecture is shown in Fig. 18. The gas temperature limit at the blades is chosen as 1800 K and that at the heat exchanger walls as 1100 K. The curves for the optimal non-intercooled architecture, optimal simple-cycle architecture, and the Brayton-cycle architecture (green 1800 K curves in Fig. 13) are also shown.
Figure 18: Air specific work and efficiency for optimal simple and regenerative architectures
Conclusions and Future Work By a systematic irreversibility minimization approach, the optimal combustion engine
architecture involving internal and external, heat and work interactions has been identified. In the year ahead this approach will be extended to identify optimal engine architectures with regenerative matter transfers. Evaporative humidified cycles, carbon-dioxide moderated cycles, etc., are examples of steady-flow engine architectures with matter regeneration. Combined cycles also fall under the broad category of cycles involving external matter transfer in the form of a secondary working fluid from the environment (e.g., water for steam cycles).
References
1. Teh, K.-Y., Edwards, C. F., An optimal control approach to minimizing entropy generation in an adiabatic i nternal com bustion en gine, J ournal o f Dy namic Sy stems, M easurement an d C ontrol, Vol. 130, 2008.
2. Teh, K.-Y., Miller, S.L., and Edwards, C. F., Thermodynamic Requirements for Maximum IC Engine Cycle Efficiency (I): Optimal Combustion Strategy. International Journal of Engine Research 9:449-466 (2008).
3. Teh, K.-Y., Miller, S.L., and Edwards, C. F., Thermodynamic Requirements for Maximum IC Engine Cycle Efficiency (II): Work Extraction and Reactant Preparation Strategies. International Journal of Engine Research 9:467-481 (2008).
4. Ramakrishnan, S., Teh, K.-Y., and Edwards, C. F., Identification of optimal architecture for efficient simple-cycle gas turbine engines, ASME Conference Proceedings, 2009(43796), pp.539-548.
5. Horlock, J. H., 2003, Advanced Gas Turbine Cycles, Elsevier Science Ltd., Oxford, UK.
Publications 1. Svrcek, M.N., Exploration of Combustion Strategies for High-Efficiency, Extreme-Compression
Engines, Ph.D. dissertation, Dept. of Mech. Eng., Stanford Univ., Stanford, CA, 2011. 2. Svrcek, M.N., Miller, S.L., and Edwards, C. F., Diesel Spray Behavior at Compression Ratios up
to 100:1. Atomization and Sprays, volume 20, issue 5, pp. 453-465, 2010. 3. S.L. Miller, M.N. Svrcek, K.-Y. Teh and C.F. Edwards, Requirements for designing chemical
engines with reversible reactions, Energy,Volume 36, Issue 1, 2011, pp. 99-110 4. S. L. Miller, M. N. Svrcek, K.-Y. Teh, and C. F. Edwards, Assessing Feasibility of Increasing
Engine Efficiency through Extreme Compression, Submitted to IJER (2011) 5. Ramakrishnan, S., Teh, K.-Y., Miller, S. L., and Edwards, C. F., Optimal Architecture for
Efficient Simple-Cycle, Steady-Flow, Combustion Engines, Journal of Propulsion and Power, Accepted for publication (2011)
Contacts Christopher F. Edwards: [email protected] Matthew Svrcek: [email protected] Greg Roberts: [email protected] Sankaran Ramakrishnan: [email protected]