Combustion characteristics of water-insoluble elemental and
22
ACPD 5, 2247–2268, 2005 Combustion characteristics of water-insoluble elemental and organic carbon K. Wittmaack Title Page Abstract Introduction Conclusions References Tables Figures Back Close Full Screen / Esc Print Version Interactive Discussion EGU Atmos. Chem. Phys. Discuss., 5, 2247–2268, 2005 www.atmos-chem-phys.org/acpd/5/2247/ SRef-ID: 1680-7375/acpd/2005-5-2247 European Geosciences Union Atmospheric Chemistry and Physics Discussions Combustion characteristics of water-insoluble elemental and organic carbon in size selected ambient aerosol particles K. Wittmaack GSF – National Research Centre for Environment and Health, Institute of Radiation Protection 85758 Neuherberg, Germany Received: 1 March 2005 – Accepted: 6 March 2005 – Published: 13 April 2005 Correspondence to: K. Wittmaack ([email protected]) © 2005 Author(s). This work is licensed under a Creative Commons License. 2247
Transcript of Combustion characteristics of water-insoluble elemental and

ACPD5, 2247–2268, 2005
Combustioncharacteristics ofwater-insolubleelemental andorganic carbon
K. Wittmaack
Title Page
Abstract Introduction
Conclusions References
Tables Figures
J I
J I
Back Close
Full Screen / Esc
Print Version
Interactive Discussion
EGU
Atmos. Chem. Phys. Discuss., 5, 2247–2268, 2005www.atmos-chem-phys.org/acpd/5/2247/SRef-ID: 1680-7375/acpd/2005-5-2247European Geosciences Union
AtmosphericChemistry
and PhysicsDiscussions
Combustion characteristics ofwater-insoluble elemental and organiccarbon in size selected ambient aerosolparticlesK. Wittmaack
GSF – National Research Centre for Environment and Health, Institute of Radiation Protection85758 Neuherberg, Germany
Received: 1 March 2005 – Accepted: 6 March 2005 – Published: 13 April 2005
Correspondence to: K. Wittmaack ([email protected])
© 2005 Author(s). This work is licensed under a Creative Commons License.
2247

ACPD5, 2247–2268, 2005
Combustioncharacteristics ofwater-insolubleelemental andorganic carbon
K. Wittmaack
Title Page
Abstract Introduction
Conclusions References
Tables Figures
J I
J I
Back Close
Full Screen / Esc
Print Version
Interactive Discussion
EGU
Abstract
Combustion of elemental carbon (EC) and organic carbon (OC) contained in ambientaerosol matter was explored using scanning electron microscopy (SEM) in combina-tion with energy dispersive X-ray analysis (EDX). To ease identification of the particlesof interest and to avoid or at least reduce interaction with simultaneously sampled in-5
organic oxides and salts, the approach used in this work differed in two ways fromcommonly applied procedures. First, rather than using a mixture of particles of vastlydifferent sizes, as in PM10 or PM2.5, aerosol matter was collected in a 5-stage im-pactor. Second, the water soluble fraction of the collected matter was removed prior toanalysis. Diesel soot particles, which appeared in the well-known form of chain-type10
aggregates, constituted the major fraction of EC. In contrast, OC containing particleswere observed in a variety of shapes, including a sizable amount of bioaerosol matterappearing mostly in the size range above about 1µm. During heating in ambient air for1 h, diesel soot particles were found to be stable up to 480◦C, but complete combustionoccurred in a narrow temperature interval between about 490 and 510◦C. After diesel15
soot combustion, minute quantities of “ash” were observed in the form of aggregatedtiny particles with sizes less than 10 nm. These particles could be due to elementalor oxidic contaminants of diesel soot. Combustion of OC was observed over a widerange of temperatures, from well below 200◦C to at least 500◦C. Incompletely burntbioaerosol matter was still found after heating to 600◦C. The results imply that the EC20
fraction in aerosol matter can be overestimated significantly if the contribution of OC toa thermogram is not well separated.
1. Introduction
Carbonaceous particles constitute a significant if not a large fraction of atmosphericaerosol matter (Molnar et al., 1999; Putaud et al., 2004; ten Brink et al., 2004). It25
is common practice to distinguish two categories, organic carbon (OC) and elemental
2248

ACPD5, 2247–2268, 2005
Combustioncharacteristics ofwater-insolubleelemental andorganic carbon
K. Wittmaack
Title Page
Abstract Introduction
Conclusions References
Tables Figures
J I
J I
Back Close
Full Screen / Esc
Print Version
Interactive Discussion
EGU
carbon (EC). Quantitative measurements of OC and EC are hampered by sometimessevere sampling artefacts (Mader at al., 2003; ten Brink et al., 2004) as well as by thefact that analytical methods based on the use of fundamental properties are not avail-able. The mass of OC and EC in a given sample is usually determined by combustion,applying certain protocols which define the temperature and duration of heating, the5
composition of the gas atmosphere, the method of analysing gaseous carbon evolvingfrom the sample, the control of sample charring etc. Depending on the details of theprotocols, the results for EC were found to differ significantly (Hitzenberger et al., 1999;Schmid et al., 2001; ten Brink et al., 2004), in extreme cases by as much as a factorof 12 (Schmid et al., 2001). Part of the problem relates to the fact that OC comprises10
a diverse mixture of materials ranging from small organic molecules to bioaerosols(Cachier, 1998). These various components of OC exhibit different characteristic tem-peratures of desorption, pyrolysis and combustion. EC containing particles, on theother hand, may be expected to feature a comparatively well defined combustion be-haviour. Preliminary evidence in this respect was recently obtained using scanning15
electron microscopy (SEM) to trace the incineration of diesel soot carbon nanoparti-cles after different steps of 1 h heating in ambient air (Wittmaack, 2004). The dieselparticles, which are known to be composed of EC in the form of graphitic crystallites(Ishiguro et al., 1997; Wentzel et al., 2003), remained essentially unchanged afterheating to 400◦C, but had disappeared completely after heating to 500◦C.20
The purpose of this study was to extend the previous work with the aim of arrivingat a detailed picture of the combustion characteristics of a variety of OC containingparticles as well as of diesel soot, the latter often comprising the largest fraction ofEC particulate matter. The results of such an investigation might be used to interpretthe different peaks routinely observed in thermograms of ambient aerosol matter at25
temperatures between 100 and 850◦C (Chow et al., 2001). A detailed peak assignmenthas not been possible in previous work.
2249

ACPD5, 2247–2268, 2005
Combustioncharacteristics ofwater-insolubleelemental andorganic carbon
K. Wittmaack
Title Page
Abstract Introduction
Conclusions References
Tables Figures
J I
J I
Back Close
Full Screen / Esc
Print Version
Interactive Discussion
EGU
2. Methods
The approach used in this study differs in several ways from commonly used proce-dures for determining EC and OC in ambient aerosol matter. The standard approach iscollect particles with aerodynamic diameters less than 10 or 2.5µm (PM10 or PM2.5,respectively) on quartz fibre filters (Hitzenberger et al., 1999; Schmid et al., 2001;5
Mader et al., 2003; ten Brink et al., 2004) and to determine the combustion charac-teristics of the as-sampled aerosol matter, with or without determining the changes inoptical transmission or reflectance during the heating procedure (Cachier, 1998; Chowet al., 2001). EC and OC measurements on size fractionated aerosols collected inimpactors are rare (Maenhaut et al., 2002). To the author’s knowledge, a detailed com-10
parison of the thermograms observed in different size ranges has not yet been carriedout. In this study aerosol matter was sampled using a 5-stage Berner-type impactor(Hauke GmbH) operated at a flow rate of 80 l/min. The nozzles and the correspond-ing aerosol deposits are arranged along a circle with a diameter of 50 mm. Annularaluminium foils, 12µm thick, with inner and outer diameters of 32 and 70 mm, respec-15
tively, served as impaction substrates. Sampling was carried out on the campus ofGSF, located on the northern outskirts of Munich, during a 24 h period in May 2000.Different from standard procedures, the water soluble aerosol matter was extractedprior to analysis and heat treatment. The procedure, tested (Wittmaack et al., 2002)and applied before (Wittmaack, 2004), has several advantages. First, many OC and20
EC containing particles, which may be covered by inorganic matter after prolongedsampling, become visible in SEM analysis. Second, combustion artefacts due to in-teraction with inorganic matter (Chow et al., 2001) are removed or at least reduced.Third, water soluble organic carbon (WSOC) is removed from the sample and may beanalysed separately.25
The sampled aerosol deposits were treated as follows. The total mass of the aerosoldeposits on each foil was first determined gravimetrically. Water-soluble matter wasthen removed by depositing the impaction foils face down in 10 ml of deionised wa-
2250

ACPD5, 2247–2268, 2005
Combustioncharacteristics ofwater-insolubleelemental andorganic carbon
K. Wittmaack
Title Page
Abstract Introduction
Conclusions References
Tables Figures
J I
J I
Back Close
Full Screen / Esc
Print Version
Interactive Discussion
EGU
ter for 1h. The concentration of inorganic ions was determined by ion chromatogra-phy (Wittmaack and Keck, 2004). After drying of the impaction foils, the mass of theresidual water-insoluble deposits was also determined gravimetrically. Small sectionscontaining between eight spots in stage 1 and one spot in stage 4 were cut from theimpaction foils for separate heat treatment and analysis (for stage assignment, number5
of nozzles, nozzle diameter, and aerodynamic cut diameter see Fig. 1a). Each sec-tion was heated only once in ambient air, to temperatures between 200 and 600◦C, for1 h. Prior to SEM analysis the samples were covered with a conducting layer of sput-ter deposited platinum (nominal thickness 3 nm). SEM images were recorded using amodel JSM-6300F scanning electron microscope (Jeol), equipped with a field emission10
electron gun operated at 5 kV. A model 6524 Si(Li) detector (Link Analytical) served foracquiring energy dispersive X-ray (EDX) spectra. To achieve optimum sensitivity forlight elements, the detector was operated with an open window. EDX analysis wasusually carried out while scanning the electron beam over an area of 60×42µm. Oc-casionally small-area analysis (4×3µm) was performed to determine the composition15
of individual mineral particles. For that purpose the beam energy was increased to15 keV (window closed).
3. Results and discussion
3.1. Coarse description of samples
The size dependent differences between the aerosol deposits collected in the different20
impactor stages are illustrated in Fig. 1. The total mass after sampling ranged from50 to 350µg per stage, the water insoluble mass from about 10 to 150µg (Fig. 1a).Different from stages 4 and 5, which contained a large amount of water insoluble min-eral dust, the soluble fraction was typically 60% in stages 1–3 (mostly ammonium sul-phate and nitrate). This result is in accordance with recent studies on PM2.5 matter25
(Wittmaack and Keck, 2004). Assuming that the residual insoluble aerosol matter had
2251

ACPD5, 2247–2268, 2005
Combustioncharacteristics ofwater-insolubleelemental andorganic carbon
K. Wittmaack
Title Page
Abstract Introduction
Conclusions References
Tables Figures
J I
J I
Back Close
Full Screen / Esc
Print Version
Interactive Discussion
EGU
a mean mass density of 2 g/cm3 and was uniformly distributed over an area equiva-lent of the respective nozzle area, the mean coverage per stage can be calculated inunits of monolayers (ML), as shown in Fig. 1b (the thickness of one monolayer was setequal to the geometric mean aerodynamic diameter in the respective impactor stage).In stages 1 and 3 the deposits were found to be about five ML thick, even thicker in5
stage 2 (about 18 ML), but only 0.3 ML in stage 4. Accordingly, the nominal areas ofdeposition should to be densely covered in stages 1–3, but only partially in stage 4.However, due to enhanced deposition near the jet axis, previously referred to as fo-cussing (Wittmaack, 2002), the local thickness in the centre of the deposit was larger,possibly by up to a factor of two. The SEM and EDX data presented below are in10
accordance with this estimate. The fractional coverage in stage 5 was found to beeven smaller than in stage 4. Hence stage 5 was not included in the detailed analysisdescribed below.
3.2. SEM analysis
Evidence for a significant concentration of diesel soot particles in the ambient air at the15
GSF sampling site has already been presented before (Wittmaack, 2004; Wittmaacket al., 2005). Figure 2 shows examples of these densely packed carbon nanoparticlesnear the centre of deposits in impactor stage 4 (panel a, unheated; referred to as roomtemperature, RT) and stage 3 (panel b, after heating to 300◦C; in what follows the term“after heating to” will be skipped for brevity, only the temperature of the heating cycle20
will be quoted). There is no detectable difference in the morphology of the nanopar-ticles for the RT and 300◦C samples. In the stage 3/510◦C sample (Fig. 2c), on theother hand, diesel soot particles are no longer detectable, i.e. they have been lost bycombustion. As a results the much larger mineral particles become clearly observable.EDX analysis showed that these particles are composed mostly of Si, Fe, and O, with25
additional contributions due to K, Ti and Ca.A closer inspection of Fig. 2c shows some aggregated very small particles on the
2252

ACPD5, 2247–2268, 2005
Combustioncharacteristics ofwater-insolubleelemental andorganic carbon
K. Wittmaack
Title Page
Abstract Introduction
Conclusions References
Tables Figures
J I
J I
Back Close
Full Screen / Esc
Print Version
Interactive Discussion
EGU
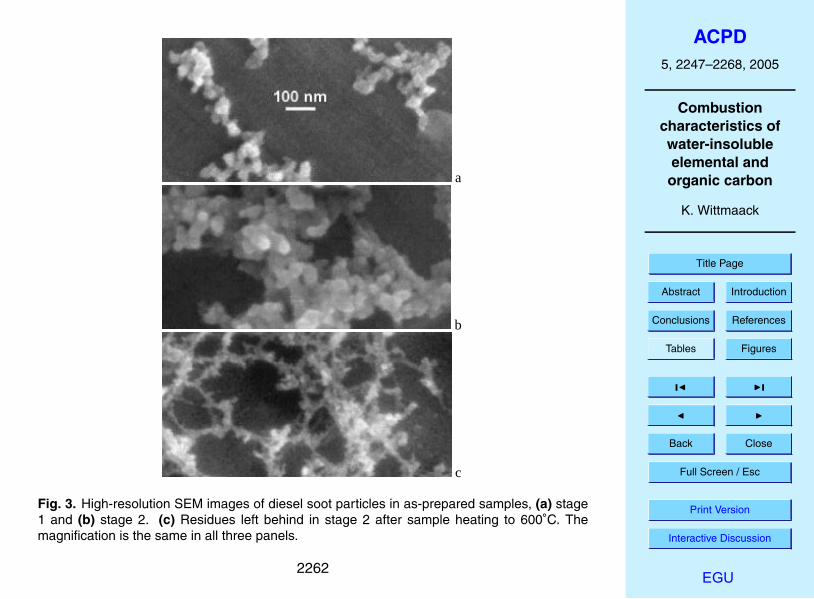
much larger mineral particles. The tiny particles, which could be misinterpreted asresidual carbon nanoparticles, are actually some kind of ash presumably left behindas a result of the combustion of the diesel soot particles at 510◦ C. Figure 3 illustratesthe differences in morphology of the two types of nanoparticles. Two high-resolutionimages of diesel soot particles observed at RT outside the central area of aerosol5
deposition in stages 1 and 2 are presented in Figs. 3a and 3b, respectively. Similarchain aggregates have been described repeatedly (Berube et al., 1999; Wentzel et al.,2003; Van Gulijk et al., 2004; Wittmaack, 2004). The important aspect to note withreference to Figs. 3a and 3b is that the individual aggregated particles feature distinctlydifferent sizes, about 20 nm in panel a, but between 30 and 40 nm in panel b. Almost10
the same differences in the size of diesel soot particles have been reported recently(Wentzel et al., 2003), but a reason for the difference could not be provided. Morework appears to be necessary to fully understand the growth mechanism of diesel sootparticles.
For comparison, the residues of combustion in stage 2/600◦C are shown in Fig. 3c.15
The individual particles in the aggregates have sizes less than 10 nm. Owing to anestimated resolution in the SEM analysis of 2–5 nm, the actual size could well be lessthan 5 nm. Because of the very small amount of material contained in these particles,compositional analysis is extremely difficult, if not impossible. EDX analysis at 5 keVshowed very faint signals due to silicon, barely above the bremsstrahlung background.20
The particles could be the ash of diesel soot combustion. In fact, low concentrationsof silicon in diesel soot have also been observed recently in transmission electronmicroscopy studies (Wentzel et al., 2003).
The temperature dependence of diesel soot combustion is evident from Fig. 4 whichshows a compilation of low-resolution images of stage-1 deposits. Increasing the tem-25
perature from (a) RT through (b) 200◦C and (c) 400◦C to (d) 440◦C there is no de-tectable change, neither in the surface morphology nor in the density. At 480◦C (e)there is a change in that individual carbon nanoparticle have become observable withbetter contrast. This change, which has already been observed before with a different
2253

ACPD5, 2247–2268, 2005
Combustioncharacteristics ofwater-insolubleelemental andorganic carbon
K. Wittmaack
Title Page
Abstract Introduction
Conclusions References
Tables Figures
J I
J I
Back Close
Full Screen / Esc
Print Version
Interactive Discussion
EGU
sample at 400◦C (Wittmaack, 2004), could be due to desorption or combustion of OCcontaining matter (see Sect. 3.3). After a further increase in temperature to 520◦C (f),the diesel soot particles have disappeared completely and only the residues discussedwith reference to Fig. 3c are left behind. These findings imply that combustion of dieselsoot EC in ambient air is characterised by a rather sharp threshold, somewhere be-5
tween 490 and 510◦C.The concentration of diesel soot particles was found to be high in stages 1 and 2,
intermediate in stage 3 and comparatively low in stage 4. Concurrent with the de-crease in diesel soot concentration, the contribution due to mineral particles increased(note again that water soluble matter had been removed). The aerosol matter col-10
lected in stage 4, however, exhibited a significant difference compared to stages 1–3.Stage 4 contained a large amount of material of biological origin. A few examples arepresented in Fig. 5. The small spherical objects seen in Fig. 5a are known as brocho-somes produced by insects. Recent studies revealed surprisingly high concentrationsof these bioaerosol particles in ambient air during the warm season (Wittmaack, 2005;15
Wittmaack et al., 2005). The coiled object in Fig. 5b could be a hypha, the product ofa fungus; the huge, partially covered object in Fig. 5c is presumably the scale of aninsect (Wittmaack et al., 2005).
Other examples of stage-4 matter of biogenetic origin are depicted in Fig. 6a. Thetop section of the image shows some kind of waxy material. The lower section contains20
a stem-type bioaerosol. Combustion of this kind of object at 430◦C presumably resultsin a product of the kind located along the centre of Fig. 6b. The interesting aspect hereis that heating at 430◦C did not cause complete but only partial combustion. In fact,residues due to partial combustion of bioaerosol matter were observed quite frequently,even after heating to temperatures as high as 600◦C. An example is shown in Fig. 6c.25
On the other hand, the waxy matter in Fig. 6a had disappeared completely at 300◦C.The results presented above imply that water-insoluble OC matter of biogenetic ori-
gin will be observed in thermograms over a wide range of temperatures, from below300◦ to 600◦C and more. Therefore, standard thermograms will be difficult to interpret,
2254

ACPD5, 2247–2268, 2005
Combustioncharacteristics ofwater-insolubleelemental andorganic carbon
K. Wittmaack
Title Page
Abstract Introduction
Conclusions References
Tables Figures
J I
J I
Back Close
Full Screen / Esc
Print Version
Interactive Discussion
EGU
in particular when dealing with PM2.5 or even PM10 samples rather than with sizefractionated matter. Owing to the variability of the bioaerosol fraction in aerosol matter,one would expect that PM samples collected during the warm season exhibit a morecomplex thermogram than samples collected during the cold season.
3.3. EDX analysis5
The results obtained by SEM imaging were substantiated by EDX compositional anal-ysis. Owing to the complex morphology of the deposits and the differences in samplethickness, evaluation of absolute concentrations did not seem to be justified. Hencethe elemental signals are discussed only in terms of the background corrected peakX-ray yields.10
As an example, Fig. 7 shows the temperature dependence of the yields of C, O, Si,Al (K-shell), and Pt (M-shell) for stage-1 aerosol deposits. In accordance with the SEMimages in Fig. 4, the C signal appears to remain essentially constant up to 440◦C, startsto decrease slightly at 480◦C and, between 480 and 520◦C, drops rapidly to the levelmeasured with a blank Al substrate. Concurrently the Al signal increases almost to the15
blank level. There is, however, a difference in that the Al signal exhibits an increasealready at temperatures between about 300 to 400◦C. This change, which amountsto only about 5% of the blank level, is not detectable in the C data because relativechanges of this magnitude are smaller than the statistical variation from sample tosample. Plotting the results for Al in the form of an [Al(blank) – Al] yield difference (dia-20
monds with central crosses), the close correlation between the C and Al data becomesfully evident. The signals measured for O and Si were clearly above the blank level (bya factor of three to four), indicating that the water-insoluble aerosol deposits in stage 1contained some non-EC matter, presumably mineral oxides or OC (see below).
A comparison of the temperature dependence of the C and Al signals observed with25
the aerosol matter in the four different size ranges is presented in Figs. 8a and 8b.The corresponding data for O and Si are shown in Figs. 9a and 9b. Consider firstthe Al data in Fig. 8b. The important result is that only in the case of stage 2 (open
2255

ACPD5, 2247–2268, 2005
Combustioncharacteristics ofwater-insolubleelemental andorganic carbon
K. Wittmaack
Title Page
Abstract Introduction
Conclusions References
Tables Figures
J I
J I
Back Close
Full Screen / Esc
Print Version
Interactive Discussion
EGU
triangles) the mean thickness of the deposits (∼940µg/cm2) was so large so that the5-keV probing electron beam could not “see” the Al substrate. In stage 1 (∼64µg/cm2),however, a small substrate signal was clearly detectable (solid circles). Hence smallchanges in the mass density of the deposits due to evaporation and/or combustionduring heating to up to 400◦C became detectable as an increase in the Al signal. Much5
more significant losses, on the order of 30%, were deduced from the C and Al signalsafter heating to 480◦C. The tentative interpretation is that these losses are due to thecombustion of water-insoluble OC contained in the aerosol sample. This OC is notevident in the form of particles identifiable by SEM. Instead the OC matter may bepresent in the form of a “hazy background” in the SEM images and to some extent also10
as a thin layer on the diesel soot particles. Changes in morphology similar to thosein Fig. 4 have previously been associated with the removal of adsorbed contaminants(Wittmaack, 2004).
The Al substrate signal was also detectable in stage 3 (open diamonds in Fig. 8b)even though the estimated thickness was quite large (∼1060µg/cm2). This apparent15
discrepancy is probably due to the fact that, owing to the comparatively high concen-tration of mineral particles, the deposit contained a significant number of microscopicholes and clefts through which the beam could penetrate (Wittmaack et al., 2002). Thehigh Al signal observed in stage 4, on the other hand, is due to the fact that the samplewas only partially covered with various types of aerosol matter (see Figs. 5 and 6). The20
results for stages 3 and 4 indicate a significant loss of carbon at lower temperaturesthan in the case of stages 1 and 2. This difference is attribute to the increasing fractionof bioaerosol matter contained in the deposits. In fact, a large loss of carbonaceousmatter was observed in stage 4 already at 200◦C, see Fig. 8a. Even though diesel sootparticles could be found in stage 4, the contribution to the total carbon content of the25
sample amounted to only a few percent so that the step-like combustion of EC around500◦C got lost in the background signal.
The results for O and Si in Fig. 9 complete the picture outlined above. The smallsignals observed in stage 1 suggest that the concentration of mineral dust was quite
2256
ACPD5, 2247–2268, 2005
Combustioncharacteristics ofwater-insolubleelemental andorganic carbon
K. Wittmaack
Title Page
Abstract Introduction
Conclusions References
Tables Figures
J I
J I
Back Close
Full Screen / Esc
Print Version
Interactive Discussion
EGU
small. In stage 4, on the other hand, most of the mineral particles were not coveredwith carbonaceous matter (see Figs. 5 and 6) so that the O and Si signals reflectingtheir presence exhibited only a rather small increase due to combustion related losses.These losses, however, are clearly evident in stages 2 and 3, and the temperaturedependence is in accordance with the results in Fig. 8. The relative changes are con-5
siderably smaller than for Al, the reason being that the mineral particles producing theO and Si signals were presumably distributed fairly uniformly within the deposited layerso that a sizable fraction of these particles could be detected by the probing beam evenbefore removal of carbonaceous matter by combustion.
4. Conclusions10
This study has provided further evidence that SEM in combination with EDX is an indis-pensable tool for characterising ambient aerosol matter in terms of morphology, originand combustion behaviour. To ease distinction between the OC and EC particles, ini-tial removal of water soluble matter is highly advisable. Analysis of the water-insolublefraction of aerosol deposits collected in an impactor revealed very pronounced size15
dependent differences in composition. Carbonaceous matter was observed mostly inthe form of diesel soot carbon nanoparticles (EC) and various types of material of bio-genetic origin (OC). The diesel soot particles featured step-like combustion centredaround 500◦C. Combined with gravimetric data, the SEM results suggest that the ECfraction in water-insoluble aerosol matter was very large (70%) in the size range be-20
low 140 nm and large below 500 nm. However, the estimated contribution to the totalPM1.7 mass was small, i.e. only between 5 and 8%. Bioaerosols and other OC matternot fully identified by SEM disappeared by evaporation and combustion over a compar-atively wide range of temperatures, from below 200◦C to 500◦C or more. Some typesof bioaerosol matter require combustion temperatures well above 600◦C. These re-25
sults provides at least a qualitative explanation for the complex thermograms reportedpreviously.
2257

ACPD5, 2247–2268, 2005
Combustioncharacteristics ofwater-insolubleelemental andorganic carbon
K. Wittmaack
Title Page
Abstract Introduction
Conclusions References
Tables Figures
J I
J I
Back Close
Full Screen / Esc
Print Version
Interactive Discussion
EGU
Acknowledgements. Thanks are due to U. Heinzmann who provided access to the scanningelectron microscope and to H. Wehnes for skilfully taking the SEM images and the EDX spectra.
References
Berube, K. A., Jones, T. P., Williamson, B. J., Winters, C., Morgan, A. J., and Richards, R. J.:Physicochemical characterisation of diesel exhaust particles: Factors for assessing biologi-5
cal activity, Atmos. Environ., 33, 1599–1614, 1999.Cachier, H.: Carbonaceous Combustion Aerosols, in: Atmospheric Particles, edited by: Harri-
son, R. M. and Van Grieken, R., John Wiley and Sons, Chichester, Chapter 9, 1998.Chow, J., Watson, J. G., Crow, D., Lowenthal, D. H., and Merrifield, T.: Comparison of IM-
PROVE and NIOSH carbon measurements, Aerosol Sci. Technol., 34, 23–34, 2001.10
Hitzenberger, R., Jennings, S. G., Larson, S. M., Dillner, A., Cachier, H., Galambos, Z., Rouc,A., and Spain, T. G.: Intercomparison of measurement methods for black carbon aerosol,Atmos. Environ., 33, 2823–2833, 1999.
Ishiguro, T., Takatori, Y., and Akihama, K.: Microstructure of diesel soot particles probed byelectrom micrscopy: First observation of inner core and outer shell, Combustion and Flame,15
108, 231–234, 1997.Mader, B. T., Schauer, J. J., Seinfeld, J. H., Flagan, R. C., Yu, J. Z., Yang, H., Lim, H.-J.,
Turpin, B. J., Deminter, J. T., Heidemann, G., Bae, M. S., Quinn, P., Bates, T., Eatough, D.J., Huebert, B. J., Bertram, T., and Howell, S.: Sampliong methods used for the collection ofparticle-phase organic and elemental carbon during ACE-Asia, Atmos. Eniviron., 37, 1435–20
1449, 2003.Molnar, A., Meszaros, E., Hansson, H. C., Karlsson, H., Gelencser, A., Kiss, G. Y., and Krivacsy,
Z.: The importance of organic and elemental carbon in the fine atmospheric aerosol particles,Atmos. Environ., 33, 2745–2750, 1999.
Putaud, J.-P., Raes, F., Van Dingenen, R., Bruggemann, E., Facchini, M.-C., Decesari, S.,25
Fuzzi, S., Gehrig, R., Huglin, C., Laj, P., Lorbeer, G., Maenhaut, W., Mihalopoulos, N., Muller,K., Querol, X., Rodriguez, S., Schneider, J., Spindler, G., ten Brink, H., Tørseth, K., andWiedensohler, A.: A European aerosol phenomenology – 2: chemical characteristics ofparticulate matter at kerbside, urban, rural and background sites, Atmos. Environ., 38, 2579–2595, 2004.30
2258

ACPD5, 2247–2268, 2005
Combustioncharacteristics ofwater-insolubleelemental andorganic carbon
K. Wittmaack
Title Page
Abstract Introduction
Conclusions References
Tables Figures
J I
J I
Back Close
Full Screen / Esc
Print Version
Interactive Discussion
EGU
Ten Brink, H., Maenhaut, W., Hitzenberger, R., Gnauk, T., Spindler, G., Even, A., Chi, X., Bauer,H., Puxbaum, H., Putaud, J.-P., Tursic, J., and Berner, A.: Intercomp2000: the comparabilityof methods in use in Europe for measuring the carbon content of aerosols, Atmos. Environ.,38, 6507–6519, 2004.
Schmid, H., Laskus, L., Abraham, H. J., Baltensperger, U., Lavanchy, V., Bizjak, M., Burba,5
P., Cachier, H., Crow, D., Chow, J., Gnauk, T., Even, A., ten Brink, H. M., Giesen, K.-P.,Hitzenberger, R., Hueglin, C., Maenhaut, W., Pio, C., Carvalho, A., Putaud, J.-P., Toom-Sauntry, D., and Puxbaum, H.: Results of the “carbon conference” international aerosolcarbon round robin test stage I, Atmos. Environ., 35, 2111–2121, 2001.
Van Gulijk, C., Marijnissen, J. C. M., Makkee. M., Moulijn, J. A., and Schmidt-Ott, A. : Measuring10
diesel soot with a scanning mobility particles sizer and an electrical low-pressure impactor:performance assessment with a model for fractal-like agglomerates, J. Aerosol Sci. 35, 633–655, 2004.
Wentzel, M., Gorzawski, H., Naumann, K.-H., Saathoff, H., and Weinbruch, S.: Transmissionelectron microscopical and aerosol dynamical characterization of soot aerosols, J. Aerosol.15
Sci., 34, 1347–1370, 2003.Wittmaack, K.: Impact and growth phenomena observed with sub-micrometer atmospheric
aerosol particles collected on polished silicon at low coverage, Atmos. Environ. 36, 3963–3971, 2002.
Wittmaack, K., Menzel, N., Wehnes, H., and Heinzmann, U.: Phase separation and regrowth of20
aerosol matter collected after size fractionation in an impactor, Atmos. Environ., 36, 5877–5886, 2002.
Wittmaack, K. and Keck, L.: Thermodesorption of aerosol matter on multiple filters of differentmaterials for a more detailed evaluation of sampling artefacts, Atmos. Environ., 38, 5205–5215, 2003.25
Wittmaack, K.: Characterization of carbon nanoparticles in ambient aerosols by electron mi-croscopy and model calculations, J. Air Waste Manag. Assoc., 54, 1091–1098, 2004.
Wittmaack, K.: Brochosomes produced by leafhoppers - a widely unknown, yet highly abundantspecies of bioaerosols in ambient air, Atmos. Environ., 39, 1173–1180, 2005.
Wittmaack, K., Wehnes, H., Heinzmann, U., and Agerer, R.: An overview on bioaerosols viewed30
by scanning electron microscopy, Sci. Total Environ., doi:10.1016/j.scitotenv.2004.11.0009,2005.
2259

ACPD5, 2247–2268, 2005
Combustioncharacteristics ofwater-insolubleelemental andorganic carbon
K. Wittmaack
Title Page
Abstract Introduction
Conclusions References
Tables Figures
J I
J I
Back Close
Full Screen / Esc
Print Version
Interactive Discussion
EGU
10
102
103
104
a
stage no.: 1 2 3 4 5 nozzles: 220 76 18 21 7noz. dia (mm): 0.3 0.4 1.0 1.9 6.1 cut dia (µm): 0.04 0.14 0.49 1.72 6.0
waterinsoluble
assampled
MA
SS
per
ST
AG
E (
µg)
0.01 0.1 1 1010-1
1
10
b
water insoluble fraction
ρ = 2 g/cm3
MEAN DIAMETER (µm)
CO
VE
RA
GE
(M
L)
Fig. 1. Gross characterisation of the analysed aerosol samples in terms of (a) the mass perstage and (b) the mean number of layers in units of the mean particle diameter. The impactorspecifications are listed in the top part of panel (a).
2260

ACPD5, 2247–2268, 2005
Combustioncharacteristics ofwater-insolubleelemental andorganic carbon
K. Wittmaack
Title Page
Abstract Introduction
Conclusions References
Tables Figures
J I
J I
Back Close
Full Screen / Esc
Print Version
Interactive Discussion
EGU
13
10
102
103
104
a
stage no.: 1 2 3 4 5 nozzles: 220 76 18 21 7noz. dia (mm): 0.3 0.4 1.0 1.9 6.1 cut dia (µm): 0.04 0.14 0.49 1.72 6.0
waterinsoluble
assampled
MA
SS
per
ST
AG
E (
µg)
0.01 0.1 1 1010-1
1
10
b
water insoluble fraction
ρ = 2 g/cm3
MEAN DIAMETER (µm)
CO
VE
RA
GE
(M
L)
Fig. 1
a
b
c Fig. 2
Fig. 2. SEM images showing diesel soot particles (a) in an as-prepared sample (stage 4), (b)after heating to 300◦C (stage 3) and (c) to 510◦C (stage 3). The magnification is the same inall three panels.
2261
ACPD5, 2247–2268, 2005
Combustioncharacteristics ofwater-insolubleelemental andorganic carbon
K. Wittmaack
Title Page
Abstract Introduction
Conclusions References
Tables Figures
J I
J I
Back Close
Full Screen / Esc
Print Version
Interactive Discussion
EGU
14
a
b
c Fig. 3
Fig. 3. High-resolution SEM images of diesel soot particles in as-prepared samples, (a) stage1 and (b) stage 2. (c) Residues left behind in stage 2 after sample heating to 600◦C. Themagnification is the same in all three panels.
2262

ACPD5, 2247–2268, 2005
Combustioncharacteristics ofwater-insolubleelemental andorganic carbon
K. Wittmaack
Title Page
Abstract Introduction
Conclusions References
Tables Figures
J I
J I
Back Close
Full Screen / Esc
Print Version
Interactive Discussion
EGU
15
a
b
c
d
e
f Fig. 4
Fig. 4. Low-resolution SEM image of stage-1 deposits, (a) RT (as-prepared), and after sampleheating to different temperatures, (b) 200◦C, (c) 400◦C, (d) 440◦C, (e) 480◦C, and (f) 520◦C.The magnification is the same in all six panels.
2263

ACPD5, 2247–2268, 2005
Combustioncharacteristics ofwater-insolubleelemental andorganic carbon
K. Wittmaack
Title Page
Abstract Introduction
Conclusions References
Tables Figures
J I
J I
Back Close
Full Screen / Esc
Print Version
Interactive Discussion
EGU
16
a
b
c Fig. 5
Fig. 5. Examples of bioaerosol matter observed in impactor stage 4, (a) brochosomes, (b)presumably a coiled hypha, (c) scale of an insect.
2264

ACPD5, 2247–2268, 2005
Combustioncharacteristics ofwater-insolubleelemental andorganic carbon
K. Wittmaack
Title Page
Abstract Introduction
Conclusions References
Tables Figures
J I
J I
Back Close
Full Screen / Esc
Print Version
Interactive Discussion
EGU
17
a
b
c Fig. 6
0 100 200 300 400 500 60010
102
103
104
Al(blank) - Al
O
C
Al
blan
k le
vel
5 keV e-
SiPt
O
CAl
40 - 140 nm (Stage 1)
TEMPERATURE (°C)
X -
RA
Y Y
IELD
(co
unts
)
Fig. 7
Fig. 6. Other types of bioaerosol matter observed in impactor stage 4, (a) RT (as-prepared),and after sample heating to (b) 430◦C and (c) 600◦C.
2265

ACPD5, 2247–2268, 2005
Combustioncharacteristics ofwater-insolubleelemental andorganic carbon
K. Wittmaack
Title Page
Abstract Introduction
Conclusions References
Tables Figures
J I
J I
Back Close
Full Screen / Esc
Print Version
Interactive Discussion
EGU
0 100 200 300 400 500 60010
102
103
104
Al(blank) - Al
O
C
Al
blan
k
5 keV e-
SiPt
O
CAl
40 - 140 nm (Stage 1)
TEMPERATURE (°C)
X -
RA
Y Y
IELD
(co
unts
)
Fig. 7. Temperature dependence of X-ray signals for stage-1 aerosol matter. The signals dueto the conducting Pt layer are shown for comparison. The horizontal bars to the left indicate thesignals measured with a blank Al foil. The blank signal for Si was only 5±3 counts.
2266

ACPD5, 2247–2268, 2005
Combustioncharacteristics ofwater-insolubleelemental andorganic carbon
K. Wittmaack
Title Page
Abstract Introduction
Conclusions References
Tables Figures
J I
J I
Back Close
Full Screen / Esc
Print Version
Interactive Discussion
EGU
102
103
104
0.04-0.14 (St. 1) 0.14-0.49 (St. 2)0.49-1.72 (St. 3) 1.72-6.0 (St. 4)
a
D (µm)
Carbon
X-R
AY
YIE
LD (
coun
ts)
0 100 200 300 400 500 60010
102
103
b
Aluminium
TEMPERATURE (°C)
Fig. 8. Comparison of the temperature dependence of X-ray signals measured in the fourdifferent size ranges specified at the top, (a) carbon and (b) aluminium.
2267

ACPD5, 2247–2268, 2005
Combustioncharacteristics ofwater-insolubleelemental andorganic carbon
K. Wittmaack
Title Page
Abstract Introduction
Conclusions References
Tables Figures
J I
J I
Back Close
Full Screen / Esc
Print Version
Interactive Discussion
EGU
10
102
103
a
D (µm)
Silicon
X - R
AY
YIE
LD (
coun
ts)
0 100 200 300 400 500 600
102
103
0.04-0.14 (St. 1) 0.14-0.49 (St. 2)0.49-1.72 (St. 3) 1.72-6.0 (St. 4)
b
TEMPERATURE (°C)
Oxygen
Fig. 9. The same as Fig. 8, but for (a) silicon and (b) oxygen.
2268