Combined Effect of Flyash & GGBS on Workability and M ... · on the fresh and mechanical properties...
12
Arun B R 1 , Nagaraja .P.S 2 , Srishaila Jagalur Mahalingasharma 3 , 1 Research scholar, Department of Civil Engineering, UVCE, Bangalore, India 2 Associate Professor, Department of Civil Engineering, UVCE, Bangalore, India 3 Assistant Professor, Department of Civil Engineering, RYMEC, Ballari, India Email: [email protected] , [email protected] , [email protected] Abstract—This paper presents on the experimental investigation on the combined effect of fly ash & GGBS with different molarities of self-compacting geopolymer concrete on workability properties like slump flow, T50 slump flow, J-Ring, V-Funnel, and L-Box and mechanical properties such as compressive strength, split tensile strength, and flexural strength and were tested. The mix proportion of self-compacting geopolymer concrete (SCGC) was arrived by trial and error method. Here flyash was replaced with GGBS by 0%, 30%, 50%, and 70% by mass for a constant binder content of 400kg/m 3 for all the molarities. The fluid to binder (F/B) ratio of 0.47 by mass and a super plasticizer (S.P) dosage of 3% was kept constant for all the molarities and extra water content was varied accordingly. The result showed that the workability parameters for all the molarities like 8M, 10M, and 12M were within in the range as prescribed by EFNARC guidelines. As the percentage of GGBS increased the Compressive strength, split tensile strength and flexure strength also increased and as well it increased with increase in molarity. All the specimens were oven cured at 70 0 C for 24hrs followed by ambient curing till the respective days of testing. Key words: Self-Compacting Geopolymer Concrete (SCGC), Ground Granulated Blast Furnace Slag (GGBS), Flyash (FA), Molarities (M), Manufacture Sand (M- Sand), Super Plasticizer (S.P) I. INTRODUCTION The development of civilization and social progress has been greatly influenced by the application of concrete in establishing infrastructural facilities. The unique position that the conventional cement based concrete widely used construction material is understandable, given its wide spectrum favorable attributes. These include regional produceability, versatility, wide ranging performance properties and cost effectiveness. The global usage of concrete is second to water. Annual worldwide production of concrete is estimated to be around one cubic meter for every person on earth [1] . The increased demand for concrete calls for increased production of cement, undisputedly the most widely used single binder ingredient of traditional concrete. The annual rate of increase of cement production is about 3%. The world cement production was about 1 billion tonnes in 1990, 1.5 billion tonnes in 1995, 1.7 billion tonnes in 2003, 2.6 billion tonnes in 2008 it as against the estimated 2.2 billion tonnes in 2010. By 2020, cement requirement is estimated to be around 3.5 billion tonnes [2, 3, 4] . It is estimated that with the demographic growth and industrialization, the pollution generated by cement production could reach an alarming 17 % of global CO 2 emissions which is currently about 7 % . [5] In view of this, with an interest in minimizing the overall CO 2 emissions associated with OPC composites [7, 8] to the extent technically and economically feasible, and sustainability in concrete construction, blended cements were introduced by partially replacing OPC by supplementary cementitious materials (SCM) [1] . Many industrial by-products / pozzolans such as fly ash, ground granulated blast furnace slag (GGBS), silica fume, metakaolin, rice husk ash etc. perform the function of SCM. However, the concepts of blended cements have yielded limited results in mitigating the adverse impacts of heavy use of OPC. Sustaining the growth in construction industry, while maintaining the ecological balance, deserves high priority. Therefore, it is necessary to go beyond the current approach of the cement industry, that of increasing the replacement levels of OPC and maximizing the use of industrial by-products as SCMs to an approach based on complete elimination of OPC by synthesizing altogether alternate binders that are eco-friendly, sustainable and less energy intensive [1] . In this direction, self-compacting geopolymer concrete (SCGC) is a promising field for the synthesis of new generation, non-conventional, novel OPC free binders and self-compacts without any segregation and blocking and can flow into places and around obstructions by its own weight to fill the formwork. Combined Effect of Flyash & GGBS on Workability and Mechanical Properties of Self Compacting Geopolymer concrete International Journal of Pure and Applied Mathematics Volume 119 No. 15 2018, 1369-1380 ISSN: 1314-3395 (on-line version) url: http://www.acadpubl.eu/hub/ Special Issue http://www.acadpubl.eu/hub/ 1369
Transcript of Combined Effect of Flyash & GGBS on Workability and M ... · on the fresh and mechanical properties...
Arun B R1, Nagaraja .P.S
2, Srishaila Jagalur Mahalingasharma
3,
1Research scholar, Department of Civil Engineering, UVCE, Bangalore, India 2Associate Professor, Department of Civil Engineering, UVCE, Bangalore, India 3Assistant Professor, Department of Civil Engineering, RYMEC, Ballari, India
Email: [email protected], [email protected], [email protected]
Abstract—This paper presents on the experimental investigation on the combined effect of fly ash & GGBS with
different molarities of self-compacting geopolymer concrete on workability properties like slump flow, T50 slump flow,
J-Ring, V-Funnel, and L-Box and mechanical properties such as compressive strength, split tensile strength, and flexural
strength and were tested. The mix proportion of self-compacting geopolymer concrete (SCGC) was arrived by trial and
error method. Here flyash was replaced with GGBS by 0%, 30%, 50%, and 70% by mass for a constant binder content of
400kg/m3 for all the molarities. The fluid to binder (F/B) ratio of 0.47 by mass and a super plasticizer (S.P) dosage of 3%
was kept constant for all the molarities and extra water content was varied accordingly. The result showed that the
workability parameters for all the molarities like 8M, 10M, and 12M were within in the range as prescribed by EFNARC
guidelines. As the percentage of GGBS increased the Compressive strength, split tensile strength and flexure strength also
increased and as well it increased with increase in molarity. All the specimens were oven cured at 700C for 24hrs followed
by ambient curing till the respective days of testing.
Key words: Self-Compacting Geopolymer Concrete (SCGC), Ground Granulated Blast Furnace Slag (GGBS), Flyash
(FA), Molarities (M), Manufacture Sand (M- Sand), Super Plasticizer (S.P)
I. INTRODUCTION
The development of civilization and social progress has been greatly influenced by the application of concrete in
establishing infrastructural facilities. The unique position that the conventional cement based concrete widely used
construction material is understandable, given its wide spectrum favorable attributes. These include regional
produceability, versatility, wide ranging performance properties and cost effectiveness. The global usage of concrete is
second to water. Annual worldwide production of concrete is estimated to be around one cubic meter for every person
on earth [1]. The increased demand for concrete calls for increased production of cement, undisputedly the most widely
used single binder ingredient of traditional concrete. The annual rate of increase of cement production is about 3%.
The world cement production was about 1 billion tonnes in 1990, 1.5 billion tonnes in 1995, 1.7 billion tonnes in 2003,
2.6 billion tonnes in 2008 it as against the estimated 2.2 billion tonnes in 2010. By 2020, cement requirement is
estimated to be around 3.5 billion tonnes [2, 3, 4]. It is estimated that with the demographic growth and industrialization,
the pollution generated by cement production could reach an alarming 17 % of global CO2 emissions which is
currently about 7 % .[5] In view of this, with an interest in minimizing the overall CO2 emissions associated with OPC
composites [7, 8] to the extent technically and economically feasible, and sustainability in concrete construction,
blended cements were introduced by partially replacing OPC by supplementary cementitious materials (SCM) [1].
Many industrial by-products / pozzolans such as fly ash, ground granulated blast furnace slag (GGBS), silica fume,
metakaolin, rice husk ash etc. perform the function of SCM.
However, the concepts of blended cements have yielded limited results in mitigating the adverse impacts of heavy use
of OPC. Sustaining the growth in construction industry, while maintaining the ecological balance, deserves high
priority. Therefore, it is necessary to go beyond the current approach of the cement industry, that of increasing the
replacement levels of OPC and maximizing the use of industrial by-products as SCMs to an approach based on
complete elimination of OPC by synthesizing altogether alternate binders that are eco-friendly, sustainable and less
energy intensive [1]. In this direction, self-compacting geopolymer concrete (SCGC) is a promising field for the
synthesis of new generation, non-conventional, novel OPC free binders and self-compacts without any segregation
and blocking and can flow into places and around obstructions by its own weight to fill the formwork.
Combined Effect of Flyash & GGBS on Workability and
Mechanical Properties of Self Compacting Geopolymer
concrete
International Journal of Pure and Applied MathematicsVolume 119 No. 15 2018, 1369-1380ISSN: 1314-3395 (on-line version)url: http://www.acadpubl.eu/hub/Special Issue http://www.acadpubl.eu/hub/
1369
II .LITERATURE REVIEW
Raijiwala D.B., et al., [2010], studied mechanical properties of flyash based geopolymer concrete for different
molarities (8M, 10M, 12M, 14M & 16M) over controlled concrete (M25). The study concluded that Compressive
strength of OPC increases over controlled concrete by 1.5 times (M-25 achieves M-45). Split Tensile Strength of OPC
increases over controlled concrete by 1.45 times. Flexural Strength of OPC increases over controlled concrete by 1.6
times. In Durability test, there is decrease in weight loss by 10 times (At 56 days % loss in weight has reduced from
5.66% to 0.60%). And also after 12 molarity of KOH, the gain in strength remains very moderate. Samuel Demie, et
al., [2012], analyzed the effect of superplasticiser dosage on compressive strength and microstructure characteristic of
interfacial transition zone (ITZ) prepared with flyash based self-compacting geopolymer concrete (SCGC). The study
concluded that the SP dosage 3%, 4% and 5% failed to exhibit required workability but whereas SP dosage 6% and 7%
showed improved workability properties and were within EFNARC limits of SCC. And also it showed better
compressive strength compared to S.P dosage of 3%, 4%, 5%, highest compressive strength of around 53MPa was
achieved at the end of 28days and it was clearly evident in microstructure studies that as the percentage of SP increases
the ITZ thickness was decreasing. T.G. Ushaa, et al., [2015], analyzed the effect of mechanical properties and
workability properties of self-compacting geopolymer concrete containing different mineral admixtures. GGBS and
silica fume was replaced by 10%, 20%, 30% and 5%, 10% and 15% respectively with respect to flyash. The test results
indicated that all the self-compacting geopolymer concrete mixes had a satisfactory performance in fresh state but
GGBS series had a good workability properties compared to silica fume series. The result of the mechanical properties
like compressive strength, split tensile strength and flexural strength had shown a significant performance difference
and highest compressive strength has been obtained for GGBS series i.e. as the percentage of GGBS increased the
strength kept on increasing till maximum replacement of 30% but whereas for silica fume series the strength increased
upto 10% replacement and later it got decreased for 15% replacement.
In this study, it is aimed to investigate the combined effect of fly ash and ground granulated blast furnace slag (GGBS)
on the fresh and mechanical properties of Self-Compacting geopolymer Concrete with different molarities. Fresh
concrete tests such as slump-flow, L-box, T50 slump flow, V-Funnel, J-Ring and tests such as compressive strength,
split tensile strength, and flexural strength test were conducted on mechanical properties.
III. MATERIALS USED FOR PREPARING SCGC
A. Flyash and GGBS
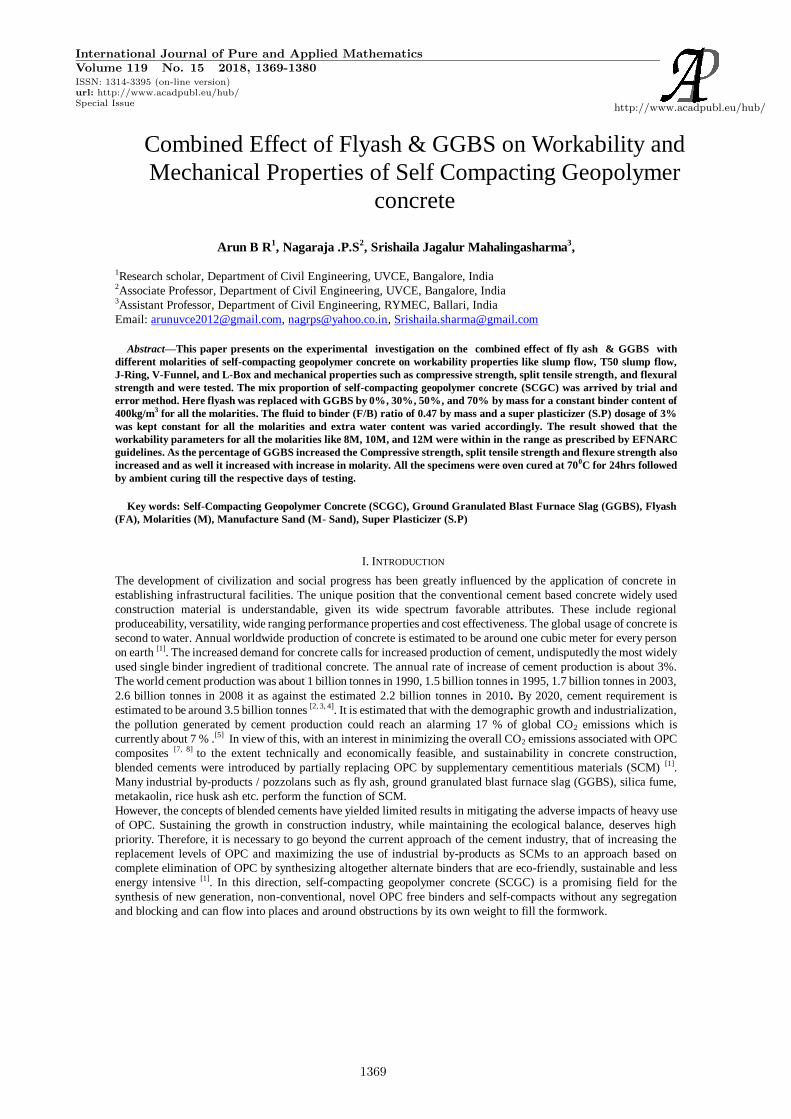
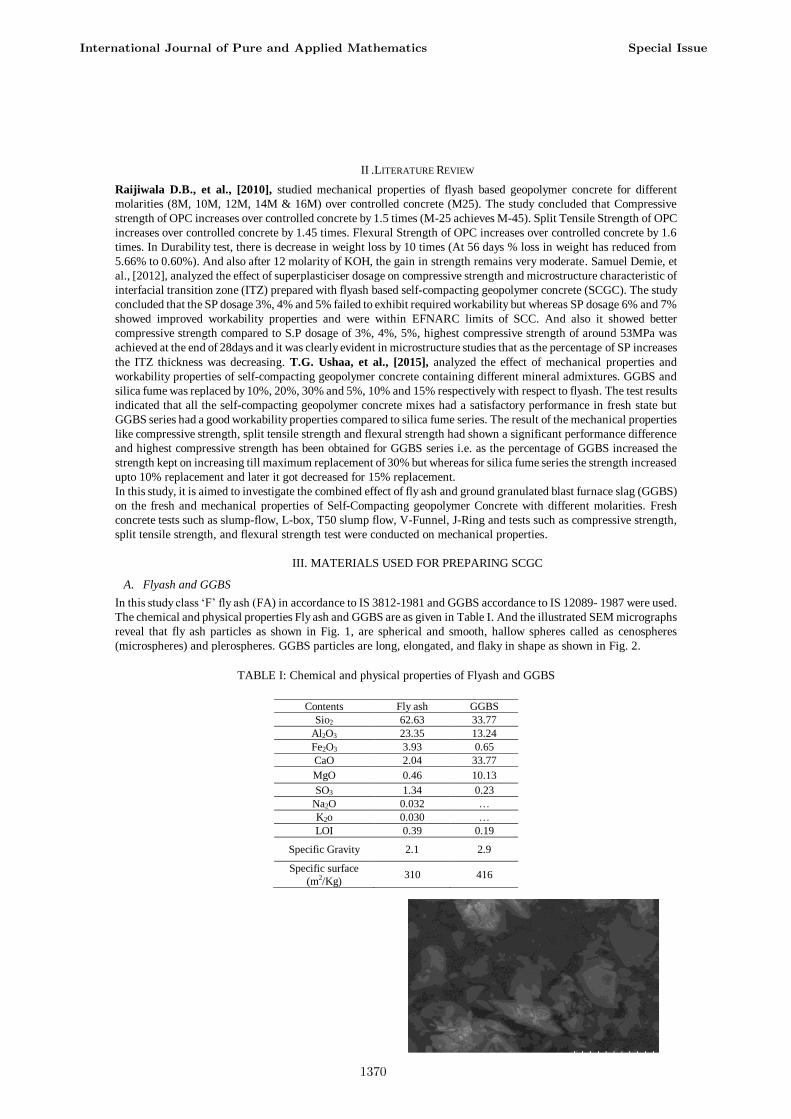
In this study class „F‟ fly ash (FA) in accordance to IS 3812-1981 and GGBS accordance to IS 12089- 1987 were used.
The chemical and physical properties Fly ash and GGBS are as given in Table I. And the illustrated SEM micrographs
reveal that fly ash particles as shown in Fig. 1, are spherical and smooth, hallow spheres called as cenospheres
(microspheres) and plerospheres. GGBS particles are long, elongated, and flaky in shape as shown in Fig. 2.
TABLE I: Chemical and physical properties of Flyash and GGBS
Contents Fly ash GGBS
Sio2 62.63 33.77
Al2O3 23.35 13.24
Fe2O3 3.93 0.65
CaO 2.04 33.77
MgO 0.46 10.13
SO3 1.34 0.23
Na2O 0.032 …
K2o 0.030 …
LOI 0.39 0.19
Specific Gravity 2.1 2.9
Specific surface
(m2/Kg) 310 416
International Journal of Pure and Applied Mathematics Special Issue
1370
Fig. 1. SEM image of Flyash Fig. 2. SEM image of GGBS
B. Aggregates
Manufactured sand confirming Zone II, specific gravity 2.59, water absorption 2.2% and fineness modulus 2.68 and
the crushed coarse aggregate obtained from the local crushing plant with specific gravity 2.67, water absorption 0.65%
and fineness modulus 6.86 were used in the present study.
C. Super Plasticizer (S.P) and Water
Poly carboxylic ether based, Glenium SKY 8233 (S.P) was used in this study with specific gravity 1.08 and chloride
ion content less than 0.2% and pH 6 was used. Tap water was used for the entire study.
D. Sodium Hydroxide
A commercial grade sodium hydroxide in the form of pellets with 99% purity and with Specific Gravity of 2.13 was
used in this study. Sodium hydroxide was dissolved in the water at the rate of 8, 10, 12 molar concentration. It was
prepared 24hours prior to use and also if it exceeds 36hours it terminates to semi solid liquid state. So the prepared
solution was used within this time period.
E. Example of Molarity calculation
The solids must be dissolved in water to make a solution with the required concentration. The concentration of sodium
hydroxide solution can vary in different molar. The mass of NaOH solids in a solution varies depending on the
concentration of the solution. For instance, sodium hydroxide solution with concentration of 12 molar consist of
12×40=480 grams of sodium hydroxide solids per liter of water, were 40 is molecular weight of sodium hydroxide.
This amount of sodium hydroxide solids in 1litere of water will be large of its volume so it reduces to 361grams for
12molar concentrations.
F. Sodium Silicate
Sodium silicate in a liquid gel form with a composition of 55.52% of water, 29.75% SiO2 and 14.73% Na2O was used
in the present study.
G. Alkaline solution preparation
Alkaline solution was prepared by mixing sodium hydroxide and sodium silicate at the room temperature in the ratio
1:2.5. When both the solutions are mixed together polymerization takes place and it liberates large amount of heat so
it is left for 20 to 30minutes and thus the alkaline liquid is ready as binding agent.
H. Mix Proportions
For the present study, twelve mixes with flyash was replaced with GGBS at 0%, 30%, 50%, and 70% by mass. M1,
M2, M3, M4 respectively for 8 Molarity and M5, M6, M7, M8 respectively for 10 Molarity and M9, M10, M11, M12
respectively for 12 Molarity as show in Table II. The fluid to binder (F/B) ratio by mass for all the mixes was
maintained at 0.47 and the total binder content was fixed at 400 kg/m3. To obtain the required workability
characteristics of SCGC, a super plasticizer (S.P) content of 3% was kept constant for Mix M1, M5 and M9 and S.P
content of 4% was kept constant for rest of the mix and Extra water content was varied according to the molarities by
mass for the binder as shown in Table II.
I. Preparation of fresh SCGC, Casting, and Curing of Specimens
Initially a well-shacked premixed liquid mixture containing alkaline solution, superplasticiser, and extra water was
prepared according to the required proportion and then a fine powdered materials like flyash, GGBS, and M-Sand
were blended manually in a pan mixer and then the coarse aggregate in saturated surface dry condition was added to
the mixer and mixed mechanically for about 2.5min. At the end of dry mixing, this premixed liquid was added in the
mixer and mixing was continued for another 2.5 to 3min. This freshly prepared concrete mix was then accessed for
essential workability test required for characterizing SCC. Slump-flow, T50 slump flow, L-box, V-Funnel, and J-Ring
test were performed for this purpose.
International Journal of Pure and Applied Mathematics Special Issue
1371
After testing SCGC in fresh state, the fresh concrete was again thoroughly mixed by hand and poured into the moulds
of cubes, cylinder, and prism without any compaction and allowing it to fill all the corners of the mould by its own
weight for testing compressive strength, split tensile strength, and flexural strength respectively. All the specimens
was kept in oven for 24hours maintained at a temperature of 700C for curing and after 24hours the specimens were
taken out of oven and it was demoulded and it was kept for ambient curing till the respective test dates.
TABLE II: Mix proportion for SCGC
Mix Proportion Flyash
(Kg/m3)
GGBS
(Kg/m3)
M-Sand
(Kg/m3)
Coarse
Aggregate
(Kg/m3)
(F/B)
Ratio
Molarity
(M)
S.P
(%)
Extra
Water
(%)
M1 (FA 100%) 400 0 872 706 0.47 8M 3 1
M2 (FA 70% &
GGBS 30%) 280 153.6 872 706 0.47 8M 4 1
M3 (FA 50% &
GGBS 50%) 200 256 872 706 0.47 8M 4 4
M4 (FA 30% &
GGBS 70%) 120 358.4 872 706 0.47 8M 4 9
M5 (FA 100%) 400 0 872 706 0.47 10M 3 2
M6 (FA 70% &
GGBS 30%) 280 153.6 872 706 0.47 10M 4 2.5
M7 (FA 50% &
GGBS 50%) 200 256 872 706 0.47 10M 4 5.5
M8 (FA 30% &
GGBS 70%) 120 358.4 872 706 0.47 10M 4 10
M9 (FA 100%) 400 0 872 706 0.47 12M 3 3.5
M10 (FA 70%
& GGBS 30%) 280 153.6 872 706 0.47 12M 4 4
M11 (FA 50%
& GGBS 50%) 200 256 872 706 0.47 12M 4 7
M12 (FA 30%
& GGBS 70%) 120 358.4 872 706 0.47 12M 4 12
IV FRESH PROPERTIES AND TEST RESULTS OF SCGC
A. Fresh properties
As per EFNARC guidelines fresh properties of SCGC mixes were evaluated based on three basic characteristic of SCC
they are filling ability, passing ability, and resistance to segregation. In the present study this characteristic were
measured for all the molarities using five different types of test like Slump flow , T50 cm slump flow , V-Funnel,
L-Box J- Ring
Test methods and property along with their recommended values given by EFNARC are shown in Table III. And
workability test results of SCGC are shown in Table IV.
Table III: Test method, property and recommended values as per EFNARC
Sl.No Methods Workability
Property
Acceptance values as per
EFNARC Guide lines
Minimum Maximum
1 Slump flow by Abrams
cone Filling ability 650 mm 800mm
2 T50 cm Slump flow Filling ability 2 Sec 5 Sec
3 V-Funnel Filling ability 6 Sec 12 Sec
4 L-Box (H2/H1, ratio) Passing
ability 0.8 1
5 J-Ring Passing
ability 0 10
TABLE IV: Workability test results of SCGC
International Journal of Pure and Applied Mathematics Special Issue
1372
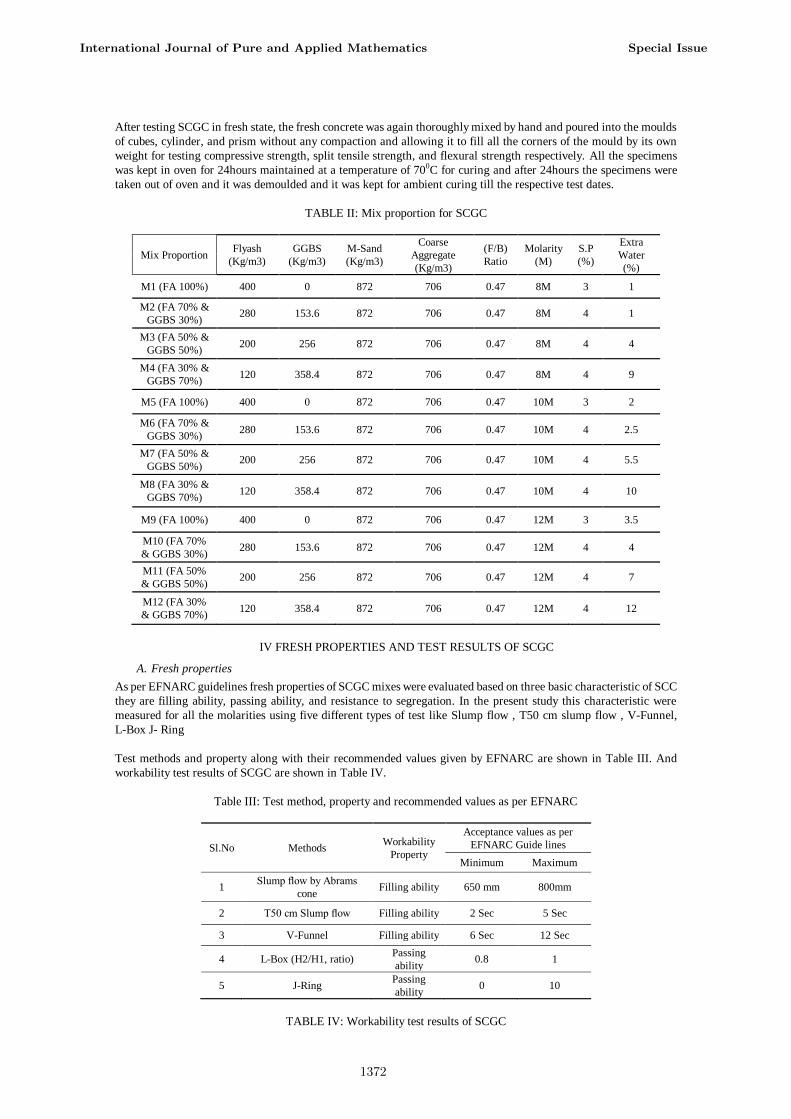
B. Test result of SCGC on slump flow
Fig. 3. Slump flow test for various molarities
Slump flow test was conducted as per the guidelines given in EFNARC. The results of slump flow test obtained for
various molarities are given in Table IV and the same as been plotted as shown in Fig 3. The test results indicate that
as the GGBS content increases the flow property decreases because GGBS particles are flaky and elongated in shape
and have large surface area as shown in Fig 2, and this results in high water demand and hence as a result concrete
workability decreases but still all the values were within specified limits. And as the molarity increases from 8M to
12M sodium hydroxide concentration increases and hence it becomes more cohesive and results in reduction of
workability of SCGC.
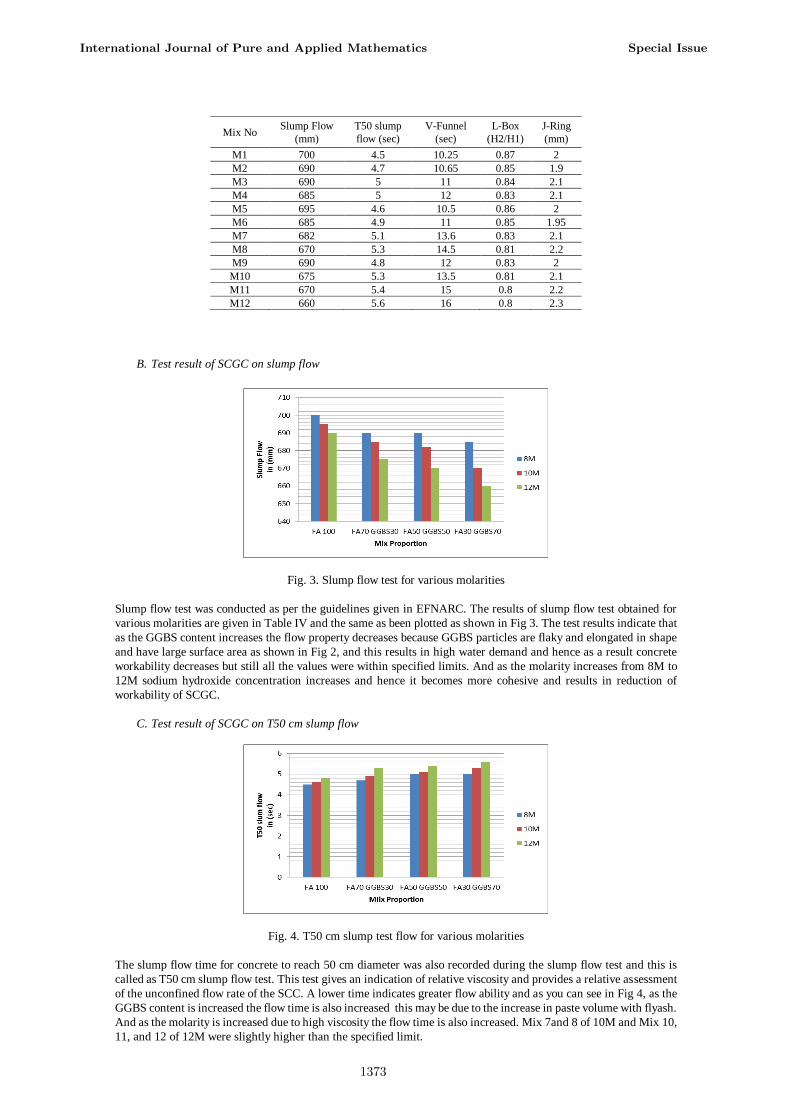
C. Test result of SCGC on T50 cm slump flow
Fig. 4. T50 cm slump test flow for various molarities
The slump flow time for concrete to reach 50 cm diameter was also recorded during the slump flow test and this is
called as T50 cm slump flow test. This test gives an indication of relative viscosity and provides a relative assessment
of the unconfined flow rate of the SCC. A lower time indicates greater flow ability and as you can see in Fig 4, as the
GGBS content is increased the flow time is also increased this may be due to the increase in paste volume with flyash.
And as the molarity is increased due to high viscosity the flow time is also increased. Mix 7and 8 of 10M and Mix 10,
11, and 12 of 12M were slightly higher than the specified limit.
Mix No Slump Flow
(mm)
T50 slump
flow (sec)
V-Funnel
(sec)
L-Box
(H2/H1)
J-Ring
(mm)
M1 700 4.5 10.25 0.87 2
M2 690 4.7 10.65 0.85 1.9
M3 690 5 11 0.84 2.1
M4 685 5 12 0.83 2.1
M5 695 4.6 10.5 0.86 2
M6 685 4.9 11 0.85 1.95
M7 682 5.1 13.6 0.83 2.1
M8 670 5.3 14.5 0.81 2.2
M9 690 4.8 12 0.83 2
M10 675 5.3 13.5 0.81 2.1
M11 670 5.4 15 0.8 2.2
M12 660 5.6 16 0.8 2.3
International Journal of Pure and Applied Mathematics Special Issue
1373
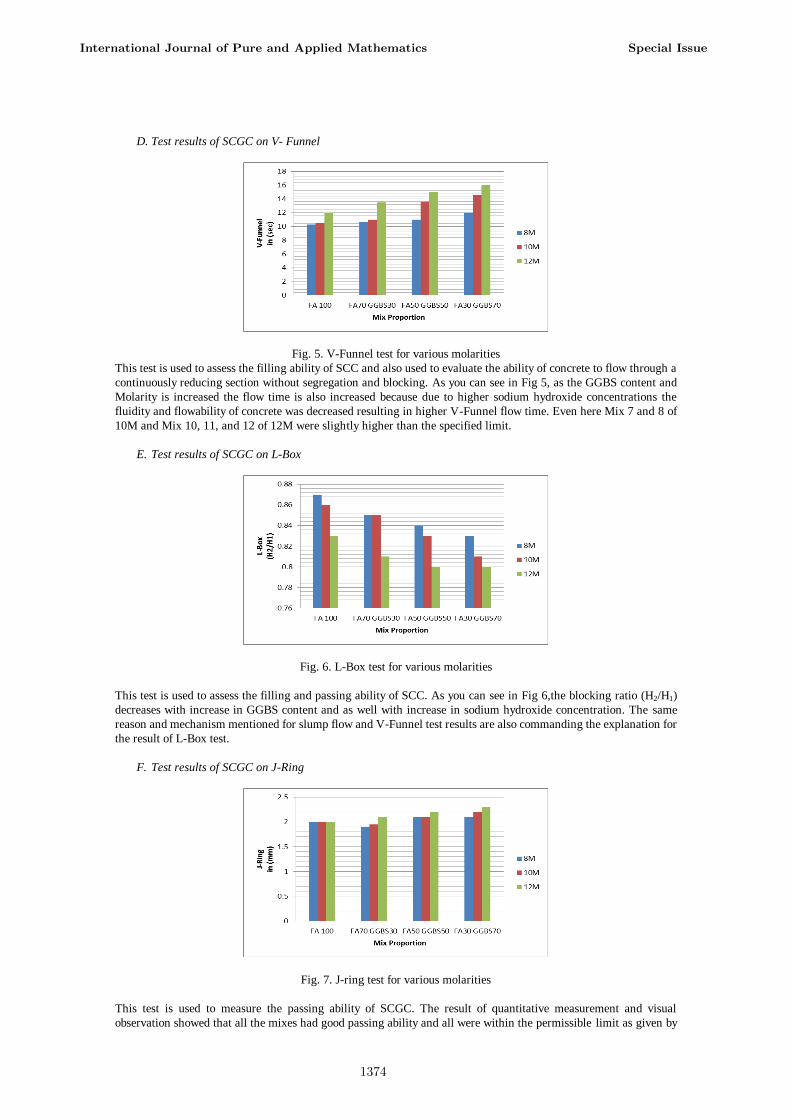
D. Test results of SCGC on V- Funnel
Fig. 5. V-Funnel test for various molarities
This test is used to assess the filling ability of SCC and also used to evaluate the ability of concrete to flow through a
continuously reducing section without segregation and blocking. As you can see in Fig 5, as the GGBS content and
Molarity is increased the flow time is also increased because due to higher sodium hydroxide concentrations the
fluidity and flowability of concrete was decreased resulting in higher V-Funnel flow time. Even here Mix 7 and 8 of
10M and Mix 10, 11, and 12 of 12M were slightly higher than the specified limit.
E. Test results of SCGC on L-Box
Fig. 6. L-Box test for various molarities
This test is used to assess the filling and passing ability of SCC. As you can see in Fig 6,the blocking ratio (H2/H1)
decreases with increase in GGBS content and as well with increase in sodium hydroxide concentration. The same
reason and mechanism mentioned for slump flow and V-Funnel test results are also commanding the explanation for
the result of L-Box test.
F. Test results of SCGC on J-Ring
Fig. 7. J-ring test for various molarities
This test is used to measure the passing ability of SCGC. The result of quantitative measurement and visual
observation showed that all the mixes had good passing ability and all were within the permissible limit as given by
International Journal of Pure and Applied Mathematics Special Issue
1374
EFNARC, as shown in Fig 7. The result indicated that as the molarity and percentage of GGBS increased the
flowability and passing ability of fresh concrete reduced and as a result J-Ring values was also increased.
V. MECHANICAL PROPERTIES AND TEST RESULTS OF SCGC
Three different types of test were conducted on mechanical properties like
Compressive strength,
Split tensile strength,
Flexural strength
The test were conducted for all the molarities like 8M, 10M, and 12M at the end of 7days, 28days, and 56days as
shown in Table V.
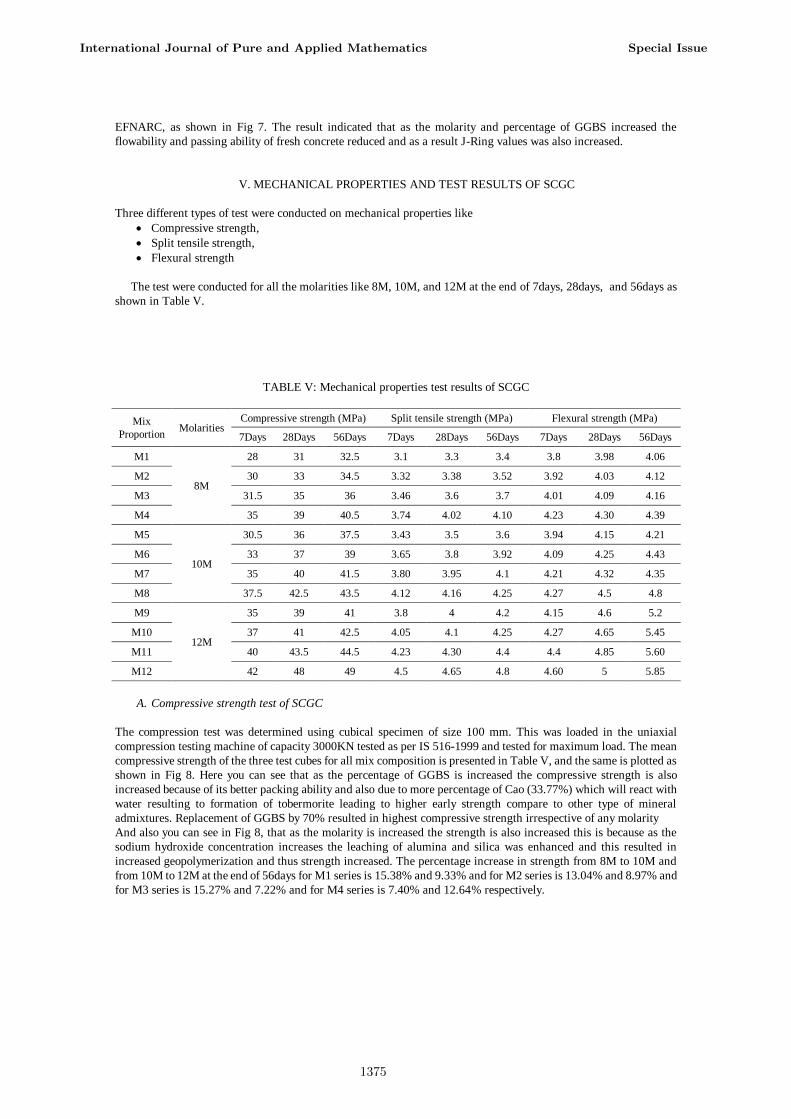
TABLE V: Mechanical properties test results of SCGC
Mix
Proportion Molarities
Compressive strength (MPa) Split tensile strength (MPa) Flexural strength (MPa)
7Days 28Days 56Days 7Days 28Days 56Days 7Days 28Days 56Days
M1
8M
28 31 32.5 3.1 3.3 3.4 3.8 3.98 4.06
M2 30 33 34.5 3.32 3.38 3.52 3.92 4.03 4.12
M3 31.5 35 36 3.46 3.6 3.7 4.01 4.09 4.16
M4 35 39 40.5 3.74 4.02 4.10 4.23 4.30 4.39
M5
10M
30.5 36 37.5 3.43 3.5 3.6 3.94 4.15 4.21
M6 33 37 39 3.65 3.8 3.92 4.09 4.25 4.43
M7 35 40 41.5 3.80 3.95 4.1 4.21 4.32 4.35
M8 37.5 42.5 43.5 4.12 4.16 4.25 4.27 4.5 4.8
M9
12M
35 39 41 3.8 4 4.2 4.15 4.6 5.2
M10 37 41 42.5 4.05 4.1 4.25 4.27 4.65 5.45
M11 40 43.5 44.5 4.23 4.30 4.4 4.4 4.85 5.60
M12 42 48 49 4.5 4.65 4.8 4.60 5 5.85
A. Compressive strength test of SCGC
The compression test was determined using cubical specimen of size 100 mm. This was loaded in the uniaxial
compression testing machine of capacity 3000KN tested as per IS 516-1999 and tested for maximum load. The mean
compressive strength of the three test cubes for all mix composition is presented in Table V, and the same is plotted as
shown in Fig 8. Here you can see that as the percentage of GGBS is increased the compressive strength is also
increased because of its better packing ability and also due to more percentage of Cao (33.77%) which will react with
water resulting to formation of tobermorite leading to higher early strength compare to other type of mineral
admixtures. Replacement of GGBS by 70% resulted in highest compressive strength irrespective of any molarity
And also you can see in Fig 8, that as the molarity is increased the strength is also increased this is because as the
sodium hydroxide concentration increases the leaching of alumina and silica was enhanced and this resulted in
increased geopolymerization and thus strength increased. The percentage increase in strength from 8M to 10M and
from 10M to 12M at the end of 56days for M1 series is 15.38% and 9.33% and for M2 series is 13.04% and 8.97% and
for M3 series is 15.27% and 7.22% and for M4 series is 7.40% and 12.64% respectively.
International Journal of Pure and Applied Mathematics Special Issue
1375
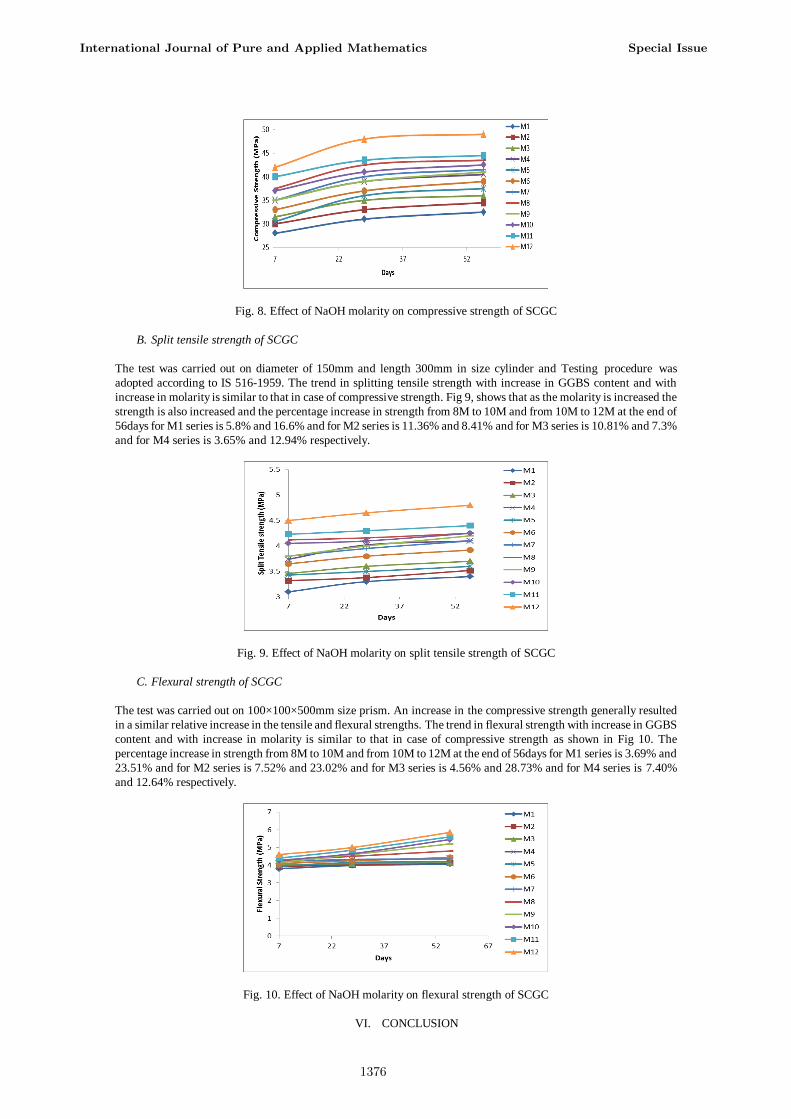
Fig. 8. Effect of NaOH molarity on compressive strength of SCGC
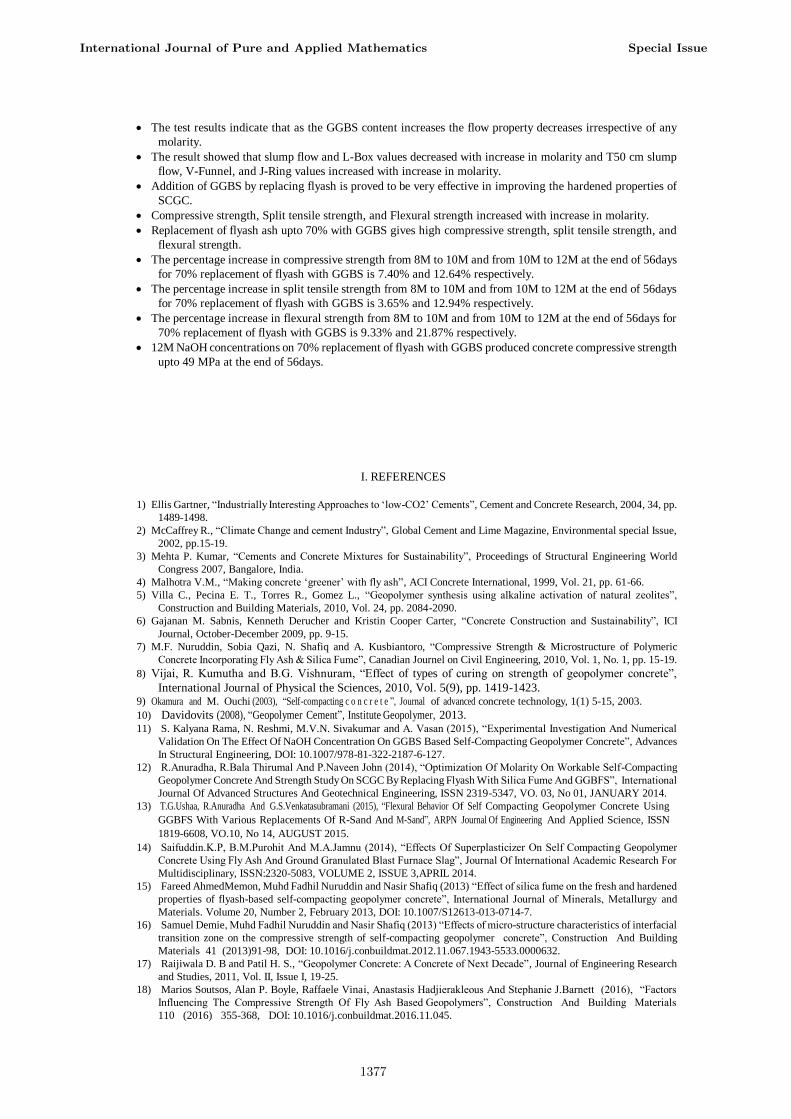
B. Split tensile strength of SCGC
The test was carried out on diameter of 150mm and length 300mm in size cylinder and Testing procedure was
adopted according to IS 516-1959. The trend in splitting tensile strength with increase in GGBS content and with
increase in molarity is similar to that in case of compressive strength. Fig 9, shows that as the molarity is increased the
strength is also increased and the percentage increase in strength from 8M to 10M and from 10M to 12M at the end of
56days for M1 series is 5.8% and 16.6% and for M2 series is 11.36% and 8.41% and for M3 series is 10.81% and 7.3%
and for M4 series is 3.65% and 12.94% respectively.
Fig. 9. Effect of NaOH molarity on split tensile strength of SCGC
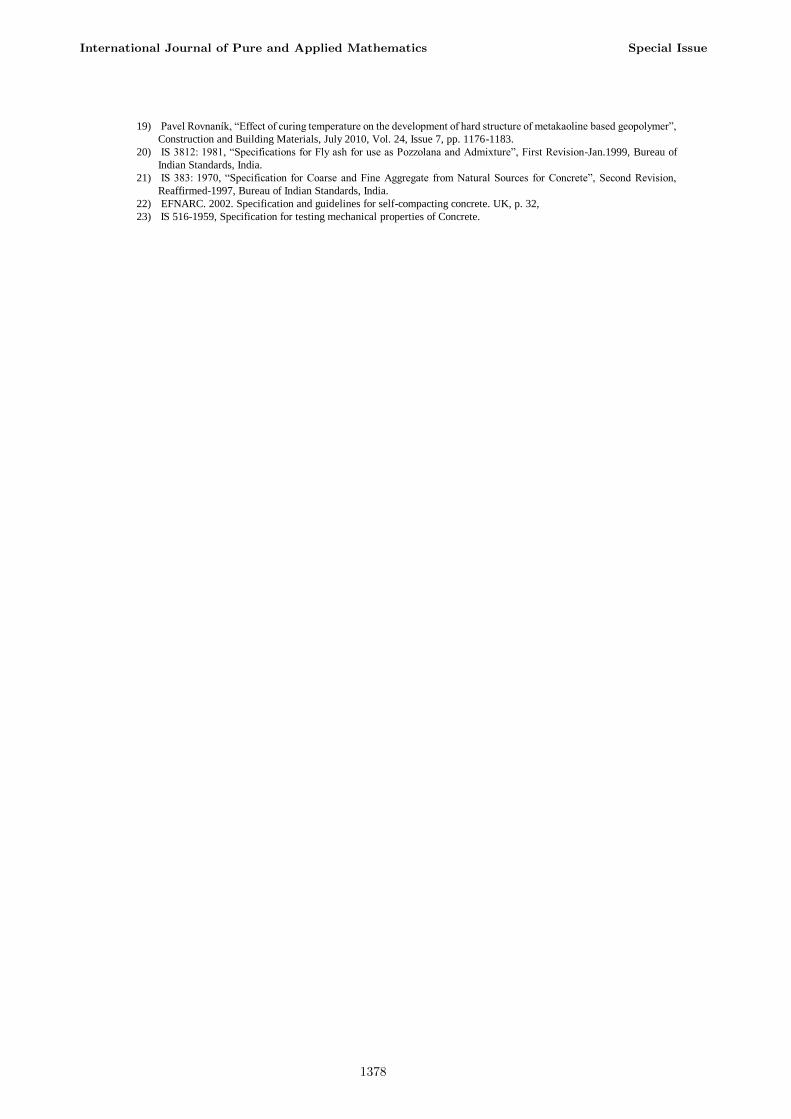
C. Flexural strength of SCGC
The test was carried out on 100×100×500mm size prism. An increase in the compressive strength generally resulted
in a similar relative increase in the tensile and flexural strengths. The trend in flexural strength with increase in GGBS
content and with increase in molarity is similar to that in case of compressive strength as shown in Fig 10. The
percentage increase in strength from 8M to 10M and from 10M to 12M at the end of 56days for M1 series is 3.69% and
23.51% and for M2 series is 7.52% and 23.02% and for M3 series is 4.56% and 28.73% and for M4 series is 7.40%
and 12.64% respectively.
Fig. 10. Effect of NaOH molarity on flexural strength of SCGC
VI. CONCLUSION
International Journal of Pure and Applied Mathematics Special Issue
1376
The test results indicate that as the GGBS content increases the flow property decreases irrespective of any
molarity.
The result showed that slump flow and L-Box values decreased with increase in molarity and T50 cm slump
flow, V-Funnel, and J-Ring values increased with increase in molarity.
Addition of GGBS by replacing flyash is proved to be very effective in improving the hardened properties of
SCGC.
Compressive strength, Split tensile strength, and Flexural strength increased with increase in molarity.
Replacement of flyash ash upto 70% with GGBS gives high compressive strength, split tensile strength, and
flexural strength.
The percentage increase in compressive strength from 8M to 10M and from 10M to 12M at the end of 56days
for 70% replacement of flyash with GGBS is 7.40% and 12.64% respectively.
The percentage increase in split tensile strength from 8M to 10M and from 10M to 12M at the end of 56days
for 70% replacement of flyash with GGBS is 3.65% and 12.94% respectively.
The percentage increase in flexural strength from 8M to 10M and from 10M to 12M at the end of 56days for
70% replacement of flyash with GGBS is 9.33% and 21.87% respectively.
12M NaOH concentrations on 70% replacement of flyash with GGBS produced concrete compressive strength
upto 49 MPa at the end of 56days.
I. REFERENCES
1) Ellis Gartner, “Industrially Interesting Approaches to „low-CO2‟ Cements”, Cement and Concrete Research, 2004, 34, pp.
1489-1498.
2) McCaffrey R., “Climate Change and cement Industry”, Global Cement and Lime Magazine, Environmental special Issue,
2002, pp.15-19.
3) Mehta P. Kumar, “Cements and Concrete Mixtures for Sustainability”, Proceedings of Structural Engineering World
Congress 2007, Bangalore, India.
4) Malhotra V.M., “Making concrete „greener‟ with fly ash”, ACI Concrete International, 1999, Vol. 21, pp. 61-66.
5) Villa C., Pecina E. T., Torres R., Gomez L., “Geopolymer synthesis using alkaline activation of natural zeolites”,
Construction and Building Materials, 2010, Vol. 24, pp. 2084-2090.
6) Gajanan M. Sabnis, Kenneth Derucher and Kristin Cooper Carter, “Concrete Construction and Sustainability”, ICI
Journal, October-December 2009, pp. 9-15.
7) M.F. Nuruddin, Sobia Qazi, N. Shafiq and A. Kusbiantoro, “Compressive Strength & Microstructure of Polymeric
Concrete Incorporating Fly Ash & Silica Fume”, Canadian Journel on Civil Engineering, 2010, Vol. 1, No. 1, pp. 15-19.
8) Vijai, R. Kumutha and B.G. Vishnuram, “Effect of types of curing on strength of geopolymer concrete”,
International Journal of Physical the Sciences, 2010, Vol. 5(9), pp. 1419-1423. 9) Okamura and M. Ouchi (2003), “Self-compacting c o n c r e t e ”, Journal of advanced concrete technology, 1(1) 5-15, 2003.
10) Davidovits (2008), “Geopolymer Cement”, Institute Geopolymer, 2013. 11) S. Kalyana Rama, N. Reshmi, M.V.N. Sivakumar and A. Vasan (2015), “Experimental Investigation And Numerical
Validation On The Effect Of NaOH Concentration On GGBS Based Self-Compacting Geopolymer Concrete”, Advances
In Structural Engineering, DOI: 10.1007/978-81-322-2187-6-127.
12) R.Anuradha, R.Bala Thirumal And P.Naveen John (2014), “Optimization Of Molarity On Workable Self-Compacting
Geopolymer Concrete And Strength Study On SCGC By Replacing Flyash With Silica Fume And GGBFS”, International
Journal Of Advanced Structures And Geotechnical Engineering, ISSN 2319-5347, VO. 03, No 01, JANUARY 2014.
13) T.G.Ushaa, R.Anuradha And G.S.Venkatasubramani (2015), “Flexural Behavior Of Self Compacting Geopolymer Concrete Using
GGBFS With Various Replacements Of R-Sand And M-Sand”, ARPN Journal Of Engineering And Applied Science, ISSN
1819-6608, VO.10, No 14, AUGUST 2015.
14) Saifuddin.K.P, B.M.Purohit And M.A.Jamnu (2014), “Effects Of Superplasticizer On Self Compacting Geopolymer
Concrete Using Fly Ash And Ground Granulated Blast Furnace Slag”, Journal Of International Academic Research For
Multidisciplinary, ISSN:2320-5083, VOLUME 2, ISSUE 3,APRIL 2014.
15) Fareed AhmedMemon, Muhd Fadhil Nuruddin and Nasir Shafiq (2013) “Effect of silica fume on the fresh and hardened
properties of flyash-based self-compacting geopolymer concrete”, International Journal of Minerals, Metallurgy and
Materials. Volume 20, Number 2, February 2013, DOI: 10.1007/S12613-013-0714-7.
16) Samuel Demie, Muhd Fadhil Nuruddin and Nasir Shafiq (2013) “Effects of micro-structure characteristics of interfacial
transition zone on the compressive strength of self-compacting geopolymer concrete”, Construction And Building
Materials 41 (2013)91-98, DOI: 10.1016/j.conbuildmat.2012.11.067.1943-5533.0000632.
17) Raijiwala D. B and Patil H. S., “Geopolymer Concrete: A Concrete of Next Decade”, Journal of Engineering Research
and Studies, 2011, Vol. II, Issue I, 19-25.
18) Marios Soutsos, Alan P. Boyle, Raffaele Vinai, Anastasis Hadjierakleous And Stephanie J.Barnett (2016), “Factors
Influencing The Compressive Strength Of Fly Ash Based Geopolymers”, Construction And Building Materials
110 (2016) 355-368, DOI: 10.1016/j.conbuildmat.2016.11.045.
International Journal of Pure and Applied Mathematics Special Issue
1377
19) Pavel Rovnaník, “Effect of curing temperature on the development of hard structure of metakaoline based geopolymer”,
Construction and Building Materials, July 2010, Vol. 24, Issue 7, pp. 1176-1183.
20) IS 3812: 1981, “Specifications for Fly ash for use as Pozzolana and Admixture”, First Revision-Jan.1999, Bureau of
Indian Standards, India.
21) IS 383: 1970, “Specification for Coarse and Fine Aggregate from Natural Sources for Concrete”, Second Revision,
Reaffirmed-1997, Bureau of Indian Standards, India.
22) EFNARC. 2002. Specification and guidelines for self-compacting concrete. UK, p. 32,
23) IS 516-1959, Specification for testing mechanical properties of Concrete.
International Journal of Pure and Applied Mathematics Special Issue
1378
BIOGRAPHIES
I Arun B R, am a full time Research Scholar in U.V.C.E., Bangalore University, since
2015. I did my M.E degree in „Construction Technology‟ from U.V.C.E., Bangalore
University in the year 2010 to 2012, and B.E degree from R.V.C.E., VTU, Bangalore in the
year 2006 to 2010. I have 2years of industry experience in NIRMAN CONSTRUCTIONS,
Bangalore. I have Three years of teaching experience in U.V.C.E., Evening College,
Bangalore. I have published two papers in international conferences and one paper in an
international journal covering areas of concrete technology. I have attended 2 workshops
on various subjects. My area of research interests are concrete technology, geopolymer
concrete, alternative and smart materials for concrete, self-compacting concrete etc., My subject areas include
Building materials and construction, Concrete technology, Structural analysis-I & II, Steel design and drawing,
Survey, Building Planning and Drawing, etc.
Dr. P S Nagaraja, working has Associate Professor, Civil Engineering Department, UVCE,
Bangalore. He holds Ph.D. degree from UVCE, Bangalore, and M. E. degree in Construction
Technology, from UVCE, Bangalore and B. E. degree in Civil Engineering from UVCE,
Bangalore. He has 29 years of teaching experience. He has published 11 international journal
papers and has presented more than 40 papers in international and national conferences. He
has attended and conducted more than 50 seminars and workshops. Four Ph.D. degrees have
been awarded under his guidance and presently he is guiding 8 research scholars for award of
their Ph.D. in Civil Engineering. He has guided 60 dissertations for Construction Technology
students. He is a member in technical organizations such as Institution of Engineers (India), Indian Concrete
Institute, Indian society of Technical Education, Indian Geotechnical society, etc. His research areas are special
concretes, Prestressed Concrete, Fibre Reinforced Concrete, Geopolymer Concrete, and Smart Materials.
Author‟s formal
photo
Author‟s formal
photo
International Journal of Pure and Applied Mathematics Special Issue
1379

1380