Combined Effect of Antibiotics and Ocean … Effect of Antibiotics and Ocean Acidification on Marine...
29
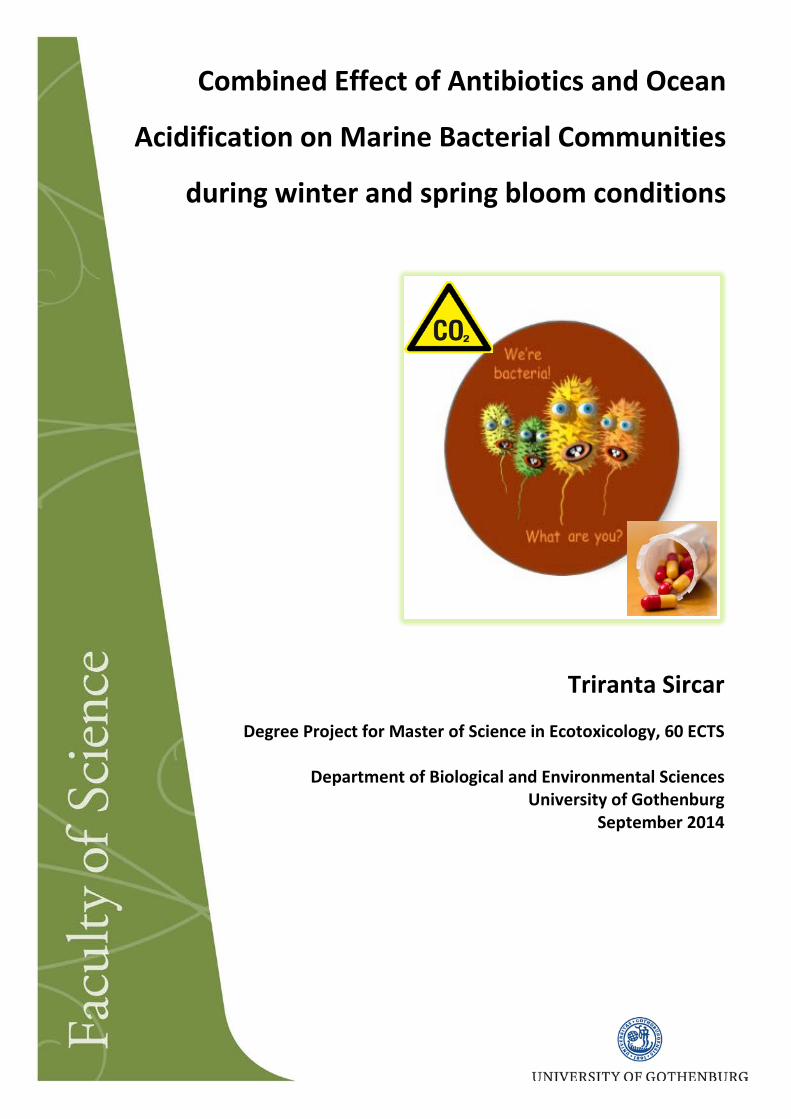
Combined Effect of Antibiotics and Ocean Acidification on Marine Bacterial Communities during winter and spring bloom conditions Triranta Sircar Degree Project for Master of Science in Ecotoxicology, 60 ECTS Department of Biological and Environmental Sciences University of Gothenburg September 2014
Transcript of Combined Effect of Antibiotics and Ocean … Effect of Antibiotics and Ocean Acidification on Marine...
Combined Effect of Antibiotics and Ocean
Acidification on Marine Bacterial Communities
during winter and spring bloom conditions
Triranta Sircar
Degree Project for Master of Science in Ecotoxicology, 60 ECTS
Department of Biological and Environmental Sciences University of Gothenburg
September 2014
1
Combined Effect of Antibiotics and Ocean Acidification on Marine Bacterial Communities during winter and spring bloom conditions
ABSTRACT
As the atmospheric CO2 concentration increases, more CO2 will dissolve in the ocean resulting in a
reduction of pH and changes in the carbonate system affecting biogeochemical processes
consequently affecting marine microbial ecosystems. Contamination of the ocean with antibiotics, its
input, fate and effect on marine microbial communities has also been reported in recent studies.
Change in physico-chemical properties of antibiotics with change in environmental pH is being
studied extensively in the field of pharmaceuticals. This change in physico-chemical properties in
antibiotics increases or decreases its toxicity and bioaccumulation within a cell. The change in
oceanic pH will induce change physico-chemical properties of the antibiotics being released into the
ocean leading to increase or decrease in its toxicity towards marine bacterial communities. To
investigate the combined effect of antibiotics and ocean acidification on marine bacteria, a series of
ocean acidification experiments were conducted with natural pelagic bacterial communities from the
Gullmar fjord. Seasonal variability in bacterial diversity was accounted for by repeating the
experiment twice (during autumn and spring). The pH levels investigated were in situ seawater pH
8.1 and pH 7.7 representing the present day situation and acidification scenario predicted for the
year 2100. Amoxicillin and Ciprofloxacin were the two antibiotics tested due their extensive use,
traces in marine environment and amphoteric nature under varied pH levels. Change in bacterial
number and diversity were observed under epifluorescence microscope using DAPI (4',6- diamidino-
2-phenyindole dilactate) stain and bacterial activity was recorded by measuring incorporation of
radio-labeled amino acid (leucine) into protein. Both DAPI staining and leucine incorporation
revealed change in total bacteria number and shift in bacteria community composition due to
combined stress of antibiotics and ocean acidification. Bacteria cell numbers declined, while bacteria
protein incorporation increased, at low pH amoxicillin and high pH ciprofloxacin treatment,
respectively during autumn bloom. Less diverse bacterial community in autumn were more sensitive
to the combined stress compared to the more diverse bacterial community in spring. From our study
we can conclude pH actually moderates the effects of antibiotics in a natural setting with season
specific marine bacterial communities. As predicted, amoxicillin became more toxic at low pH than at
high pH and Ciprofloxacin more toxic at high pH that at low pH.
2
TABLE OF CONTENTS
Abstract…………………………………………………………………………………………………………………………...1
Introduction………………………………………………………………………………………………………………….….3
Materials and Methods……………………………………………………………………………………………….……6
Sample Collection…………………………………………………………………………………………………….…….6
Bacterial growth, numbers and diversity………………………………………………………………………..8
Cell enumeration using DAPI staining……………………………………………………………………….….8
Bacteria community diversity……………………………………………………………………………………….8
Leucine incorporation…………………………………………………………………………………………………..9
Statistics and calculations………………………………………………………………………………………..…..9
Results……………………………………………………………………………………………………………………………11
Water Chemistry…………………………………………………………………………………………………………..11
Effects of season and time on bacterial numbers………………………………………………………….12
Effects of season and time on bacteria community diversity………………………………………..14
Effects of season and time on bacterial protein production………………………………………….19
Discussion……………………………………………………………………………………………………………………….22
Conclusion………………………………………………………………………………………………………………………25
References………………………………………………………………………………………………………………………26
3
INTRODUCTION
One third of the anthropogenic carbon dioxide released into the atmosphere each year is absorbed
by the ocean water (Sabine et al, 2004). According to the Intergovernmental Panel on Climate
Change (IPCC) (2007) the carbon dioxide concentration in ocean surface water will increase almost
three fold by the end of this century. This increase will result in a reduction in the ocean pH by
around 0.35 units by the end of 2100 (Wolf-Gladrow et al. 1999). Most of the dissolved carbon
dioxide will initially be stored in the upper 200 meters of the seas, and potentially affect the pelagic
ecosystem in surface waters (Grossart et al. 2006).
Marine heterotrophy is a process by which autotrophically synthesized organic compounds are
transformed and respired by animals and microorganisms. Following phytoplankton blooms, the
aggregation and sinking flux of organic matter is an important aspect of material transport out of the
euphotic zone (Takahashi, 1986). Heterotrophic bacteria utilize a large fraction of sinking particulate
organic matter (Weibinga et al., 1998). Interaction between sinking organic matter and heterotrophic
bacteria in pelagic ecosystems is important in supporting life below the euphotic zone (Fuhrman et
al., 1989). Dissolved and particulate organic carbon (DOC/POC) are the principle energy sources for
heterotrophic bacteria in the pelagic environment (Azam et al. 1983). Changes in pCO2 will results in
qualitative and quantitative changes in POC, which in turn can influence the activity of free-living and
particle-associated bacteria. Changes in bacterial action on POC can affect energy and nutrient fluxes
in the microbial loop and consequently have a strong influence on global oceanic carbon cycle (Azam,
1998). Slight changes in pH show direct effects on bacterial community composition as observed in a
microcosm experiment performed in darkness with water samples from North sea during spring
summer, autumn and winter (Krause et al. 2012). Shifts in community structure were also observed
at pH 7.82, which indicates that a slight difference in ocean pH is as crucial changes in the phosphate,
silicate and ammonia concentrations. Bacterial protein production (BPP) is likely to be affected by
seasonal variations and pH alterations as observed in a mesocosm experiment showing temporal
variability with BPP increase during an induced algal bloom (Grossart et al. 2006). Marine
microorganisms play a crucial role in the global biogeochemical cycles and functioning of marine
ecosystems (Azam and Malfatti, 2007). If these processes are disturbed by ocean acidification it will
likely cause changes in the functioning of the global ocean and marine ecosystems. Different theories
have been presented on how lowered ocean pH will affect marine microbes. One theory predicts
little or no effects on microbial community structure, since microbes as a group appear to be resilient
to biogeochemical change (Joint et al. 2011). Gates (2002) however, warns that this could be a
misleading statement underestimating the threat of ocean acidification to marine microbes.
4
Pharmaceutical products, particularly antibiotics were extensively used in human and veterinary
medicine as well as in aquaculture as prophylaxis or for treating microbial infections (Lutzhoft et al.
1998). 100,000 to 200,000 tons of antibiotics were estimated to be used worldwide in 2002 (Wise
2002). 3350 tons of antimicrobials including antibiotics were consumed in 29 countries of Europe in
2007 (EFSA J 2009). This extensive use of antibiotics has led to concerns about possible impacts, not
only on terrestrial ecosystems but also on marine ecosystems. Monitoring studies have detected
antibiotic concentrations in the ng- µg/l range in European waste water (Larsson et al 2007). In
addition, runoff from farm lands also contributes to the risk of maintaining and inducing antibiotic
resistance in bacteria in the marine environment (Kim and Aga 2007, Kummerer 2009b). In Sweden,
penicillins; macrolides; sulfonamides; trimethoprim; fluoroquinolones; cephalosporins; tetracyclines
are the groups of antibiotics most widely used. The main route for emission of household
pharmaceuticals into the environment is through sewage treatment plants (STPs). The wastewater
treatment has no specific cleaning step for pharmaceuticals, and only partly eliminates the
antibiotics and thus allows their outlet into coastal environments (Lindberg et al. 2005). The different
groups of antibiotics contain both acidic and alkaline functional groups sometimes (?) within the
same molecule. The functional groups in a molecule influence its physiochemical and biological
properties such as pKa, sorption behavior, photo-reactivity, antibiotic activity and most importantly
its bioavailability. The bioavailability and toxicity of such amphoteric antibiotics may thus alter with
change in pH. Depending on pH conditions antibiotics may be cationic, anionic or neutral (zwitter
ionic) (Cunningham, 2008).
Approximately 4 tons of ciprofloxacin and amoxicillin were consumed as household pharmaceuticals
in 2002 (Swedish Medical Product Agency 2011, Qiang and Adams 2004). Their extensive use in
combination with change in molecular behavior with change in pH makes them the focus of our
study in relation to seawater pCO2 or ocean acidification. Both antibiotics change their charge
precisely in the pH span relevant to current and predicted pCO2 conditions in 100 years due to ocean
acidification. Ciprofloxacin (Cip) inhibits bacterial replication by blocking the DNA replication pathway
through binding to the A-subunit of DNA-gyrase (Hooper 1999). The Cip molecule contains one
carboxylic and three basic nitrogen sites. It dissociates into three different active species Cip2+, Cip+,
Cip in the pH 6-8 span (Qiang and Adams 2004). At the iso-electric point of Cip (pH 7.4) the molecule
carries both positive and negative charges and the molecule becomes a neutral zwitter ion. It is then
considered more toxic since it more easily passes through the cell membrane as an uncharged
molecule (Manallack 2007). During pH change, Cip zwitterions can either interact with H+/OH- ions
and become polar, or with carboxylate oxygen atoms to form bidentate chelate bridges and
precipitate as colloidal iron oxide-ciprofloxacin in marine environment (Gu and Karthikeyan 2005).
Amoxicillin (Amox) inhibits the cross-linkage between the linear peptidoglycan polymer chains that
5
make up a major component of the cell walls of both Gram-positive and Gram-negative bacteria. The
incorrect formation of the bacterial wall produces an osmotic imbalance that affects bacteria in their
growth phase leading to lysis of the bacterial cell wall (Weber et al. 2012). Amox contains one
carboxylic, one amine and one phenol group (Alekseev 2010) and thus has three dissociation
equilibria. In a slightly basic aqueous media Amox is an anion, in neutral media it acts as a zwitter ion
and acidic media it behaves as a cation (Alekseev 2010).
At high pH the toxicity is high for bases and at low pH the toxicity is high for acids. The toxicity and
bioavailabilty of amphoteric antibiotics depend on the pH of the solvent (Rendal et al 2011).
Consequently, Amox will be more bioavailable and toxic at low pH and Cip will be more bioavailable
and toxic at high pH conditions. These features are key to predict the effects of these antibiotics in
the marine environment of present and future oceans. The adaptive capabilities or resistance
development in bacterial populations when exposed to antibiotics in marine environment determine
the diversity of the future microbial community. The change in the POC quality and quantity due to
pH reduction will determine the abundance of heterotrophic bacteria in the future marine
environment.
The aim of this study was to investigate the combined effects of pH and antibiotics on marine
bacteria communities, as part of natural plankton communities, collected during autumn and spring
bloom conditions. The antibiotics investigated were amoxicillin and ciprofloxacin, both occurring in
the marine environment as a result of human activities. The choice of antibiotics is based on their
typical behavior and change in bioavailability in marine water at different pCO2.
6
MATERIALS AND METHODS
Sample collection
Autumn:
Water was collected on November 08, 2011 in the Gullmar fjord (58°15.6'N 11°25.87' E) from the
chlorophyll maximum depth (water depth of 23 meters) more than 1 km off shore to avoid organic
matter run off. Water depth, temperature and chlorophyll content were obtained from a ADM-
Conductivity – Temperature- Depth sensor (CTD) and salinity was measured with a conductivity
meter. Around 250 l of water from the chlorophyll maximum depth was pumped using a submergible
pump (JSpump RS-750) into 10 l, 25 l and 50 l light-proof thermos containers with air tight lids. The
collected water was transferred into a larger thermos tank (capacity around 1000 l) and continuously
mixed to homogenize the water mass with a sterile rod prior to transfer to 5 l Erlenmeyer flasks. 4.5 l
of the homogenized sea water was siphoned into 5 l conical flask and placed in the water bath at 13
°C corresponding to ambient temperature conditions. The water temperature was maintained by
circulating deep sea water in the water bath. The air temperature in the experiment room was
maintained at 10 °C. The experiment was run in darkness to mimic the ambient scanty light source
with occasional light availability during the calibration of pH computers.
Mixing of the water in the flasks was maintained by slow and continuous bubbling of air, filtered
through GF/F filter using sterile silicon tubing and diffusers. The flasks were differentiated by pH 8.1
(the current pH of sea water) and 7.7 (the predicted pH of sea water in 2100), the two toxicant
treatments (amoxicillin and ciprofloxacin) and the two sampling times T1 (three days of exposure to
toxicants) and T2 (six days of exposure to toxicants). The low pH of 7.7 was achieved by dynamically
measuring and correcting the pH in the respective flasks using pH computers (AquaMedic) and
allowing slow bubbling of pure gaseous CO2 whenever the pH exceeded 7.75 units. The pH meter was
recalibrated once every day during the experiment.
Stock solutions of Amox and Cip (purity >98%, Sigma Aldrich) were prepared in sterile milliQ water
24 hours prior to use, at concentration 100 times higher than the test concentration. Cip stock was
made by slightly increasing the pH of the milliQ with four drops of 0.25 M sodium hydroxide (Merck)
to make Cip dissolve completely. Amox and Cip were added in respective treatment flasks once in the
beginning of the experiment, when the pH had become stable, to a nominal concentration of 20 ng l-
1. This concentration of Cip was chosen based on the screening of human antibiotic substance and
weekly mass flow in different STP's in Sweden (Lindberg et al. 2005). The final effluent released into
the sea had Cip concentration of 13 ng l-1 in 2002 and 32 ng l-1 in 2003. We used 20 ng l-1 as
concentrations of antibiotics close to the average concentration of both the years. The
concentration of Amox was chosen equal to the concentration of Cip used. The limit of quantification
7
for Amox in effluent in STP is as high as 74 ng l-1 while the recovery is as low as 5 ng l-1 (Lindberg et al.
2005) as the beta-lactam ring is easily degraded by base reagents, metal ions and oxidizing agents
(Deshpande et al. 2004). The use of much higher concentrations of Amox than the recovery
concentration was to ensure the presence of the molecule during the entire span of experiment
duration.
Spring:
Prior to sampling, the progress of the spring bloom was monitored twice a week from the third week
of January in the Gullmar fjord from the dock of SLC-Kristineberg. The water samples for monitoring
chlorophyll a and phaeopigments were collected from the surface and at depths of 1 m, 2 m, 3 m and
5 m. The experimental sampling day was chosen just after the peak of the phytoplankton bloom
where a sharp decline in the chlorophyll a content in the water was observed. Experimental water
was collected on 2012-03-08 in the Gullmar fjord (58°15.41'N 11°27.12'E) from the chlorophyll
maximum depth (11 meters). The water depth, temperature and cholorophyll A contents were
obtained with AMD CTD and salinity was measured with conductivity meter. Around 250 l of water
from the chlorophyll maximum depth was pumped through the submergable pump (JSpump RS-750)
and the water was subsequently filtered through a 90 µm plankton net into 10 l, 25 l and 50 l light-
proof thermos containers with air tight lids. The 90 µm plankton net was used to filter out larger
zooplankton that due to (?) an uneven distribution could have a strong top down impact on the
system in specific experimental flasks. This procedure is justified since investigating top-down effects
on marine bacterial communities is beyond the scope of this investigation. The fraction of organisms
removed after filtering was noted.
The collected water was transferred into a larger thermos tank (capacity around 1000l), mixed and
poured into 5 l Erlenmeyer flasks as described above. The flasks were placed a water bath with a
temperature of 3.5 °C corresponding to ambient conditions. The temperature was maintained in the
tank water by circulating it through a cooling unit by use of a pump. The thermo-constant
experiment room maintained an air temperature of 4 °C. Lighting was maintained at an intensity of
90 - 100 µmol s-1 and regulated according to the ambient day-night cycle (from 8:00 to 17:00). Water
was mixed in the flasks through constant air bubbling, and pH was regulated in the test systems as
described above. The pH was recorded twice daily and the pH meter was recalibrated accordingly.
The toxicants Cip and Amox were added in respective treatment flasks once in the beginning of the
experiment when the pH was stable in each of the low pH test flask. The nominal concentration of
the Cip and Amox was 40 ng l-1, twice as high as the concentration used in the autumn experiment.
The nominal concentration of Cip used was slightly higher than that found in the final effluent in
different STPs in Sweden (Lindberg et al. 2005). The abundance and diversity of bacterial community
8
was expected to be higher in spring experiment (just after spring bloom) than in autumn (Pinhassi et
al. 2004).
Bacterial growth, numbers and diversity
Cell enumeration using DAPI-staining
Forty ml of a well-mixed sea-water sample was fixed with 2 ml of 37% Formaldehyde (Merck)
reaching a final concentration of 5% (v/v) in 50 ml sterile Falcon tubes. A concentrated stock solution
(1 mg ml-1) of 4',6- diamidino-2-phenylindole dilactate DAPI (Sigma Aldrich) was freshly made in
sterile MilliQ water and stored at -20°C in the dark. The stock was brought to room temperature and
the DAPI stain was diluted to 0.1 µg ml-1 using sterile MilliQ water. 500 µl of the diluted DAPI stain
solution was added to 5 ml of the well-mixed sea-water sample and incubated for 15 to 20 minutes
at 6°C in darkness. One ml of the stained sample was filtered through 0,2 µm 25 mm black
polycarbonate filter (FRISENETTE ApS) with the shiny side up, and supported from beneath by a
cellulose acetate filter (0.45 µm 25 mm, FRISENETTE ApS). The underpressure was not exceeding -15
kPa. The damp black polycarbonate filter was placed on a glass slide (76 mm x 26 mm), a drop of 70%
glycerol (7:3 glycerol:1% PBS) was added on the filter and covered with coverslip 21 mm x 26 mm.
The prepared slide was observed under (Leica) microscope and the bacterial cells in a grid field (L
Plan 10 x, i.e. 10 mm x 10 mm) were counted under 1000 x magnification using ultraviolet light, blue
emission filter at excitation wavelength 350 and emission wavelength 470. 300 cells on the grid were
counted assuming uniform spread of cells on the filter.
Bacteria community diversity
Bacteria community diversity was measured differently during the November and March
experiments. In November, bacteria where observed under UV light microscope revealing the
presence of six morphologically different attached and free living bacteria. Their presence and
absence were recorded for each sample, while counting the bacteria cell using DAPI staining
technique. A color code was established for the abundance of each cell type in grids examined under
the microscope. A similar approach for bacteria community diversity was taken during the
experiment in March. However, in addition abundances of each of the different morphological types
of bacteria cells were recorded.
9
Leucine incorporation
Leucine incorporation was measured on bacterial communities according to the method by Smith
and Azam (1992). This measurement gives information on bacterial protein production rate and can
be converted into bacterial carbon production. Stock solutions of non-radioactive leucine (L-leucine)
and radioactive leucine (L-[4,5-3H]) were prepared. 1 l of L- leucine (Acro Organics) stock solution was
made in sterile milliQ water at a concentration of 8mg l-1. New diluted L-leucine was made fresh each
day in sterile milliQ at a concentration of 176 nM. The combination of diluted L-leucine and
L-[4,5-3H]leucine (Perkin Elmer) was freshly prepared for each test. Prior to collecting experimental
water, equal volumes of 3H-leucine (1 mCi ml-1, SA≈160 Ci mmol-1,Perkin Elmer) and L-leucin 8 mg l-1
(Acros Organics) were mixed. 10 µl of L-leucine and L-[4,5-3H] leucine mixture was added to 2.0 ml
sterile screw cap microcentrifuge tubes to obtain a final concentration of 40 nM upon addition of 1.7
ml sample water. To achieve a final concentration of 5% 89 µl of 100% (w/v) trichloroacetic acid
(TCA) (Sigma-Aldrich) was added to half of the total number of tubes serving as corresponding
blanks. All tubes were stored at 5°C and brought to incubation temperature of 13°C and 5°C during
autumn and spring experiments respectively (in accordance with the ambient water temperature)
just prior to incubation. The incubations were started by addition of 1.7 ml of homogenized sample
water to each tube. Two replicates and two blanks (killed controls) from each flask were incubated
for 60 minutes in darkness. The incubations were terminated by the addition of 89 µl of 100% TCA
(5% final concentration) followed by a 30 min continued incubation. The tubes were then centrifuged
(Eppendorf Centrifuge 5430R) for 10 minutes at 16000 x g and the radioactive supernatant was
discarded. The pellet was washed by addition of 1.5 ml of 5% TCA and vortex mixing. The samples
were centrifuged again for 10 minutes at 16000 x g and the radioactive supernatant was discarded.
The washing step was repeated three times. The pellet obtained after the three washing steps was
dissolved in 0.5 ml of Scintillation cocktail (Ultima Gold, Perkin Elmer) and placed upside down in
scintillation vials overnight and radio-assayed in a liquid scintillation counter (Beckman LS 6500).
Calculations and statistics
Bacterial cell numbers were counted in grid cells under the 1000 x objective lens of microscope and
then on the entire filter having a surface area of 4910714 mm2 resulting in number of cells ml-1 of the
sample water. The equation used is (Porter and Feig, 1980):
Number of bacterial cells ml-1= (Tot n/Tot N)* Tot fil
Tot n = Total number of bacteria cells observed in the grid under 1000 x microscope
Tot N = Total number of grids counted under 1000 x microscope
Tot fil = Total number of grids on the surface area of the filter= 4910714
10
Bacterial protein production was calculated from 3H-leucine incorporation using the following
equation:
BPP (g) = moles leucine inc * (100/7.3)* 131.2 * ID
= (DPM inc/ SA) *131.2
Where moles leucine inc = moles of exogenous leucine incorporated; 100/7.3 = 100/percentage of
leucine in protein; ID= intracellular isotope dilution of 3H-leucine. BPP can also be calculated directly
from intracellular pool specific activity (SA). 131.2 = formula weight of leucine (Simon and Azam
1989).
Bacterial protein production was calculated per number of cells in each treatment using the
equation:
BPP per cell (g) = BPP/ Tot cells
Where BPP is Bacterial protein production as calculated from the previous equation; Totcells = total
number of bacterial cells observed in each treatment.
Two-way orthogonal ANOVAs (Sigma Plot 11.2, Systat software, inc.) with pH and antibiotics as fixed
factors were used to calculate the effect of pH and antibiotics and their interaction on total bacteria
cell numbers and protein production rates for each treatment during November T1, T2 and March
experiments.
The presence and absence of morphologically different bacteria and the community diversity for
each experiment in November and March were analyzed using MDS and ANOSIM (PRIMER v6,
PRIMER-E Ltd).
11
RESULTS
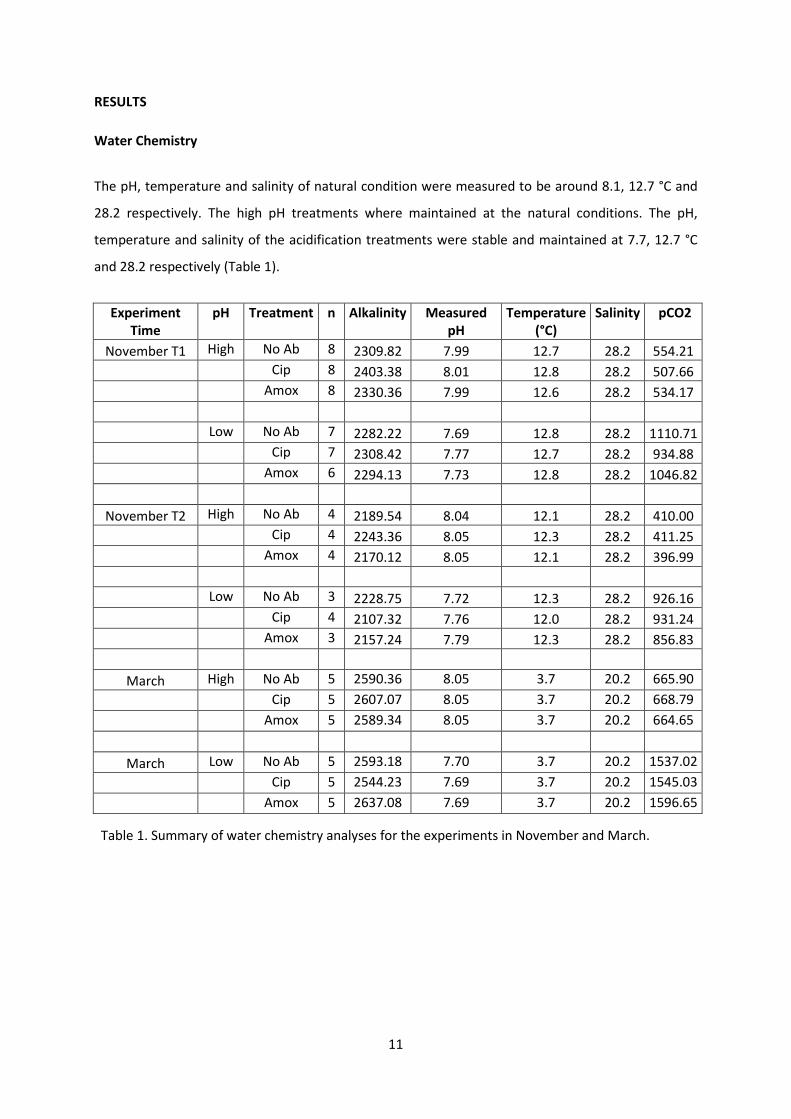
Water Chemistry
The pH, temperature and salinity of natural condition were measured to be around 8.1, 12.7 °C and
28.2 respectively. The high pH treatments where maintained at the natural conditions. The pH,
temperature and salinity of the acidification treatments were stable and maintained at 7.7, 12.7 °C
and 28.2 respectively (Table 1).
Experiment Time
pH Treatment n Alkalinity Measured pH
Temperature (°C)
Salinity pCO2
November T1 High No Ab 8 2309.82 7.99 12.7 28.2 554.21 Cip 8 2403.38 8.01 12.8 28.2 507.66 Amox 8 2330.36 7.99 12.6 28.2 534.17 Low No Ab 7 2282.22 7.69 12.8 28.2 1110.71 Cip 7 2308.42 7.77 12.7 28.2 934.88 Amox 6 2294.13 7.73 12.8 28.2 1046.82
November T2 High No Ab 4 2189.54 8.04 12.1 28.2 410.00 Cip 4 2243.36 8.05 12.3 28.2 411.25 Amox 4 2170.12 8.05 12.1 28.2 396.99 Low No Ab 3 2228.75 7.72 12.3 28.2 926.16 Cip 4 2107.32 7.76 12.0 28.2 931.24 Amox 3 2157.24 7.79 12.3 28.2 856.83
March High No Ab 5 2590.36 8.05 3.7 20.2 665.90 Cip 5 2607.07 8.05 3.7 20.2 668.79 Amox 5 2589.34 8.05 3.7 20.2 664.65
March Low No Ab 5 2593.18 7.70 3.7 20.2 1537.02 Cip 5 2544.23 7.69 3.7 20.2 1545.03 Amox 5 2637.08 7.69 3.7 20.2 1596.65
Table 1. Summary of water chemistry analyses for the experiments in November and March.
12
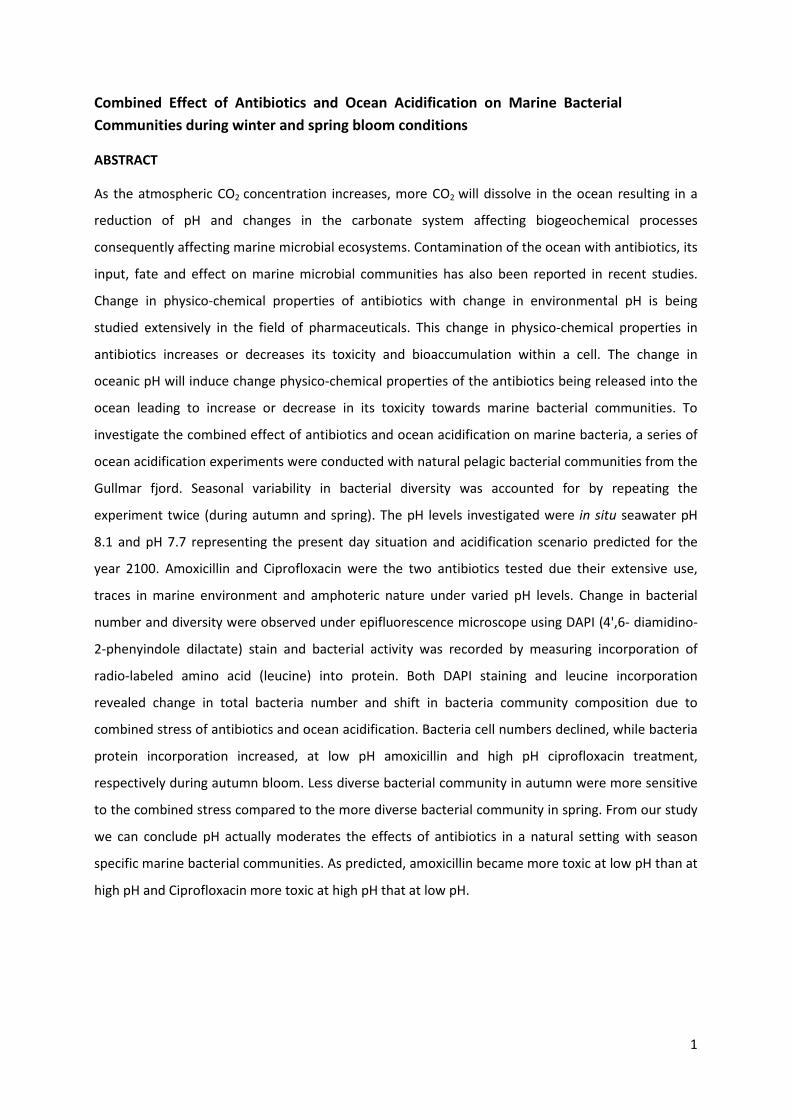
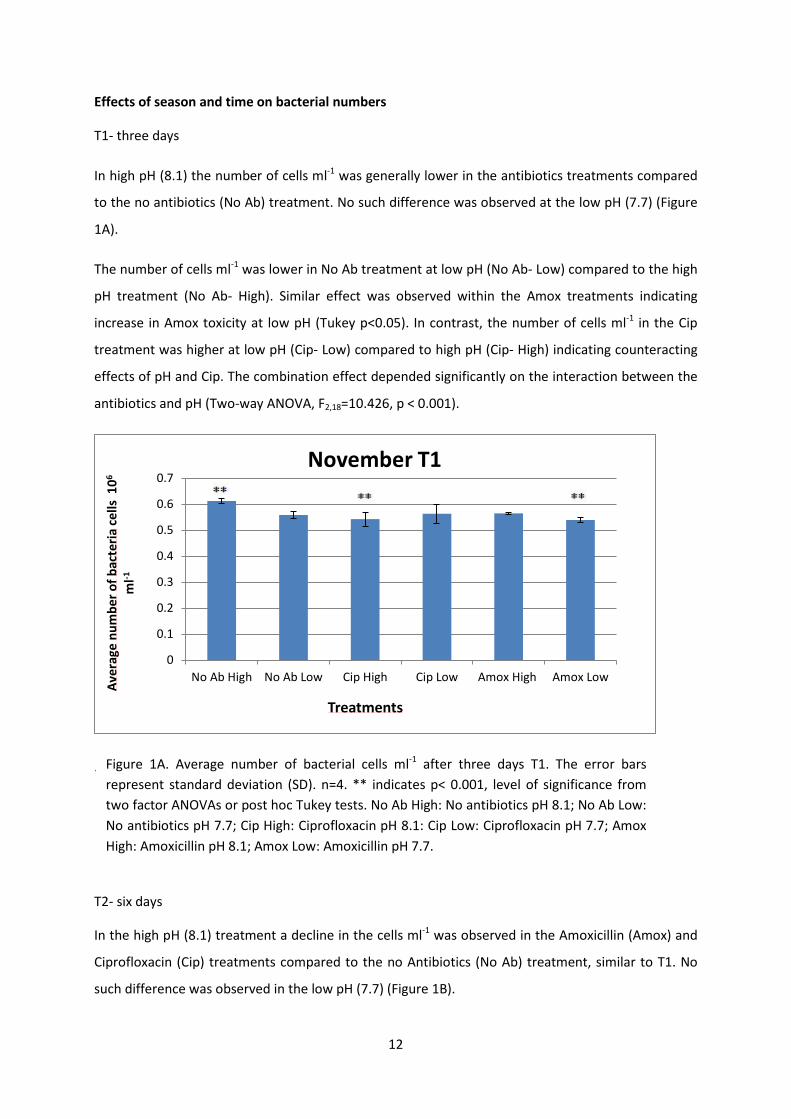
Effects of season and time on bacterial numbers
T1- three days
In high pH (8.1) the number of cells ml-1 was generally lower in the antibiotics treatments compared
to the no antibiotics (No Ab) treatment. No such difference was observed at the low pH (7.7) (Figure
1A).
The number of cells ml-1 was lower in No Ab treatment at low pH (No Ab- Low) compared to the high
pH treatment (No Ab- High). Similar effect was observed within the Amox treatments indicating
increase in Amox toxicity at low pH (Tukey p<0.05). In contrast, the number of cells ml-1 in the Cip
treatment was higher at low pH (Cip- Low) compared to high pH (Cip- High) indicating counteracting
effects of pH and Cip. The combination effect depended significantly on the interaction between the
antibiotics and pH (Two-way ANOVA, F2,18=10.426, p < 0.001).
.
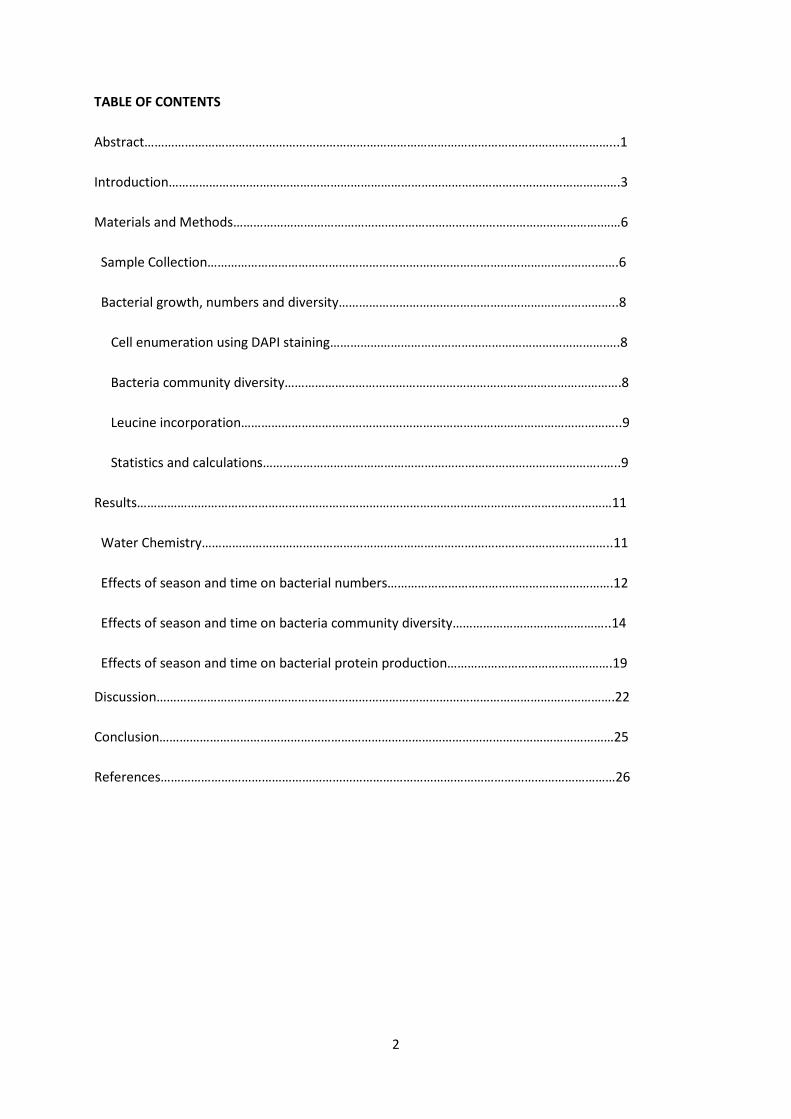
T2- six days
In the high pH (8.1) treatment a decline in the cells ml-1 was observed in the Amoxicillin (Amox) and
Ciprofloxacin (Cip) treatments compared to the no Antibiotics (No Ab) treatment, similar to T1. No
such difference was observed in the low pH (7.7) (Figure 1B).
0
0.1
0.2
0.3
0.4
0.5
0.6
0.7
No Ab High No Ab Low Cip High Cip Low Amox High Amox Low
Aver
age
num
ber o
f bac
teria
cells
106
ml-1
Treatments
November T1
Figure 1A. Average number of bacterial cells ml-1 after three days T1. The error bars represent standard deviation (SD). n=4. ** indicates p< 0.001, level of significance from two factor ANOVAs or post hoc Tukey tests. No Ab High: No antibiotics pH 8.1; No Ab Low: No antibiotics pH 7.7; Cip High: Ciprofloxacin pH 8.1: Cip Low: Ciprofloxacin pH 7.7; Amox High: Amoxicillin pH 8.1; Amox Low: Amoxicillin pH 7.7.
13
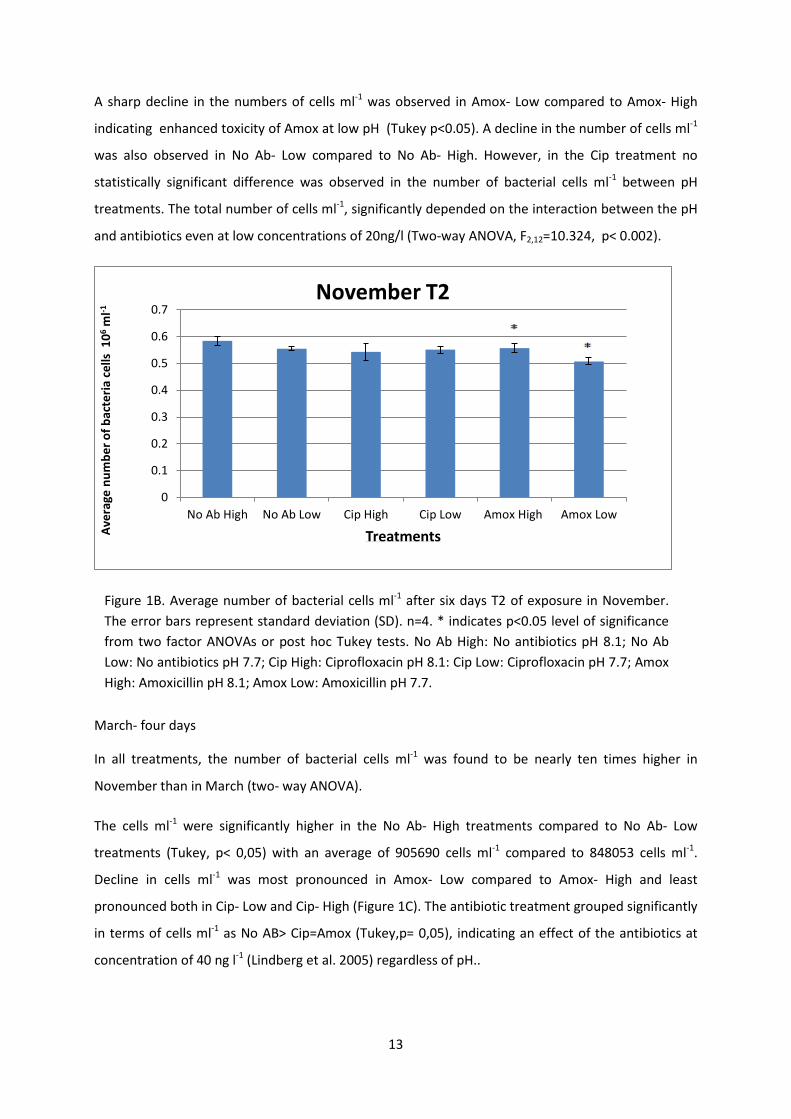
A sharp decline in the numbers of cells ml-1 was observed in Amox- Low compared to Amox- High
indicating enhanced toxicity of Amox at low pH (Tukey p<0.05). A decline in the number of cells ml-1
was also observed in No Ab- Low compared to No Ab- High. However, in the Cip treatment no
statistically significant difference was observed in the number of bacterial cells ml-1 between pH
treatments. The total number of cells ml-1, significantly depended on the interaction between the pH
and antibiotics even at low concentrations of 20ng/l (Two-way ANOVA, F2,12=10.324, p< 0.002).
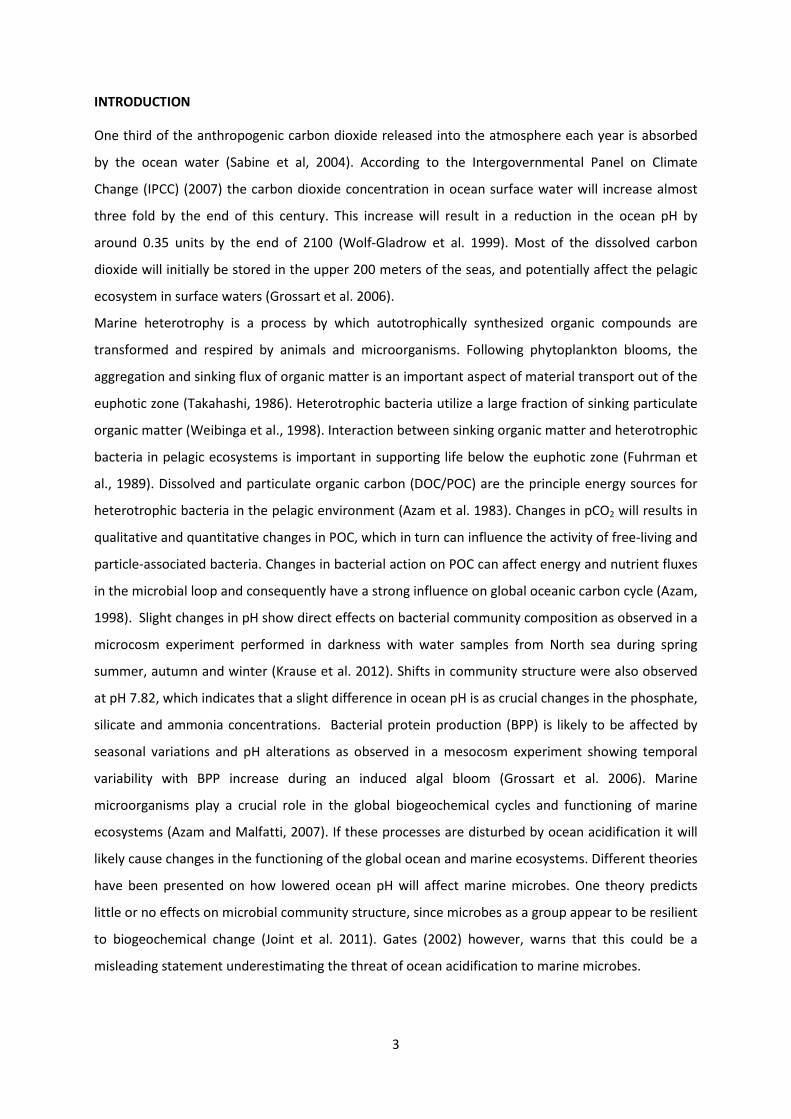
March- four days
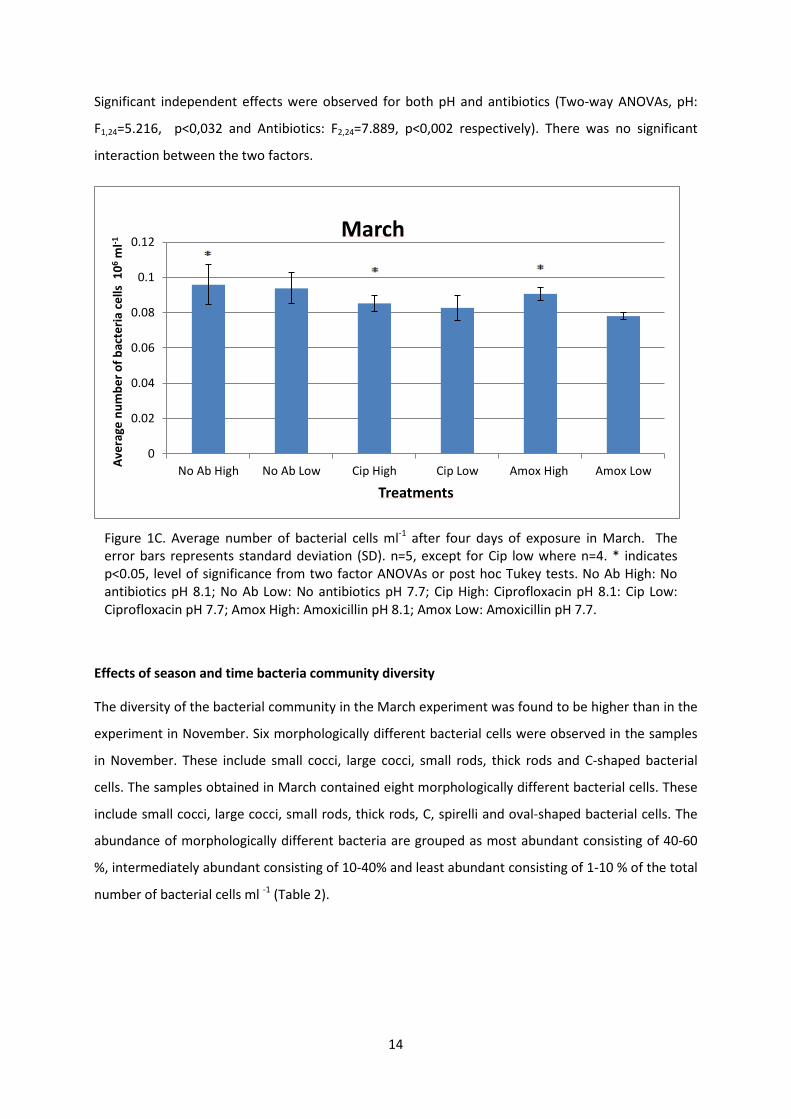
In all treatments, the number of bacterial cells ml-1 was found to be nearly ten times higher in
November than in March (two- way ANOVA).
The cells ml-1 were significantly higher in the No Ab- High treatments compared to No Ab- Low
treatments (Tukey, p< 0,05) with an average of 905690 cells ml-1 compared to 848053 cells ml-1.
Decline in cells ml-1 was most pronounced in Amox- Low compared to Amox- High and least
pronounced both in Cip- Low and Cip- High (Figure 1C). The antibiotic treatment grouped significantly
in terms of cells ml-1 as No AB> Cip=Amox (Tukey,p= 0,05), indicating an effect of the antibiotics at
concentration of 40 ng l-1 (Lindberg et al. 2005) regardless of pH..
0
0.1
0.2
0.3
0.4
0.5
0.6
0.7
No Ab High No Ab Low Cip High Cip Low Amox High Amox Low
Aver
age
num
ber o
f bac
teria
cel
ls 1
06 ml-1
Treatments
November T2
Figure 1B. Average number of bacterial cells ml-1 after six days T2 of exposure in November. The error bars represent standard deviation (SD). n=4. * indicates p<0.05 level of significance from two factor ANOVAs or post hoc Tukey tests. No Ab High: No antibiotics pH 8.1; No Ab Low: No antibiotics pH 7.7; Cip High: Ciprofloxacin pH 8.1: Cip Low: Ciprofloxacin pH 7.7; Amox High: Amoxicillin pH 8.1; Amox Low: Amoxicillin pH 7.7.
14
Significant independent effects were observed for both pH and antibiotics (Two-way ANOVAs, pH:
F1,24=5.216, p<0,032 and Antibiotics: F2,24=7.889, p<0,002 respectively). There was no significant
interaction between the two factors.
Effects of season and time bacteria community diversity
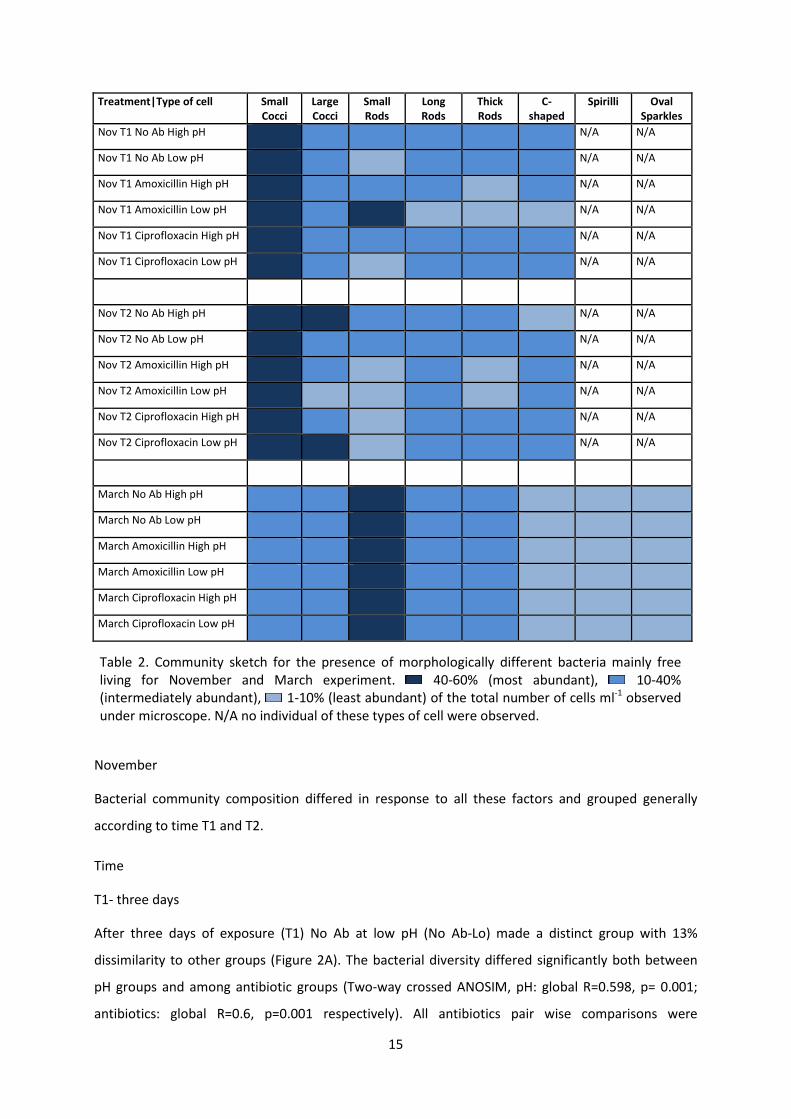
The diversity of the bacterial community in the March experiment was found to be higher than in the
experiment in November. Six morphologically different bacterial cells were observed in the samples
in November. These include small cocci, large cocci, small rods, thick rods and C-shaped bacterial
cells. The samples obtained in March contained eight morphologically different bacterial cells. These
include small cocci, large cocci, small rods, thick rods, C, spirelli and oval-shaped bacterial cells. The
abundance of morphologically different bacteria are grouped as most abundant consisting of 40-60
%, intermediately abundant consisting of 10-40% and least abundant consisting of 1-10 % of the total
number of bacterial cells ml -1 (Table 2).
0
0.02
0.04
0.06
0.08
0.1
0.12
No Ab High No Ab Low Cip High Cip Low Amox High Amox LowAver
age
num
ber o
f bac
teria
cel
ls 1
06 ml-1
Treatments
March
Figure 1C. Average number of bacterial cells ml-1 after four days of exposure in March. The error bars represents standard deviation (SD). n=5, except for Cip low where n=4. * indicates p<0.05, level of significance from two factor ANOVAs or post hoc Tukey tests. No Ab High: No antibiotics pH 8.1; No Ab Low: No antibiotics pH 7.7; Cip High: Ciprofloxacin pH 8.1: Cip Low: Ciprofloxacin pH 7.7; Amox High: Amoxicillin pH 8.1; Amox Low: Amoxicillin pH 7.7.
15
Treatment|Type of cell Small Cocci
Large Cocci
Small Rods
Long Rods
Thick Rods
C- shaped
Spirilli Oval Sparkles
Nov T1 No Ab High pH N/A N/A
Nov T1 No Ab Low pH N/A N/A
Nov T1 Amoxicillin High pH N/A N/A
Nov T1 Amoxicillin Low pH N/A N/A
Nov T1 Ciprofloxacin High pH N/A N/A
Nov T1 Ciprofloxacin Low pH N/A N/A
Nov T2 No Ab High pH N/A N/A
Nov T2 No Ab Low pH N/A N/A
Nov T2 Amoxicillin High pH N/A N/A
Nov T2 Amoxicillin Low pH N/A N/A
Nov T2 Ciprofloxacin High pH N/A N/A
Nov T2 Ciprofloxacin Low pH N/A N/A
March No Ab High pH
March No Ab Low pH
March Amoxicillin High pH
March Amoxicillin Low pH
March Ciprofloxacin High pH
March Ciprofloxacin Low pH
Table 2.
November
Bacterial community composition differed in response to all these factors and grouped generally
according to time T1 and T2.
Time
T1- three days
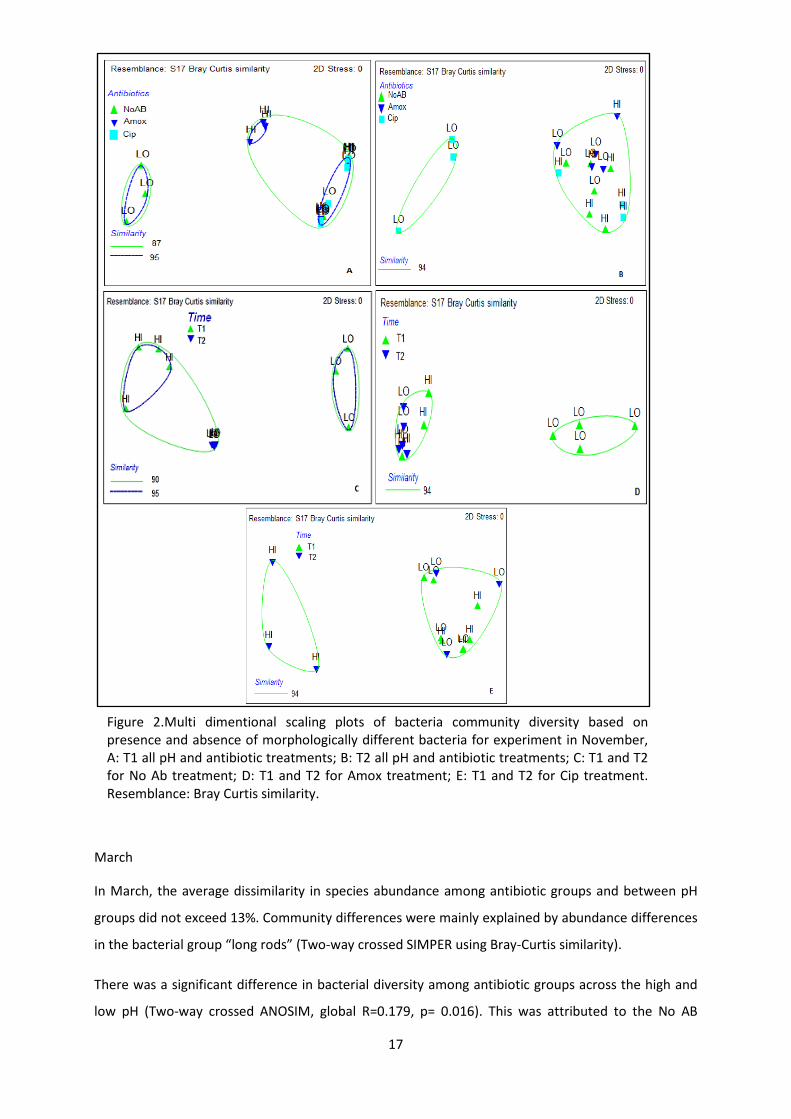
After three days of exposure (T1) No Ab at low pH (No Ab-Lo) made a distinct group with 13%
dissimilarity to other groups (Figure 2A). The bacterial diversity differed significantly both between
pH groups and among antibiotic groups (Two-way crossed ANOSIM, pH: global R=0.598, p= 0.001;
antibiotics: global R=0.6, p=0.001 respectively). All antibiotics pair wise comparisons were
Table 2. Community sketch for the presence of morphologically different bacteria mainly free living for November and March experiment. 40-60% (most abundant), 10-40% (intermediately abundant), 1-10% (least abundant) of the total number of cells ml-1 observed under microscope. N/A no individual of these types of cell were observed.
16
significantly different from each other, with most differences found between No Ab treatment and
Amox (Figure. 2A).
T2- Six days
After six days of exposure (T2) Cip at low pH (Cip Lo) made a distinct group with 6% dissimilarity from
the other groups. The bacterial diversity only differed significantly among antibiotic groups (Two-way
crossed ANOSIM, global R=0.375, p= 0.034), and the difference between pH across antibiotic groups
observed at T1 had now vanished (Figure 2B).
Antibiotics
At T1 bacterial communities of the No Ab high pH (No Ab-Hi) treatment and No Ab Low pH (No Ab-
Low) treatment differed while at T2 they formed one single cluster (Figure C). No Ab-Lo at T1 showed
a dissimilarity of 10% from the No Ab-Hi treatment at T1. The No Ab treatments at T1 on the whole
showed 5% dissimilarity from the No Ab treatments at T2. There was a significant effect of pH and a
highly significant effect of time on bacterial community diversity in the No AB treatments (Two-way
crossed ANOSIM, pH: global R=0.613, p= 0.029; time: global R=1, p= 0.003). (Two-way crossed
SIMPER using Bray-Curtis similarity) (Figure 2C).
The T1 the Amox at low pH treatment (Amox-Lo) differed from the Amox at high pH treatment
(Amox-Hi) by 6%. At T2 Amox-Hi and Amox-Lo formed clusters close to Amox-Hi at T1. Both pH and
time significantly affected bacterial diversity of the Amox treatment (Two-way crossed ANOSIM, pH
and time: global R=0.706, p= 0.029)(Two-way crossed SIMPER using Bray-Curtis similarity) (Figure
2D).
The T1 Cip treatments at both low pH (Cip-Lo) and high pH (Cip-Hi) formed close clusters with Cip Lo
treatments at T2. This group differed with 6% from the Cip Hi treatment at T2. There was no
difference in diversity due to pH but diversity changed significantly with time (Two-way crossed
ANOSIM, time: global R=0,5, p= 0,026), showing a distinct grouping of Cip-Hi at T2. This distinct
grouping of Cip Hi at T2 was attributed to absence in the group “oval sparkles” (Figure 2E).
17
March
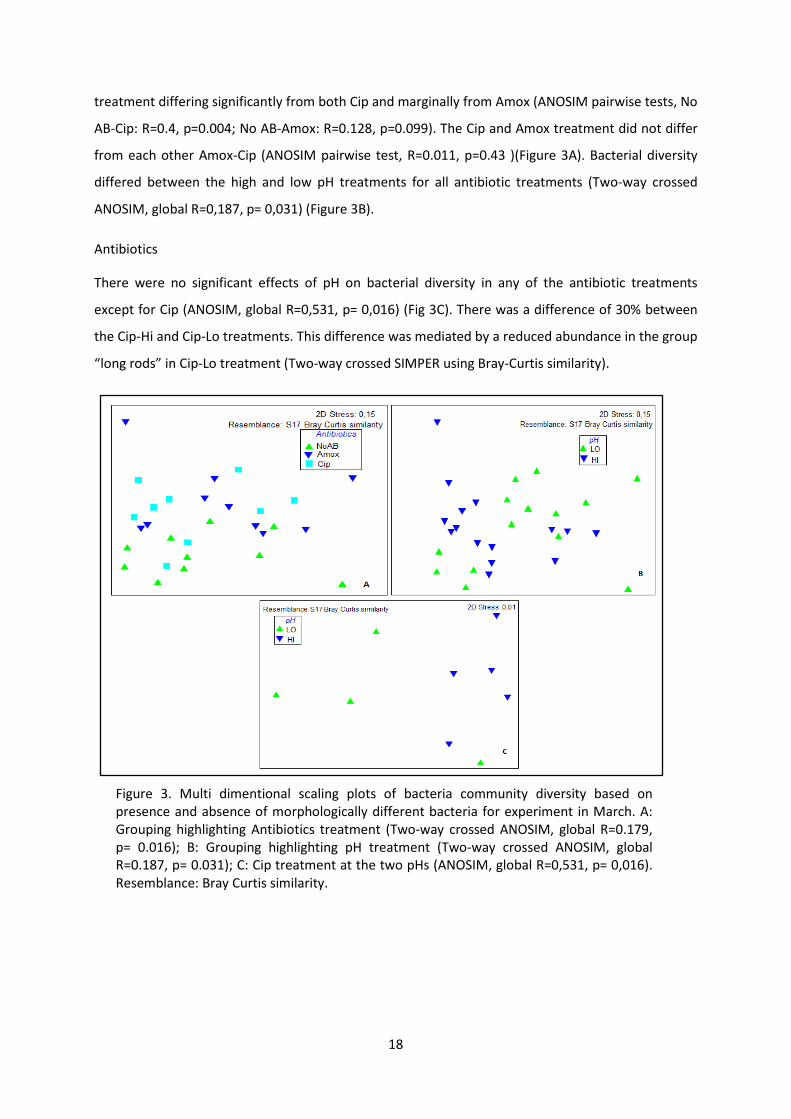
In March, the average dissimilarity in species abundance among antibiotic groups and between pH
groups did not exceed 13%. Community differences were mainly explained by abundance differences
in the bacterial group “long rods” (Two-way crossed SIMPER using Bray-Curtis similarity).
There was a significant difference in bacterial diversity among antibiotic groups across the high and
low pH (Two-way crossed ANOSIM, global R=0.179, p= 0.016). This was attributed to the No AB
Figure 2.Multi dimentional scaling plots of bacteria community diversity based on presence and absence of morphologically different bacteria for experiment in November, A: T1 all pH and antibiotic treatments; B: T2 all pH and antibiotic treatments; C: T1 and T2 for No Ab treatment; D: T1 and T2 for Amox treatment; E: T1 and T2 for Cip treatment. Resemblance: Bray Curtis similarity.
18
treatment differing significantly from both Cip and marginally from Amox (ANOSIM pairwise tests, No
AB-Cip: R=0.4, p=0.004; No AB-Amox: R=0.128, p=0.099). The Cip and Amox treatment did not differ
from each other Amox-Cip (ANOSIM pairwise test, R=0.011, p=0.43 )(Figure 3A). Bacterial diversity
differed between the high and low pH treatments for all antibiotic treatments (Two-way crossed
ANOSIM, global R=0,187, p= 0,031) (Figure 3B).
Antibiotics
There were no significant effects of pH on bacterial diversity in any of the antibiotic treatments
except for Cip (ANOSIM, global R=0,531, p= 0,016) (Fig 3C). There was a difference of 30% between
the Cip-Hi and Cip-Lo treatments. This difference was mediated by a reduced abundance in the group
“long rods” in Cip-Lo treatment (Two-way crossed SIMPER using Bray-Curtis similarity).
Figure 3. Multi dimentional scaling plots of bacteria community diversity based on presence and absence of morphologically different bacteria for experiment in March. A: Grouping highlighting Antibiotics treatment (Two-way crossed ANOSIM, global R=0.179, p= 0.016); B: Grouping highlighting pH treatment (Two-way crossed ANOSIM, global R=0.187, p= 0.031); C: Cip treatment at the two pHs (ANOSIM, global R=0,531, p= 0,016). Resemblance: Bray Curtis similarity.
19
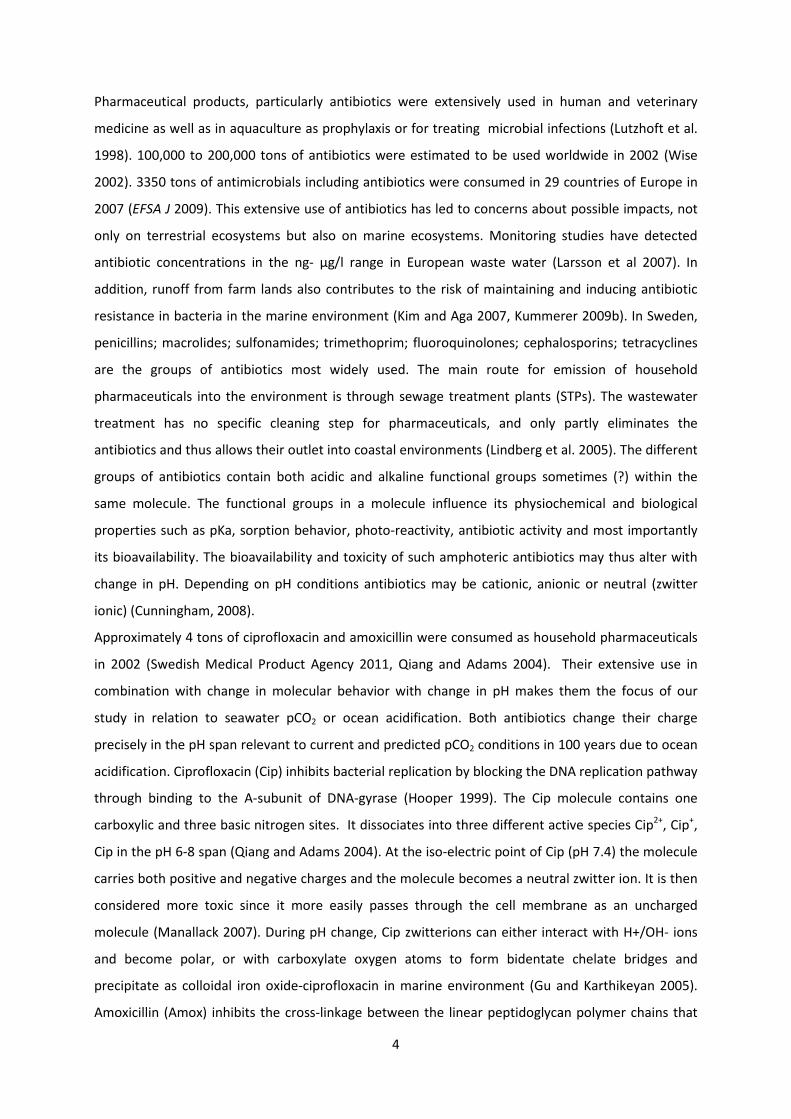
Effects of season and time on bacterial protein production rate
The number of cells ml-1 differed among treatments and consequently cell specific bacterial protein
production (BPP) rate was calculated (g protein/l*h) to normalize rates among treatments and times.
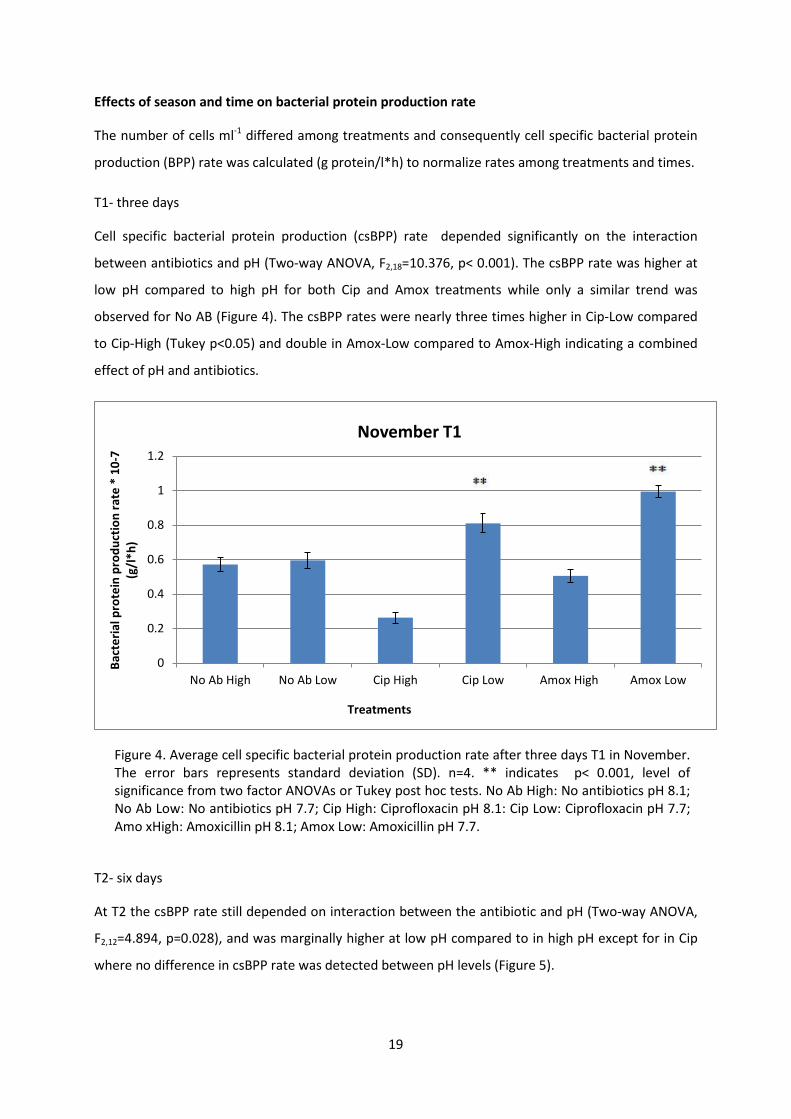
T1- three days
Cell specific bacterial protein production (csBPP) rate depended significantly on the interaction
between antibiotics and pH (Two-way ANOVA, F2,18=10.376, p< 0.001). The csBPP rate was higher at
low pH compared to high pH for both Cip and Amox treatments while only a similar trend was
observed for No AB (Figure 4). The csBPP rates were nearly three times higher in Cip-Low compared
to Cip-High (Tukey p<0.05) and double in Amox-Low compared to Amox-High indicating a combined
effect of pH and antibiotics.
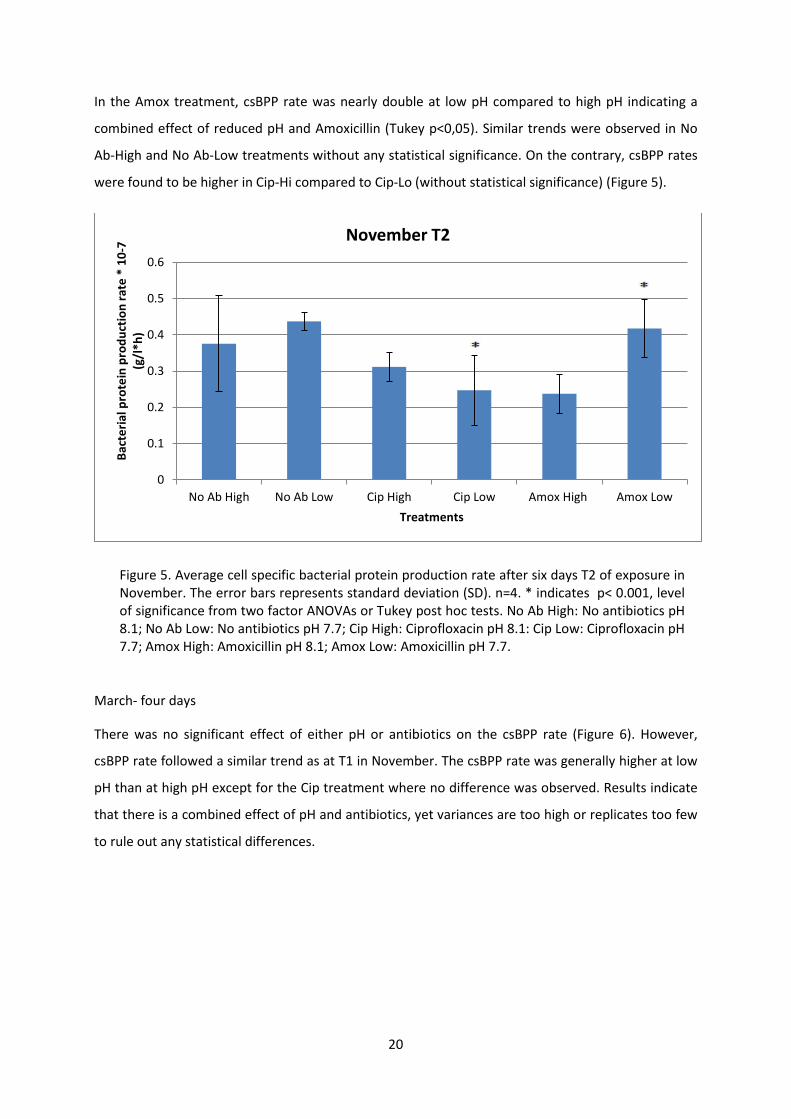
T2- six days
At T2 the csBPP rate still depended on interaction between the antibiotic and pH (Two-way ANOVA,
F2,12=4.894, p=0.028), and was marginally higher at low pH compared to in high pH except for in Cip
where no difference in csBPP rate was detected between pH levels (Figure 5).
0
0.2
0.4
0.6
0.8
1
1.2
No Ab High No Ab Low Cip High Cip Low Amox High Amox Low
Bact
eria
l pro
tein
pro
duct
ion
rate
* 1
0-7
(g/l
*h)
Treatments
November T1
Figure 4. Average cell specific bacterial protein production rate after three days T1 in November. The error bars represents standard deviation (SD). n=4. ** indicates p< 0.001, level of significance from two factor ANOVAs or Tukey post hoc tests. No Ab High: No antibiotics pH 8.1; No Ab Low: No antibiotics pH 7.7; Cip High: Ciprofloxacin pH 8.1: Cip Low: Ciprofloxacin pH 7.7; Amo xHigh: Amoxicillin pH 8.1; Amox Low: Amoxicillin pH 7.7.
20
In the Amox treatment, csBPP rate was nearly double at low pH compared to high pH indicating a
combined effect of reduced pH and Amoxicillin (Tukey p<0,05). Similar trends were observed in No
Ab-High and No Ab-Low treatments without any statistical significance. On the contrary, csBPP rates
were found to be higher in Cip-Hi compared to Cip-Lo (without statistical significance) (Figure 5).
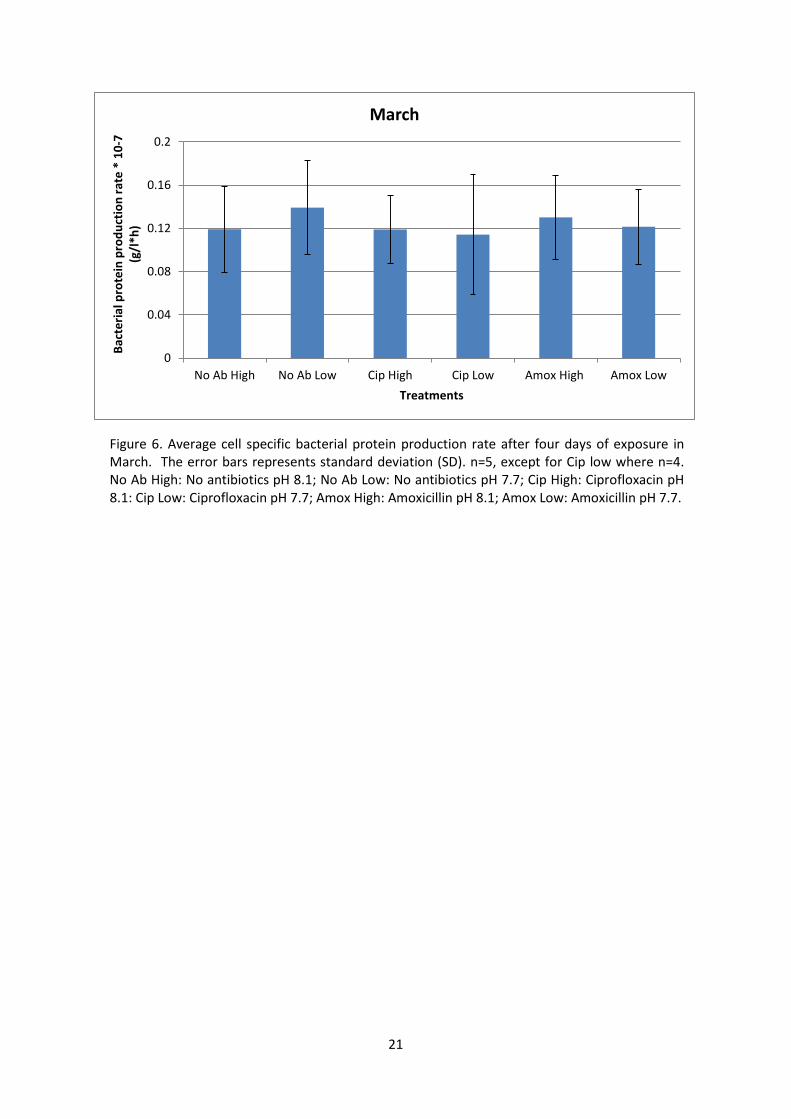
March- four days
There was no significant effect of either pH or antibiotics on the csBPP rate (Figure 6). However,
csBPP rate followed a similar trend as at T1 in November. The csBPP rate was generally higher at low
pH than at high pH except for the Cip treatment where no difference was observed. Results indicate
that there is a combined effect of pH and antibiotics, yet variances are too high or replicates too few
to rule out any statistical differences.
0
0.1
0.2
0.3
0.4
0.5
0.6
No Ab High No Ab Low Cip High Cip Low Amox High Amox Low
Bact
eria
l pro
tein
pro
duct
ion
rate
* 1
0-7
(g/l
*h)
Treatments
November T2
Figure 5. Average cell specific bacterial protein production rate after six days T2 of exposure in November. The error bars represents standard deviation (SD). n=4. * indicates p< 0.001, level of significance from two factor ANOVAs or Tukey post hoc tests. No Ab High: No antibiotics pH 8.1; No Ab Low: No antibiotics pH 7.7; Cip High: Ciprofloxacin pH 8.1: Cip Low: Ciprofloxacin pH 7.7; Amox High: Amoxicillin pH 8.1; Amox Low: Amoxicillin pH 7.7.
21
0
0.04
0.08
0.12
0.16
0.2
No Ab High No Ab Low Cip High Cip Low Amox High Amox Low
Bact
eria
l pro
tein
pro
duct
ion
rate
* 1
0-7
(g/l
*h)
Treatments
March
Figure 6. Average cell specific bacterial protein production rate after four days of exposure in March. The error bars represents standard deviation (SD). n=5, except for Cip low where n=4. No Ab High: No antibiotics pH 8.1; No Ab Low: No antibiotics pH 7.7; Cip High: Ciprofloxacin pH 8.1: Cip Low: Ciprofloxacin pH 7.7; Amox High: Amoxicillin pH 8.1; Amox Low: Amoxicillin pH 7.7.
22
DISCUSSION
Effects of season
The experiments during November and March were both conducted under laboratory conditions
mimicking the ambient physical conditions in terms of light and temperature. The total free-living
bacteria observed using DAPI staining revealed nearly six times higher abundance of bacteria in
November than in March. Flagellate grazing on bacteria regulate the bacterial population numbers
during the spring bloom (Azam et al., 1983), and might be one reason explaining the lower number of
free-living bacteria during spring bloom than in the autumn. The annual changes in abiotic factors
such as light regime, temperature, and/or other physical disturbance can influence the biotic factors
like competition, predation, and infection in-turn regulating response of different populations
(Pinhassi and Hagström, 1997). The abiotic changes are also responsible for the succession of
bacterial species in which those species present in low concentrations represent the potential of the
bacterial community to respond to future changes (Harris, 1986). During the spring bloom more
bacteria were observed attached to algal detritus than to free-living bacteria. This reduces the total
number of free-living bacteria during spring compared to autumn conditions. Similar results were
observed in a mesocosm study where the free living and attached bacteria where fractionated before
being observed under microscope (Grossart et al., 2007). Brussard et al., (2005) also report an
increase in numbers of attached bacteria during a spring bloom as associated with algal- derived
organic matter in a mesocosm experiment. Rise in water temperature from spring to autumn might
be responsible for succession of free living bacterioplankton as also observed by Pinhassi and
Hagström, 2000. The ambient water temperature during autumn was 13°C, which was followed by
spring with ambient water temperature was 3.5°C. This rise in water temperature might explain the
observed higher abundance of free-living bacteria during autumn compared to spring. A decline in
nutrients after the summer season and grazing by higher zooplankton are both known to control
total bacterial count before the recurring subsequent spring bloom (Rivkin and Anderson, 1997),
which supports our finding of free living bacteria number being associated with seasonal changes and
spring bloom.
Bacterial community diversity was found to be greater in March after the spring bloom than in
November during the autumn. During autumn small cocci, large cocci, small rods, thick rods and C-
shaped bacterial cells were observed while additional spirilli and oval sparkles were observed
immediately after the spring bloom. Community composition and activity of both free living and
attached bacteria is closely linked with seasonal variation and nutrient availability (Pinhassi and
Hagström 2000). Shift in bacterial community structure has been reported as a result of change in
phytoplankton and diatom community structure (Sapp et al., 2007). In our study the phytoplankton,
23
zooplankton and diatom community was found to differ between autumn and spring (Russ, 2011 and
Stengren 2012, Bachelor theses). This supports our observation regarding change in bacteria
community diversity from autumn to spring.
Cell specific bacterial protein production (cs BPP) was slightly higher after the spring bloom than in
autumn with high variances in the treatment. Bacteria production was shown to be directly
correlated with changes in temperature, nutrient concentration and species composition of the
bacterial community from spring to autumn (Pinhassi and Hagström, 2000). In our study we see the
differences in temperature, species composition and bacterial abundance from autumn bloom to
spring bloom.
Effects of ocean acidification
The effect of ocean acidification was found to be dependent both on exposure time and season. The
pH in our experimental system was well regulated and stable throughout the time of exposure.
Prominent effects of reduced pH and exposure times were observed on bacterial abundance and
community structure in the autumn bloom but not during in the spring bloom. Low pH can also affect
phytoplankton community by influencing primary production leading to changes in quality and
quantity of dissolved organic matter (DOM) released consequently influencing bacterial growth
(Allgaier, et al., 2008). We have not particularly analyzed the quality and quantity of DOM however
the change in the bacterial number and the shift in community structure might be the result of
changes in DOM. Similar results with initial decrease in bacteria number upon short exposure to low
pH, increase in bacteria numbers upon longer exposure and changes in bacteria community with
changes in phytoplankton community had been seen in microcosm experiments (Krause 2012). Cell
specific bacterial protein production (cs BPP) was much higher after the spring bloom at low pH than
in autumn showing a positive co-relation with the increase in Cholorophyll A in the phytoplankton
(Stengren, 2012, independent study) as observed in an experiment where cs BPP was studied in
heterotrophic bacteria couple with algal bloom at low pH (Allagaier et al., 2008). The decrease in pH
consequently resulted in enhanced protein production in bacterial cells instead of in inhibition.
Similar results have been found when bacterial communities have been exposed to gradients of low
pH in independent treatments (Coffin et al. 2004). Bacteria cells switch biochemical processes for
metabolic cycling of acids and bases at altered pHs. A low pH facilitates acidophilic bacterial growth
and prevalence in relation to non-acidophilic bacteria (Wise et al. 1997). Change in bacteria
community composition over time may profoundly affect csBPP rate. In a mesocosm study, csBPP
rate was observed to increase much in a free living bacteria population following an algal bloom
decline, while attached bacteria showed a decline in csBPP rate during the spring bloom and an
24
increase immediately after the spring bloom. The total csBPP rate (including both free living and
attached bacteria) was observed to increase immediately after the spring bloom when the
particulate organic carbon (POC) was highest (Grossart et al. 2006). In our study, the observed higher
csBPP rate in spring after four days of exposure to low pH might be due to the indirect relationship
between pCO2 induced shifts in particle quality and activity of the more abundant attached bacteria.
At lower pH csBPP rate during autumn showed a similar trend as in spring however the effect
observed was not very prominent.
Combined effects of OA and antibiotics
The combined effect of ocean acidification and antibiotics pH was found to be both season and
exposure-time dependent. Effects of low pH and antibiotics at different exposure times were
prominently observed in bacterial abundance and community structure in autumn bloom compared
to in spring bloom. Ciprofloxacin is more bioavailable and toxic at high pH and Amoxicillin at low pH
(Qiang and Adams 2004, Alekseev et al., 2005) leading to lowered bacterial abundance and change in
community structure at the respective most toxic pHs. The effect of Ciprofloxacin at high pH is more
distinguished after three days of exposure compared to after six days of exposure in autumn might
be because Ciprofloxacin gets strongly sorbed to organic matter and its effect is lost over time
(Kummerer 2009a). Season dependent shift in community structure in bacteria might have resulted
in higher prevalence of species more tolerant to the combined stress of ocean acidification and
antibiotics as observed in a microcosm experiment (Krause et al 2012). Cell specific bacterial protein
production (csBPP) rate was lower after three days than after six days of combined exposure to
ocean acidification and Ciprofloxacin, indicating reduced effects after longer exposures. Higher csBPP
rate was observed in Amox low pH treatment than high pH treatment both after three days and six
days of exposure indicating the presence of amoxicillin resistant bacteria out-competing the sensitive
species and changing the community structure (Krause et al. 2012). We have not isolated the
resistant bacteria in particular however the change in community structure might be the result of
sensitive species being out competed by the resistant species.
High variability in csBPP rate was observed in the post spring bloom bacterial communities. No clear
differences were observed amongst Cip or Amox treatments at low and high pH. This indicates either
the post spring bloom bacteria communities were more resistant to these antibiotics or the effects of
antibiotics were shielded by the presence of different phytoplankton communities. Perhaps this
shielding was moderated by adsorption of antibiotics to algal debris thus reducing exposure
concentrations and bioavailavility. Studies show that leucine also can be incorporated by
phytoplankton like Akashiwo sanguinea, Prorocentrum minimum and Nitzschia sp. (Mulholland et al.
25
2011). An independent study showed the presence of Nitzschia sp. during the spring bloom in our
samples (Stengren, 2012). The variation in csBPP rate measured in this study can be related to uptake
of externally supplied leucine by algae, having unexpected impact on the csBPP rate measurements
and our conclusions on the combined effect of antibiotics at high and low pH levels. This method has
however, been widely used to measure bacterial function in experiments and field monitoring
programs since it was suggested by Smith and Azam (1989) and evaluating its validity in relation to
bacterial productivity is beyond the scope of this study.
Problems or concerns with the experimental setup
Our experiment set up was closely but not perfectly mimicking the ambient physical conditions of the
bacteria communities sampled at 23 meters and 11 meters of depth during autumn and spring
respectively. The water temperature of 13°C during autumn was well maintained but the water
temperature of 2°C was not practically possible to maintain in laboratory conditions. Water
temperature and air temperature was kept at 4°C for the experiment in spring, which might provide
an opportunity for the phytoplankton and bacteria to enhance their cellular activities. The pH
regulation system was fairly stable throughout the experiment. The initial calibration of pH
computers and stabilization of pH was gradual leading to sudden fluctuations in pH in our test
systems for a very short period of time. The challenge of establishing the test system affected our
test flasks uniformly and the variability in our results was mostly due to different treatments and
probably not caused by physical variability amongst flasks.
CONCLUSIONS
This investigation has shown change in total bacteria number, cell-specific bacterial production and
shift in bacteria community composition due to combined stress of antibiotics and ocean
acidification. The changes in bacterial numbers and community composition were both exposure
time and season dependent. The autumn bacterial community was less diverse and likely therefore
more sensitive to combined stress of antibiotics and ocean acidification compared to the more
diverse spring bacterial community. Carrying out experiments in spring to determine combined
effects of contaminants and ocean acidification could thus potentially underestimate the combined
effect of stressors on bacterial community. pH plays a vital role in moderating the effect of the
antibiotics on marine bacterial communities from different seasons, Amoxicillin is more toxic at low
pH than at high pH and Ciprofloxacin is more toxic at high pH than at low pH. This finding is directly
related to the ongoing ocean acidification, which may then lead to a change in the toxicity of polar
compounds in nature. To determine time-, season- and treatment-dependent changes in community
diversity in bacteria DNA analysis by TGGE or DGGE will provide a clearer picture for future studies.
26
REFERENCES
1. Alekseev, V.G. 2010. ACID–BASE PROPERTIES OF PENICILLINS AND CEPHALOSPORINS (A
REVIEW). Pharmaceutical Chemistry Journal, Vol. 44, No. 1, pp. 16 – 26.
2. Allagaier, M., et. al., 2008. Coupling of heterotrophic bacteria to phytoplankton bloom
development at different pCo2 levels: A mesocosm study. Biogeosciences Discuss., 5, 317–
359.
3. Azam, F. 1998. Microbial control of oceanic carbon flux: The plot thickens, Science,
280(5364), 694–696.
4. Azam, F., Fenchel, T., Field, J. G., et al. 1983. The ecological role of water-column microbes in
the sea, Mar. Ecol. Prog. Ser., 10, 257–263.
5. Coffin, R.B., Montgomery, M.T., Boyd, T.J., Masutani, S.M. Influence of ocean CO2
sequestration on bacterial production. 2004. Energy, 29, 1511–1520.
6. Cunningham, V. 2008. Special characteristics of pharmaceuticals related to environmental
fate. Pharmaceuticals in the Environment, Springer, Berlin Heidelberg, 23–34.
7. Deshpande,D. K. G. Baheti and N. R. Chatterjee. 2004. Degradation of β- lactam antibiotics.
CURRENT SCIENCE, VOL. 87, NO. 12. 1684-1695.
8. Engel, A. 2002. Direct relationship between CO2 uptake and trans parent exopolymer particle
production in natural phytoplankton. J. Plankton Res. 24: 49–53.
9. F. Azam och F. Malfatti, ”Microbial structing of Marine Ecosystems.,” Nature Reviews
Microbiology, vol. 5, p. 966, 2007.
10. Fuhrman J. A., T. D. Sleeter, C. A. Carlson and L. M. Proctor (1989) Dominance of bacterial
biomass in the Sargasso Sea and its ecological implications. Marine Ecology Progress Series,
57, 207-217.
11. Gates S, 2002. Review of methodology of quantitative reviews using meta-analysis in
ecology. J Anim Ecol 71:547–557.
12. Grossart, H. P., et,al. 2005. Marine diatom species harbour distinct bacterial communities.
Envir. Microbiol. 7: 860–873.
13. Grossart, H. P., et al. 2006. Testing the effect of CO2 concentration on dynamics of marine
heterotrophic bacterioplankton , Limnology and oceanography, 51 (1), pp. 1-11.
14. Grossart, H. P., et al. 2007. Comparison of cell-speci¢c activity betweenfree-living and
attached bacteria using isolates and natural assemblages. FEMS Microbiol Lett, 266, 194-200.
15. Gu, C., Karthikeyan, K.G., 2005. Sorption of the antimicrobial ciprofloxacin toaluminum and
iron hydrous oxides. Environ. Sci. Technol. 39, 9166–9173.
16. Guinotte, J.M. et al. 2006. Will human induced changes in seawater chemistry alter the
distribution of deepsea scleractinian corals? Front. Ecol. Environ. 4: 141–146.
27
17. Harris, G. P. 1986. Phytoplankton ecology, structure, function and fluctuation, p. 209–212.
University Press, Cambridge, United Kingdom.
18. Hooper, D. C. Mode of action of fluoroquinolones. Drugs 1999; 58 Suppl. 2; 6-10.
19. Houghton, J. T., et al. 2001. Climate change 2001: The scientific basis: Contribution of
working group I to the third assessment report of the intergovernmental panel of climate
change. Cambridge Univ. Press.
20. IPCC 2007. Contribution of working group i to the fourth assessment report of the
intergovernmental panel on climate change. Summary for policymakers.
21. Joint Opinion on antimicrobial resistance (AMR) focused on zoonotic infections. EFSA J 2009,
7, 1372.
22. Kim, S., Aga, D.S., 2007. Potential ecological and human health impacts of antibiotics and
antibiotic-resistant bacteria from wastewater treatment plants. Journal of Toxicology and
Environmental Health, Part B 10, 559e573.
23. Krause E, Wichels A, Gime´nez L, Lunau M, Schilhabel MB, et al. (2012) Small Changes in pH
Have Direct Effects on Marine Bacterial Community Composition: A Microcosm Approach.
PLoS ONE 7, 10.
24. Kummerer, K., 2009a. Antibiotics in the aquatic environment—A review. Part I. Chemosphere
75, 417–434.
25. Kummerer, K., 2009b. Antibiotics in the aquatic environment—a review. Part II.
Chemosphere 75, 435–441.
26. Larsson, D.G.J., De Pedro, C., Paxeus, N., 2007. Effluent from drug manufactures contains
extremely high levels of pharmaceuticals. J. Hazard. Mater. 148, 751–755
27. Lindberg, R.H., et al. 2005. Screening of human antibiotic Substances and Determination of
Weekly Mass Flows in Five Sewage Treatment Plants in Sweden. Env. Sc. Tech. 39, 10, 3421-
3429.
28. Lutzhoft, H. C., Sorensen, B. H., and Jorgenson, S. E. 1998. Algal toxicity of Antibacterial
Agents Applied in Danish fish farming. Arch. Environ. Contam. Toxicol. 36, 1-6.
29. Mari, X., et al. 2001.Non-Redfield C:N ratio of transparent exopolymeric particles in the
northwestern Mediterranean Sea. Limnol. Oceanogr. 1831–1836.
30. Mulholland, R., et al. 2011. Incorporation of Leucine and Thymidine by Estuarine
Phytoplankton: Implications for Bacterial productivity estimates. Estuaries and coasts. 34,
310-325.
31. Nelson, David L., and Michael M. Cox. Lehninger: Principles of Biochemistry 4th Edition. New York:
W.H. Freeman and Company, 2005. page 1098.
28
32. Park H, Kim T. H, Bark K 2002 Physicochemical Properties Of Quinolone Antibiotics In Various
Environments. Eur J. Med. Chem 37, 443.
33. Pinhassi J., Hagström, Å. 2000. Seasonal succession in marine bacterioplankton. Aquat
Microb Ecol. 21,245-256.
34. Pinhassi, J., Sala, M.M., Havskum, H., et al. 2004. Changes in Bacterioplankton composition
under different phytoplankton regimes. Applied and Environ. Microbiology. p. 6753-6766.
35. Pinhassi J, Zweifel UL, Hagström A .1997. Dominant marine bacterioplankton species found among colony-fonning bacteria. Appl Environ Microbiol 63:3359-3366.
36. Porter, K.G., Feig, Y.S. 1980. Limnology and Oceanography, 25, 5, 943-948.
37. Qiang Z, Adams C. 2004. Potentiometric determination of acid dissociation constants (pKa)
for human and veterinary antibiotics. Water Res.;38(12):2874-90.
38. Rendal, C, Kusk K.O. and Trapp S. 2011. Optimal choice of pH for toxicity and
Bioaccumulation studies on ionizing organic chemicals. Env Toxicology and Chemistrt, vol 30,
11:pp 2395-2406.
39. Riebesell, U. et al. 2007. Enhanced biological carbon consumption in a highCO2 ocean.
Nature 450: 545–548.
40. Rivkin, R.B and Anderson, M.R,1997. Inorganic nutrient limitation of oceanic
bacteroplankton. Limnol. Oceanogr., 42 (4), 730-740.
41. Sabine, CL, et al., 2004. The Oceanic Sink for Anthropogenic CO2, Science 305, 367.
42. Sapp, M., et al., 2007. Bacterial community dynamics during thewinter^spring transition in
theNorth Sea. FEMS Microbiol Ecol 59, 622–637.
43. Simon, M. and Azam, F. 1989. Protein content and protein synthesis rates of planktonic
marine bacteria. Mar. Ecol. Prog. Ser. 51, 201-213.
44. Takahashi, K. 1986. Seasonal fluxes of pelagic diatoms in the subarctic Pacific. Deep-Sea
Research, 33, 1225-1251.
45. The Swedish Medical Products Agency (MPA), 2011. Apoteket AB, Sweden.
46. Weber, D. J., Tolkoff-Rubin, N.E., Rubin, R.H. 2012. Pharmacotherapy.1875-9114.
47. Weibinga, C.J. De Baar, H.J.W., 1998. Determination of the dissolved organic carbon in the
Indian sector of the Southern Ocean. Mar. Chem. 61, 185–201.
48. Wise, R., 2002. Antimicrobial resistance: priorities for action. J. Antimicrob. Chemoth. 49,
585–586.
49. Wolf-Gladrow, D., et al., 1999. Direct effect of CO2 concentration on growth and isotopic composition of marine plankton. Tellus 51B: 461–476.