Combined data from LDL composition and size measurement are … · · 2004-04-08Combined data...
13
Copyright © 2004 by the American Society for Biochemistry and Molecular Biology, Inc. 954 Journal of Lipid Research Volume 45, 2004 This article is available online at http://www.jlr.org Combined data from LDL composition and size measurement are compatible with a discoid particle shape Tom Teerlink, 1, * Peter G. Scheffer,* Stephan J. L. Bakker, † and Robert J. Heine † Departments of Clinical Chemistry* and Endocrinology, † Institute for Cardiovascular Research, VU University Medical Center, 1007 MB Amsterdam, The Netherlands Abstract The size of LDL is usually reported as particle di- ameter, with the implicit assumption that it is a spherical particle. On the other hand, data obtained by cryoelectron microscopy and crystallographic analysis suggest that LDL shape may be discoid. We have investigated LDL particle ge- ometry by combining data on LDL lipid composition with size measurement. The mean LDL diameter of 160 samples was measured by high-performance gel-filtration chroma- tography (HPGC), and particle volume was calculated from its lipid composition. Assuming a spherical shape, diame- ters calculated from volume correlated poorly with values obtained by HPGC (R 2 0.36). Assuming a discoid shape, particle height was calculated from volume and HPGC di- ameter. Diameter (20.9 0.5 nm) and height (12.1 0.8 nm) were not significantly related to each other (r 0.14, P 0.09) and accounted for 23% and 77%, respectively, of the variation in particle volume. In multivariate regression models, LDL core lipids were the main determinants of height (R 2 0.83), whereas free cholesterol in the shell, which contributes only 5–9% to LDL mass, was the main de- terminant of diameter (R 2 0.54). We conclude that combined data from composition and size measurements are compatible with a discoid particle shape and propose a structural model for LDL in which free cholesterol plays a major role in determining particle shape and diameter.— Teerlink, T., P. G. Scheffer, S. J. L. Bakker, and R. J. Heine. Combined data from LDL composition and size measure- ment are compatible with a discoid particle shape. J. Lipid Res. 2004. 45: 954–966. Supplementary key words atherosclerosis • low density lipoprotein • low density lipoprotein composition • low density lipoprotein structure • low density lipoprotein size • unesterified cholesterol Human LDL particles are the main carriers of choles- terol in the circulation. LDL particles are operationally defined as lipoproteins within the density range of 1.019– 1.063 g/ml. As such, LDL forms a heterogeneous family of particles varying in density, size, composition, and other physicochemical properties. This heterogeneity has clinical significance in that LDL subspecies differ in their metabolic behavior and pathologic roles [reviewed by Ber- neis and Krauss (1)]. During the last two decades, evi- dence has accumulated that LDL size is a parameter of particular clinical importance. Small, dense LDLs have consistently been shown to confer increased risk for car- diovascular disease (2–8). The presence of small, dense LDLs is strongly associated with increased plasma triglyc- eride (TG) levels and low HDL cholesterol, a triad col- lectively known as the atherogenic lipoprotein pheno- type. The metabolic intertwining of these lipid risk factors makes it difficult to assess their independent con- tributions to cardiovascular risk. However, results from the Quebec Cardiovascular Study have demonstrated that small, dense LDLs are an important predictor for isch- emic heart disease in men, independent from concomi- tant variation in plasma lipid concentrations (5, 6). It thus seems that information on LDL size improves the ability to predict cardiovascular disease risk over traditional lipid variables. Several techniques can be used to measure LDL size and size distribution, such as electron microscopy of nega- tively stained lipoproteins (9), photon correlation spec- troscopy using light-scattering equipment (10), proton nuclear magnetic resonance spectroscopy (11–13), high- performance gel-filtration chromatography (HPGC) (14, 15), and nondenaturing polyacrylamide gradient gel elec- trophoresis (GGE). The latter technique has been most widely used in clinical and epidemiological studies. It has a very high resolution, enabling the separation of up to Abbreviations: apoB-100, apolipoprotein B-100; CE, cholesteryl ester; FC, free (unesterified) cholesterol; GGE, gradient gel electro- phoresis; HPGC, high-performance gel-filtration chromatography; IDL, intermediate density lipoprotein; PL, phospholipid; TG, triglyc- eride. 1 To whom correspondence should be addressed. e-mail: [email protected] Manuscript received 22 December 2003 and in revised form 6 February 2004. Published, JLR Papers in Press, February 16, 2004. DOI 10.1194/jlr.M300521-JLR200 by guest, on June 14, 2018 www.jlr.org Downloaded from
Transcript of Combined data from LDL composition and size measurement are … · · 2004-04-08Combined data...

Copyright © 2004 by the American Society for Biochemistry and Molecular Biology, Inc.
954 Journal of Lipid Research
Volume 45, 2004
This article is available online at http://www.jlr.org
Combined data from LDL composition and size measurement are compatible with a discoid particle shape
Tom Teerlink,
1,
* Peter G. Scheffer,* Stephan J. L. Bakker,
†
and Robert J. Heine
†
Departments of Clinical Chemistry* and Endocrinology,
†
Institute for Cardiovascular Research, VU University Medical Center, 1007 MB Amsterdam, The Netherlands
Abstract The size of LDL is usually reported as particle di-ameter, with the implicit assumption that it is a sphericalparticle. On the other hand, data obtained by cryoelectronmicroscopy and crystallographic analysis suggest that LDLshape may be discoid. We have investigated LDL particle ge-ometry by combining data on LDL lipid composition withsize measurement. The mean LDL diameter of 160 sampleswas measured by high-performance gel-filtration chroma-tography (HPGC), and particle volume was calculated fromits lipid composition. Assuming a spherical shape, diame-ters calculated from volume correlated poorly with valuesobtained by HPGC (
R
2
�
0.36). Assuming a discoid shape,particle height was calculated from volume and HPGC di-ameter. Diameter (20.9
�
0.5 nm) and height (12.1
�
0.8nm) were not significantly related to each other (
r
�
0.14,
P
�
0.09) and accounted for 23% and 77%, respectively, ofthe variation in particle volume. In multivariate regressionmodels, LDL core lipids were the main determinants ofheight (
R
2
�
0.83), whereas free cholesterol in the shell,which contributes only 5–9% to LDL mass, was the main de-terminant of diameter (
R
2
�
0.54). We conclude thatcombined data from composition and size measurementsare compatible with a discoid particle shape and propose astructural model for LDL in which free cholesterol plays amajor role in determining particle shape and diameter.
—Teerlink, T., P. G. Scheffer, S. J. L. Bakker, and R. J. Heine.
Combined data from LDL composition and size measure-ment are compatible with a discoid particle shape.
J. LipidRes.
2004.
45:
954–966.
Supplementary key words
atherosclerosis
•
low density lipoprotein
•
low density lipoprotein composition
•
low density lipoprotein structure
•
low density lipoprotein size
•
unesterified cholesterol
Human LDL particles are the main carriers of choles-terol in the circulation. LDL particles are operationallydefined as lipoproteins within the density range of 1.019–1.063 g/ml. As such, LDL forms a heterogeneous family
of particles varying in density, size, composition, andother physicochemical properties. This heterogeneity hasclinical significance in that LDL subspecies differ in theirmetabolic behavior and pathologic roles [reviewed by Ber-neis and Krauss (1)]. During the last two decades, evi-dence has accumulated that LDL size is a parameter ofparticular clinical importance. Small, dense LDLs haveconsistently been shown to confer increased risk for car-diovascular disease (2–8). The presence of small, denseLDLs is strongly associated with increased plasma triglyc-eride (TG) levels and low HDL cholesterol, a triad col-lectively known as the atherogenic lipoprotein pheno-type. The metabolic intertwining of these lipid riskfactors makes it difficult to assess their independent con-tributions to cardiovascular risk. However, results from theQuebec Cardiovascular Study have demonstrated thatsmall, dense LDLs are an important predictor for isch-emic heart disease in men, independent from concomi-tant variation in plasma lipid concentrations (5, 6). It thusseems that information on LDL size improves the abilityto predict cardiovascular disease risk over traditional lipidvariables.
Several techniques can be used to measure LDL sizeand size distribution, such as electron microscopy of nega-tively stained lipoproteins (9), photon correlation spec-troscopy using light-scattering equipment (10), protonnuclear magnetic resonance spectroscopy (11–13), high-performance gel-filtration chromatography (HPGC) (14,15), and nondenaturing polyacrylamide gradient gel elec-trophoresis (GGE). The latter technique has been mostwidely used in clinical and epidemiological studies. It hasa very high resolution, enabling the separation of up to
Abbreviations: apoB-100, apolipoprotein B-100; CE, cholesterylester; FC, free (unesterified) cholesterol; GGE, gradient gel electro-phoresis; HPGC, high-performance gel-filtration chromatography;IDL, intermediate density lipoprotein; PL, phospholipid; TG, triglyc-eride.
1
To whom correspondence should be addressed.e-mail: [email protected]
Manuscript received 22 December 2003 and in revised form 6 February 2004.
Published, JLR Papers in Press, February 16, 2004.DOI 10.1194/jlr.M300521-JLR200
by guest, on June 14, 2018w
ww
.jlr.orgD
ownloaded from
Teerlink et al.
LDL particle shape is discoid 955
seven or eight subclasses of LDLs (7, 16, 17). Most often,however, the so-called LDL peak particle diameter (i.e.,the diameter of the most abundant LDL subclass withinan individual) is reported. The use of the term diameterimplies that LDL is a spherical particle. If LDL is envi-sioned as a stabilized oil-in-water emulsion, a spherical ge-ometry is a logical consequence of the tendency of suchemulsions to minimize the area of the oil droplets. Usingan emulsion particle model, it has been shown that it ispossible to predict the composition, density, and hydrody-namic properties of LDL as a function of particle size(18). Data obtained by electron microscopy with negativestaining are also compatible with a spherical shape (9).Therefore, it is not surprising that a spherical particle
shape is often taken for granted. On the other hand, thereare strong indications, obtained by cryoelectron micros-copy and crystallographic analysis, that LDL has a pseudo-cylindrical or discoid particle shape (19–24). There is yetanother simple but compelling argument against spheri-cal particle shape. If LDL consists of a spherical core sur-rounded by a 2 nm monolayer of polar lipids and protein,its diameter is expected to be mainly determined by thevolume of its core. This would inevitably lead to a strongassociation between particle size and the cholesteryl ester(CE) content of LDL, because CE is the major core lipid.In contrast to this expectation, the strongest associationsbetween particle size and lipid content are usually foundfor the polar surface-oriented lipids (14, 16, 25–27).
In the present study, we have attempted to differentiatebetween spherical and nonspherical particle geometry us-ing the following strategy. The fact that each LDL particlecontains a single copy of apolipoprotein B-100 (apoB-100)allows straightforward calculation of average LDL particlevolume from its lipid composition (16, 18). If LDL isspherical, its mean diameter, as calculated from particlevolume, should be in close agreement with the diametersobtained by direct measurement. We have measured aver-age LDL size using an HPGC technique that is character-ized by very high precision (14). Analysis of 160 LDLpreparations revealed a poor correlation between LDL di-ameters measured by HPGC and calculated from volume,indicative of nonspherical geometry. Using a discoid parti-cle model, the data could be reconciled. A direct conse-quence of a discoid LDL model is that two parameters(i.e., particle diameter and height) are required to charac-terize the particle. We have investigated the associationsbetween these particle dimensions on the one hand andLDL lipid constituents and plasma lipids on the otherhand. On the basis of our data, we present a structuralmodel of LDL in which free cholesterol plays a major roleas a determinant of particle shape and diameter.
METHODS
Samples
We used plasma samples from 160 subjects with well-con-trolled type 2 diabetes who were participating in ongoing trials atthe Diabetes Center of the VU University Medical Center. The lo-
cal ethics committee approved these trials, and all subjects gavewritten informed consent. Subjects were selected to ensure abroad distribution of fasting plasma TGs. Fasting blood sampleswere collected into EDTA-containing tubes and centrifuged at
1,500
g
for 10 min at room temperature. Plasma was stored at
�
70
�
C until analysis.
LDL isolation
LDL was isolated from 0.9 ml of plasma by ultracentrifugation
between densities of 1.019 and 1.063 g/ml as described previously(14). Briefly, plasma was adjusted to a density of 1.019 g/ml andcentrifuged at 417,000
g
for 1 h, 40 min at 15
�
C in a BeckmanOptima-TLX ultracentrifuge with a fixed-angle type 100.4 rotor.After removal of the top layer, containing VLDL and intermediate
density lipoprotein (IDL), the density of the infranatant was ad-
justed to 1.063 g/ml, followed by centrifugation for 5 h at 417,000
g
.Subsequently, LDL was collected from the top of the tube andstored at 4
�
C in the dark. From a limited number of samples,LDL was also isolated between densities of 1.031 and 1.044 g/ml.This narrow density range results in a more homogeneous LDLpreparation, from which the buoyant LDL-1 and dense LDL-6subfractions, as defined by Baumstark et al. (28), are excluded.
LDL particle size measurement
LDL size was measured by HPGC, essentially as described be-fore (14), but with a modified calibration procedure. IsolatedLDL samples (50
�
l) were chromatographed on a Superose 6column from Pharmacia (Uppsala, Sweden) at a flow rate of 0.5ml/min with PBS (0.1 mol/l sodium phosphate, 0.2 mol/l NaCl,and 0.1 mmol/l EDTA, pH 7.4) as a mobile phase. Detection wasperformed at 280 nm. LDL eluted between 20 and 26 min as anearly symmetrical peak, and the retention time of the peakapex was used to calculate average LDL particle diameter, usingthyroglobulin and its dimer (17.0 and 23.6 nm, respectively) andfibrinogen (22.2 nm) as calibrators of known diameter. Usingthis HPGC system, the values obtained are strongly correlatedwith values measured by the widely used native GGE system (
r
�
0.88,
P
�
0.001). For quality control, an LDL sample stored in al-
iquots at
�
70
�
C was included in every series of samples. Intra-
assay and interassay coefficients of variation for LDL diameter were0.1% and 0.2%, respectively. Column temperature was kept at25
�
C by means of a water bath. In some experiments, calibrationof the column and determination of LDL size were performed ata temperature of 37
�
C.
LDL composition
Total cholesterol, free (unesterified) cholesterol (FC), phos-pholipids (PLs), and TGs in LDL were analyzed with commer-cially available tests (Roche, Mannheim, Germany) on a CobasBio centrifugal analyzer (Roche). Coefficients of variation forthese assays are less than 2%. CEs were calculated as the differ-ence between total cholesterol and FC. Because the method forthe determination of PL is based on the detection of choline af-ter enzymatic hydrolysis, it only detects choline-containing PL,i.e., (lyso)phosphatidylcholine and sphingomyelin. As LDL con-
tains
�
7% non-choline-containing PL (18), measured valueswere multiplied by 1.075. The protein content of LDL was mea-
sured by the Lowry method modified to allow measurement inlipoproteins, as described by Markwell et al. (29). Because apoB-100 leads to a more intense color development in the assay com-pared with BSA used for calibration, a correction factor has to beapplied (16, 18, 28). To assess this factor, absolute protein deter-minations were performed by amino acid analysis of LDL sam-ples (n
�
6) after 24 h of hydrolysis at 110
�
C in 6 mol/l HCl.Amino acid analysis was performed by reversed-phase chroma-tography after precolumn derivatization with ortho-phthaldial-
by guest, on June 14, 2018w
ww
.jlr.orgD
ownloaded from

956 Journal of Lipid Research
Volume 45, 2004
dehyde (30). The concentrations of leucine and phenylalanine,amino acids that are fully recovered under these hydrolysis con-ditions, were used to calculate the apoB-100 concentration bycomparison with the known amino acid composition of apoB-100 (31). In this way, we found that the colorimetric proteindetermination leads to an overestimation of the apoB-100 con-centration by a factor of 1.06, in close agreement with the valuesestablished by other investigators (16, 28). Analysis of represen-tative LDL samples by SDS-PAGE revealed only a single proteinband; therefore, no correction for the presence of proteins otherthan apoB-100 was made.
Analysis of the fatty acid composition of the various lipidclasses of LDL was performed as described previously (32).Briefly, lipids were extracted by the procedure of Bligh and Dyer(33) and separated by thin-layer chromatography. Individualfatty acids in the CE, PL, and TG fractions were analyzed by capil-lary gas chromatography after transmethylation (34).
Calculation of particle size and density
Particle volume and mass of LDL were calculated from its lipidcomposition essentially as described by Schumaker, Phillips, andChatterton (18). The molecular weights of CE, PL, and TG aredependent on the chain length and degree of unsaturation oftheir esterified fatty acids. For a subset of 100 LDL samples, thefatty acid profiles of these lipid classes were determined to obtainan accurate estimate of their average molecular weights. For CE,PL, and TG, mean (SD) molecular weights of 647.9 (0.9), 786.0(4.0), and 859.2 (6.1) were obtained. As the standard deviationswere very small, the average values were used for subsequent cal-culations on all 160 samples. For FC, a molecular weight of 386.7was used. The measured lipid-protein ratios (mmol/g) of LDLwere converted to mass ratios by multiplying with the molecularweight of the respective lipid. In this way, the mass percentage ofprotein in LDL was calculated, and using the molecular weightof apoB-100 (513,000), the molecular weight of LDL was derived.To correct for the fact that apoB-100 is glycosylated, a value of33,340 was added, assuming a carbohydrate content of 6.5%(18). To obtain molar LDL volume, similar calculations were per-formed using specific volumes of 1.058, 1.021, 0.984, 1.102, 0.74,and 0.60 ml/g for CE, FC, PL, TG, protein, and carbohydrate, re-spectively (18). The volume of a single LDL particle was then cal-culated by division through Avogadro’s number (6.023
�
10
23
).It should be noted that in all calculations of particle geometry,the carbohydrate content of LDL was ignored because the sugarchains of apoB-100 extend into the aqueous phase and thereforewere considered not to contribute to the volume of the LDL par-ticle. The carbohydrate content of apoB-100 was only included incalculations of LDL molecular weight and particle density. Den-sity calculated in this way is slightly lower than buoyant density,attributable to the fact that at high centrifugal force LDL parti-cles are compressed more than the surrounding salt solution.
PL is located in the shell of LDL, whereas CE and TG are al-most exclusively confined to the core. In contrast, FC is mainlylocated in the shell of LDL (FC-shell) but is also present in ap-preciable amounts in the core (FC-core), the relative distribu-tion between these compartments being determined by the dis-tribution coefficient K (i.e., FC-shell as weight percentage ofshell lipids divided by FC-core as weight percentage of core lip-ids). For K, we used a value of 6 (35). The FC-shell/FC-core ratiocan be calculated by multiplying K with the mass ratio of theshell and core compartments. To this end, we used an iterativeprocedure in which as a first approximation all FC was assumedto be present in the shell, resulting in a FC-shell/FC-core ratio ofK
�
(FC
�
PL)/(CE
�
TG), with all lipids expressed on a massbasis. From this ratio and the total amount of FC, both FC-shelland FC-core were computed. Using these values, a second ap-
proximation of the FC-shell/FC-core ratio was calculated as K
�
(FC-shell
�
PL)/(FC-core
�
CE
�
TG). This procedure was re-peated until the difference between the converging values ob-tained during successive iterations was negligible.
Considerations of particle geometry
If LDL is a spherical particle of volume V, its radius r or diame-ter d can be calculated from the following formula:
V
�
4/3
�
�
r
3
�
1/6
�
�
d
3
(Eq. 1)
and particle area A can be calculated as follows:
A
�
4
�
�
r
2
�
�
d
2
(Eq. 2)
The increase of particle area as diameter increases by a smallamount can be calculated by differentiating equation 2 with re-spect to d:
A/
d
�
2
�
�
d
(Eq. 3)
If LDL is envisioned as a discoid particle (i.e., a cylinder withvolume V, area A, radius r, diameter d, and height h), then its vol-ume can be calculated using the following mathematical for-mula:
V
�
�
r
2
�
h
�
1/4
�
�
d
2
�
h
(Eq. 4)
The surface area A consists of two components: the flat topand bottom surfaces and the curved lateral surface of the parti-cle. If the sum of the areas of the top and bottom surfaces is de-noted as A
flat
and the area of the lateral surface is denoted asA
curved
, then the following equations hold:
A
flat
�
2
�
�
r
2
�
1/2
�
�
d
2
(Eq. 5)
A
curved
�
2
�
�
r
�
h
�
�
d � h (Eq. 6)
The area increase of both the flat and curved surfaces of theparticle as diameter or height increases by a small amount can becalculated by differentiating both equations 5 and 6 with respectto d and h:
Aflat/d � � d (Eq. 7)
Aflat/h � 0 (Eq. 8)
Acurved/d � � h (Eq. 9)
Acurved/h � � d (Eq. 10)
Calculation of average particle diameter from average particlevolume using equation 1 leads to an overestimation of averageparticle diameter, attributable to the fact that volume is propor-tional to the third power of diameter. This effect is more pro-nounced when the size distribution is broad. To assess the magni-tude of this effect in our experiments, we have performedcomputer simulations using an algorithm capable of generatingrandom numbers with a normal distribution. A mean value of19.9 nm and a SD of 0.6 nm (the actual values for particle diame-ters calculated from composition as reported in Table 3) wereused. The algorithm created a total of 500 individual virtual par-ticles. Mean particle diameter was 19.916 � 0.586 nm (range,18.15–21.62 nm), and mean particle volume was 4,147 � 366nm3 (range, 3,130–5,291 nm3). It should be noted that this rangeof volumes was close to the actual range we measured (3,311–4,836 nm3 as reported in Table 3). When the average particle vol-ume was used to calculate the average particle diameter, a valueof 19.933 nm was obtained, 0.017 nm higher then the real valueobtained by averaging the individual diameters. This simulationshows that calculation of average particle diameter from averagevolume does indeed lead to an overestimation, although the ef-fect is almost negligible.
by guest, on June 14, 2018w
ww
.jlr.orgD
ownloaded from

Teerlink et al. LDL particle shape is discoid 957
Statistical analysisData are reported as means and SD, with ranges as 2.5th and
97.5th percentiles. For the analysis of agreement between meth-ods of measurement, we used the statistical methods and graphicrepresentation suggested by Bland and Altman (36). Univariateassociations between LDL dimensions and other variables werefirst examined by calculation of Pearson correlation coefficients.Significant predictors of diameter or height were then used instepwise forward multiple linear regression analysis with criteriaof P � 0.05 for entry and P � 0.1 for exit. The regression modelswere checked for their residuals to have a normal distributionand a constant variability across the range of fitted values.
RESULTS
LDL compositionAs our aim was to study the relation between LDL com-
position and particle dimensions, it was important tostudy LDL preparations with a wide range of particle di-ameters. Because LDL size is inversely associated withplasma TG levels, the most convenient way to accomplishthis is to select subjects with a wide range of fasting TGs.Type 2 diabetes mellitus is associated with increasedplasma TG levels; therefore, we chose to isolate LDL fromplasma of 160 subjects with type 2 diabetes with plasmaTGs ranging from 0.5 to 5.6 mmol/l.
The composition of LDL was determined after isolationfrom plasma by sequential ultracentrifugation. Becauseeach LDL particle contains a single copy of apoB-100, it isconvenient to express the lipid composition of LDL on a
protein basis (i.e., as millimoles of lipid per gram of pro-tein), as shown in Table 1. From these data and the molec-ular weights of the lipids and apoB-100, the number oflipid molecules per LDL particle was calculated. The re-sults (Table 1) show that CE molecules are present in thehighest numbers, followed by PL, FC, and TG. The varia-tion of the amount of lipid molecules (i.e., the ratio be-tween the 97.5th and the 2.5th percentiles) was lowest forCE and PL (1.61 and 1.64, respectively), somewhat higherfor FC (1.96 and 2.18 for FC-core and FC-shell, respec-tively), and highest for TG (2.51).
To facilitate the comparison with data from the litera-ture, we also expressed the lipid composition on a masspercentage basis (Table 2). In the data shown in the up-per part of the table, the protein part of LDL was includedin the calculation. Protein (i.e., apoB-100) accounted for18–26% of particle mass. A strong disadvantage of this wayof presenting the composition of LDL is that in small LDLparticles, the single copy of apoB-100 accounts for a largermass percentage compared with that in large LDL parti-cles. Mass percentages of all lipids will thus decreasewith decreasing particle size, obscuring possible relativechanges among the lipids. We circumvented this problemby expressing the lipid content as a percentage of the totallipid mass of LDL, as shown in the bottom part of Table 2.Expressed in this way, the variation in lipid content wassomewhat smaller compared with data expressed on thebasis of total LDL mass (upper part of Table 2) or ex-pressed as number of lipid molecules per particle (Table1), with the notable exception of TG, which showed thelargest variation if expressed as a percentage of lipid mass.
TABLE 1. Composition of LDL expressed as lipid protein ratio and as number of lipid molecules per LDL particle
Variable CE FC FC-Shell FC-Core PL TG
Lipid protein ratio (mmol/g)Mean (SD) 2.99 (0.36) 1.15 (0.19) 0.93 (0.16) 0.22 (0.03) 1.61 (0.18) 0.39 (0.09)P2.5 2.33 0.74 0.56 0.15 1.18 0.24P97.5 3.76 1.49 1.23 0.29 1.94 0.61
Lipid molecules per LDL particleMean (SD) 1,536 (186) 590 (97) 475 (81) 115 (17) 825 (90) 202 (47)P2.5 1,196 377 289 75 607 124P97.5 1,928 765 629 147 994 311P97.5/P2.5 1.61 2.03 2.18 1.96 1.64 2.51
CE, cholesteryl ester; FC, free (unesterified) cholesterol; FC-core, FC in the core compartment of LDL; FC-shell, FC in the surface compartment of LDL; PL, phospholipid; TG, triglyceride. P2.5 and P97.5 indicate the2.5th and 97.5th percentiles.
TABLE 2. Composition of LDL expressed as percentage of LDL mass and as percentage of LDL lipid mass
Variable CE FC FC-Shell FC-Core PL TG Protein
Percentage of LDL massMean (SD) 38.3 (2.3) 8.8 (1.0) 7.1 (0.8) 1.7 (0.2) 25.0 (1.3) 6.8 (1.7) 21.2 (1.7)P2.5 33.5 6.6 5.2 1.3 21.6 4.1 18.2P97.5 42.6 10.5 8.6 2.0 26.9 11.0 26.0P97.5/P2.5 1.27 1.59 1.65 1.54 1.25 2.68 1.43
Percentage of LDL lipid massMean (SD) 48.6 (2.6) 11.1 (1.1) 8.9 (1.0) 2.2 (0.2) 31.7 (1.4) 8.6 (2.2)P2.5 42.8 8.6 6.7 1.7 28.4 5.3P97.5 53.6 13.0 10.6 2.5 34.1 15.0P97.5/P2.5 1.25 1.51 1.58 1.47 1.20 2.83
by guest, on June 14, 2018w
ww
.jlr.orgD
ownloaded from

958 Journal of Lipid Research Volume 45, 2004
Physical characteristics of LDLFrom the compositional data (Table 1), the molar mass
of the LDL particle was calculated by multiplying thenumber of molecules of each component per particlewith its molecular weight, followed by summation of theresults. Division by Avogadro’s number then yields LDLparticle mass. In a similar way, LDL molar volume and vol-ume per particle were calculated. With the premise thatLDL is a spherical particle, its diameter was derived fromits volume (equation 1) and its density from volume andmass. The results of these calculations are summarized inTable 3. The difference in volume between the largest andthe smallest (i.e., the 97.5th and 2.5th percentiles) LDLparticles was 46%, which translates to a 14% difference indiameter. The difference for particle mass between theseextremes was somewhat smaller compared with volume(43% vs. 46%), because larger particles have a higherlipid content and hence a lower density.
Comparison of measured LDL diameters with values calculated from composition
The major aim of our study was to compare LDL di-mensions calculated from its chemical composition as de-scribed above with values obtained by direct measure-ments. To this end, the LDL preparations obtained afterultracentrifugation were also subjected to HPGC, a fullyautomated chromatographic method for the measure-ment of average LDL diameter with high precision inlarge series of samples. The results of the comparison ofthe 160 LDL preparations by both methods are shown as ascatterplot in Fig. 1A. Although the results obtained byboth methods showed a highly significant association, thecorrelation coefficient was rather low (r � 0.60, P �0.0001), considering that both methods are supposed tomeasure the same variable. In Fig. 1B, the results of bothmethods are compared by plotting the difference betweenthe values obtained by both methods against the averageof both methods in a Bland-Altman plot. As can be seen,the LDL diameters measured by HPGC are on average0.94 nm larger than the calculated diameters (95% limitsof agreement 0.03–1.86 nm). The 1.83 nm range encom-passed by the 95% confidence limits is close to the rangeof actual LDL diameters, indicating that the two methodscannot be used interchangeably.
LDL dimensions assuming a discoid particle shapeTheoretically, the lack of agreement between estimates
of LDL size obtained by direct measurement and by calcu-lation can be explained by high imprecision of either one
or both of the methods. However, as explained in detail inDiscussion, imprecision of measurements is responsiblefor only a small part of the lack of agreement betweenboth estimates of LDL diameter. An alternative explana-
Fig. 1. A: Scatterplot of calculated LDL diameter versus measureddiameter. LDL diameter was calculated from its volume as assessedfrom its lipid composition, assuming a spherical particle shape. LDLdiameter measurement was performed by high-performance gel-fil-tration chromatography (HPGC). B: Bland-Altman plot of the dif-ference between measured and calculated LDL diameters againstthe average of both estimates. The dotted lines indicate the 1.96 SDlimits and encompass the 95% limits of the confidence interval.
TABLE 3. Physical characteristics of LDL estimated from LDL lipid composition assuming a spherical particle shape
Variable Volume Core Volume Shell Volume Diameter Molecular Mass Density
nm3 nm �106 g/ml
Mean (SD) 4,142 (351) 2,141 (210) 2,001 (161) 19.9 (0.6) 2.59 (0.21) 1.031 (0.005)P2.5 3,311 1,703 1,596 18.5 2.10 1.022P97.5 4,836 2,600 2,296 21.0 3.00 1.044P97.5/P2.5 1.46 1.53 1.44 1.14 1.43 1.022
by guest, on June 14, 2018w
ww
.jlr.orgD
ownloaded from

Teerlink et al. LDL particle shape is discoid 959
tion is that the basic premise in calculating diameter fromparticle volume (i.e., that LDL is a spherical particle) is in-correct. We have explored whether our data on particlecomposition and size can be reconciled if a discoid parti-cle shape is assumed. If LDL has the shape of a flat cylin-der, its size and shape are defined by two parameters, thediameter and height of the cylinder, with diameter beinglarger than height. The latter restriction makes it reason-able to assume that in size determination by HPGC, diam-eter is the variable that is actually measured. The separa-tion principle of HPGC is based on the capacity of LDLparticles to diffuse into pores of the stationary phase.Whether a particle can enter a pore is determined by thelargest dimension of the two-dimensional projection ofthe particle on the plane of the pore’s orifice. In the caseof a discoid particle, this largest dimension is equal to itsdiameter. As long as the condition that diameter is largerthan height is satisfied, data obtained by the HPGC tech-nique represent particle diameter. By combining LDL di-ameter with data on particle volume, calculated from itscomposition, it is now possible to calculate particle height(equation 4). The results of these calculations as given inTable 4 show that mean particle height is much smallerthan diameter (12.1 vs. 20.9 nm), which is reflected by themean aspect ratio of 1.73. The prerequisite for this calcu-lation to be valid (particle diameter should be greaterthan height, i.e., an aspect ratio of �1) was met for allLDL samples studied, as the aspect ratios ranged from1.51 to 2.01. Variation of particle height was much largerthan variation of particle diameter, as can be seen fromthe ratios between the highest and lowest values observed(Table 4) and from a scatterplot of the data (Fig. 2). Bothsize parameters were not significantly related to eachother (r � 0.14, P � 0.09), and as indicated by the pairs ofarrows in Fig. 2, subjects with LDL having the same diame-ter but widely differing heights and vice versa were presentin the data set. Multiple regression analysis, with particlevolume as the dependent variable, showed that height anddiameter accounted for 77% and 23% of the variation inparticle volume, respectively.
Influence of LDL density range on particle shapeLDL isolated between densities of 1.019 and 1.063 g/ml
contains the complete spectrum from large, buoyant tosmall, dense particles. Mean particle diameters as mea-sured by HPGC and values obtained by calculation from
particle volume may be influenced to a different extent bythe actual size distribution. To investigate the importanceof this possibly confounding factor, we also isolated LDLsbetween narrower density boundaries (1.031–1.044) froma limited number of samples (n � 30). Diameters ob-tained by HPGC measurement and diameters derivedfrom composition, assuming a spherical particle shape,were rather poorly correlated (r � 0.55), similar to the re-sults obtained for the 1.019–1.063 g/ml density range. As-suming a discoid particle shape, a mean diameter of 22.0 �0.3 nm (range, 21.5–22.5 nm) and a mean height of 11.8 �0.8 nm (range, 9.9–14.2 nm) were obtained, without sig-nificant correlation between the two dimensions (r �0.28, P � 0.14).
Effect of temperatureWe repeated the size measurement of the 1.031–1.044
g/ml density subfractions (n � 30) at 37�C to exclude thepossibility that the discoid particle shape derived from ourmeasurements is an artifact caused by the fact that sizemeasurements were performed at 25�C (i.e., below thephase transition temperature of the core lipids). Particlediameters measured by HPGC at 37�C were closely corre-lated to values obtained at 25�C (r � 0.95, P � 0.0001) butwere on average 0.21 � 0.11 nm larger. Assuming a dis-coid particle shape, a mean diameter of 22.2 � 0.3 nm(range, 21.7–22.8 nm) and a mean height of 11.6 � 0.7nm (range, 9.8–14.0 nm) were obtained, close to the val-ues at 25�C.
Associations between LDL dimensions and lipid composition
Univariate associations between the lipid componentsof LDL and particle volume, diameter, height, and aspectratio are shown in Table 5. The lipid composition was ex-pressed as the number of molecules per particle. In thisway, the mathematical entanglement of the individual lip-
TABLE 4. Dimensions of LDL assuming a discoid particle shape
Variable Volume Diameter Height Aspect Ratio
nm3 nm
Mean (SD) 4,142 (351) 20.9 (0.5) 12.1 (0.8) 1.73 (0.12)P2.5 3,311 19.6 10.5 1.51P97.5 4,836 21.6 13.9 2.01P97.5/P2.5 1.46 1.10 1.32 1.33
Volume was calculated from LDL composition, diameter was mea-sured by high-performance gel-filtration chromatography, and heightwas calculated from volume and diameter. Aspect ratio represents theratio of diameter and height.
Fig. 2. Scatterplot of LDL particle height versus diameter. LDLdiameter was determined by HPGC. Particle height was calculatedfrom particle volume (calculated from its lipid composition) anddiameter. Closed arrows indicate a pair of LDL samples with thesame height (11.8 nm) but a 2.4 nm difference in diameter. Openarrows indicate a pair of LDL samples with the same diameter (21.1nm) but a 4.0 nm difference in height.
by guest, on June 14, 2018w
ww
.jlr.orgD
ownloaded from

960 Journal of Lipid Research Volume 45, 2004
ids, resulting from expressing the lipid content as a masspercentage, was avoided. With the exception of TG, alllipid components showed strong and highly significantpositive associations with particle dimensions and inverseassociations with the aspect ratio. For TG, all associationswere nonsignificant (P � 0.1).
To investigate which lipid components contribute themost to the dimensions of LDL, we examined these rela-tions by multiple linear regression analysis. As particle vol-ume and aspect ratio are by definition fully determined bythe diameter and height of the particle, only regressionmodels with the latter two as dependent variables werebuilt. The resulting stepwise regression models for LDLdiameter and height (Tables 6, 7) show that the lipids thatindependently contributed to diameter were differentfrom the lipids that independently determined height.Particle diameter was to a large extent determined by thecontent of FC in the shell. Although the FC content of thecore of LDL also entered the model, its contribution com-pared with FC-shell was negligible, as shown by the mar-ginal increase of R2 from 0.54 to 0.55 (Table 6). To investi-gate whether this model was critically dependent on thedistribution of FC between the shell and the core, we ex-amined the consequences of ignoring the distinction be-tween FC-shell and FC-core (i.e., a stepwise regressionanalysis with CE, FC, PL, and TG as independent variableswas performed). Only FC significantly contributed to theresulting model, which had a predictive power (R2 �0.52) that was almost equal to the model with FC-shell asthe independent variable. In contrast to the models for di-ameter, FC did not contribute significantly to models ofLDL height (Table 7). CE alone accounted for 69% of thevariation in particle height, and after the addition of TGto the model, the explained variation increased to 83%.
When samples were divided into two equal groups basedon particle density (i.e., particles with a calculated densitybelow and above the median), multivariate regressionanalysis gave essentially the same results (data not shown).Overall, we can conclude that the neutral lipids CE andTG, which reside in the core of the particle, are the maindeterminants of particle height, whereas the more polarlipid FC, which is mainly located in the shell of the parti-cle, determines its diameter.
Next, we investigated multiple linear regression modelswith LDL diameter and height as determinants of thelipid content of LDL. The models for CE, FC-shell, FC-core, and PL content of LDL are summarized in Table 8.For TG, no significant model was obtained. The explainedvariance of the four models ranged from 78% to 88%. Ascan be seen from the standardized values, particleheight was the major determinant of CE content and to alesser extent of PL and FC-core content, whereas diameterwas the main determinant of FC-shell content.
The fact that both FC-shell and PL are confined to theshell of the particle that surrounds the core as a mono-layer enabled us to calculate the increase in the numberof these molecules per square nanometer increase of par-ticle surface area from the regression coefficients of therespective regression models. Of note is the fact that asparticle diameter increases, the flat top and bottom sur-faces as well as the curved lateral surface of LDL increasein area (equations 7, 9). On the other hand, an increasein particle height leads only to an increase in the area ofthe lateral surface (equation 10), with no change in thearea of the top and bottom surfaces (equation 8). Thisdistinguishing geometrical feature of a cylinder allowed usto resolve the incremental surface density of PL and FC-shell into separate components for the flat and curvedparts of the LDL particle. Surface densities calculated inthis way were compared with incremental surface densi-ties assuming a spherical geometry of LDL (Table 9). Thesurface density of PL is the same for the flat and curvedsurfaces and equals the density calculated for a sphericalparticle. In contrast, the incremental FC-shell density ismuch higher for the flat surfaces than for the curved sur-face. This is reflected by a much higher incremental FC/PL ratio of the flat surface (1.30 versus 0.71).
Association between particle dimensions and plasma lipids
Small, dense LDLs are a feature of the atherogenic lipidprofile, together with increased plasma TGs and low HDL
TABLE 5. Univariate associations (Pearson correlation coefficients) between LDL lipid components and particle dimensions
Lipid Molecules per LDL Particle
Particle Volume
Core Volume
Shell Volume
Particle Diameter
Particle Height
Aspect Ratio
CE �0.90 �0.94 �0.73 �0.46 �0.83 �0.66FC �0.83 �0.73 �0.88 �0.72 �0.60 �0.35FC-core �0.84 �0.83 �0.75 �0.62 �0.66 �0.45FC-shell �0.82 �0.69 �0.89 �0.73 �0.57 �0.33PL �0.92 �0.79 �0.98 �0.62 �0.75 �0.54TG �0.04 �0.03 �0.05 �0.08 �0.09 �0.13
Correlation coefficients shown in boldface are significant at P �0.0001.
TABLE 6. Stepwise multiple linear regression models with lipid components of LDL as determinants of LDL diameter
Model Variable (95% CI) Standardized P Adjusted R2 Residual SD
nm
Model 1 FC-shell 0.0041 (0.0035–0.0047) 0.73 �0.0001 0.54 0.308Model 2 FC-shell 0.0054 (0.0040–0.0068) 0.96 �0.0001
FC-core �0.0066 (�0.0130–0.0002) �0.25 0.045 0.55 0.305
CI, confidence interval. Variables allowed to enter the model were CE, FC-core, FC-shell, PL, and TG (as num-ber of lipid molecules per LDL particle).
by guest, on June 14, 2018w
ww
.jlr.orgD
ownloaded from

Teerlink et al. LDL particle shape is discoid 961
cholesterol. We have investigated whether the well-knownpositive correlation between LDL size and HDL choles-terol and the negative correlation between LDL size andplasma TGs are also apparent if LDL size is expressed interms of particle volume, diameter, and height. The re-sults shown in Fig. 3 demonstrate that the strongest associ-ations with plasma TG were observed for LDL diameter,with weaker associations for LDL volume and height. As-sociations between LDL dimensions and HDL cholesterolshowed the same trend but were in general less strong oreven nonsignificant in the case of particle height.
DISCUSSION
The primary objective of this study was to determinewhether or not LDL particle geometry is spherical. Ourapproach consisted of calculating particle volume fromLDL lipid composition and measuring particle diameterby HPGC. If LDL is indeed a spherical particle, its diame-ter can be calculated from particle volume and the valuesobtained should be in good agreement with the valuesobtained by direct measurement. However, our resultsshowed a large discrepancy between these two measures,suggesting that the assumption that LDL is spherical isfalse. Reconciliation of this discrepancy between directsize measurement and calculated values was obtained byassuming cylindrical particle geometry, necessitating theuse of two parameters to describe particle size (i.e., diame-ter and height). This cylindrical model has some strikingfeatures. First, particle diameter was larger than particleheight for all 160 samples studied, as can be seen from theaspect ratio (i.e., the ratio between diameter and height),which varied between 1.51 and 2.01. LDL thus resembles aflattened cylinder or disk. Second, height varied over amuch wider range than diameter. The difference betweenthe largest and smallest particles studied was 2.8 nm or15% in terms of diameter, whereas the difference was 5.1
nm or 53% in terms of height. As a consequence, the vari-ation in particle volume was mainly determined by varia-tion in height and to a much lesser extent by variation indiameter. Linear regression analysis revealed that varia-tions in height and diameter accounted for 77% and 23%of the variation in volume, respectively. Third, particle di-ameter and height seemed to be unrelated variables. Par-ticles with extreme combinations of diameter and heightwere present in our data set (Fig. 2). This segregation be-tween LDL dimensions was also apparent when we deter-mined the main lipid determinants of diameter andheight by multiple linear regression analysis. A salient fea-ture of the models describing the associations betweenparticle dimensions and lipid content is that particleheight was primarily determined by the CE and TG con-tent of LDL, whereas the FC-shell content of LDL was themain determinant of LDL diameter (Tables 6, 7). In otherwords, core lipids determine the height of the particle,whereas FC present on the surface determines its diame-ter. The latter association is remarkable given the fact thatFC-shell accounts for only 5–9% of particle mass (Table2). Other investigators have found this strong associationbetween FC and LDL diameter as well (16, 26, 27).
It can be argued that the height dimension of LDL, in-troduced by us to account for the poor agreement be-tween the two methods used to assess particle diameter,has no physical reality but is merely an artificial way toquantify the random scatter around the regression linebetween the size measurements shown in Fig. 1. Theoreti-cally, the lack of agreement between estimates of LDL sizeobtained by direct measurement and by calculation canbe explained by the high imprecision of either one orboth of the methods. The precision of the HPGC methodis very high (interassay coefficient of variation � 0.2%).The precision of the calculated diameters is somewhatlower, attributable to the fact that it is based on five mea-surements (CE, FC, PL, TG, and protein). However, thecompositional data obtained in our study are in excellent
TABLE 7. Stepwise multiple linear regression models with lipid components of LDL as determinants of LDL height
Model Variable (95% CI) Standardized P Adjusted R2 Residual SD
nm
Model 1 CE 0.0037 (0.0033–0.0041) 0.83 �0.0001 0.69 0.46Model 2 CE 0.0043 (0.0040–0.0046) 0.96 �0.0001
TG 0.0070 (0.0058–0.0082) 0.40 �0.0001 0.83 0.34
Variables allowed to enter the model were CE, FC-core, FC-shell, PL, and TG (as number of lipid moleculesper LDL particle).
TABLE 8. Multiple linear regression models with LDL particle dimensions (diameter and height) as determinants of the number of lipid molecules per LDL particle
Variable
CE FC-Shell FC-Core PL
(95% CI) Standardized (95% CI) Standardized (95% CI) Standardized (95% CI) Standardized
Diameter (nm) 146 (117–174) 0.36 120 (107–133) 0.67 20 (17–22) 0.52 111 (100–122) 0.57Height (nm) 175 (160–191) 0.78 50 (43–57) 0.51 14 (12–15) 0.65 71 (65–77) 0.66Adjusted R2 model 0.81 0.80 0.78 0.88
by guest, on June 14, 2018w
ww
.jlr.orgD
ownloaded from

962 Journal of Lipid Research Volume 45, 2004
agreement with data reported by other investigators (16,28, 37–40). In addition, during calculation of particle di-ameter, the relative measurement error is considerably at-tenuated, because diameter is proportional to the cubicroot of particle volume (e.g., a 1.0% error in measure-ment of volume translates into a 0.33% error in calculateddiameter). Finally, the fact that multivariate regressionmodels showed the lipid components that independentlydetermine LDL height to be different from the lipid com-ponents that determine LDL diameter strongly suggeststhat particle height is not a measurement artifact. Thus,the imprecision of measurements is probably responsiblefor only a small part of the lack of agreement between thetwo estimates of LDL diameter. We believe that this suffi-ciently shows that particle height is not a virtual dimen-sion but is a real particle dimension.
There are some limitations to this study that deserve at-tention. First, it should be stressed that a discoid particleshape was not deduced from our experiments but was as-sumed a priori and shown to be compatible with our data.Our data could also be analyzed using an ellipsoidalmodel, in which particle shape is characterized by a longaxis and a short axis. However, the ellipsoidal modelwould yield the same associations between lipid compo-nents and particle dimensions found for the discoidalmodel, with diameter and height replaced by long andshort axes, respectively. Second, most of the HPGC mea-surements were performed at 25�C (i.e., below the phasetransition of the lipid core). However, in a subset of sam-ples, measurements performed at 37�C gave essentiallyidentical results, suggesting that a discoid particle shapealso represents the in vivo situation. Third, our resultsmight be influenced by the fact that the LDL samplesstudied were all obtained from individuals with type 2 dia-betes. It is known that the cluster of factors that constitutethis metabolic syndrome is associated with small LDLs(41, 42). However, it has been shown that type 2 diabetesis not an independent determinant of LDL size; rather, itseffects on LDL size are probably mediated via generalmetabolic processes involving TG-rich lipoproteins (37,43). Therefore, we think that the results and implicationsof our study have general importance and are not limitedto individuals with type 2 diabetes.
Our choice of a discoid model was based on data ob-tained by cryoelectron microscopy and crystallographicanalysis, suggesting that LDL particles may have a pseu-docylindrical or discoid shape (19–24). The particle di-mensions derived from our model are in striking agree-ment with the values obtained by cryoelectron microscopyreported by van Antwerpen and colleagues (19, 21) (i.e.,�21 and 12 nm for diameter and height, respectively).These dimensions were derived from circular and rectan-gular projections of individual LDL particles in cryoelec-tron micrographs, in contrast to our study, in which aver-age LDL dimensions for each subject were determinedand no information on intraindividual heterogeneity ofparticle dimensions was obtained. Also, the wide range ofaspect ratios, with an average value of �1.7, reported byvan Antwerpen et al. (22) closely agrees with the valuesobserved in the present study.
An important question that remains to be answered iswhy LDL should adopt a discoid shape. As shown in Table9, the incremental FC/PL ratio in the curved lateral sur-face of the particle is almost two times lower than that inthe flat top and bottom surfaces. These differences be-tween surface densities of the shell lipids may provide aclue to the driving force behind the transformation fromspherical to discoid particle shape. In distearoylphosphati-dylcholine liposomes, the surface area per PL molecule is�65 Å2 (44), close to the 62 Å2 area reported for fullycompressed monolayers of egg lecithin (35). As each PLmolecule contains two acyl chains, the area per acyl chainamounts to 31–32.5 Å2. In contrast, hydrocarbon chains ina crystalline lattice are much more densely packed to18.5–20 Å2 (i.e., �60% of the area available for the PL acylchains) (35). This shows that in planar monolayer or bi-layer systems devoid of cholesterol, the PL acyl chains areloosely packed. In cholesterol-containing biological andartificial membranes, the sterol skeleton of FC interactswith the acyl chains of the PL molecules, resulting in con-densation of the latter. In highly curved systems such asLDLs, the packing constraints experienced by the lipidsattributable to geometrical restrictions perturb their phys-ical properties and mutual interactions, in comparisonwith planar or less highly curved systems. A simple calcula-tion may illustrate this. A spherical LDL particle of 20 nm
TABLE 9. Incremental number of molecules of FC and PL per additional square nanometer of LDL surface area
LDL Particle Geometry FC-Shell PL FC-Shell/PL Ratio
molecules/nm2
Spherical 0.93 � 0.05 1.10 � 0.04 0.85 � 0.06Discoidal
Curved lateral surface 0.77 � 0.06 1.08 � 0.05 0.71 � 0.06Flat top and bottom surfaces 1.39 � 0.10 1.07 � 0.09 1.30 � 0.15
The increase of total LDL surface area as particle diameter increases (see equations in Methods) was com-bined with the regression coefficients from Table 8 to calculate the incremental number of molecules per squarenanometer of particle surface. Next, the incremental number of molecules on the curved lateral surface of theparticle was calculated in a similar way from the regression coefficients and the increase of particle area with in-creasing height, based on the fact that the flat top and bottom surfaces of the particle do not change with particleheight. The incremental number of molecules on the flat top and bottom surfaces was then calculated by subtrac-tion. For comparison, data for a spherical LDL particle were calculated as well.
by guest, on June 14, 2018w
ww
.jlr.orgD
ownloaded from

Teerlink et al. LDL particle shape is discoid 963
diameter with a surface monolayer thickness of 2 nm has acore diameter of 16 nm. As the surface area is propor-tional to the square of the diameter, the ratio of the coreto the surface area of the particle is (16/20)2 � 0.64. Thearea available for the terminal methyl groups of the PLacyl chains residing at the interface between the surfacemonolayer and the core is thus only 64% of the area occu-pied by the PL head groups. This value is close to the areaoccupied by the acyl chains in a fully condensed state asestimated above, leaving little space for FC molecules be-tween the PL acyl chains. If we consider a cylindrical LDLparticle of 20 nm diameter, the situation is completely dif-ferent. For the flat top and bottom surfaces, the ratio ofthe core to the surface area is 1, and for the lateral sur-face, being curved in only one dimension, the ratio of thecore to the surface area is 16/20 � 0.8. The space con-straint arising in the surface monolayer of a spherical par-ticle as its diameter gets smaller is thus relieved by thetransition to a cylindrical configuration. This transition is
accompanied by a relative FC enrichment of the flat sur-faces of the particle, leaving the curved lateral surface rel-atively devoid of FC, in accordance with the FC/PL ratiosshown in Table 9. It is also possible that the distribution ofFC between the shell and the core region of LDL is shiftedtoward the latter, or that some of the FC molecules leavethe LDL particle altogether. Although we have shown thatthe shape transformation leads to a general relief of ten-sion in the shell of the particle, we are left with a seriousproblem arising at the boundaries between the curved lat-eral surface and the flat top and bottom surfaces. There,the PL acyl chains meet at right angles, which is physicallyimpossible. This boundary problem of our discoid LDLmodel can be resolved by assuming that both the upperand lower rims of the particle are covered by apoB-100.The model thus requires that the single apoB-100 mole-cule encircles the particle twice: once at the upper rim ofthe LDL particle and a second time at the lower rim of theparticle. Assuming a diameter of 20 nm, a height of 12
Fig. 3. Relations of LDL particle volume (top row), diameter (middle row), and height (bottom row) withplasma triglycerides (left column) and HDL cholesterol (right column).
by guest, on June 14, 2018w
ww
.jlr.orgD
ownloaded from
964 Journal of Lipid Research Volume 45, 2004
nm, and a monolayer thickness of 2 nm, the core will havea diameter and height of 16 and 8 nm, respectively, re-quiring a minimal total path length of apoB-100 of 2 � � 16 � 8 � 108 nm. At first sight, this may seem an unre-alistic value, much higher than the 65 nm length deducedfrom electron microscopy data of deoxycholate-solubi-lized apoB-100 reported by Gantz, Walsh, and Small (45)and also discordant with current models of LDL, in whichapoB-100 fully encircles the spherical particle only once(46). In the belt-and-bow model put forth by Chattertonet al. (47), apoB-100 makes a full turn around the particlelike a belt, with a loose C-terminal part crossing over andforming a bow. This model was very elegantly derived bymeasuring the angles between pairs of monoclonal anti-bodies directed against epitopes at defined positions inthe primary structure of apoB-100 (47). However, the pathfollowed by apoB-100 on the surface of LDL is not straightbut meandering, and as observed by Hevonoja et al. (48)in their review of LDL structure, a total path length of110–120 nm for apoB-100 can be derived from the data ofChatterton et al. (47). This value is close to the minimalpath length derived from our discoid LDL model. In addi-tion, apoB-100 is by necessity very flexible, as it must con-tinually adapt its conformation and length to decreasingparticle size during the lipolytic cascade from VLDL toLDL. This flexibility is in accord with data reported by Mc-Namara et al. (16), who in a very elegant study of the par-ticle composition and physical characteristics of eightLDL subspecies presented evidence that with decreasingparticle size the core surface area requiring coverage byapoB-100 increases. Using a spherical particle model, theyconcluded that this expansion of apoB-100 across the coresurface was accompanied by tertiary unfolding of the pro-tein with a concomitant reduction of protein thickness.Thus, there are no indications that the total apoB-100path length predicted from our discoid model is physi-cally impossible.
The model described above explains why physical con-straints in the surface monolayer force the particle toadopt a discoid shape. Although one is readily inclined toexpect that flattening of LDL during the transition fromspherical to discoid particle geometry must be accompa-nied by an increase in its diameter, this is not necessarilythe case. It can be shown (by combining equations 1 and4) that a spherical particle has the same volume and diam-eter as a cylindrical particle, with a height equal to twothirds of its diameter (i.e., with an aspect ratio of 1.5),slightly lower than the values observed in this study. Onlyif the cylindrical particle were further flattened beyondthis point would an increase in diameter have to occur.
As expounded above, we believe that the FC content ofthe monolayer plays a crucial role in the transition fromspherical to discoid particle geometry somewhere alongthe VLDL-IDL-LDL cascade. In addition, we want to takethe crucial role of FC one step further by proposing thatthe FC content of LDL is responsible for the variation inparticle diameter. Given that FC accounts for only 7–11%of LDL particle mass, it is not likely that the bulk of thislipid is responsible for the variation in particle diameter. A
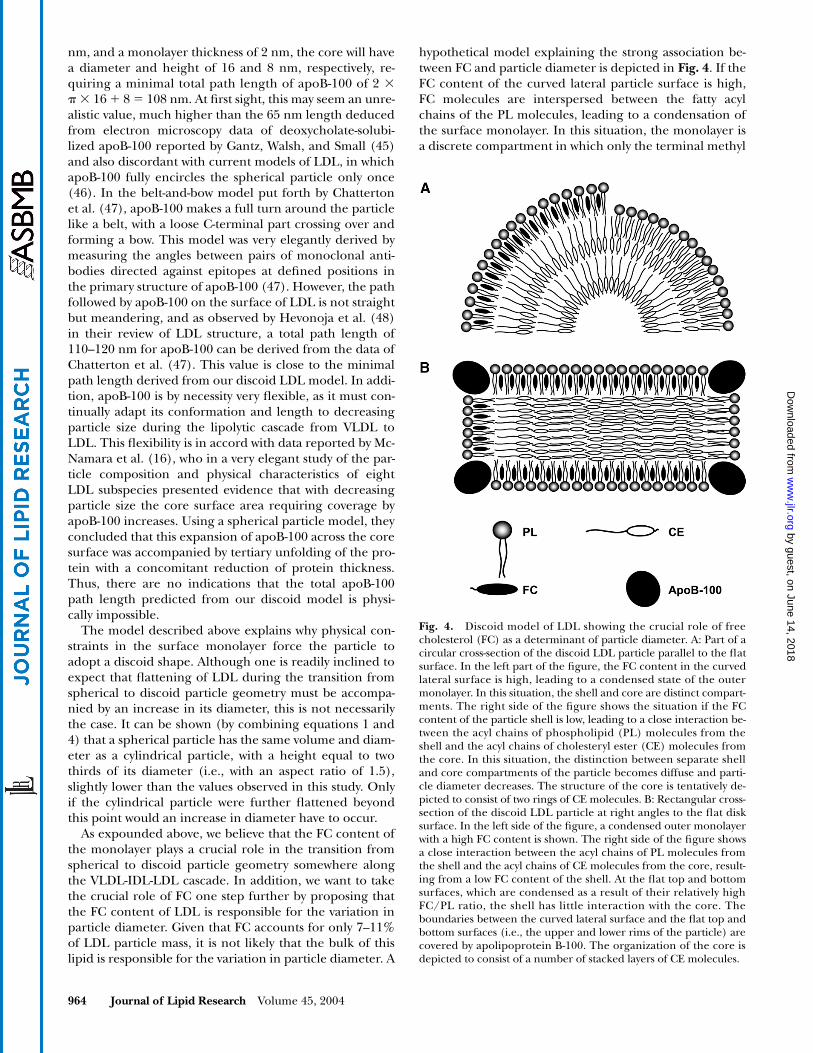
hypothetical model explaining the strong association be-tween FC and particle diameter is depicted in Fig. 4. If theFC content of the curved lateral particle surface is high,FC molecules are interspersed between the fatty acylchains of the PL molecules, leading to a condensation ofthe surface monolayer. In this situation, the monolayer isa discrete compartment in which only the terminal methyl
Fig. 4. Discoid model of LDL showing the crucial role of freecholesterol (FC) as a determinant of particle diameter. A: Part of acircular cross-section of the discoid LDL particle parallel to the flatsurface. In the left part of the figure, the FC content in the curvedlateral surface is high, leading to a condensed state of the outermonolayer. In this situation, the shell and core are distinct compart-ments. The right side of the figure shows the situation if the FCcontent of the particle shell is low, leading to a close interaction be-tween the acyl chains of phospholipid (PL) molecules from theshell and the acyl chains of cholesteryl ester (CE) molecules fromthe core. In this situation, the distinction between separate shelland core compartments of the particle becomes diffuse and parti-cle diameter decreases. The structure of the core is tentatively de-picted to consist of two rings of CE molecules. B: Rectangular cross-section of the discoid LDL particle at right angles to the flat disksurface. In the left side of the figure, a condensed outer monolayerwith a high FC content is shown. The right side of the figure showsa close interaction between the acyl chains of PL molecules fromthe shell and the acyl chains of CE molecules from the core, result-ing from a low FC content of the shell. At the flat top and bottomsurfaces, which are condensed as a result of their relatively highFC/PL ratio, the shell has little interaction with the core. Theboundaries between the curved lateral surface and the flat top andbottom surfaces (i.e., the upper and lower rims of the particle) arecovered by apolipoprotein B-100. The organization of the core isdepicted to consist of a number of stacked layers of CE molecules.
by guest, on June 14, 2018w
ww
.jlr.orgD
ownloaded from
Teerlink et al. LDL particle shape is discoid 965
groups of the PL acyl chains are in direct contact with thecore. If the FC content of the monolayer decreases, itscondensing effect on the acyl chains diminishes, leavingroom for a closer interaction between the PL acyl chainsand core lipids. In this state, the distinction between sepa-rate shell and core compartments becomes more diffuseas acyl chains from the surface PL molecules interdigitatewith acyl chains from core CE molecules. The transitionto this second state can be envisioned as the sinking of thePL acyl chains into the core. The estimated difference inparticle diameter between these two extremes is �3–4nm, close to the range of diameters observed in this andother studies. This model offers an explanation for thestrong association between LDL diameter and its FC con-tent by assuming that the redistribution of FC between dif-ferent LDL compartments (i.e., curved lateral surface, flattop and bottom surfaces, and core) can lead to changes insize by influencing the packing of lipids within the surfacemonolayer and their interaction with core lipids.
In the model shown in Fig. 4, we have tentatively de-picted the structure of the core as consisting of two concen-tric rings of CE molecules. This layered structure is in ac-cordance with the core model derived from small-angleX-ray scattering profiles and crystallographic analysis (24,28, 48, 49). Although this organized core structure is gener-ally believed to exist only below the phase transition tem-perature of the core lipids (46, 50), there are indicationsthat the CE molecules also are restricted in their mobility athigher temperatures (49). In our discoid particle model,the overall shape of the particle may impose this restriction,forcing the CE molecules into stacks of planar layers, eachconsisting of two concentric rings. In this model, each layercontains a more or less fixed number of CE molecules, andthe number of layers is proportional to particle height. Thiscore structure explains the strong association between CEand particle height and the lack of association between CEand diameter in multivariate regression models.
Does our discoid particle model have any practical orclinical consequences? In this study, the associations ofLDL size with HDL cholesterol and plasma TG were par-ticularly strong for diameter. These associations weremuch weaker for height, whereas for particle volume, thestrength of the associations was intermediate. In moststudies that established an association between cardiovas-cular disease and LDL size, GGE was used to measure size.This technique, which is based on the capacity of particlesto migrate through a mesh of pores of decreasing size, re-sembles the HPGC technique used in the present study inthat it probably measures the largest dimension of theparticle (i.e., diameter) with little influence of particleheight. The close correlation between size measurementsby both techniques corroborates this supposition (14).Other techniques, such as dynamic light scattering andNMR, in fact measure particle volume, from which diame-ter is calculated assuming a spherical particle shape. Asthe results of our study show that particle volume is moreclosely related to height than to diameter, results obtainedby these techniques are not equivalent to results obtainedby GGE or HPGC. The same reasoning holds for tech-
niques based on LDL density, such as density gradientultracentrifugation, because density is inversely propor-tional to particle volume and is thus more closely relatedto height than to diameter. It is important to understandthat volume-based techniques and diameter-based tech-niques in fact measure different physical properties ofLDL and may yield complementary information. Combin-ing the information obtained by both types of techniquesin clinical studies may shed light on the metabolic andclinical relevance of the height dimension of LDL.
In summary, we have shown that the data from size mea-surement and lipid composition of LDL are compatiblewith a discoid particle model. A salient feature of thismodel is the crucial role assigned to FC in the shell of theparticle, both in inducing the transition from spherical todiscoid geometry and as a major determinant of particlediameter. An important consequence of the model is thattechniques that are currently used to assess LDL size maynot be equivalent, as some methods in fact measure parti-cle volume instead of diameter. In conjunction with ourobservation that associations between plasma lipids andLDL dimensions are different for diameter and height,this suggests that the discoid particle model goes beyondan esoteric concept and may have metabolic and clinicalsignificance.
The authors thank Bert Volwater for technical assistance.
REFERENCES
1. Berneis, K. K., and R. M. Krauss. 2002. Metabolic origins and clini-cal significance of LDL heterogeneity. J. Lipid Res. 43: 1363–1379.
2. Austin, M. A., J. L. Breslow, C. H. Hennekens, J. E. Buring, W. C. Wil-lett, and R. M. Krauss. 1988. Low-density lipoprotein subclass patternsand risk of myocardial infarction. J. Am. Med. Assoc. 260: 1917–1921.
3. Campos, H., J. J. Genest, Jr., E. Blijlevens, J. R. McNamara, J. L.Jenner, J. M. Ordovas, P. W. Wilson, and E. J. Schaefer. 1992. Lowdensity lipoprotein particle size and coronary artery disease. Arte-rioscler. Thromb. 12: 187–195.
4. Stampfer, M. J., R. M. Krauss, J. Ma, P. J. Blanche, L. G. Holl, F. M.Sacks, and C. H. Hennekens. 1996. A prospective study of triglyc-eride level, low-density lipoprotein particle diameter, and risk ofmyocardial infarction. J. Am. Med. Assoc. 276: 882–888.
5. Lamarche, B., A. Tchernof, S. Moorjani, B. Cantin, G. R. Dagenais,P. J. Lupien, and J. P. Després. 1997. Small, dense low-density lipo-protein particles as a predictor of the risk of ischemic heart diseasein men. Prospective results from the Quebec Cardiovascular Study.Circulation. 95: 69–75.
6. Lamarche, B., A. C. St-Pierre, I. L. Ruel, B. Cantin, G. R. Dagenais,and J. P. Després. 2001. A prospective, population-based study oflow density lipoprotein particle size as a risk factor for ischemicheart disease in men. Can. J. Cardiol. 17: 859–865.
7. Williams, P. T., H. R. Superko, W. L. Haskell, E. L. Alderman, P. J.Blanche, L. G. Holl, and R. M. Krauss. 2003. Smallest LDL parti-cles are most strongly related to coronary disease progression inmen. Arterioscler. Thromb. Vasc. Biol. 23: 314–321.
8. Vakkilainen, J., G. Steiner, J. C. Ansquer, F. Aubin, S. Rattier, C.Foucher, A. Hamsten, and M. R. Taskinen. 2003. Relationships be-tween low-density lipoprotein particle size, plasma lipoproteins,and progression of coronary artery disease: the Diabetes Athero-sclerosis Intervention Study (DAIS). Circulation. 107: 1733–1737.
9. Forte, T. M., and R. W. Nordhausen. 1986. Electron microscopy ofnegatively stained lipoproteins. Methods Enzymol. 128: 442–457.
10. O’Neal, D., P. Harrip, G. Dragicevic, D. Rae, and J. D. Best. 1998. Acomparison of LDL size determination using gradient gel electro-phoresis and light-scattering methods. J. Lipid Res. 39: 2086–2090.
by guest, on June 14, 2018w
ww
.jlr.orgD
ownloaded from

966 Journal of Lipid Research Volume 45, 2004
11. Otvos, J. D., E. J. Jeyarajah, D. W. Bennett, and R. M. Krauss. 1992.Development of a proton nuclear magnetic resonance spectro-scopic method for determining plasma lipoprotein concentrationsand subspecies distributions from a single, rapid measurement.Clin. Chem. 38: 1632–1638.
12. Parks, J. S., and H. Hauser. 1996. Low density lipoprotein particlesize and core cholesteryl ester physical state affect the protonNMR magnetic environment of fatty acid methylene and methylnuclei. J. Lipid Res. 37: 1289–1297.
13. Blake, G. J., J. D. Otvos, N. Rifai, and P. M. Ridker. 2002. Low-den-sity lipoprotein particle concentration and size as determined bynuclear magnetic resonance spectroscopy as predictors of cardio-vascular disease in women. Circulation. 106: 1930–1937.
14. Scheffer, P. G., S. J. Bakker, R. J. Heine, and T. Teerlink. 1997. Mea-surement of low-density lipoprotein particle size by high-perfor-mance gel-filtration chromatography. Clin. Chem. 43: 1904–1912.
15. Scheffer, P. G., S. J. Bakker, R. J. Heine, and T. Teerlink. 1998. Mea-surement of LDL particle size in whole plasma and serum by highperformance gel-filtration chromatography using a fluorescentlipid probe. Clin. Chem. 44: 2148–2151.
16. McNamara, J. R., D. M. Small, Z. Li, and E. J. Schaefer. 1996. Dif-ferences in LDL subspecies involve alterations in lipid composi-tion and conformational changes in apolipoprotein B. J. Lipid Res.37: 1924–1935.
17. St-Pierre, A. C., I. L. Ruel, B. Cantin, G. R. Dagenais, P. M. Bernard,J. P. Després, and B. Lamarche. 2001. Comparison of various elec-trophoretic characteristics of LDL particles and their relationship tothe risk of ischemic heart disease. Circulation. 104: 2295–2299.
18. Schumaker, V. N., M. L. Phillips, and J. E. Chatterton. 1994. Apo-lipoprotein B and low-density lipoprotein structure: implicationsfor biosynthesis of triglyceride-rich lipoproteins. Adv. Protein Chem.45: 205–248.
19. van Antwerpen, R., and J. C. Gilkey. 1994. Cryo-electron micros-copy reveals human low density lipoprotein substructure. J. LipidRes. 35: 2223–2231.
20. Spin, J. M., and D. Atkinson. 1995. Cryoelectron microscopy of lowdensity lipoprotein in vitreous ice. Biophys. J. 68: 2115–2123.
21. van Antwerpen, R., G. C. Chen, C. R. Pullinger, J. P. Kane, M. La-Belle, R. M. Krauss, C. Luna-Chavez, T. M. Forte, and J. C. Gilkey.1997. Cryo-electron microscopy of low density lipoprotein and re-constituted discoidal high density lipoprotein: imaging of the apo-lipoprotein moiety. J. Lipid Res. 38: 659–669.
22. van Antwerpen, R., M. La Belle, E. Navratilova, and R. M. Krauss.1999. Structural heterogeneity of apoB-containing serum lipopro-teins visualized using cryo-electron microscopy. J. Lipid Res. 40:1827–1836.
23. Orlova, E. V., M. B. Sherman, W. Chiu, H. Mowri, L. C. Smith, andA. M. Gotto, Jr. 1999. Three-dimensional structure of low densitylipoproteins by electron cryomicroscopy. Proc. Natl. Acad. Sci. USA.96: 8420–8425.
24. Lunin, V. Y., N. L. Lunina, S. Ritter, I. Frey, A. Berg, K. Diederichs,A. D. Podjarny, A. Urzhumtsev, and M. W. Baumstark. 2001. Low-resolution data analysis for low-density lipoprotein particle. ActaCrystallogr. D Biol. Crystallogr. 57: 108–121.
25. Barter, P. J., O. V. Rajaram, H. Q. Liang, and K. A. Rye. 1993. Rela-tionship between the size and phospholipid content of low-densitylipoproteins. Biochim. Biophys. Acta. 1166: 135–137.
26. Capell, W. H., A. Zambon, M. A. Austin, J. D. Brunzell, and J. E.Hokanson. 1996. Compositional differences of LDL particles innormal subjects with LDL subclass phenotype A and LDL subclassphenotype B. Arterioscler. Thromb. Vasc. Biol. 16: 1040–1046.
27. Coresh, J., P. O. Kwiterovich, Jr., H. H. Smith, and P. S. Bachorik.1993. Association of plasma triglyceride concentration and LDLparticle diameter, density, and chemical composition with prema-ture coronary artery disease in men and women. J. Lipid Res. 34:1687–1697.
28. Baumstark, M. W., W. Kreutz, A. Berg, I. Frey, and J. Keul. 1990. Struc-ture of human low-density lipoprotein subfractions, determined byX-ray small-angle scattering. Biochim. Biophys. Acta. 1037: 48–57.
29. Markwell, M. A., S. M. Haas, N. E. Tolbert, and L. L. Bieber. 1981.Protein determination in membrane and lipoprotein samples:manual and automated procedures. Methods Enzymol. 72: 296–303.
30. Teerlink, T., P. A. van Leeuwen, and A. P. Houdijk. 1994. Plasmaamino acids determined by liquid chromatography within 17 min-utes. Clin. Chem. 40: 245–249.
31. Cladaras, C., M. Hadzopoulou-Cladaras, R. T. Nolte, D. Atkinson,and V. I. Zannis. 1986. The complete sequence and structural anal-
ysis of human apolipoprotein B-100: relationship between apoB-100 and apoB-48 forms. EMBO J. 5: 3495–3507.
32. Scheffer, P. G., S. J. Bakker, C. Popp-Snijders, R. J. Heine, R. B.Schutgens, and T. Teerlink. 2001. Composition of LDL as determi-nant of its susceptibility to in vitro oxidation in patients with well-controlled type 2 diabetes. Diabetes Metab. Res. Rev. 17: 459–466.
33. Bligh, E. G., and W. J. Dyer. 1959. A rapid method of total lipid ex-traction and purification. Can. J. Biochem. Physiol. 37: 911–917.
34. Popp-Snijders, C., and M. C. Blonk. 1995. Omega-3 fatty acids inadipose tissue of obese patients with non-insulin-dependent diabe-tes mellitus reflect long-term dietary intake of eicosapentaenoicand docosahexaenoic acid. Am. J. Clin. Nutr. 61: 360–365.
35. Miller, K. W., and D. M. Small. 1987. Structure of triglyceride-richlipoproteins: an analysis of core and surface phases. In New Com-prehensive Biochemistry. Vol. 14. A. M. Gotto, Jr., editor. ElsevierScience Publications, Amsterdam. 1–75.
36. Bland, J. M., and D. G. Altman. 1995. Comparing methods of mea-surement: why plotting difference against standard method is mis-leading. Lancet. 346: 1085–1087.
37. Lahdenperä, S., M. Syvänne, J. Kahri, and M. R. Taskinen. 1996.Regulation of low-density lipoprotein particle size distribution inNIDDM and coronary disease: importance of serum triglycerides.Diabetologia. 39: 453–461.
38. Galeano, N. F., R. Milne, Y. L. Marcel, M. T. Walsh, E. Levy, T. D.Ngu’yen, A. Gleeson, Y. Arad, L. Witte, M. Al-Haideri, S. C. Rum-sey, and R. J. Deckelbaum. 1994. Apoprotein B structure and re-ceptor recognition of triglyceride-rich low density lipoprotein(LDL) is modified in small LDL but not in triglyceride-rich LDL ofnormal size. J. Biol. Chem. 269: 511–519.
39. Chen, G. C., W. Liu, P. Duchateau, J. Allaart, R. L. Hamilton, C. M.Mendel, K. Lau, D. A. Hardman, P. H. Frost, M. J. Malloy, and J. P.Kane. 1994. Conformational differences in human apolipoproteinB-100 among subspecies of low density lipoproteins (LDL). Associ-ation of altered proteolytic accessibility with decreased receptorbinding of LDL subspecies from hypertriglyceridemic subjects. J.Biol. Chem. 269: 29121–29128.
40. Chancharme, L., P. Thérond, F. Nigon, S. Lepage, M. Couturier,and M. J. Chapman. 1999. Cholesteryl ester hydroperoxide labilityis a key feature of the oxidative susceptibility of small, dense LDL.Arterioscler. Thromb. Vasc. Biol. 19: 810–820.
41. Hulthe, J., L. Bokemark, J. Wikstrand, and B. Fagerberg. 2000.The metabolic syndrome, LDL particle size, and atherosclerosis:the Atherosclerosis and Insulin Resistance (AIR) study. Arterioscler.Thromb. Vasc. Biol. 20: 2140–2147.
42. Grundy, S. M. 1997. Small LDL, atherogenic dyslipidemia, and themetabolic syndrome. Circulation. 95: 1–4.
43. Singh, A. T., D. L. Rainwater, S. M. Haffner, J. L. VandeBerg, W. R.Shelledy, P. H. Moore, Jr., and T. D. Dyer. 1995. Effect of diabeteson lipoprotein size. Arterioscler. Thromb. Vasc. Biol. 15: 1805–1811.
44. Balgav , P., M. Dubnicová, N. Kucerka, M. A. Kiselev, S. P. Yara-daikin, and D. Uhríková. 2001. Bilayer thickness and lipid inter-face area in unilamellar extruded 1,2-diacylphosphatidylcholineliposomes: a small-angle neutron scattering study. Biochim. Biophys.Acta. 1512: 40–52.
45. Gantz, D. L., M. T. Walsh, and D. M. Small. 2000. Morphology ofsodium deoxycholate-solubilized apolipoprotein B-100 using nega-tive stain and vitreous ice electron microscopy. J. Lipid Res. 41:1464–1472.
46. Segrest, J. P., M. K. Jones, H. De Loof, and N. Dashti. 2001. Struc-ture of apolipoprotein B-100 in low density lipoproteins. J. LipidRes. 42: 1346–1367.
47. Chatterton, J. E., M. L. Phillips, L. K. Curtiss, R. Milne, J. C. Fru-chart, and V. N. Schumaker. 1995. Immunoelectron microscopy oflow density lipoproteins yields a ribbon and bow model for theconformation of apolipoprotein B on the lipoprotein surface. J.Lipid Res. 36: 2027–2037.
48. Hevonoja, T., M. O. Pentikäinen, M. T. Hyvönen, P. T. Kovanen,and M. Ala-Korpela. 2000. Structure of low density lipoprotein(LDL) particles: basis for understanding molecular changes inmodified LDL. Biochim. Biophys. Acta. 1488: 189–210.
49. Atkinson, D., R. J. Deckelbaum, D. M. Small, and G. G. Shipley.1977. Structure of human plasma low-density lipoproteins: molec-ular organization of the central core. Proc. Natl. Acad. Sci. USA. 74:1042–1046.
50. Coronado-Gray, A., and R. van Antwerpen. 2003. The physicalstate of the LDL core influences the conformation of apolipopro-tein B-100 on the lipoprotein surface. FEBS Lett. 533: 21–24.
y
by guest, on June 14, 2018w
ww
.jlr.orgD
ownloaded from