![2019 Raffles Institution H2 Further Math Prelim Exam Paper 1 ......2019 Raffles Institution H2 Further Math Prelim Exam Paper 1 Solution Qn Suggested Solution Comment 1(a) [1] Consider](https://static.fdocuments.us/doc/165x107/613015351ecc51586943ddf3/2019-raffles-institution-h2-further-math-prelim-exam-paper-1-2019-raffles.jpg)
Combined Budget Packet -...
21
FY 2019-20 Prelim Budget Packet Salaries: CPI Card for March 2019 Fresno CPI Regional Salary Comparison Historical Salary Changes Salary Schedules (COLA Comparisons) Budget: District Income Analysis Budget Worksheet Proposed Budget (w/annotated report) Actual Expenses Comparison (2013-2018) Budget Accuracy Analysis (2013-2018) Budget Estimates Summary Historical Reserves
Transcript of Combined Budget Packet -...
FY 2019-20 Prelim Budget Packet
Salaries: CPI Card for March 2019
Fresno CPI Regional Salary Comparison
Historical Salary Changes Salary Schedules (COLA Comparisons)
Budget:
District Income Analysis Budget Worksheet
Proposed Budget (w/annotated report) Actual Expenses Comparison (2013-2018)
Budget Accuracy Analysis (2013-2018) Budget Estimates Summary
Historical Reserves

Percent Change Percent ChangeIndexes 1 Month Indexes 1 Month
ending endingMar Feb Mar Feb Mar Mar Mar Feb Mar Feb Mar Mar2018 2019 2019 2019 2019 2019 2018 2019 2019 2019 2019 2019
U. S. City Average............................................... 249.554 252.776 254.202 1.5 1.9 0.6 243.463 246.218 247.768 1.3 1.8 0.6West.................................................................... 260.994 266.215 267.370 2.4 2.4 0.4 252.644 257.519 258.617 2.3 2.4 0.4West – Size Class A1.......................................... 269.271 274.753 276.187 2.5 2.6 0.5 258.983 264.374 265.774 2.5 2.6 0.5West – Size Class B/C2....................................... 151.702 154.671 155.178 2.3 2.3 0.3 151.404 154.110 154.618 2.1 2.1 0.3Mountain3…………………………………………… 101.196 102.685 103.339 1.8 2.1 0.6 101.358 102.923 103.508 1.8 2.1 0.6Pacific3……………………………………………… 101.499 103.727 104.100 2.6 2.6 0.4 101.474 103.589 103.972 2.5 2.5 0.4Los Angeles-Long Beach-Anaheim, CA………… 264.158 269.608 271.311 2.5 2.7 0.6 254.451 259.734 261.278 2.6 2.7 0.6
Percent Change Percent ChangeIndexes 2 Months Indexes 2 Months
ending endingMar Jan Mar Jan Mar Mar Mar Jan Mar Jan Mar Mar2018 2019 2019 2019 2019 2019 2018 2019 2019 2019 2019 2019
Riverside-San Bernardino-Ontario, CA3………… 101.897 103.991 104.749 3.0 2.8 0.7 101.909 104.062 104.769 3.1 2.8 0.7San Diego-Carlsbad, CA.………......................... 290.810 295.761 297.226 2.6 2.2 0.5 272.813 277.832 279.093 2.5 2.3 0.5Urban Hawaii…………………………………………275.408 279.005 280.263 1.9 1.8 0.5 272.021 274.941 276.462 2.0 1.6 0.6
Percent Change Percent ChangeIndexes 2 Months Indexes 2 Months
ending endingFeb Dec Feb Dec Feb Feb Feb Dec Feb Dec Feb Feb2018 2018 2019 2018 2019 2019 2018 2018 2019 2018 2019 2019
Phoenix-Mesa-Scottsdale, AZ4…………………… 136.774 140.083 139.660 4.3 2.1 -0.3 134.439 138.231 137.722 4.6 2.4 -0.4San Francisco-Oakland-Hayward, CA................. 281.308 289.896 291.227 4.5 3.5 0.5 275.699 283.278 284.758 4.4 3.3 0.5Seattle-Tacoma-Bellevue, WA............................ 268.031 273.293 275.304 2.8 2.7 0.7 264.477 269.470 271.039 2.7 2.5 0.6Urban Alaska.……………………………………… 221.679 226.537 227.183 2.8 2.5 0.3 219.714 223.996 223.971 2.4 1.9 0.0
NOTE: In January 2018, BLS introduced a new geographic area sample for the Consumer Price Index (CPI): www.bls.gov/regions/west/factsheet/2018cpirevisionwest.pdf
1967=100 base year indexes and historical tables including semiannual and annual average data are available at: www.bls.gov/regions/west/data/cpi_tables.pdf
MONTHLY DATA
BI-MONTHLY DATA (Published for odd months)
BI-MONTHLY DATA (Published for even months)
ending endingYear
Release date April 10, 2019. The next release date is scheduled for May 10, 2019. For questions, please contact us at [email protected] or (415) 625-2270.
CONSUMER PRICE INDEXES PACIFIC CITIES AND U. S. CITY AVERAGEMARCH 2019
(All items indexes. 1982-84=100 unless otherwise noted. Not seasonally adjusted.)
ending
Urban Wage Earners and Clerical Workers (CPI-W)All Urban Consumers (CPI-U)
Year Yearending ending
Yearending
Year
Year
1 Population over 2,500,000 2 Population 2,500,000 and under, Dec 1996 = 100 3 Dec 2017=100 4 Dec 2001=100 Dash (-) = Not available

4/10/2019 Fresno : Western Information Office : U.S. Bureau of Labor Statistics
https://www.bls.gov/regions/west/ca_fresno_msa.htm 1/2
A to Z Index | FAQs | About BLS | Contact Us Subscribe to E-mail Updates
Follow Us | What's New | Release Calendar | Blog
Search BLS.gov
Western Information Office
Geographic Information > Western > California > Fresno
Fresno
Fresno, CA Economy at a Glance:
Data SeriesBack Data
Oct 2018
Nov 2018
Dec 2018
Jan 2019
Feb 2019
Mar 2019
Labor Force Data
Civilian Labor Force(1) 452.9 454.4 (P) 455.3 459.3 (P) 462.2
Employment(1) 424.2 423.1 (P) 421.1 418.4 (P) 420.9
Unemployment(1) 28.7 31.3 (P) 34.2 40.9 (P) 41.4
Unemployment Rate(2) 6.3 6.9 (P) 7.5 8.9 (P) 8.9
Nonfarm Wage and Salary Employment
Total Nonfarm(3) 358.3 361.7 361.6 356.5 (P) 360.5
12-month % change 3.3 3.8 4.2 3.6 (P) 3.8
Mining and Logging(3) 0.3 0.3 0.3 0.3 (P) 0.3
12-month % change 0.0 0.0 0.0 0.0 (P) 0.0
Construction(3) 19.3 19.2 19.0 18.6 (P) 18.7
12-month % change 6.6 6.1 5.6 6.3 (P) 3.9
Manufacturing(3) 27.2 26.1 25.6 25.0 (P) 25.0
12-month % change 5.0 2.4 2.0 0.8 (P) 0.4
Trade, Transportation, and Utilities(3) 68.9 71.6 71.5 69.2 (P) 68.9
12-month % change 2.8 4.8 4.7 4.8 (P) 5.0
Information(3) 3.6 3.6 3.6 3.6 (P) 3.6
12-month % change 0.0 0.0 0.0 0.0 (P) 0.0
Financial Activities(3) 14.3 14.2 14.2 14.2 (P) 14.2
12-month % change 2.1 0.7 0.7 1.4 (P) 1.4
Footnotes (1) Number of persons, in thousands, not seasonally adjusted. (2) In percent, not seasonally adjusted. (3) Number of jobs, in thousands, not seasonally adjusted. See About the data. (4) All Urban Consumers, base: 1982-84=100, not seasonally adjusted. (5) Urban Wage Earners and Clerical Workers, base: 1982-84=100, not seasonally adjusted. (P) Preliminary
Search Western Region Go SHARE ON:
Display 50 records Text search table:
Showing 1 to 4 of 4 entries
Title BLS Subject ProductType
DatePublished
All All
Western - Labor Force Statistics Employment, Unemployment Table Apr 2019
Fresno Area Economic Summary EconomicSummary Apr 2019
Consumer Price Index Data Tables Consumer price indexes Table Feb 2019
Occupational Employment and Wages in Fresno — May 2017 Employment, Pay NewsRelease May 2018
Western Home Western Geography Western Subjects Western Archives Contact Western
Home Subjects Data Tools Publications Economic Releases Students Beta

4/10/2019 Fresno : Western Information Office : U.S. Bureau of Labor Statistics
https://www.bls.gov/regions/west/ca_fresno_msa.htm 2/2
Data SeriesBack Data
Oct 2018
Nov 2018
Dec 2018
Jan 2019
Feb 2019
Mar 2019
Professional and Business Services(3) 32.7 33.0 33.0 32.6 (P) 32.7
12-month % change 7.9 10.0 11.5 6.2 (P) 4.5
Education and Health Services(3) 71.7 71.2 72.1 71.6 (P) 73.2
12-month % change 4.8 3.3 4.6 4.8 (P) 6.2
Leisure and Hospitality(3) 33.9 34.1 34.1 33.4 (P) 33.9
12-month % change -0.6 1.5 2.4 1.5 (P) 2.1
Other Services(3) 12.2 12.1 12.1 11.9 (P) 11.9
12-month % change 1.7 0.8 1.7 1.7 (P) 0.8
Government(3) 74.2 76.3 76.1 76.1 (P) 78.1
12-month % change 1.4 2.8 2.8 2.3 (P) 3.2
Consumer Price Index: West urban
CPI-U, All items(4) 266.195 265.658 265.209 265.624 266.215 267.370
CPI-U, All items, 12-month % change(4) 3.5 3.3 3.1 2.7 2.4 2.4
CPI-W, All items(5) 258.149 257.604 256.879 257.040 257.519 258.617
CPI-W, All items, 12-month % change(5) 3.7 3.5 3.1 2.6 2.3 2.4
Footnotes (1) Number of persons, in thousands, not seasonally adjusted. (2) In percent, not seasonally adjusted. (3) Number of jobs, in thousands, not seasonally adjusted. See About the data. (4) All Urban Consumers, base: 1982-84=100, not seasonally adjusted. (5) Urban Wage Earners and Clerical Workers, base: 1982-84=100, not seasonally adjusted. (P) Preliminary
RECOMMEND THIS PAGE USING: Facebook Twitter LinkedIn
Freedom of Information Act | Privacy & Security Statement | Disclaimers | Customer Survey | Important Web Site Notices
U.S. Bureau of Labor Statistics | Western Information Office, Attn: EA & I, 90 Seventh Street, Suite 14-100, San Francisco, CA 94103-6715www.bls.gov/regions/west | Telephone: 1-415-625-2270 | Contact Western Region
TOOLSAreas at a GlanceIndustries at a GlanceEconomic ReleasesDatabases & TablesMaps
CALCULATORSInflationInjury And Illness
HELPHelp & TutorialsFAQsGlossaryAbout BLSContact Us
INFOWhat's NewCareers @ BLSFind It! DOLJoin our Mailing ListsLinking & Copyright Info
RESOURCESInspector General (OIG)Budget and PerformanceNo Fear ActUSA.govBenefits.gov

DISTRICT DISTRICTCurrent Current
Consolidated $47,724.00 $60,063.00 Consolidated $85,110.00 $75,516.00 $80,388.00Delano $51,262.00 $62,712.00 Delano $81,880.00 $68,474.00 $83,179.00Delta $49,379.00 $61,724.00 Delta $87,230.00 $65,091.00 $81,364.00Fresno (II only) $49,368.00 $63,888.00 Fresno $78,174.00 $78,948.00 $94,080.00Kern $44,554.00 $56,320.00 Kern $76,931.00 $76,931.00 $93,530.00Kings $43,992.00 $55,872.00 Kings $81,414.00 $62,880.00 $79,800.00Madera $27,040.00 $64,436.00 Madera $63,463.00 $48,000.00 $78,263.00Tulare $24,064.00 $56,486.00 Tulare N/AWest Side $47,695.00 $58,094.00 West Side $30,813.00 $73,983.00 $92,715.00FWMAD $38,772.00 $60,132.00 FWMAD $75,126.00 $56,880.00 $76,236.00
Average $42,786.44 $59,955.00 Average $73,126.88 $68,727.88 $85,414.88
+/- Avg. ($4,014.44) $177.00 +/- Avg. $1,999.13 ($11,847.88) ($9,178.88)
DISTRICT DISTRICTCurrent Current
Consolidated $122,952.00 $112,952.00 $122,952.00 Consolidated $59,370.00 $47,724.00 $56,508.00Delano $105,354.00 $88,254.00 $107,245.00 Delano $70,204.00 $56,698.00 $71,323.00Delta $146,059.00 $112,226.00 $112,226.00 Delta $69,206.00 $66,206.00 $67,335.00Fresno $105,141.00 $104,100.00 $106,188.00 Fresno $66,677.00 $51,684.00 $67,752.00Kern $114,624.00 $112,039.00 $112,039.00 Kern $66,093.00 $52,826.00 $66,093.00Kings $122,337.00 $119,424.00 $119,424.00 Kings $49,950.00 $42,276.00 $52,336.00Madera $88,426.00 $76,000.00 $117,394.00 Madera $24,309.00 $30,160.00 $58,697.00Tulare $76,546.00 $76,546.00 $76,546.00 Tulare N/AWest Side $102,317.00 $94,452.00 $123,871.00 West Side $78,966.00 $70,473.00 $86,780.00FWMAD $98,038.00 $99,804.00 $115,536.00 FWMAD $52,554.00 $39,624.00 $55,764.00
Average $109,306.22 $99,554.78 $110,876.11 Average $60,596.88 $52,255.88 $65,853.00
+/- Avg. ($11,268.22) $249.22 $4,659.89 +/- Avg. ($8,042.88) ($12,631.88) ($10,089.00)
Some Districts also provide full dependent coverage, post retirement benefits & contribute some of employee retirement^ mechanic: These districts have a fully qualified mechanic which is not really comparable
FRESNO WESTSIDE MOSQUITO ABATEMENT DISTRICT
Range - Annual Range - Annual
SALARY COMPARISONS - FOR 2017 : SCO Report
Control Technicians I & II Superintendent of Ops
Range - AnnualSecretary/Bookkeeper
Range - AnnualManager
Salary Comparisons 19-20 4/10/2019

FRESNO WESTSIDE MOSQUITO ABATEMENT - HISTORICAL SALARY CHANGES
1983/82 1984/83 1985/84 1986/87 1987/88 1988/89 1989/90 1990/91 1991/92 1992/93 1993/94 1994/95
COLA 3.00% 3.00% 4.00% 3.00% 3.00% 0.00% 5.00% 5.00% 5.00% 3.00% 0.00% 3.00%
Mosquito Control Tech I 3.00% 3.00% 4.00% 3.00% 3.00% 0.00% 5.00% 5.00% 5.00% 3.00% 0.00% 3.00%
Mosquito Control Tech II * 5.00% 3.00% 0.00% 3.00%
Secretary/Bookkeeper 3.00% 3.00% 4.00% 3.00% 3.00% 0.00% 5.00% 5.00% 5.00% 3.00% 0.00% 3.00%
Pilot/Superintendent 3.00% 3.00% 4.00% 3.00% 3.00% 0.00% 5.00% 5.00% 5.00% 3.00% 0.00% 3.00%
Superintendent Of Operations
Manager 3.00% 3.00% 4.00% 3.00% 3.00% ** (-35%) 26.47% 10.00% 5.00% 3.00% 0.00% 3.00%
* Position Added
** New Manager
FRESNO WESTSIDE MOSQUITO ABATEMENT - HISTORICAL SALARY CHANGES
1995/96 1996/97 1997/98 1998/99 1999/00 2000/01 2001/02 2002/03 2003/04 2004/05 2005/06 2006/07
COLA 2.00% 3.00% 3.00% 2.00% 3.00% 3.00% 3.00% 2.00% 3.00% 2.00% 2.50% 3.00%
Biologist
Mosquito Control Tech I 2.00% 3.00% 3.00% 2.00% 3.00% 3.00% 3.00% 2.00% 10.00% 2.00% 2.50% 3.00%
Mosquito Control Tech II 2.00% 3.00% 3.00% 2.00% 3.00% 3.00% 3.00% 2.00% 10.00% 2.00% 2.50% 3.00%
Secretary/Bookkeeper 2.00% 3.00% 3.00% 12.31% 3.00% 3.00% 3.00% 2.00% 10.00% 2.00% 2.50% 3.00%
Pilot/Superintendent 2.00% 3.00% 3.00% 7.59% 3.00% 3.00% *** * 2.50% 3.00%
Superintendent Of Operations * 2.00% 3.00% 10.00% ***
Manager 16.58% 3.00% 3.00% 22.53% 3.00% 3.00% 3.00% 2.00% 3.00% 7.00% 2.50% 3.00%
* Position Added

** New Manager
*** Position Deleted
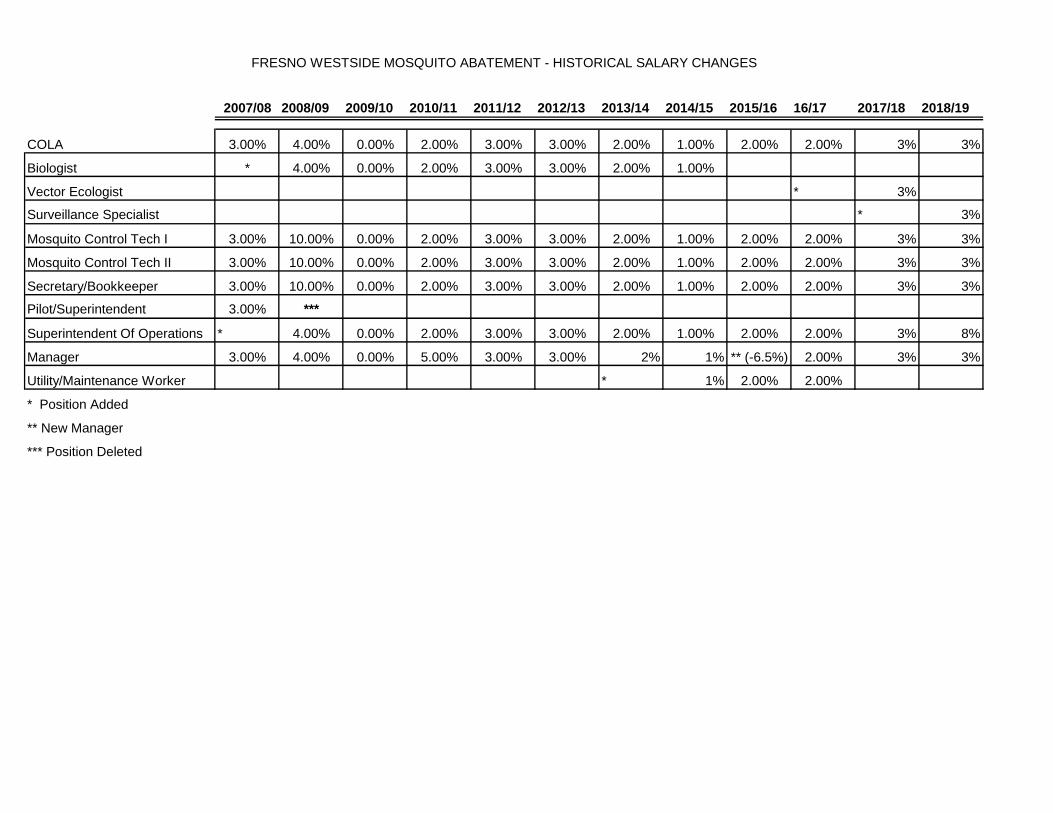
2007/08 2008/09 2009/10 2010/11 2011/12 2012/13 2013/14 2014/15 2015/16 16/17 2017/18 2018/19
COLA 3.00% 4.00% 0.00% 2.00% 3.00% 3.00% 2.00% 1.00% 2.00% 2.00% 3% 3%
Biologist * 4.00% 0.00% 2.00% 3.00% 3.00% 2.00% 1.00%
Vector Ecologist * 3%
Surveillance Specialist * 3%
Mosquito Control Tech I 3.00% 10.00% 0.00% 2.00% 3.00% 3.00% 2.00% 1.00% 2.00% 2.00% 3% 3%
Mosquito Control Tech II 3.00% 10.00% 0.00% 2.00% 3.00% 3.00% 2.00% 1.00% 2.00% 2.00% 3% 3%
Secretary/Bookkeeper 3.00% 10.00% 0.00% 2.00% 3.00% 3.00% 2.00% 1.00% 2.00% 2.00% 3% 3%
Pilot/Superintendent 3.00% ***
Superintendent Of Operations * 4.00% 0.00% 2.00% 3.00% 3.00% 2.00% 1.00% 2.00% 2.00% 3% 8%
Manager 3.00% 4.00% 0.00% 5.00% 3.00% 3.00% 2% 1% ** (-6.5%) 2.00% 3% 3%
Utility/Maintenance Worker * 1% 2.00% 2.00%
* Position Added
** New Manager
*** Position Deleted
FRESNO WESTSIDE MOSQUITO ABATEMENT - HISTORICAL SALARY CHANGES
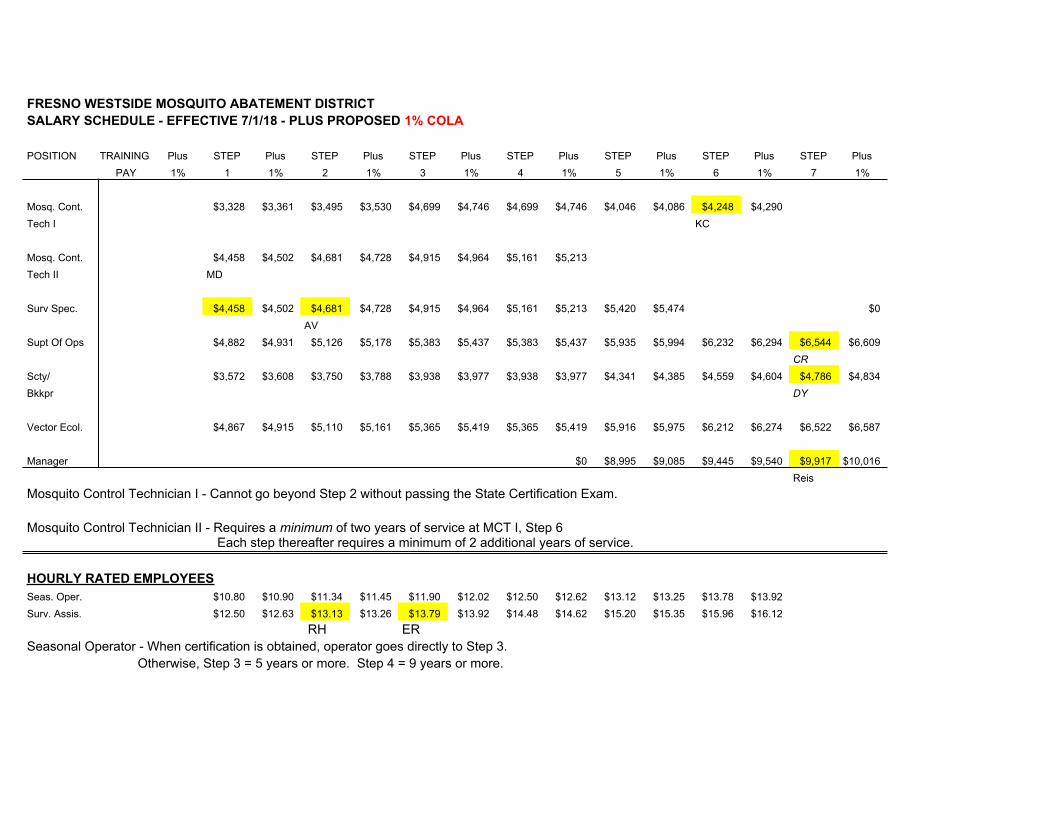
FRESNO WESTSIDE MOSQUITO ABATEMENT DISTRICTSALARY SCHEDULE - EFFECTIVE 7/1/18 - PLUS PROPOSED 1% COLA
POSITION TRAINING Plus STEP Plus STEP Plus STEP Plus STEP Plus STEP Plus STEP Plus STEP PlusPAY 1% 1 1% 2 1% 3 1% 4 1% 5 1% 6 1% 7 1%
Mosq. Cont. $3,328) $3,361) $3,495) $3,530) $4,699) $4,746) $4,699) $4,746) $4,046) $4,086) $4,248) $4,290)Tech I KC
Mosq. Cont. $4,458) $4,502) $4,681) $4,728) $4,915) $4,964) $5,161) $5,213)Tech II MD
Surv Spec. $4,458) $4,502) $4,681) $4,728) $4,915) $4,964) $5,161) $5,213) $5,420) $5,474) $0)AV
Supt Of Ops $4,882) $4,931) $5,126) $5,178) $5,383) $5,437) $5,383) $5,437) $5,935) $5,994) $6,232) $6,294) $6,544) $6,609)CR
Scty/ $3,572) $3,608) $3,750) $3,788) $3,938) $3,977) $3,938) $3,977) $4,341) $4,385) $4,559) $4,604) $4,786) $4,834)Bkkpr DY
Vector Ecol. $4,867) $4,915) $5,110) $5,161) $5,365) $5,419) $5,365) $5,419) $5,916) $5,975) $6,212) $6,274) $6,522) $6,587)
Manager $0) $8,995) $9,085) $9,445) $9,540) $9,917) $10,016)Reis
Mosquito Control Technician I - Cannot go beyond Step 2 without passing the State Certification Exam.
Mosquito Control Technician II - Requires a minimum of two years of service at MCT I, Step 6 Each step thereafter requires a minimum of 2 additional years of service.
HOURLY RATED EMPLOYEESSeas. Oper. $10.80) $10.90) $11.34) $11.45) $11.90) $12.02) $12.50) $12.62) $13.12) $13.25) $13.78) $13.92)Surv. Assis. $12.50) $12.63) $13.13) $13.26) $13.79) $13.92) $14.48) $14.62) $15.20) $15.35) $15.96) $16.12)
RH ERSeasonal Operator - When certification is obtained, operator goes directly to Step 3.
Otherwise, Step 3 = 5 years or more. Step 4 = 9 years or more.

FRESNO WESTSIDE MOSQUITO ABATEMENT DISTRICTSALARY SCHEDULE - EFFECTIVE 7/1/18 - PLUS PROPOSED 2% COLA
POSITION TRAINING Plus STEP Plus STEP Plus STEP Plus STEP Plus STEP Plus STEP Plus STEP PlusPAY 2% 1 2% 2 2% 3 2% 4 2% 5 2% 6 2% 7 2%
Mosq. Cont. $3,328) $3,394) $3,495) $3,565) $4,699) $4,793) $4,699) $4,793) $4,046) $4,127) $4,248) $4,333)Tech I KC
Mosq. Cont. $4,458) $4,547) $4,681) $4,775) $4,915) $5,013) $5,161) $5,264)Tech II MD
Surv Spec. $4,458) $4,547) $4,681) $4,775) $4,915) $5,013) $5,161) $5,264) $5,420) $5,528) $0)AV
Supt Of Ops $4,882) $4,980) $5,126) $5,229) $5,383) $5,490) $5,383) $5,490) $5,935) $6,054) $6,232) $6,356) $6,544) $6,674)CR
Scty/ $3,572) $3,643) $3,750) $3,825) $3,938) $4,016) $3,938) $4,016) $4,341) $4,428) $4,559) $4,650) $4,786) $4,882)Bkkpr DY
Vector Ecol. $4,867) $4,964) $5,110) $5,212) $5,365) $5,473) $5,365) $5,473) $5,916) $6,035) $6,212) $6,336) $6,522) $6,652)
Manager $0) $8,995) $9,175) $9,445) $9,634) $9,917) $10,115)Reis
Mosquito Control Technician I - Cannot go beyond Step 2 without passing the State Certification Exam.
Mosquito Control Technician II - Requires a minimum of two years of service at MCT I, Step 6 Each step thereafter requires a minimum of 2 additional years of service.
HOURLY RATED EMPLOYEESSeas. Oper. $10.80) $10.90) $11.34) $11.45) $11.90) $12.02) $12.50) $12.62) $13.12) $13.25) $13.78) $13.92)Surv. Assis. $12.50) $12.75) $13.13) $13.39) $13.79) $14.06) $14.48) $14.76) $15.20) $15.50) $15.96) $16.28)
RH ER Otherwise, Step 3 = 5 years or more. Step 4 = 9 years or more.
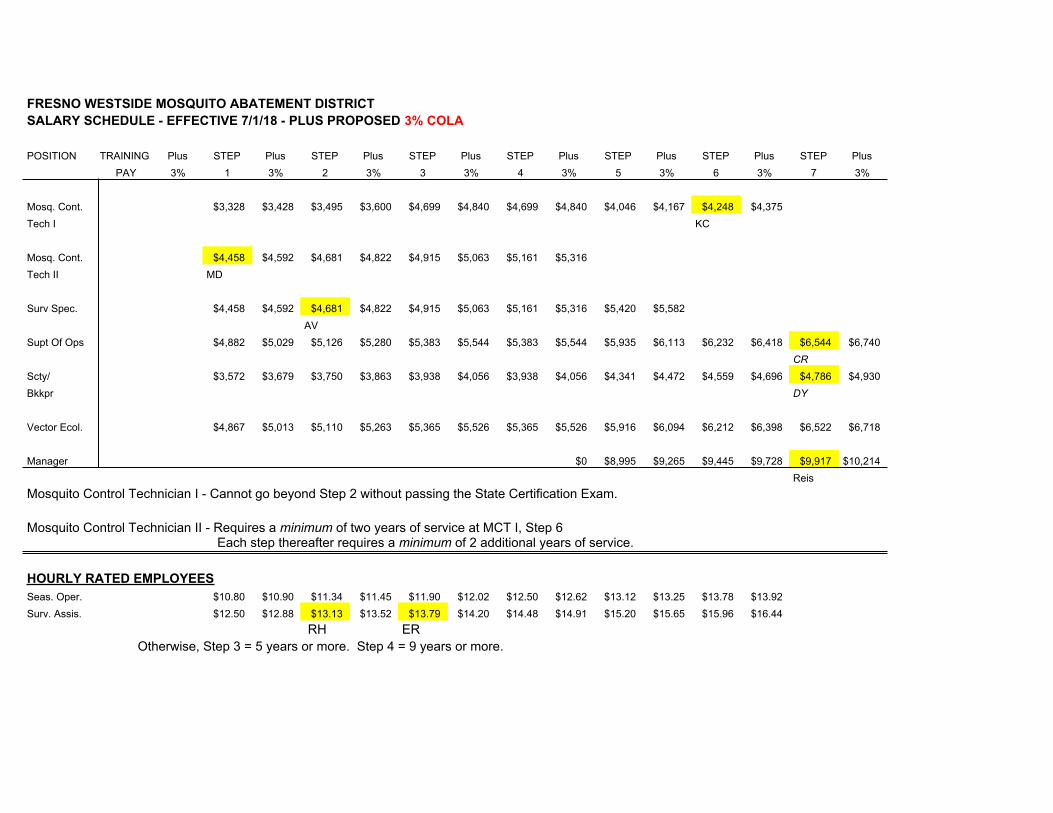
FRESNO WESTSIDE MOSQUITO ABATEMENT DISTRICTSALARY SCHEDULE - EFFECTIVE 7/1/18 - PLUS PROPOSED 3% COLA
POSITION TRAINING Plus STEP Plus STEP Plus STEP Plus STEP Plus STEP Plus STEP Plus STEP PlusPAY 3% 1 3% 2 3% 3 3% 4 3% 5 3% 6 3% 7 3%
Mosq. Cont. $3,328) $3,428) $3,495) $3,600) $4,699) $4,840) $4,699) $4,840) $4,046) $4,167) $4,248) $4,375)Tech I KC
Mosq. Cont. $4,458) $4,592) $4,681) $4,822) $4,915) $5,063) $5,161) $5,316)Tech II MD
Surv Spec. $4,458) $4,592) $4,681) $4,822) $4,915) $5,063) $5,161) $5,316) $5,420) $5,582)AV
Supt Of Ops $4,882) $5,029) $5,126) $5,280) $5,383) $5,544) $5,383) $5,544) $5,935) $6,113) $6,232) $6,418) $6,544) $6,740)CR
Scty/ $3,572) $3,679) $3,750) $3,863) $3,938) $4,056) $3,938) $4,056) $4,341) $4,472) $4,559) $4,696) $4,786) $4,930)Bkkpr DY
Vector Ecol. $4,867) $5,013) $5,110) $5,263) $5,365) $5,526) $5,365) $5,526) $5,916) $6,094) $6,212) $6,398) $6,522) $6,718)
Manager $0) $8,995) $9,265) $9,445) $9,728) $9,917) $10,214)Reis
Mosquito Control Technician I - Cannot go beyond Step 2 without passing the State Certification Exam.
Mosquito Control Technician II - Requires a minimum of two years of service at MCT I, Step 6 Each step thereafter requires a minimum of 2 additional years of service.
HOURLY RATED EMPLOYEESSeas. Oper. $10.80) $10.90) $11.34) $11.45) $11.90) $12.02) $12.50) $12.62) $13.12) $13.25) $13.78) $13.92)Surv. Assis. $12.50) $12.88) $13.13) $13.52) $13.79) $14.20) $14.48) $14.91) $15.20) $15.65) $15.96) $16.44)
RH ER Otherwise, Step 3 = 5 years or more. Step 4 = 9 years or more.
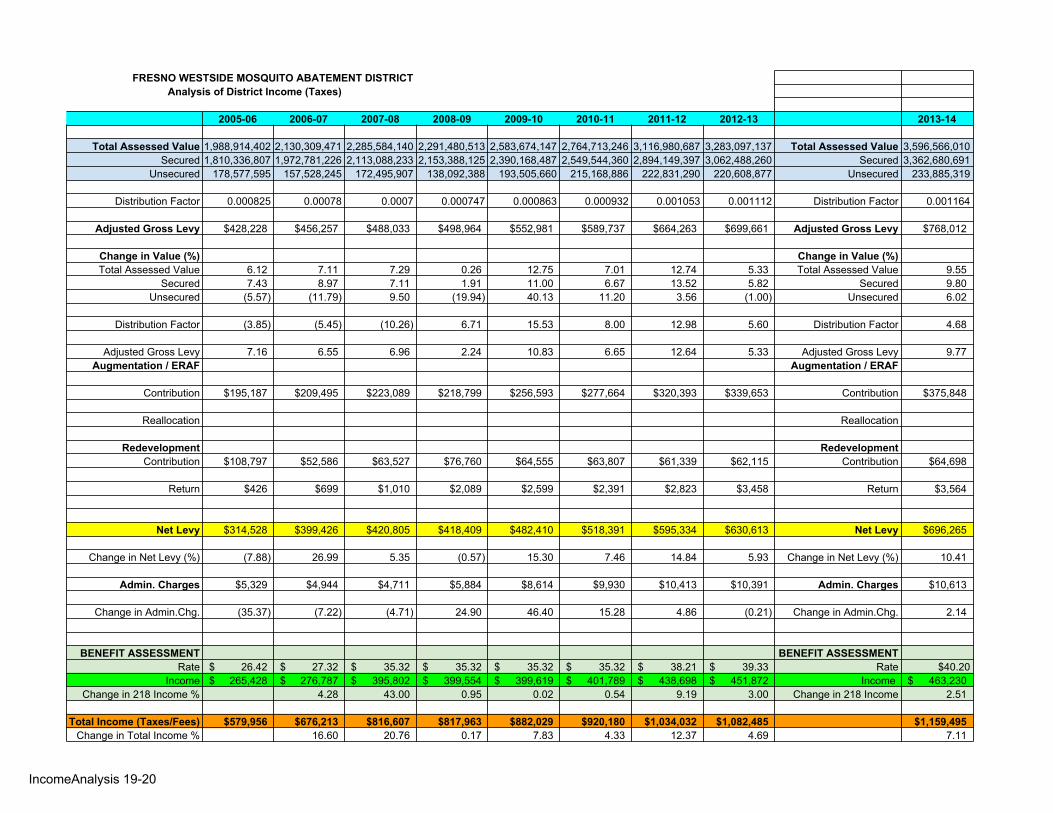
IncomeAnalysis 19-20
FRESNO WESTSIDE MOSQUITO ABATEMENT DISTRICTAnalysis of District Income (Taxes)
2005-06 2006-07 2007-08 2008-09 2009-10 2010-11 2011-12 2012-13 2013-14
Total Assessed Value 1,988,914,402 2,130,309,471 2,285,584,140 2,291,480,513 2,583,674,147 2,764,713,246 3,116,980,687 3,283,097,137 Total Assessed Value 3,596,566,010Secured 1,810,336,807 1,972,781,226 2,113,088,233 2,153,388,125 2,390,168,487 2,549,544,360 2,894,149,397 3,062,488,260 Secured 3,362,680,691
Unsecured 178,577,595 157,528,245 172,495,907 138,092,388 193,505,660 215,168,886 222,831,290 220,608,877 Unsecured 233,885,319
Distribution Factor 0.000825 0.00078 0.0007 0.000747 0.000863 0.000932 0.001053 0.001112 Distribution Factor 0.001164
Adjusted Gross Levy $428,228) $456,257) $488,033) $498,964) $552,981) $589,737) $664,263) $699,661) Adjusted Gross Levy $768,012)
Change in Value (%) Change in Value (%)Total Assessed Value 6.12) 7.11) 7.29) 0.26) 12.75) 7.01) 12.74) 5.33) Total Assessed Value 9.55)
Secured 7.43) 8.97) 7.11) 1.91) 11.00) 6.67) 13.52) 5.82) Secured 9.80)Unsecured (5.57) (11.79) 9.50) (19.94) 40.13) 11.20) 3.56) (1.00) Unsecured 6.02)
Distribution Factor (3.85) (5.45) (10.26) 6.71) 15.53) 8.00) 12.98) 5.60) Distribution Factor 4.68)
Adjusted Gross Levy 7.16) 6.55) 6.96) 2.24) 10.83) 6.65) 12.64) 5.33) Adjusted Gross Levy 9.77)Augmentation / ERAF Augmentation / ERAF
Contribution $195,187) $209,495) $223,089) $218,799) $256,593) $277,664) $320,393) $339,653) Contribution $375,848)
Reallocation Reallocation
Redevelopment RedevelopmentContribution $108,797) $52,586) $63,527) $76,760) $64,555) $63,807) $61,339) $62,115) Contribution $64,698)
Return $426) $699) $1,010) $2,089) $2,599) $2,391) $2,823) $3,458) Return $3,564)
Net Levy $314,528) $399,426) $420,805) $418,409) $482,410) $518,391) $595,334) $630,613) Net Levy $696,265)
Change in Net Levy (%) (7.88) (26.99) (5.35) (0.57) (15.30) (7.46) (14.84) (5.93) Change in Net Levy (%) (10.41)
Admin. Charges $5,329) $4,944) $4,711) $5,884) $8,614) $9,930) $10,413) $10,391) Admin. Charges $10,613)
Change in Admin.Chg. (35.37) (7.22) (4.71) (24.90) (46.40) (15.28) (4.86) (0.21) Change in Admin.Chg. (2.14)
BENEFIT ASSESSMENT BENEFIT ASSESSMENTRate ($ 26.42) ($ 27.32) ($ 35.32) ($ 35.32) ($ 35.32) ($ 35.32) ($ 38.21) ($ 39.33) Rate $40.20
Income ($ 265,428) ($ 276,787) ($ 395,802) ($ 399,554) ($ 399,619) ($ 401,789) ($ 438,698) ($ 451,872) Income ($ 463,230) Change in 218 Income % (4.28) (43.00) (0.95) (0.02) (0.54) (9.19) (3.00) Change in 218 Income (2.51)
Total Income (Taxes/Fees) $579,956) $676,213) $816,607) $817,963) $882,029) $920,180) $1,034,032) $1,082,485) $1,159,495)Change in Total Income % (16.60) (20.76) (0.17) (7.83) (4.33) (12.37) (4.69) (7.11)
IncomeAnalysis 19-20
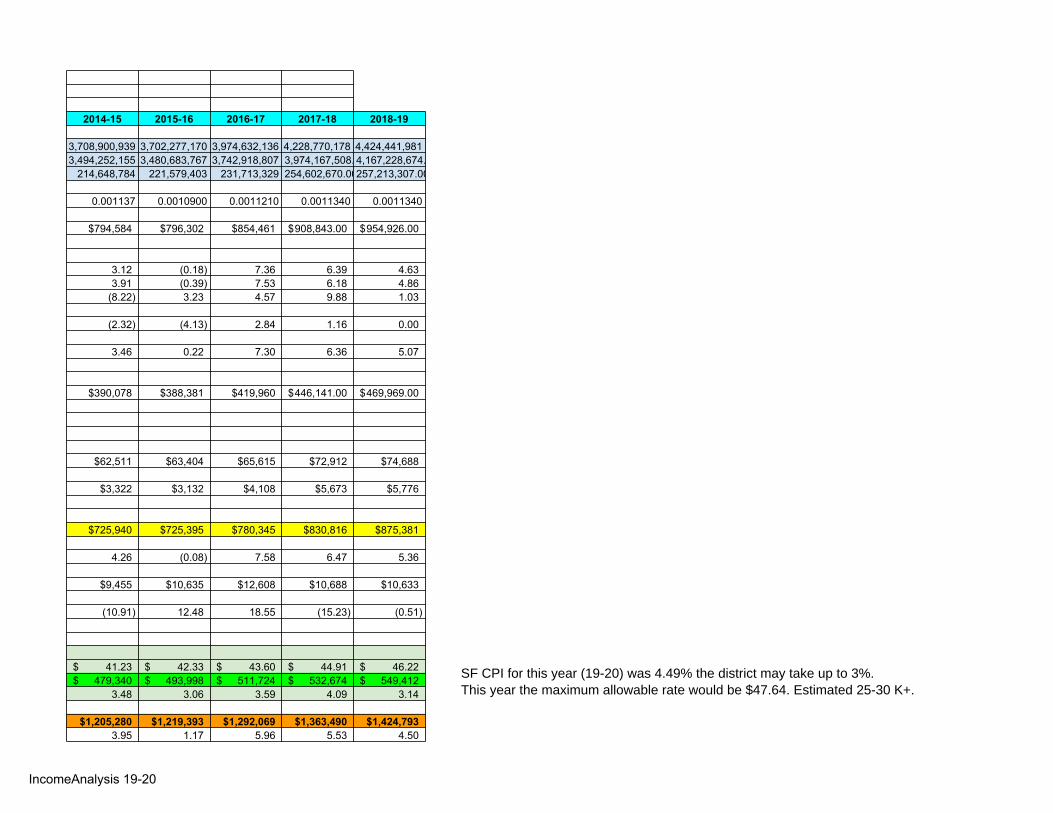
2014-15 2015-16 2016-17 2017-18 2018-19
3,708,900,939 3,702,277,170 3,974,632,136 4,228,770,178 4,424,441,9813,494,252,155 3,480,683,767 3,742,918,807 3,974,167,508.004,167,228,674.00
214,648,784 221,579,403 231,713,329 254,602,670.00257,213,307.00
0.001137 0.0010900 0.0011210 0.0011340 0.0011340
$794,584) $796,302) $854,461) ($908,843.00) ($954,926.00)
3.12) (0.18) 7.36) 6.39) 4.63)3.91) (0.39) 7.53) 6.18) 4.86)
(8.22) 3.23) 4.57) 9.88) 1.03)
(2.32) (4.13) 2.84) 1.16) 0.00)
3.46) 0.22) 7.30) 6.36) 5.07)
$390,078) $388,381) $419,960) ($446,141.00) ($469,969.00)
$62,511) $63,404) $65,615) $72,912) $74,688)
$3,322) $3,132) $4,108) $5,673) $5,776)
$725,940) $725,395) $780,345) $830,816) $875,381)
(4.26) (0.08) (7.58) (6.47) (5.36)
$9,455) $10,635) $12,608) $10,688) $10,633)
(10.91) (12.48) (18.55) (15.23) (0.51)
($ 41.23) ($ 42.33) ($ 43.60) ($ 44.91) ($ 46.22) ($ 479,340) ($ 493,998) ($ 511,724) ($ 532,674) ($ 549,412)
(3.48) (3.06) (3.59) (4.09) (3.14)
$1,205,280) $1,219,393) $1,292,069) $1,363,490) $1,424,793)(3.95) (1.17) (5.96) (5.53) (4.50)
SF CPI for this year (19-20) was 4.49% the district may take up to 3%.This year the maximum allowable rate would be $47.64. Estimated 25-30 K+.

FWMAD BUDGET WORKSHEET FISCAL YEAR 2019-20 SALARIES AND BENEFITS
SALARIES MONTHLY F.Y. MONTHLY F.Y. MONTHLY F.Y. MONTHLY F.Y. MONTHLY F.Y.No Inc. Current* 1% COLA #1 2% COLA #2 3% COLA #3 4% COLA #3
Manager $9,917) $119,004) $10,016) $120,194) $10,115) $121,384) $10,215) $122,574) $10,314) $123,764)Supt. $6,861) $82,332) $6,930) $83,155) $6,998) $83,979) $7,067) $84,802) $7,135) $85,625)Surv Specialist $4,681) $56,172) $4,728) $56,734) $4,775) $57,295) $4,821) $57,857) $4,868) $58,419)Scty./Bkpr. $4,787) $57,444) $4,835) $58,018) $4,883) $58,593) $4,931) $59,167) $4,978) $59,742)
FT Operators: 1 $5,161) $61,932) $5,213) $62,551) $5,264) $63,171) $5,316) $63,790) $5,367) $64,409)2 $5,161) $61,932) $5,213) $62,551) $5,264) $63,171) $5,316) $63,790) $5,367) $64,409)
*3 $5,161) $61,932) $5,213) $62,551) $5,264) $63,171) $5,316) $63,790) $5,367) $64,409)*4 $4,458) $53,496) $4,503) $54,031) $4,547) $54,566) $4,592) $55,101) $4,636) $55,636)5 $4,248) $50,976) $4,290) $51,486) $4,333) $51,996) $4,375) $52,505) $4,418) $53,015)
Seas SA (8 mo) $2,386) $19,085) $2,410) $19,276.21) $2,433) $19,467.07) $2,457) $19,657.92) $2,481) $19,848.77)Seas SA (7 mo) $2,386) $16,700) $2,410) $16,867) $2,433) $17,034) $2,457) $17,201) $2,481) $17,368)
TOTAL SALARIES $641,005) $647,415) $653,825) $660,235) $666,645)
BENEFITS RATE F.Y. RATE F.Y. RATE F.Y. RATE F.Y. RATE F.Y.
Health FT (Prem) $5,000.00) $60,000) $5,000.00) $60,000) $5,000.00) $60,000) $5,000.00) $60,000) $5,000.00) $60,000)ASI Admin Fee $270.00) $3,240) $270.00) $3,240) $270.00) $3,240) $270.00) $3,240) $270.00) $3,240)Health (Est Pay) $9,950) $9,950) $9,950) $9,950) $9,950)Life Ins. $9.25) $1,032) $9.25) $1,032) $9.25) $1,032) $9.25) $1,032) $9.25) $1,032)CCVCJPA $314.31 $3,772) $314.31 $3,772) $314.31 $3,772) $314.31 $3,772) $314.31 $3,772)P.E.R.S. 0.0968 $43,034.96) 0.0968 $43,465.31) 0.0968 $43,895.66) 0.0968 $44,326.01) 0.0968 $44,756.36)P.E.R.S. 2* 0.06985 $11,220.98) 0.06985 $11,333.19) 0.06985 $11,445.40) 0.06985 $11,557.61) 0.06985 $11,669.82)UAL $18,247) $18,247) $18,247) $18,247) $18,247)OASDI/medicare 0.0765 $49,037) 0.0765 $49,527) 0.0765 $50,018) 0.0765 $50,508) 0.0765 $50,998)
Unemployment 0.062 $4,774) 0.062 $4,774) 0.062 $4,774) 0.062 $4,774) 0.062 $4,774)
TOTAL BENEFITS $204,308) $205,341) $206,374) $207,407) $208,440)SALARIES & BEN. $845,313) $852,756) $860,199) $867,642) $875,085)
+ 2% "Cushion" $862,219) $869,811) $877,403) $884,995) $892,586)
4/10/2019
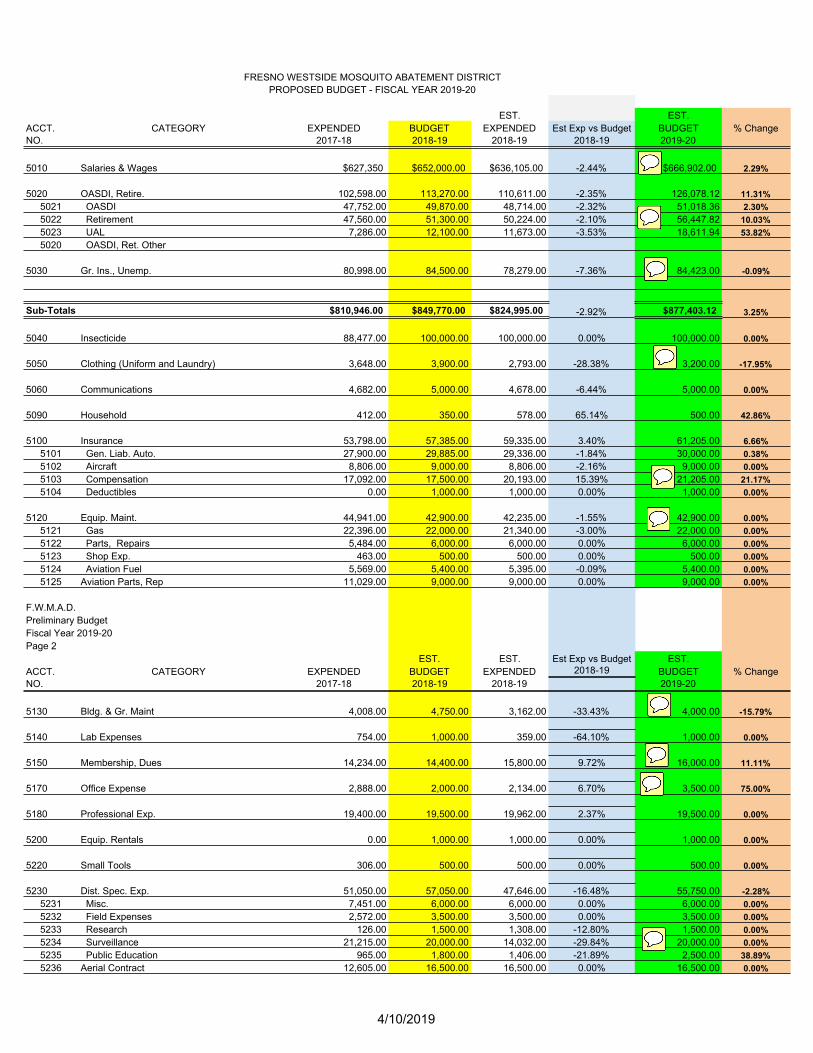
FRESNO WESTSIDE MOSQUITO ABATEMENT DISTRICTPROPOSED BUDGET - FISCAL YEAR 2019-20
EST. EST.ACCT. CATEGORY EXPENDED BUDGET EXPENDED Est Exp vs Budget BUDGET % ChangeNO. 2017-18 2018-19 2018-19 2018-19 2019-20
5010 Salaries & Wages $627,350) $652,000.00) $636,105.00) -2.44% $666,902.00) 2.29%
5020 OASDI, Retire. 102,598.00 113,270.00 110,611.00 -2.35% 126,078.12 11.31%5021 OASDI 47,752.00 49,870.00 48,714.00 -2.32% 51,018.36 2.30%5022 Retirement 47,560.00 51,300.00 50,224.00 -2.10% 56,447.82 10.03%5023 UAL 7,286.00 12,100.00 11,673.00 -3.53% 18,611.94 53.82%5020 OASDI, Ret. Other
5030 Gr. Ins., Unemp. 80,998.00 84,500.00 78,279.00 -7.36% 84,423.00 -0.09%
Sub-Totals $810,946.00) $849,770.00) $824,995.00) -2.92% $877,403.12) 3.25%
5040 Insecticide 88,477.00 100,000.00 100,000.00 0.00% 100,000.00 0.00%
5050 Clothing (Uniform and Laundry) 3,648.00 3,900.00 2,793.00 -28.38% 3,200.00 -17.95%
5060 Communications 4,682.00 5,000.00 4,678.00 -6.44% 5,000.00 0.00%
5090 Household 412.00 350.00 578.00 65.14% 500.00 42.86%
5100 Insurance 53,798.00 57,385.00 59,335.00 3.40% 61,205.00 6.66%5101 Gen. Liab. Auto. 27,900.00 29,885.00 29,336.00 -1.84% 30,000.00 0.38%5102 Aircraft 8,806.00 9,000.00 8,806.00 -2.16% 9,000.00 0.00%5103 Compensation 17,092.00 17,500.00 20,193.00 15.39% 21,205.00 21.17%5104 Deductibles 0.00 1,000.00 1,000.00 0.00% 1,000.00 0.00%
5120 Equip. Maint. 44,941.00 42,900.00 42,235.00 -1.55% 42,900.00 0.00%5121 Gas 22,396.00 22,000.00 21,340.00 -3.00% 22,000.00 0.00%5122 Parts, Repairs 5,484.00 6,000.00 6,000.00 0.00% 6,000.00 0.00%5123 Shop Exp. 463.00 500.00 500.00 0.00% 500.00 0.00%5124 Aviation Fuel 5,569.00 5,400.00 5,395.00 -0.09% 5,400.00 0.00%5125 Aviation Parts, Rep 11,029.00 9,000.00 9,000.00 0.00% 9,000.00 0.00%
F.W.M.A.D.Preliminary BudgetFiscal Year 2019-20Page 2
EST. EST. Est Exp vs Budget EST.ACCT. CATEGORY EXPENDED BUDGET EXPENDED 2018-19 BUDGET % ChangeNO. 2017-18 2018-19 2018-19 2019-20
5130 Bldg. & Gr. Maint 4,008.00 4,750.00 3,162.00 -33.43% 4,000.00 -15.79%
5140 Lab Expenses 754.00 1,000.00 359.00 -64.10% 1,000.00 0.00%
5150 Membership, Dues 14,234.00 14,400.00 15,800.00 9.72% 16,000.00 11.11%
5170 Office Expense 2,888.00 2,000.00 2,134.00 6.70% 3,500.00 75.00%
5180 Professional Exp. 19,400.00 19,500.00 19,962.00 2.37% 19,500.00 0.00%
5200 Equip. Rentals 0.00 1,000.00 1,000.00 0.00% 1,000.00 0.00%
5220 Small Tools 306.00 500.00 500.00 0.00% 500.00 0.00%
5230 Dist. Spec. Exp. 51,050.00 57,050.00 47,646.00 -16.48% 55,750.00 -2.28%5231 Misc. 7,451.00 6,000.00 6,000.00 0.00% 6,000.00 0.00%5232 Field Expenses 2,572.00 3,500.00 3,500.00 0.00% 3,500.00 0.00%5233 Research 126.00 1,500.00 1,308.00 -12.80% 1,500.00 0.00%5234 Surveillance 21,215.00 20,000.00 14,032.00 -29.84% 20,000.00 0.00%5235 Public Education 965.00 1,800.00 1,406.00 -21.89% 2,500.00 38.89%5236 Aerial Contract 12,605.00 16,500.00 16,500.00 0.00% 16,500.00 0.00%
2% COLA Factored, 3 employees (2 full-time, 1 seasonal) with step increases
UAL and rate increased in most recent Valuation Report. This is likely to continue
Uniform Contract to increase this year (5%), added to expected expense
SDRMA had 5% increase for WC.
Maintenance costs have remained relatively low over the last few years. We hope to no longer have to maintain the adjacent property
CSDA membership continues to increase.
Manager's Microsoft Tablet had a catastrophic failure outside of warranty. Need to replace with a portable tablet for travel/out-of-office work. ($1500). Otherwise office expenses are relatively stable.
We are becoming increasingly involved in public education efforts. Additional cost for materials and event fees have been added.
Health insurance adjustment accounts for a modest increase in premiums half way through the year. This year we have lower premiums but higher risk with use (deductible contributions). However, I am still budgeting for expected use and any excess can be shifted internally or pulled from reserves (for unexpected heavy use).
The items in this category appear to be relatively stable. As always, aircraft and vehicle repair costs will vary by year. At least one more year of costs with our new plane management and repairs company will give us a better idea of expected costs moving forward.

4/10/2019
5237 Digital Field Data Licensing 6,116.00 7,750.00 4,900.00 -36.77% 5,750.00 -25.81%
5250 Transportation 17,855.00 23,800.00 14,883.00 -37.47% 23,400.00 -1.68%5251 Trustees 6,500.00 8,400.00 6,800.00 -19.05% 8,000.00 -4.76%5252 Meals, Rooms 11,355.00 15,400.00 8,083.00 -47.51% 15,400.00 0.00%
5260 Utilities 11,507.00 11,000.00 11,967.00 8.79% 12,200.00 10.91%
Sub-totals $317,960.00) $344,535.00) $327,032.00) -5.08% $349,655.00) 1.49%
F.W.M.A.D.Preliminary BudgetFiscal Year 2019-20Page 3
EST. EST. Est Exp vs Budget EST.ACCT. CATEGORY EXPENDED BUDGET EXPENDED 2018-19 BUDGET % ChangeNO. 2017-18 2018-19 2018-19 2019-20
5340 Fees & Assess. 3,333.00 3,200.00 3,335.00 4.22% 3,335.00 4.22%
5360 Bldg. & Gr. Improv. 0.00 5,000.00 21,125.00 322.50% 0.00
5370 Equipment 78,618.00 40,000.00 40,243.00 0.61% 20,000.005371 Office 35,000.00 0.00 0.00 0.005372 Auto 22,339.00 15,000.00 15,000.00 0.00% 20,000.005373 Aircraft 16,880.00 0.00 0.00 0.005374 Shop 0.00 22,000.00 22,243.00 1.10% 0.005375 Field 4,399.00 3,000.00 3,000.00 0.00% 0.00
5380 Retiree Pass Through 4,862.00 850.00 798.00 -6.12% 850.00 0.00%5390 Long-Term Debt 132,456.00 132,500.00 132,456.00 -0.03% 132,500.00 0.00%
00
Sub-totals 219,269.00 181,550.00 197,957.00 9.04% 156,685.00 -13.70%
Budget Totals $1,348,175.00) $1,375,855.00) ($ 1,349,984.00) -1.88% $1,383,743.12) 0.57%
F.W.M.A.D.Preliminary BudgetFiscal Year 2019-20Page 4
ANTICIPATED REVENUES: Last Year This Year
Cash on Hand - June 30 ($ 1,976,297.68) 2,142,522.09Taxes ($ 875,381.00) 876,000Assessment ($ 549,412.00) 549,500.00Other Income ($ 59,000.00) 50,000Interest ($ 18,000.00) 18,000District Deposits ($ 5,021.00) 2,700Retiree's Pass-through ($ 798.00) 798Zika Funds ($ 8,596.41) 0
TOTAL 3,492,506 3,639,520
Do we want to budget a potential cap outlay for a new plane in case the transition happens and is not cost neutral?
The transition of FieldSeeker to ArcGIS Online has reduced hosting and licensing costs.
I am reducing the trustee stipend budget slightly as we do never have full attendance through the year and we are down a seat at this time.
PG and E continues to increase. Firebaugh utilities have also had a modest increase.
This budget amount covers the EV vehicles (in excess of the stipend). This is likely to carryover from the previous FY
Travel Expenses are continually below budget over the last few years. We can consider lowing it, but I would hesitate dropping it too much for a couple of reasons. First, the last couple years have had a lot of meetings in Sacramento, where I do not have lodging or significant food costs. If this were to change, the costs would be higher. I also want to leave the possibility open for Trustee and/or additional employee travel.
4/10/2019
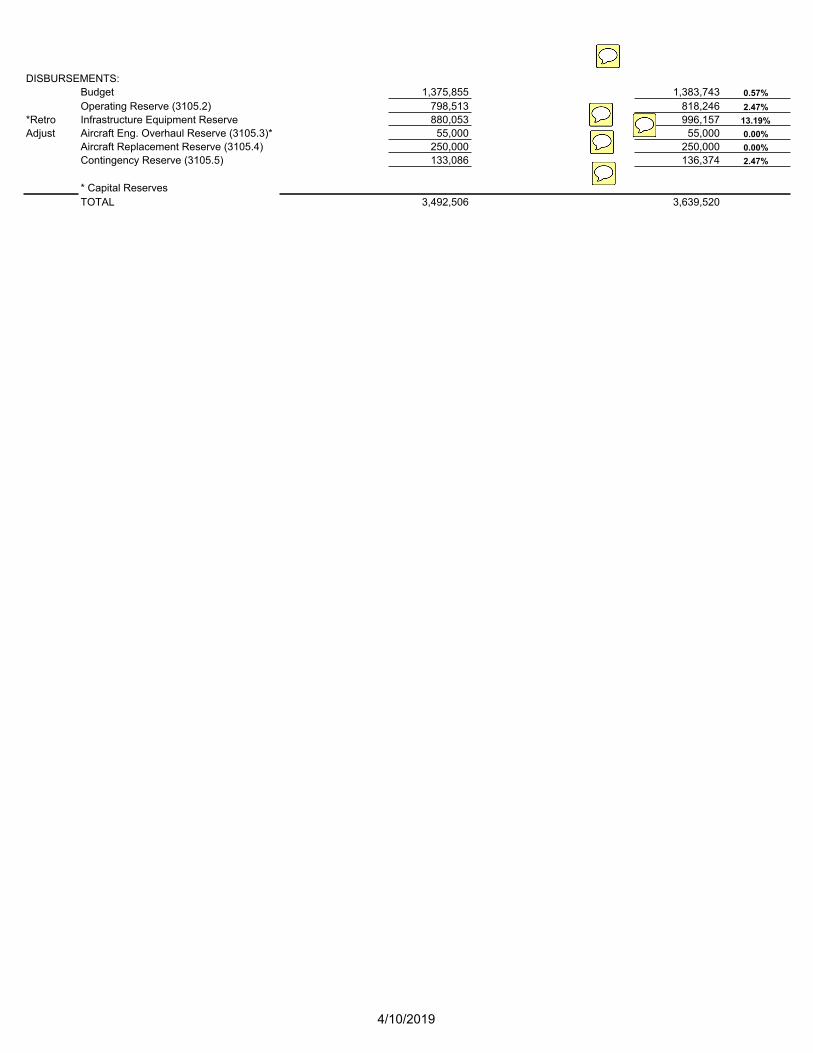
DISBURSEMENTS:Budget 1,375,855 1,383,743 0.57%Operating Reserve (3105.2) 798,513 818,246 2.47%
*Retro Infrastructure Equipment Reserve 880,053 996,157 13.19%Adjust Aircraft Eng. Overhaul Reserve (3105.3)* 55,000 55,000 0.00%
Aircraft Replacement Reserve (3105.4) 250,000 250,000 0.00%Contingency Reserve (3105.5) 133,086 136,374 2.47%
* Capital ReservesTOTAL 3,492,506 3,639,520
Operating and contingency reserve have increased slightly with the budget. One-time capital expenses are being excluded from this calculation per policy.
Engine overhaul is fully funded at this time. As Ty has informed us that the overhaul on this Piper is likely to be costly due to complexity and shortage of parts, we may need to consider changing the policy to increase this reserve. As a Capital Reserve (3105.3) it must be funded between 1 year and 5 years expected expenses. This falls within that range.
This category is fully-funded.
Infrastructure/Equipment Reserve has raised with the increase in total reserves. We may consider designating a Capital Reserve for a Solar and EV improvement project (if desired)
The Reserve Analysis Report for 2019-2020 is integrated into this document.

ACTUAL EXPENSES MULTIYEAR COMPARISONJul '14 - Jun 15 FY 14-15 % change Jul '15 - Jun 16 FY 15-16 % change Jul '16 - Jun 17 FY 16-17 % change Jul '17 - Jun 18 FY 17-18 % change
IncomeDistrict Deposits
Retiree's 0.00 x 5,621.37 x 7,361.27 30.95% 4,862.48 -33.95%District Deposits - Other 2,544.50 59.89% 1,941.83 -23.69% 3,384.43 74.29% 5,233.91 54.65%
Total District Deposits 2,544.50 59.89% 7,563.20 197.24% 10,745.70 42.08% 10,096.39 -6.04%Interest 21,635.09 -26.93% 18,757.84 -13.30% 20,275.90 8.09% 36,820.21 81.60%Other Charge 44,975.31 -25.83% 60,048.25 33.51% 80,000.00 33.23% 49,274.96 -38.41%Taxes - Benefit Assessment 479,333.37 2.86% 494,289.57 3.12% 515,464.79 4.28% 531,819.80 3.17%Taxes - Property 746,596.99 6.58% 744,549.83 -0.27% 801,913.66 7.70% 875,902.41 9.23%
Total Income 1,295,085.00 2.92% 1,325,209.00 2.33% 1,428,400.00 7.79% 1,503,914.00 5.29%
Expense5010 Salaries & Wages 616,713.34 11.02% 575,423.64 -6.70% 604,092.39 4.98% 627,349.93 3.85%5020 OASDI, Retirement
5021 OASDI 0.00 x 43,237.99 x 44,939.32 3.93% 47,751.83 6.26%5022 CalPERS Normal 0.00 x 39,950.58 x 45,353.48 13.52% 47,559.88 4.86%5023 Unfunded Accrued Liability 352,660.00 x 4,496.00 -98.73% 4.00 -99.91% 7,286.00 182050.00%5020 OASDI, Retirement - Other 85,305.31 2.80% 0.00 -100.00% 0.00 x 0.00 x
Total 5020 OASDI, Retirement 437,965.31 427.80% 87,684.57 -79.98% 90,296.80 2.98% 102,597.71 13.62%5030 Gr. Ins., Unemp. 68,404.42 8.66% 58,864.48 -13.95% 72,259.67 22.76% 80,998.25 12.09%5031 Retiree's Insurance 0.00 x 5,558.00 x 7,424.64 33.58% 0.00 -100.00%5040 Insecticide 96,146.13 6.21% 86,748.15 -9.77% 94,141.42 8.52% 88,476.54 -6.02%5050 Clothing 2,947.23 5.52% 2,940.23 -0.24% 3,250.08 10.54% 3,648.41 12.26%5060 Communications 2,376.12 46.50% 1,952.01 -17.85% 3,856.24 97.55% 4,681.75 21.41%5090 Household 652.53 -54.51% 118.91 -81.78% 345.86 190.86% 412.19 19.18%5100 Insurance
5101 General, Liability, Auto 25,726.77 6.58% 26,705.59 3.80% 23,155.55 -13.29% 27,899.50 20.49%5102 Aircraft 8,806.00 0.00% 8,806.00 0.00% 8,806.00 0.00% 8,806.00 0.00%5103 Compensation 21,935.34 7.55% 23,694.84 8.02% 21,212.35 -10.48% 17,091.99 -19.42%5104 Deductibles 0.00 x 0.00 x 0.00 x 0.00 x
Total 5100 Insurance 56,468.11 5.87% 59,206.43 4.85% 53,173.90 -10.19% 53,797.49 1.17%5120 Equipment Maintenance
5121 Gas & Oil 23,429.96 -0.94% 17,504.94 -25.29% 17,312.39 -1.10% 22,395.64 29.36%5122 Parts, Repairs 8,283.75 30.09% 6,639.67 -19.85% 3,969.63 -40.21% 5,484.41 38.16%5123 Shop Expense 3,194.73 -25.55% 3,840.98 20.23% 3,936.05 2.48% 463.25 -88.23%5124 Gas & Oil - Aircraft 3,532.22 -61.66% 2,341.35 -33.71% 4,938.01 110.90% 5,569.28 12.78%5125 Parts & Repairs, Aircraft 6,455.30 -25.65% 17,589.52 172.48% 11,298.07 -35.77% 11,029.32 -2.38%
Total 5120 Equipment Maintenance 44,895.96 -14.00% 47,916.46 6.73% 41,454.15 -13.49% 44,941.90 8.41%5130 Bldg and Grounds Maint. 10,701.15 87.08% 9,183.55 -14.18% 7,832.90 -14.71% 4,007.68 -48.84%5140 Lab Expenses 383.20 66.34% 659.59 72.13% 627.27 -4.90% 754.23 20.24%5150 Membership and Dues 12,415.00 0.45% 12,250.00 -1.33% 14,058.00 14.76% 14,234.00 1.25%5170 Office Expense 2,752.06 -22.32% 1,656.26 -39.82% 4,459.23 169.23% 2,888.25 -35.23%5180 Professional Services 19,168.60 5.45% 18,877.49 -1.52% 19,228.90 1.86% 19,400.29 0.89%5200 Equipment Rentals 0.00 x 0.00 x 0.00 x 0.00 x5220 Small Tools 463.11 -38.63% 427.43 -7.70% 30.20 -92.93% 305.84 912.72%5230 District Special Expense
5231 Miscellaneous 5,932.18 80.58% 6,316.76 6.48% 4,589.34 -27.35% 7,451.18 62.36%5232 Field Expenses 2,730.78 -30.43% 8,073.92 195.66% 2,129.51 -73.62% 2,571.79 20.77%5233 Research 1,129.52 x 290.62 -74.27% 552.64 90.16% 125.86 -77.23%5234 Surveillance 14,364.77 59.90% 16,212.31 12.86% 18,950.63 16.89% 21,214.91 11.95%5235 Public Education 436.30 36.70% 869.32 99.25% 912.62 4.98% 964.72 5.71%5236 Aerial Management 0.00 x 0.00 x 5,165.00 x 12,605.00 144.05%5237 Digital Field Data License 0.00 x 0.00 x 0.00 x 6,115.95 x
Total 5230 District Special Expense 24,593.55 48.94% 31,762.93 29.15% 32,299.74 1.69% 51,049.41 58.05%5250 Transportation x
5251 Trustees 6,700.00 -5.63% 6,400.00 -4.48% 6,900.00 7.81% 6,500.00 -5.80%5252 Travel Expenses 12,058.58 23.00% 10,246.04 -15.03% 6,877.16 -32.88% 11,355.00 65.11%
Total 5250 Transportation 18,758.58 10.97% 16,646.04 -11.26% 13,777.16 -17.23% 17,855.00 29.60%5260 Utilities 10,788.97 43.28% 11,255.66 4.33% 10,669.06 -5.21% 11,507.08 7.85%5340 Fees & Assessments 3,037.61 8.70% 3,194.55 5.17% 3,192.58 -0.06% 3,332.67 4.39%5360 Bldg & Grounds Improve. 14,415.91 -98.57% 0.00 -100.00% 2,958.52 x 0.00 -100.00%5370 Capital Outlay
5371 Office 0.00 x 0.00 x 20,595.00 x 35,000.00 69.94%5372 Auto 24,146.99 x 0.00 -100.00% 0.00 x 22,339.06 x5373 Aircraft 0.00 x 0.00 x 0.00 x 16,879.64 x5374 Shop 0.00 x 0.00 x 0.00 x 0.00 x5375 Field 0.00 -100.00% 9,415.21 x 6,383.46 -32.20% 4,399.44 -31.08%
Total 5370 Capital Outlay 24,146.99 101.28% 9,415.21 -61.01% 26,978.46 186.54% 78,618.14 191.41%5380 Retiree's Insurance 0.00 x 0.00 x 0.00 x 4,862.48 x5390 Long Term Debt 132,456.14 0.00% 132,456.14 0.00% 132,456.14 0.00% 132,456.14 0.00%
Total Expense 1,600,650.00 -25.16% 1,174,198.00 -26.64% 1,238,863.00 5.51% 1,348,175.00 8.82%

Budget Accuracy Analysis (Budgeted v. Actual)
FY 13-14 FY 14-15 FY 15-16 FY 16-17 FY 17-18Income District Deposits
Retiree'sDistrict Deposits - Other 6.10% 69.63% 29.46% 125.63% 127.56%
Total District Deposits 6.10% 69.63% 45.45% 26.42% -1.98%Fresno County Zika Funding X X X -100.00% -0.90%Interest 48.05% -13.46% -14.74% 1.38% 84.10%Other Charge 21.28% -25.04% 0.08% 0.00% -50.72%Taxes - Benefit Assessment 0.65% 2.64% 0.06% 1.07% 2.87%Taxes - Property 11.20% 7.27% 2.56% 10.61% 12.30%TOTAL INCOME 8.06% 3.65% 1.38% 7.61% 5.16%
Expense5010 Salaries & Wages -5.05% -0.21% -9.38% -5.20% -3.06%5020 OASDI, Retirement
5021 OASDI X X -11.03% -6.38% -3.63%5022 CalPERS Normal X X -7.09% -3.50% -2.94%5023 Unfunded Accrued Liability X 0.00% 66.52% 0.00% -36.78%5020 OASDI, Retirement - Other -4.07% -5.22% X -100.00% -100.00%
Total 5020 OASDI, Retirement -4.07% -1.06% -7.01% -4.95% -6.79%5030 Gr. Ins., Unemp. -11.33% -14.49% -22.95% -37.60% -17.39%5031 Retiree's Insurance X X 50.22% 6.07% -100.00%5040 Insecticide -9.48% -3.85% -13.25% -5.86% -11.52%5050 Clothing 3.45% -1.76% -15.99% 0.00% -50.23%5060 Communications -56.16% 18.81% -34.93% -32.93% -19.49%5090 Household -4.38% -56.50% -92.07% -65.41% -17.56%5100 Insurance
5101 General, Liability, Auto -3.45% 0.89% 0.78% -14.24% 3.33%5102 Aircraft -7.30% -7.30% -7.30% -2.16% -2.16%5103 Compensation -2.88% -0.29% -32.30% -29.29% -43.03%5104 Deductibles -100.00% -100.00% -100.00% -100.00% -100.00%
Total 5100 Insurance -5.59% -2.64% -17.77% -20.64% -19.70%5120 Equipment Maintenance
5121 Gas & Oil -11.08% -13.22% -35.17% -35.88% -17.05%5122 Parts, Repairs 6.13% 38.06% 10.66% -33.84% -8.59%5123 Shop Expense 43.03% -8.72% 9.74% 12.46% -42.09%5124 Gas & Oil - Aircraft -47.36% -70.56% -70.73% -24.03% -14.32%5125 Parts & Repairs, Aircraft -13.18% -35.45% 95.44% 25.53% 22.55%
Total 5120 Equipment Maintenance -17.27% -23.25% -10.44% -20.28% -8.84%5130 Bldg and Grounds Maint. 90.67% 52.87% 8.04% -2.09% -19.85%5140 Lab Expenses -53.93% -23.36% -67.02% -58.18% -49.72%5150 Membership and Dues 2.99% -4.50% -5.77% 4.13% -1.83%5170 Office Expense -11.42% -31.20% -58.59% -10.81% 44.41%5180 Professional Services -20.96% -4.16% 2.04% -1.39% -0.51%5200 Equipment Rentals -100.00% -100.00% -100.00% -100.00% -100.00%5220 Small Tools 50.93% -7.38% -14.51% -93.96% -38.83%5230 District Special Expense
5231 Miscellaneous -40.27% 18.64% -7.11% -33.29% 8.30%5232 Field Expenses -21.50% -21.98% -68.34% -52.68% -42.85%5233 Research -100.00% -43.52% -85.47% -63.16% -91.61%5234 Surveillance -40.11% -4.23% 8.08% -5.25% 6.08%5235 Public Education -84.04% -78.18% -65.23% -39.16% -35.68%5236 Aerial Management X X X 0.00% -49.58%5237 Digital Field Data License X X X -100.00% -38.84%
Total 5230 District Special Expense -44.02% -10.57% -38.68% -6.05% -26.42%5250 Transportation
5251 Trustees -15.48% -20.24% -23.81% -17.86% -22.62%5252 Travel Expenses -32.39% -14.48% -34.32% -55.92% -27.21%
Total 5250 Transportation -26.18% -16.63% -30.64% -42.59% -25.60%5260 Utilities -23.16% 43.85% -2.12% -7.23% 0.06%5340 Fees & Assessments -44.11% -24.06% 6.49% 6.42% 4.15%5360 Bldg & Grounds Improve. 0.65% -0.58% -100.00% -15.47% -100.00%5370 Capital Outlay
5371 Office X X -100.00% -85.65% 0.00%5372 Auto X -3.41% X -100.00% 0.00%5373 Aircraft X X X -100.00% 0.00%5374 Shop X X X -100.00% -100.00%5375 Field -0.03% X X X 0.00%
Total 5370 Capital Outlay -0.03% -3.41% -76.46% -81.20% 0.00%5380 Retiree's Insurance X X X -100.00% -39.22%5390 Long Term Debt -0.41% -0.41% -0.41% -0.41% -0.41%TOTAL EXPENSE -3.93% -2.62% -13.26% -15.30% -6.69%

FRESNO WESTSIDE MOSQUITO ABATEMENT DISTRICT
2019-20 BUDGET ESTIMATES SUMMARY
SALARIES No COLA 1% COLA 2% COLA 3% COLA
WAGES $641,005) $647,415) $653,825) $660,235)BENEFITS $204,308) $205,341) $206,374) $207,407)
Sub-Total $845,313) $852,756) $860,199) $867,642)
Salaries & BenefitsPlus 2% "Cushion" $862,219) $869,811) $877,403) $884,995)
SALARIES & BENEFITS $862,219) $869,811) $877,403) $884,995)
OPERATIONS $349,655) $349,655) $349,655) $349,655)
CAPITAL OUTLAY $156,685) $156,685) $156,685) $156,685)
TOTAL BUDGET $1,368,559) $1,376,151) $1,383,743) $1,391,335)
Projected Cash & Inc. $3,639,520) $3,639,520) $3,639,520) $3,639,520)
RESERVES
Operating (60%) $809,136) $813,691) $818,246) $822,801)Infrastrusture/Equipuipment $1,077,912) $1,065,309) $1,052,707) $1,040,104)Aircraft Engine Overhaul $55,000) $55,000) $55,000) $55,000)Aircraft Replacement $250,000) $250,000) $250,000) $250,000)Contingent Liability (10%) $78,914) $79,369) $79,825) $80,280)
Total Reserves $2,270,961) $2,263,369) $2,255,777) $2,248,185)% Change in Reserves (14.91) (14.53) (14.14) (13.76)
Estimated Reserves 7/1/18: $1,976,299(Cash on Hand at the end of the fiscal year)
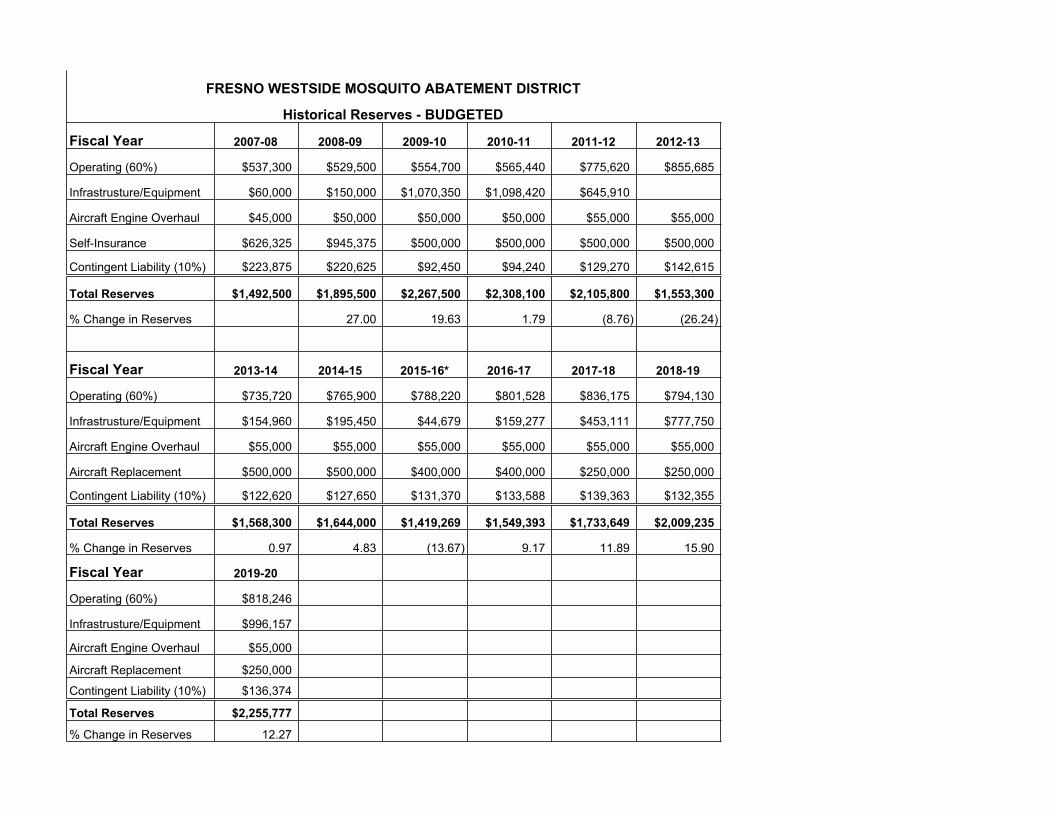
FRESNO WESTSIDE MOSQUITO ABATEMENT DISTRICT
Historical Reserves - BUDGETED
Fiscal Year 2007-08 2008-09 2009-10 2010-11 2011-12 2012-13
Operating (60%) $537,300) $529,500) $554,700) $565,440) $775,620) $855,685)
Infrastrusture/Equipment $60,000) $150,000) $1,070,350) $1,098,420) $645,910)
Aircraft Engine Overhaul $45,000) $50,000) $50,000) $50,000) $55,000) $55,000)
Self-Insurance $626,325) $945,375) $500,000) $500,000) $500,000) $500,000)
Contingent Liability (10%) $223,875) $220,625) $92,450) $94,240) $129,270) $142,615)
Total Reserves $1,492,500) $1,895,500) $2,267,500) $2,308,100) $2,105,800) $1,553,300)
% Change in Reserves (27.00) (19.63) (1.79) (8.76) (26.24)
Fiscal Year 2013-14 2014-15 2015-16* 2016-17 2017-18 2018-19
Operating (60%) $735,720) $765,900) $788,220) $801,528) $836,175) $794,130)
Infrastrusture/Equipment $154,960) $195,450) $44,679) $159,277) $453,111) $777,750)
Aircraft Engine Overhaul $55,000) $55,000) $55,000) $55,000) $55,000) $55,000)
Aircraft Replacement $500,000) $500,000) $400,000) $400,000) $250,000) $250,000)
Contingent Liability (10%) $122,620) $127,650) $131,370) $133,588) $139,363) $132,355)
Total Reserves $1,568,300) $1,644,000) $1,419,269) $1,549,393) $1,733,649) $2,009,235)
% Change in Reserves (0.97) (4.83) (13.67) (9.17) (11.89) (15.90)
Fiscal Year 2019-20
Operating (60%) $818,246)
Infrastrusture/Equipment $996,157)
Aircraft Engine Overhaul $55,000)
Aircraft Replacement $250,000)
Contingent Liability (10%) $136,374)
Total Reserves $2,255,777)
% Change in Reserves (12.27)


![REDHILL HIGH SCHOOL - Prelim Website CAPS 2019 Prelim... · Redhill High School 2019 Gr 12 Prelim Paper 2 13 of 24 (2) Hence, prove that ED BC (3) Question 7 [9 marks] A survey was](https://static.fdocuments.us/doc/165x107/5fff3439d0179b00b805e9dd/redhill-high-school-prelim-website-caps-2019-prelim-redhill-high-school-2019.jpg)