
COMBINED BRICS book Final Aug 2013 · 2014-02-18 · R & D Research and Development RoO Rules of...
182
Transcript of COMBINED BRICS book Final Aug 2013 · 2014-02-18 · R & D Research and Development RoO Rules of...


BRICS:
South Africa’s Way Ahead?
Authors: Ron Sandrey, Taku Fundira, Nick Vink, Hans G. Jensen, Willemien Viljoen
and Bonani Nyhodo
���� PLEASE CONSIDER THE ENVIRONMENT BEFORE PRINTING THIS PUBLICATION

© 2013 Trade Law Centre, National Agricultural Marketing Council, Royal Danish Embassy, and Swedish
Embassy, Nairobi.
Published by the Trade Law Centre (tralac) | First published 2013
P.O. Box 224, Stellenbosch, South Africa, 7599
Cover illustration and design by Lize Daneel | Language editing by Alta Schoeman
Back cover text by Trudi Hartzenberg | ISBN: 978-0-9870127-7-7
Printed by RSAM Printers
Kuils River, South Africa
0824184878 | [email protected]
All rights reserved. No reproduction, copy or transmission of this publication may be made without written
permission. No paragraph of the publication may be reproduced, copied or transmitted save with written
permission. Any person who does any unauthorised act in relation to this publication may be liable to
criminal prosecution and civil claims for damages.
Publication of this book was made possible by the support of the Trade Law Centre (tralac), National
Agricultural Marketing Council (NAMC), the Royal Danish Embassy, and the Swedish Embassy, Nairobi.
The views expressed by the authors are not necessarily the view of any of these institutions.
Trade Law Centre (tralac)
P.O. Box 224, Stellenbosch, South Africa, 7599
Tel. +27-21-8802010 | Fax +27-21-8802083
[email protected] | http://www.tralac.org
National Agricultural Marketing Council (NAMC)
Private Bag X935, Pretoria, South Africa, 0001
Tel: +27-12-3411115 | Fax: +27-12-3411811
[email protected] | www.namc.co.za
The Royal Danish Embassy
P.O. Box 11439, Hatfield, South Africa, 0028
Tel: +27-12-4309340 | Fax: +27-12-3427620
[email protected] | www.ambpretoria.um.dk
The Swedish Embassy Nairobi
PO Box 30600, 00100 Nairobi, Kenya
Tel: +254204234000 | Fax: +254 (0)204234339
http://www.swedenabroad.com/en-
GB/Embassies/Nairobi/
| i
Contents
Abbreviations iii
About the authors v
Foreword vii
Chapter 1
BRICS – South Africa’s way ahead? Summary
Ron Sandrey 1
Chapter 2
South Africa’s way ahead: are we a BRIC?
Ron Sandrey 33
Chapter 3
Trade at a glance: the BRICS’ engagement with Africa
Taku Fundira 48
Chapter 4
Foreign Direct Investment in South Africa: the BRIC perspective
Ron Sandrey 90
Chapter 5
Chinese domination of the African industrial goods market
Ron Sandrey, Taku Fundira and Hans G. Jensen 111
Chapter 6
The BRICs and agricultural exports to Africa: are they a threat to
South African interests?
Ron Sandrey, Nick Vink and Hans G. Jensen 129
Chapter 7
South African agricultural export prospects to the BRICs
Ron Sandrey and Taku Fundira 154
Chapter 8
The rise and rise of Brazilian agriculture: what does it mean for South Africa?
Ron Sandrey and Nick Vink 171

| ii
Chapter 9
Agriculture in Russia, India and China
Ron Sandrey and Nick Vink 195
Chapter 10
South African agricultural imports and policy space
Ron Sandrey 220
Chapter 11
Trade remedies and safeguards in BRICS countries
Willemien Viljoen 238
Chapter 12
South Africa’s economy-wide effects as a result of increased total factor productivity
on the country’s agricultural sector: a preliminary investigation
Bonani Nyhodo, Hans G. Jensen and Ron Sandrey 282
Chapter 13
South Africa’s way ahead: into the MIST?
Ron Sandrey and Nick Vink 303
Chapter 14
BLNS: The BRIC trading relationships in perspective with their EU trade
Ron Sandrey 335

| iii
Abbreviations
AGOA African Growth and Opportunity Act
AEZ Agri Ecological Zone
AfDB African Development Bank
AIASA Asia Institute of Applied System Analysis
AMAD Agricultural Market Access Database
BLNS Botswana, Lesotho, Namibia and Swaziland
BRICS Brazil, Russia, India, China and South Africa
CADF China Africa Development Fund
CAGR Compound Annual Growth Rate
CIF Cost Insurance and Freight
CIS Commonwealth of Independent States
EU European Union
EPA Economic Partnership Agreement
FAO Food and Agriculture Organisation
FDI Foreign Direct Investment
f.o.b Free on Board
FOCAC Forum on China-Africa Cooperation
FTA Free Trade Agreement
GATT General Agreement on Tariffs and Trade
GDP Gross Domestic Product
GNI Gross National Input
GNP Gross National Product
GTA Global Trade Atlas
GTAP Global Trade Analysis Project
HS Harmonised System
IBSA India, Brazil and South Africa
ICBC Industrial and Commercial Bank of China
IDC International Development Corporation
IFPRI International Food Policy Research Institute
ISIC International Standard for Industrial Cooperation
ITAC International Trade Administration Commission
LDC Least Developed Country
LGP Length of Growing Period
Mercosur Common Market of the South, Latin American trade organization

| iv
MFN Most Favoured Nation
MIST Mexico, India, South Korea and Turkey
MOFCOM Ministry of Commerce
NAMA Non-Agricultural Market Access
NAMC National Agricultural Marketing Council
NRA Nominal Rate of Assistance
NTBs Non-Tariff Barriers
NTMs Non-Tariff Measures
ODA Official Development Assistance
OECD Organisation for Economic Cooperation and Development
PSE Producer Support Estimate
PTA Preferential Trade Agreement
R & D Research and Development
RoO Rules of Origin
SA Republic of South Africa
RTA Regional Trade Agreement
SACU Southern African Customs Union
SADC Southern African Development Community
SMEs Small and Medium Enterprises
SPS Sanitary and Phytosanitary
SSG Special Safeguards
TDCA Trade, Development and Cooperation Agreement
TFP Total Factor Productivity
TFTA Tripartite Free Trade Area
TBT Technical Barriers to Trade
TPR Trade Policy Review
TPRM Trade Policy Review Mechanism
TRAINS Trade Analysis Information System
tralac Trade Law Centre
TRQ Tariff Rate Quotas
UNCTAD United Nations Conference on Trade and Development
US United States of America
VAT Value Added Tax
WTA World Trade Atlas
WTO World Trade Organisation
XSC Rest of SACU (Lesotho, Namibia and Swaziland as used in GTAP)

BRICS: South Africa’s Way Ahead?
| v
About the authors
Hartzenberg, Trudi is the Executive Director of the Trade Law Centre (tralac). She is an
economist whose areas of specialisation include trade, industrial trade, industrial and
competition policy, regional integration, and industrial organisation. She has taught at the
Universities of Natal, Cape Town, Western Cape and Copenhagen, as well as the Graduate
School of Business at the University of Cape Town and the Copenhagen Business School.
She has worked on assignment for a number of international institutions including the IMF,
African Development Bank, and the Commonwealth Secretariat. Contact: [email protected].
Sandrey, Ron is an associate at the Trade Law Centre (tralac) and is Professor Extraordinaire
at the Department of Agricultural Economics at the University of Stellenbosch. He came to
Africa in 2005 following a career in New Zealand as an economist with the New Zealand
Ministry of Foreign Affairs and Trade and the Ministry of Agriculture and Fisheries in that
country. Since coming to South Africa he has worked extensively on trade and trade-related
issues in southern Africa. He holds a PhD in Economics from Oregon State University.
Contact: [email protected].
Fundira, Taku is a researcher at the Trade Law Centre (tralac) whose main interests are trade
statistics, trade policy, and trade in agriculture. He holds a Masters degree in Agricultural
Economics from Stellenbosch University and is a member of the Agricultural Economics
Association of South Africa (AEASA). He is also part of the Trade Reference Group which
brings together researchers to share ideas on topical agricultural trade-related issues.
Vink, Nick joined the University of Stellenbosch as professor in agricultural economics in
1996 after 11 years at the Development Bank of Southern Africa (DBSA). He is an
agricultural economist specialising in agricultural and rural development policy, land reform
and empowerment, agricultural marketing, tax, and international trade issues.

BRICS: South Africa’s Way Ahead?
| vi
Jensen, Hans Grinsted is a researcher at the University of Copenhagen, Institute of Food and
Resource Economics, International Economics and Policy Division. His field of expertise has
focused on the Common Agricultural Policy, World Trade Organisation, European Union
enlargement, and general equilibrium modelling for the past 10 years. He was awarded the
Global Trade Analysis Project Research Fellow distinction in recognition of his significant
contribution to the development of the GTAP database and is a member of the GTAP
advisory board. He has published international articles focusing on the EU enlargement, the
EU sugar regime, and the decoupling of domestic support in the EU, among others. He has
also had his work published in various book chapters. Contact: [email protected].
Viljoen, Willemien holds a BComm Honours degree in Economics and a Bachelor of Laws
degree (LLB) from the University of Stellenbosch. Her research interests are non-tariff
barriers to trade, trade data analysis and modelling, regional integration, and international
trade policy.
Nyhodo, Bonani is a senior researcher (trade analysis) at the National Agricultural Marketing
Council (NAMC). His education took shape when he enrolled for a BSc in Agricultural
Economics at the University of Fort Hare and was further refined during his postgraduate
years at the University of Stellenbosch, with his highest educational achievement being an
MSc in Agricultural Economics. Early in 2005, Nyhodo joined the Western Cape Department
of Agriculture under the Young Professionals Programme (within the PROVIDE project).
After a year with the Western Cape Department he left to join the NAMC as an economist.
His interests include political economy, industrial policy, and the use of trade policy as a
developmental tool. He has a passion for subsistence farming. To his name are a number of
trade-related publications and he has won a number of awards.

BRICS: South Africa’s Way Ahead?
| vii
Foreword
The accession of South Africa into the BRICS formation has attracted a lot of attention
internationally. Some welcomed the step while others questioned it. A closer look at BRICS
reveals that these countries share some fundamental features while they differ in others. On
that note, this book does not attempt to define BRICS.
BRIC, the acronym, was coined by Jim O’Neill of Goldman Sachs in 2001. The founding
members of this political formation are Brazil, Russia, India and China, aligning well with the
word formulation. The formation of the BRIC was motivated by global economic
developments and change in the geopolitical configurations. South Africa joined the group in
2011, thus opening the possibility of putting Africa on the BRICS’ agenda. South Africa’s
admission to the group was motivated by China and supported by Russia. Its accession to the
BRICS generated much discussion about the country’s suitability to be part of the formation.
One of the real issues raised is that South Africa does not measure up to the other BRIC
economies in terms of population, trade levels and performance, and growth rates. A
formation such as the BRICS is of value to South Africa only if the country’s strategic
development interests (relating, for example, to agriculture) are to be on the agenda.
South Africa faces particular challenges related to market access into the BRIC countries.
Agricultural issues are discussed under the Standing Expert Working Group on
Agriculture and Agrarian Development. The issues that are prioritised include:
• The development of a general strategy for access to food (this is where market access
needs to be tabled), which is tasked to Brazil
• Impact of climate change of food security, which is allocated to South Africa
• The enhancement of agricultural technology, cooperation and innovation that is
allocated to India
• Creation of an information base of BRICS countries that is allocated to China

BRICS: South Africa’s Way Ahead?
| viii
In 2012, at the annual conference of the Agricultural Economics Association of South Africa,
the National Agricultural Marketing Council (NAMC) co-hosted a workshop aimed at
establishing a dialogue on how agriculture can benefit from South Africa’s membership of the
BRICS. It came out clearly from the workshop that agriculture needs to be better positioned to
benefit from the BRICS formation. One important issue that was noted was that market access
for South African agricultural produce into the BRICS countries could be improved. In this
regard, an honest question was raised whether, as the country’s agriculture stakeholders, we
fold our arms and do nothing since this this is a political formation (while market access is an
economic issue), or whether we use this political formation to address our socioeconomic
issues as they relate to these countries. Market access is one of the issues of interest to South
Africa’s agriculture industry within the BRICS formation, together with issues such as the
diffusion of technologies and collaborations.
The research that is presented in this book addresses a range of important issues related to the
trade and investment relations among these countries. The performance of their agricultural
sectors as well as trade amongst these countries is also examined. There is also focus on the
relationship between BRICS and Africa, and what this means for South Africa’s trade
relations with other African countries.
Ronald Ramabulana
Chief Executive Officer, National Agricultural Marketing Council
March 2013

Chapter 1
BRICS – South Africa’s way ahead?
Summary
Ron Sandrey
In cooperation with the National Agricultural Marketing Council (NAMC), tralac has
prepared this book to examine the South African involvement with the so-called ‘BRICs’ of
Brazil, Russia, India and China. The emphasis is on agriculture, but in some chapters the
scope has been widened to become more comprehensive. This summary will sequentially
report on the chapters in this publication and endeavour to give a stand-alone presentation that
leaves much of the detail in the respective chapters. We note at the start that the nomenclature
surrounding the BRICs can get confusing with South Africa now a member, so we use the
term ‘BRICs’ to refer to the original configuration and the term ‘BRICS’ to refer to the new
configuration that includes the extra ‘S’ for South Africa.
The book starts with three background chapters. The first of these examines the trade and
economic profile of the BRICs and examines how South Africa measures up to the BRICs in
this respect. It concludes that in many ways it does not measure up, but then perhaps neither
Brazil nor Russia measure up to the standards set by China and to a lesser degree India in
recent times. The second of these scene-setting chapters examines how the BRIC growth is
impacting upon Africa, and in particular how the demand for raw materials from especially
China and India is generating valuable new trade and investment opportunities for Africa. Can
this be regarded as a new scramble for Africa in a post-colonial era? The third chapter follows
on from this to look at South Africa’s foreign investment profile (both liabilities for foreign
investment in South Africa and assets for the converse of South African investments in
foreign countries). Recent data confirms that Europe was the main destination for assets and
2 BRICS – South Africa’s Way Ahead? Summary
BRICS: South Africa's Way Ahead?
© 2013 Trade Law Centre, National Agricultural Marketing Council, Royal Danish Embassy, Swedish Embassy Nairobi.
the main source for Liabilities, and that is followed by the Americas for both. Both Africa and
Asia are more important as an investment destination than an investment source, with China
becoming an important destination for South African foreign investments.
This section is followed by three chapters focussing on trade and trade-related issues. The first
of these looks at Chinese manufacturing exports to Africa and how these exports are
squeezing South Africa’s manufacturing sector in three ways. These are firstly by direct
competition in South Africa, secondly by vigorous competition in South Africa’s ‘home
market’ of Africa, and thirdly by restricting South Africa’s ability to compete in the US
market outside of auto products. The second of these chapters examines BRIC agricultural
exports to Africa to assess how they are competing against South Africa’s exports to Africa.
South Africa has been losing market share to the original BRIC members in virtually all
African markets except Zimbabwe, and in all products except fats and oils. Brazil is the
biggest overall threat to South Africa, but China and India are competing strongly in different
markets and products. Importantly, Brazil, China and India are all becoming increasingly
competitive in most of the value-added processed food products. Finally, we look at the
mirror image of South African agricultural exports to the BRICs. These exports are modest,
and in recent years they have been around a slowly increasing rate of 6% of the total
agricultural exports. China is the main BRIC destination, followed by Russia, India and then a
distant Brazil. These markets are not very important but they are growing much faster than the
traditional markets and often where their export values are high market share analysis show
them to be more important to South Africa than just the raw data would indicate.
Next are two chapters that examine the agricultural profile and performance of firstly Brazil
and then Russia, India and China. In Brazil we find that dramatic growth in agricultural
production and exports in recent years has been fuelled by two major factors. The first is the
policy environment of both the whole economy and the agriculture sector as Brazil underwent
major changes in the late 1980s to early 1990s that enabled agriculture to flourish. The second
was the major investment in Research and Development that turned the Brazilian Savannah
from extensive cattle grazing to highly productive crop lands. A background on agriculture in
Russia, India and China is given in the next chapter. It starts with a comparative description of
the agricultural sectors in these three countries before discussing their production and trade
and concluding with perspectives on their agricultural policies. Agriculture is very important
to both India and China, while Russia is still recovering from the turmoil of the 1990s. Both
Russia and India would seem to offer few lessons for Africa, but certainly Chinese agriculture
BRICS – South Africa’s Way Ahead? Summary 3
BRICS: South Africa's Way Ahead?
© 2013 Trade Law Centre, National Agricultural Marketing Council, Royal Danish Embassy, Swedish Embassy Nairobi.
can. Their dramatic increase in production started from an enabling macroeconomic and
policy environment and was fuelled by an impressive R&D programme that focused on new
plant varieties and the associated inputs to support their improved performance.
This is followed by two chapters relating to agricultural trade policy in South Africa. The first
looks at agricultural imports by sources and growth rates to set the scene. It then goes on to
examine the import tariff regime and analyse how the WTO and trade preferences severely
restrict the ability of South Africa to increase agricultural tariffs. The second examines the
traditional trade remedies of anti-dumping measures, countervailing duties and safeguards,
and how these legal instruments are used by BRICS countries to protect their domestic
industries against foreign imports.
The final three chapters do not follow a related theme between them. The first chapter looks at
total factor productivity (TFP) in South African agriculture and examines the question: ‘What
would the impacts of raising the relatively low TFP in South African agriculture to nearer that
of China and India in particular be?’ The results from the agriculture-only computer
simulations indicate that the whole economy stands to benefit as incomes will increase from
increases to factor endowment, allocative efficiency, increased technical change, and other
effects. Overall, while the increase in South Africa’s agriculture TFP will have positive but
minimal changes to the whole economy, there are profound positive changes to the
agricultural sector.
The second of this final suite of chapters looks forward from the BRICs ‘into the MIST’ for
the next grouping of emerging global economies that are likely to become increasingly
influential in the future. The ‘MIST’ is Mexico, Indonesia, South Korea and Turkey, and their
trading and agricultural profiles are examined along with how they link with South Africa.
Finally, recognising the close linkages between South Africa and the fellow SACU BLNS
countries of Botswana, Lesotho, Namibia and Swaziland, the last chapter examines their often
meagre direct trading relationships with the BRICs and puts that in perspective alongside their
general reliance on the EU and to a lesser extent the US as their export markets.
Chapter 2: South Africa’s way ahead: are we a BRIC?
This scene-setting chapter details the background to South Africa’s invitation to join the
BRIC nations of Brazil, Russia, India and China. On the face of it this is indeed an honor, and

4 BRICS – South Africa’s Way Ahead? Summary
BRICS: South Africa's Way Ahead?
© 2013 Trade Law Centre, National Agricultural Marketing Council, Royal Danish Embassy, Swedish Embassy Nairobi.
it supports the case made by many that South Africa is one of the emerging countries of the
future. But does South Africa match up to Brazil, Russia, India and China in economic and
trade performance or is it trying to crash the party as an imposter? Is the recent GDP growth
and trade performance worthy of being at the party? What has the relative performance of
South Africa in recent times been and how does that performance rate vis-à-vis the BRICs
measure up? An emphasis has been placed upon GDP growth and trade, as it is these criteria
that are generally associated with the BRICs.
We find the first point is that South Africa has a significantly smaller economy than the
BRICs, with a GDP around one quarter of the Indian and Russian economies, and its
population of around 50 million is approximately one quarter to one third of Brazil’s and
Russia’s, respectively, but well behind the billion plus in both China and India. It does,
however, sit comfortably in the upper-middle of the GDP per head statistics by both
conventional and purchasing power parity measures. The real Achilles heel for South Africa
is the very high unemployment rate. Merchandise trade as a percentage of GDP, an indication
of openness in an economy, is actually the highest in the group.
Contrary to general perceptions, the BRICs have not had uniformly spectacular GDP growth
in recent years. Since 1980, Chinese and Indian growth (along with Botswana’s) is in the top
four globally, but both Brazil and South Africa, with almost identical growth paths since
1992, have been just above the bottom third of the roughly comparable global economies.
Russia spent the early years of this century rebuilding the extreme hit it took in the 1990s.
GDP growth is clearly neither a necessary nor sufficient condition for BRIC membership
despite the popular myth.
By any imaginable measure, China’s export performance since 1980 has been remarkable and
significantly better than the other countries studied. Over this same period, India has roughly
tripled its global export share while Brazil has regained the levels it had in the 1980s.
South Africa has steadily and consistently lost global share, while Russia has done very well
since 1999. The EU is the major export destination for all five countries except for China
where the US is marginally ahead. Similarly, the EU is the major source of imports for the
most recent trade data, although the fastest growing source of imports is invariably China.
There are few discernable patterns in the merchandise profile of intra-BRIC/South African
imports other than perhaps iron and steel products, fuel and ores. Surprisingly, levels of intra-
BRIC/South African trade are very low for exports from each member to the other four but

BRICS – South Africa’s Way Ahead? Summary 5
BRICS: South Africa's Way Ahead?
© 2013 Trade Law Centre, National Agricultural Marketing Council, Royal Danish Embassy, Swedish Embassy Nairobi.
are higher for imports, as universally the percentage of imports from China is between 11.2
and 17.9 percent1, which raises the average for the other BRICs/South Africa.
We can make the generalizations from the study that South Africa does not ‘measure up’ in
terms of economic size, but fits the middle patterns of GDP growth in recent years where the
perceived concept of the BRICs’ dynamic GDP growth is biased by the spectacular growth of
China and India. South Africa also does not ‘measure up’ in terms of trade levels and its
performance has been below that of the other members. Overall, the BRIC ‘club’ is not one
where South Africa belongs as of right given the measures we have assessed membership
against. But then measuring up to the economic performance of both China and India in
recent years is a big ask, albeit one that Brazil has come close to.
Chapter 3: The BRICs and Africa: the bigger picture
In the next chapter we examine how, since the beginning of the new millennium, we are
increasingly noticing the influence of the BRICs on the structure of the world economy. Their
role in the global arena, from an economic and political perspective, has raised concern in the
developed world about the manner in which their influence is shaping or shifting the balance
of power. Concerns about the impact on the environment and governance issues have also
been raised. However, in Africa, the role of some of these countries under the auspices of the
so-called South-South alliances can be viewed as an opportunity to enhance cooperation with
other developing countries, playing a significant role in the economic and social development
of the region.
Poverty, poor infrastructure, lack of productive capacity and transfer of technology, the
emerging threats associated with climate change as well as the food, energy, financial and
economic crises have been identified as areas where Africa can enhance its capacity by
cooperating with other developing countries. Furthermore, the increased bargaining power of
developing countries in multilateral negotiations, as reflected in the current Doha negotiations
of the World Trade Organisation (WTO), has been cited as another reason for cooperation. It
is against this background that since 2000, African countries have entered into new
partnerships and arrangements with the South, increasingly driven by economics rather than
politics. The new partnerships are often based on formal frameworks with dialogue forums
and action plans.
1 2010 data
6 BRICS – South Africa’s Way Ahead? Summary
BRICS: South Africa's Way Ahead?
© 2013 Trade Law Centre, National Agricultural Marketing Council, Royal Danish Embassy, Swedish Embassy Nairobi.
The agenda behind the renewed and increased global economic interest in Africa, a continent
that was once dubbed ‘hopeless’, should be considered. In historical representations, Africa
has been regarded as underdeveloped and poor, but of late Africa has been regarded as a
continent brimming with potential and opportunities. The need of boom economies, like
China and India, for raw materials is generating valuable new opportunities. Can this be
regarded as a new scramble for Africa in a post-colonial era? Concern should be raised if this
increased interest goes unchecked, as this could be no different from the way in which Africa
was previously colonised for the sake of its resources.
This argument is certainly plausible if one looks at the majority of investments in Africa from
the so-called emerging markets. These are concentrated in the traditional resource-rich
primary sectors. The difference, however, is that this renewed economic interest in Africa is
enabling African countries to add terms and conditions into the mix, such as concessions
attached to infrastructure development projects. Furthermore, this renewed interest in Africa
has provided a front line for competition between the traditional investors – the United States
of America (US) and the European Union (EU) on the one hand, and other emerging players,
such as the BRICs and South Africa on the other.
Africa’s cooperation with especially the emerging markets such as the BRICs and South
Africa offers new options that can be turned into opportunities. These opportunities are not
automatic and African countries need to create an environment conducive for tapping into the
benefits that accrue. A proactive approach that allows for the development of cooperation
strategies that are in line with national and regional development goals is needed.
The chapter provides a summary of the key factors in the involvement of the BRICS and
Japan with Africa. Highlights of the analysis include:
• The BRICS have made significant policy reforms over the past five decades in their trade
policies, and moving from inward-looking protectionist policies to outward-looking
market oriented policies has been one of the strongest factors behind them becoming new
major global economies. Japan, on the other hand, has also maintained its outward-
looking policies with the objective of ensuring its competitive edge in high-value
manufactured products.
• Developing economies featured strongly in 2010 both as recipients of Foreign Direct
Investment (FDI) and as outward investors; they absorbed more than half of global FDI

BRICS – South Africa’s Way Ahead? Summary 7
BRICS: South Africa's Way Ahead?
© 2013 Trade Law Centre, National Agricultural Marketing Council, Royal Danish Embassy, Swedish Embassy Nairobi.
inflows and accounted for 29% of global FDI outflows. Africa is now both a new frontier
of economic and other opportunities and host to some of the fastest-growing economies
in the world as the Real Gross Domestic Product of Africa increased by 5.2% annually in
the past decade, compared with 2.3% in the 1990s (WEF, 2011). Investments in Africa
are diversified, albeit still concentrated in infrastructure and commodities, but we
currently see an increase in investment in services. Sectors receiving special investment
attention include telecoms (towers, broadband services), financial services (commercial
banks, insurance, ancillary services such as ATMs), agribusiness, infrastructure, oil and
gas (marginal fields, oil field services, gas development), mining, and electric power
(energy infrastructure, energy services). Similarly, intraregional FDI in Africa is
increasing as the share of African host countries in the outward stock of South African
FDI has increased from less than 5% before 2000 to 22% in 2008, reaching almost
US$11 billion.
• Individually, the BRIC countries’ trade growth with Africa has outpaced global trade and
BRICS’ trade with the rest of the world (UNCTAD, 2012). India and China’s trade with
Africa as a proportion of GDP in 2012 was 1.4% and 1.6% respectively, while Brazil’s
stands at 1.2% and Russia’s at 0.3% (CIA Factbook, 2012; World Trade Atlas, 2013).
South Africa has the highest trade with Africa with its proportion of GDP estimated at
about 4% for 2011. China – the largest trading partner with Africa – has increased trade
with Africa from US$3.5 billion in 1990 to over US$198 billion in 2012, which equates
to roughly 61% of Africa’s total BRICS trade (World Trade Atlas, 2013). Given Russia’s
significant natural resource reserves and South Africa’s economic dominance in the
region, the two are the only BRICS countries with an overall trade surplus with Africa.
Main products from BRICS to Africa feature diversified value-added products while
exports from Africa to BRICS are mainly resource-based primary products with little or
no value addition.
• Meanwhile, African countries continue to liberalise their investment environments. In the
past few decades, Africa has made significant strides toward democratic governance,
transparent economic systems, and the elimination of some of the crippling bureaucratic
barriers to trade and investment. Recognising that an investor-friendly admission phase
has a beneficial effect on the subsequent relationship between host and investor, a
number of countries have reformed their admission procedures by introducing one-stop
shops. Similarly a number of African countries have reformed their tax systems, often
8 BRICS – South Africa’s Way Ahead? Summary
BRICS: South Africa's Way Ahead?
© 2013 Trade Law Centre, National Agricultural Marketing Council, Royal Danish Embassy, Swedish Embassy Nairobi.
reducing corporate income taxes, while other governments have acted to remove some of
the key constraints to attracting and benefiting from FDI.
So what does this mean for Africa?
The important question is: “What can African firms do to compete with the emerging giants
of Asia and/or the Americas?” Can the solutions be found through infrastructural
development, export incentives promoting, technology development and/or transfer, or is it
simply through simple free market competition?
The success stories of Asian economies span five decades, with China following suit as the
new emerging economy and potential market. This also begs the question, “What can Africa
learn from these stories?”
Given the trend towards liberalised trade within a rules-based system, African firms can no
longer call on Government to impose protectionist measures. Only in a few instances will this
be legally possible and economically appropriate. Indeed, narrow firm and sector interests
must be weighed against wider interests that are usually not expressed as vocally.
Long-term careful and innovative strategic planning with clear objectives is therefore required
to succeed in this new trading environment. This is also important for African firms
competing with imports from countries such as China as well as competing against China in
the rest of the world.
China, India and Brazil, amongst others, have indicated their willingness to enhance
technology transfer and investment cooperation with African countries. Such collaboration is
imperative in the development of strategic and important sectors for Africa such as
agriculture, mining and medical industries.
There nevertheless remain many challenges for African firms in exploiting these
opportunities. These include extending beyond Africa’s current advantage in primary and
resource-based goods to include competitively manufactured products. In the long-run,
African firms should thus seek out value-adding opportunities.
In light of this, these challenges and opportunities should be addressed with the recognition
that Government cannot protect uncompetitive firms. There are, however, policy options for

BRICS – South Africa’s Way Ahead? Summary 9
BRICS: South Africa's Way Ahead?
© 2013 Trade Law Centre, National Agricultural Marketing Council, Royal Danish Embassy, Swedish Embassy Nairobi.
providing a more business-friendly working environment through wider infrastructure
development available to Governments.
Chapter 4: Foreign Direct Investment in South Africa: the BRIC perspective
The next chapter follows on by presenting a recent review of investment for South Africa,
both in inflows (liabilities) and outflows (assets), with a concentration of the role of the BRIC
countries in these flows. It starts by recognising that investment is the fuel of economic
growth, and in a closed economy, domestic savings are the only source of investment.
However, in an open economy, these domestic savings may be augmented by borrowing from
abroad (the savings of others).
As a starting point, there are three categories of investment recorded by the South African
Reserve Bank. These are:
Foreign direct investment (FDI), as defined by the net inflow of investment to acquire a
lasting management interest (10 percent or more of voting stock) in an enterprise
operating in an economy other than that of the investor. It is the sum of equity capital,
reinvestment of earnings, other long-term capital, and short-term capital as shown in a
country’s balance of payments.
FDI is distinct from portfolio investment, which is considered to be the purchase of
stocks, bonds, and money market instruments by foreigners for the purpose of realising a
financial return, which does not result in foreign management, ownership, or legal control.
In general terms, any foreign investment that is not direct or portfolio investment is
considered “Other investment” (loans, trade finance, currency and deposits, and other
assets with unaffiliated parties), and in contrast to FDI, both foreign portfolio and “other
investments” have no controlling interest in their investment.
Our analysis found that South Africa has somewhat less of a call on funds held offshore
(assets) than others have on their funds held in South Africa for each of the three years from
2008 to 2010 examined. Based on 2010 data, Europe was the main destination for assets
(59.8%) and the main source for liabilities (63.3%), followed by the Americas for both. Both
Africa and Asia are more important as an investment destination than an investment source.
Changes over the period show that Asia had the biggest increase in assets by percentage, but
Europe had the largest increase by value. For liabilities or inbound investment, Europe was

10 BRICS – South Africa’s Way Ahead? Summary
BRICS: South Africa's Way Ahead?
© 2013 Trade Law Centre, National Agricultural Marketing Council, Royal Danish Embassy, Swedish Embassy Nairobi.
again displayed the largest increase but in percentage terms Europe, Americas and Asia were
very similar. In 2010 most of the total South African assets (43%) were held in portfolio
assets abroad, followed almost equally by direct and other investments. By region, most of the
2010 portfolio is held in Europe (77%) while in Africa, Asia, the Middle East and Oceania it
is predominantly direct.
The comparable picture for liabilities (investments held in South Africa by others) shows that
overall more was held in portfolio than direct for each year. European and Asian money in
South Africa is held more in direct (54% and 69% respectively), while the American money
(85%) is concentrated in portfolio investments.
Examining the BRIC countries we find that China was the fourth most significant destination
for South African assets held abroad, with most of these assets being direct investments
associated with banks. A very similar position is found for Chinese investments in South
Africa (ranked at number 9 in 2010), where the majority are direct investments associated
with banks. South African investments in Brazil are predominantly portfolio investments
associated with banks, while in India they are more associated with ‘other’ and banks.
Chapter 5: Chinese domination of the African industrial goods market
While a succession of Asian countries have exhibited dramatic growth over the last 30 to 50
years, Africa has largely stagnated. This Asian expansion has been driven by manufacturing
exports to the United States (US) in particular, and has been enabled through an overall
constructive policy package that opened markets, implemented favourable trade and exchange
rate policies, and provided a sound and stable government that inspired investment and
secured property rights. Conversely, Africa has been unable to put the full package in place,
and this has resulted in a manufacturing sector whose contribution to both GDP and export
shares is significantly below the continent’s developing-country peers. Growth in natural
resource-rich developing countries in general has lagged behind those with a manufacturing
focus, and this is especially the case in Africa with its poor linkages to unskilled labour and its
appetite for rent-seeking activities. Africa’s industrial base is not as robust as theory suggests
it should be. Except for South Africa, manufacturing exports are notably absent, with only
textiles and clothing featuring in those countries where manufacturing also features.
Importantly, Africa has failed to capitalise on its significant tariff preferences into the US.

BRICS – South Africa’s Way Ahead? Summary 11
BRICS: South Africa's Way Ahead?
© 2013 Trade Law Centre, National Agricultural Marketing Council, Royal Danish Embassy, Swedish Embassy Nairobi.
South Africa, with its undoubted industrial capacity, should have some advantage in its own
‘backyard’ of the African continent. The objective of this chapter is to assess the recent export
performance of South African industrial goods to the African market against the rise of China
in particular in that same market. This is done by analysing the World Trade Atlas data for
both South Africa and China over the period, both at the aggregate level to assess the big
picture, and at the more detailed levels to examine the niche markets where South Africa may
be outperforming China, or, in a more pessimistic scenario, to examine where South Africa is
at least doing comparatively better. All data is sourced from the Global Trade Atlas for
exports from the respective BRIC countries and South Africa, with the data standardised by
netting out BRIC exports to SACU to give a consistent base of non-SACU Africa.
While there is a possibility that a third party may be doing even better than China, we
consider that given China’s global dominance, assessing South Africa against the Chinese
benchmark provides an adequate analysis of South Africa’s industrial performance in Africa.
We do, however, introduce manufacturing exports to Africa from the other BRIC economies
of Brazil, Russia and India. Indian growth of manufactured exports to the world in recent
years is greater than that of China’s, and marginally below China’s growth to Africa. Exports
to the world are very similar for both Brazil and Russia, with both around 50 percent above
South Africa’s, while their growth to the world is similar for all three countries. China clearly
dominates exports to Africa, followed by India and then South Africa, with modest exports
from Brazil and especially Russia. As expected, South Africa has the largest share of its
manufacturing exports destined for Africa, with Russia the lowest.
In recent years, at the detailed level, the main exports from South Africa have been vehicles
for the transportation of goods (trucks and vans), where South Africa dominates the market.
Next is the export of passenger vehicles, and here both China and India are making inroads. In
some other lines South Africa is the dominant trader, but in every instance China is gaining
export share.
To get a global picture of manufacturing exports2 we examined the Global Trade Analysis
Project (GTAP) database. During the period 2000/2001, Chinese exports were 6.8% of the
total global exports to the world, 5.3% of the global exports going to Africa (including
South Africa), and the same 5.3% of the global exports destined for South Africa. By the
2008/2009 period, China held 13.4% of the global manufacturing exports, 15.4% of the
2 Albeit with a slightly different definition of ‘Manufacturing’.

12 BRICS – South Africa’s Way Ahead? Summary
BRICS: South Africa's Way Ahead?
© 2013 Trade Law Centre, National Agricultural Marketing Council, Royal Danish Embassy, Swedish Embassy Nairobi.
exports to Africa, and 16.3% of the exports to South Africa. Global exports as a percentage
share had almost doubled, while those to Africa in total had almost tripled! Similarly, over the
same period, South Africa’s relative share of global exports has increased from 0.36% to
0.39%, but the share to Africa has declined from 5.17% to 3.63%. Meanwhile, India’s share to
the world, Africa and South Africa all roughly doubled over the same period.
The key policy issue here is that Chinese dominance of the African market makes it difficult
for Africa to develop an industrial base. Firstly, China is making serious inroads into
South Africa itself; secondly, it is making it extremely difficult to exploit the ‘home’ markets
in Africa; and finally, it is also making it difficult to develop exports outside of South Africa’s
high-tech auto sector to the US, the traditional developing country manufacturing export
market.
Chapter 6: The BRICs and agricultural exports to Africa: are they a threat to
South African interests?
Since South Africa has become a member of the BRICS there has been considerable interest
in South Africa’s performance relative to the earlier members. The original BRIC countries
have become increasingly powerful global exporters of agricultural products; Brazil (3rd in the
world when the EU is regarded as a single entity) is the largest agricultural exporter among
the group, followed by China (5th), India (12th), Russia (21st) and South Africa (28th) in 2009.
Crucially, this growth is especially apparent in BRIC exports to Africa. South Africa’s
agricultural exports into the rest of Africa have been growing rapidly, and South Africa
regards the African market as strategically important. The objective for this chapter is to
examine the performance of these BRIC exports to Africa, and in particular how they may be
threatening South Africa’s agricultural interests in the continent. This is done by assessing
export data from the BRICs and South Africa to the continent from 1997 to 2011 inclusively,
using data from the Global Trade Atlas and the Global Trade Analysis Project (GTAP)
databases.
Overall our analysis shows that South Africa has been losing market share vis-à-vis the
original BRIC members in virtually all African markets except Zimbabwe in recent years, and
in all products except fats and oils. While Brazil is the biggest overall threat to South Africa,
China and India are competing strongly in different markets and products. Russian grain
exports are not really in competition with South Africa. Crucially, when the BRIC

BRICS – South Africa’s Way Ahead? Summary 13
BRICS: South Africa's Way Ahead?
© 2013 Trade Law Centre, National Agricultural Marketing Council, Royal Danish Embassy, Swedish Embassy Nairobi.
competition in the important processed food products is examined, Brazil, China and India are
all becoming increasingly competitive in most of these value-added products. Overall, there
are few bright spots in South Africa’s recent agricultural export performance on the continent.
The main conclusions that are drawn from the detailed analysis are:
1. BRICS agricultural exports to the rest of the world are increasing rapidly. In 2008/09,
the BRICS exported 11.5% of global agricultural exports, 14.6% of global exports to
Africa, and 18.1% of global exports to South Africa, up from 9.5%, 8.2% and 9.0% in
2000/01 respectively.
2. In 2011, South Africa (27.2%) and Russia (24.1%) had the highest proportionate
shares of their total agricultural exports going to Africa, followed by Brazil (10.3%),
India (9.2%) and China (4.4%). Nevertheless, Brazil was responsible for 48% of
BRICS agricultural exports into Africa, and South Africa for only 11.3% in 2011.
3. The agricultural exports of the BRICS countries are also concentrated by destination:
22% went to Egypt in 2011, with 54% going to the largest five destinations (Egypt,
Algeria, Nigeria, South Africa and Angola).
4. South Africa dominates agricultural exports into Zimbabwe, followed by
Mozambique, Angola and Kenya, but has no presence in North Africa. Russia has a
strong presence in Egypt, Tunisia and Kenya, while India dominates in Sudan and has
a strong share in both Ghana and Kenya. Brazil dominates across the continent, except
in Zimbabwe, Mozambique, Kenya and Sudan. South Africa is losing market share in
all markets excepting Zimbabwe, although the losses have generally been very small
over the past decade.
5. Sugar, cereals and meat made up almost two thirds of the BRICS countries’
agricultural exports into Africa in 2011. These three commodities were 86% of
Brazil’s exports to the continent, 89% of Russia’s and 67% of India’s, but only 6% of
China’s and 16% of South Africa’s. Brazil, India and China gained market share over
the BRICS total for the period 2000-2011 for the top 15 export commodities, while
Russia and South Africa lost. Russia dominates wheat exports and Brazil the exports
of meat.

14 BRICS – South Africa’s Way Ahead? Summary
BRICS: South Africa's Way Ahead?
© 2013 Trade Law Centre, National Agricultural Marketing Council, Royal Danish Embassy, Swedish Embassy Nairobi.
6. South Africa’s export portfolio into Africa is very diverse, with sugar, maize, and food
preparations all taking a turn as the largest over the past decade. The fastest growing
exports into Africa are wine and apples.
7. Some 16.5% of South Africa’s agricultural imports originate from the BRIC countries,
up from 7.5% a decade ago. These imports have increased more rapidly than imports
from the EU and from Argentina, South Africa’s biggest source of imports. Rice has
traditionally been the largest import, but was overtaken by wheat in 2011. When the
oilseeds and oilcake are combined, these make up the largest import category.
8. South Africa’s agricultural exports have tripled since the average for the period 1996-
2000, but have increased fourfold to China and Russia (agricultural exports to Brazil
and India are negligible). Nevertheless, these exports still constitute only 5.3% of
South Africa’s agricultural exports to the 20 biggest destinations, smaller than exports
to Zimbabwe which have grown almost eight-fold since the average for 1996-2000.
9. South Africa’s exports of processed agricultural products into Africa can be divided
into three categories: a) where South Africa faces no competition from the BRIC
countries (products such as citrus fruit, soups etc., beer, wine and fermented
beverages, making up some 21% of these exports); b) where there is emerging
competition that is potentially threatening (e.g., grapes and apples from China,
prepared cereals from China and India, waters from Brazil and China, making up 19%
of the exports); and c) where there is already serious competition that has grown
dramatically in recent years (including malt extracts, bread and similar products,
processed vegetables from China, fruit juices from both China and a lesser extent
Brazil, sauces from China, food preparations not elsewhere specified (nes), ethyl
alcohol from Brazil and India, animal feeds from the three BRICs, and cigarettes and
tobacco).
Updated data shows that global agricultural exports from Brazil declined by 33% during
2012, with sugar and soybeans showing massive declines while maize exports doubled.
Brazilian agricultural exports to Africa declined by a slightly greater 37%, and those to SACU
by a lesser 23%.

BRICS – South Africa’s Way Ahead? Summary 15
BRICS: South Africa's Way Ahead?
© 2013 Trade Law Centre, National Agricultural Marketing Council, Royal Danish Embassy, Swedish Embassy Nairobi.
Chapter 7: South African agricultural export prospects to the BRICs
The objective of this chapter is to examine the current South African agricultural export trade
profile to the BRIC countries and to explore potential future prospects for the expansion of
this trade. We again use the Global Trade Atlas data for all direct trade flows between South
Africa and the BRICs, or, more correctly, perhaps between the BRICS as South Africa is now
a member of the BRIC configuration. The data is expressed in US dollar (million) values, and
the World Trade Organisation (WTO) definition of agriculture is used for compiling the data.
We will start by showing the extant exports from South Africa to the BRICs and follow this
up with an analysis of the relative importance of South African trade to the BRICs, and
complete the chapter with a presentation of the tariff barriers and non-tariff measures that may
be inhibiting this trade.
In summary, South Africa’s agricultural exports to the BRIC countries are modest, and in
recent years they have been around a slowly increasing 6% of the total agricultural exports.
China is the main BRIC destination, followed by Russia, India and then a distant Brazil.
BRIC total as a percentage of South African exports has ranged from a low of 1.29% in 2000
to a 2010 high of 6.15%. South Africa’s global agricultural exports increase by 2011 was
3.22 times the 2000 values, while the BRIC countries of China, Russia and India were well
above that increase and only Brazil significantly below the average. Therefore, these markets
are not very important but they are growing much faster than the traditional markets.
Importantly, when the trade data is examined by the percentage of the particular HS 6 line that
has gone to the BRICs over the entire period, we find that where the export values are high,
they are more important to South Africa than just the raw data would indicate.
China and Russia were each the destination of around $200 million during 2011, with India
taking some $43 million and Brazil an insignificant $12 million. Wool, oranges, and sugar
have been the main exports, with other fruit to Russia and wine in general also important.
From a BRIC perspective, South Africa is a minor source of agricultural imports, and in no
instance has South Africa supplied even as much as 1% of the total: in most cases well below
this.
Tariffs do not seem to be a major problem, although there are some instances, such as
New Zealand’s duty-free access for wool into China rather than the reported 38% general
duty, where they are a barrier. In recent years, wool has consistently been over half of exports
16 BRICS – South Africa’s Way Ahead? Summary
BRICS: South Africa's Way Ahead?
© 2013 Trade Law Centre, National Agricultural Marketing Council, Royal Danish Embassy, Swedish Embassy Nairobi.
to China, with wine, fish meal and sheepskins becoming increasingly important. Next in order
of importance is Russia; these exports are almost exclusively fruit products (if you classify
grape wine as a fruit product). Oranges have been the star performers, followed by increasing
exports of lemons, grapefruit, pears, grapes and mandarins. Sugar, in the lower row, has been
included because it has been important in some years. Wool almost completely dominates the
exports to India, although there is some activity in the fruit trade and sugar was important in
the early years. South African agricultural exports to Brazil are, at best, modest. There are two
lines of alcohol dominating the trade, and in the early years ethyl alcohol was important.
There are high tariffs in several of the trade lines exported to China, and in particular the 38%
on wool, a common tariff for each importer except New Zealand as New Zealand has a Free
Trade Agreement (FTA) with China. This FTA also gives New Zealand a preference on hides
and skins. Chile has a preference in grapes and tinned peaches (where South Africa has an
overwhelming market share) and Thailand in macadamia nuts. South Africa appears to have a
preference in oranges, an import where it has a significant market share.
With exports to Russia there are differences in the reported tariffs, although these are minor
except for 1) South Africa’s high tariffs on oranges, 2) the variation in pears with South
Africa being the highest, and 3) Uzbekistan’s preference in grapes and Serbia’s free entry of
apples. The latter is of special interest as South Africa faces high tariffs despite a market share
of 88%. India has low (5%) tariffs on fruit for all but high (30%) and similarly even tariffs for
all on most lines of wool. South Africa is competing well in pears on a ‘level playing field’
with the same tariff for all importers.
NTMs can be defined as all measures other than normal tariffs – which mainly include trade-
related procedures, regulations, standards, licensing systems, and even trade defence measures
such as anti-dumping duties – which have the effect of restricting trade between nations. Non-
tariff measures are a problem in these BRIC markets, but South Africa is not alone in facing
these measures. For individual countries, the WTO Trade Review Mechanism Reports
(TPRM) are valuable sources of information, especially on agricultural barriers. A
comprehensive collection of publicly available information on non-tariff measures is available
at the Trade Analysis and Information System (TRAINS) developed by the United Nations
Conference on Trade and Development (UNCTAD), where information on trade, tariffs and
NTMs by Harmonised System (HS) tariff line can be found. The chapter provides a detailed

BRICS – South Africa’s Way Ahead? Summary 17
BRICS: South Africa's Way Ahead?
© 2013 Trade Law Centre, National Agricultural Marketing Council, Royal Danish Embassy, Swedish Embassy Nairobi.
summary of NTMs facing South Africa in the BRICs, and notes that unfortunately, these
barriers seem to be increasing.
Chapter 8: The rise and rise of Brazilian agriculture: what does it mean for
South Africa?
A feature of global agricultural trade in recent years has been the export performance from
Brazil, and this chapter conducts an analysis of Brazilian production, the policies that have
driven Brazil’s performance, how this performance may impact upon South Africa in the
future, and what lessons South Africa may learn from Brazil. We clearly find that the
performance of Brazil as an exporter meets that ultimate test of international competitiveness
(and especially so when this takes place in a non-subsidised environment, as the chapter
shows). Examining this growth of the Brazilian exports relative to South Africa from 1997 to
2011 inclusive, we find that from 1997 through to 2003 the ratios tracked relatively closely
but then from 2004 Brazil significantly outstripped South Africa’s performance.
Looking at Brazilian exports as ranked on 2011 trade data, we find that: 1) the EU has
consistently been the number one destination; 2) the rapidly growing market of China was
then number two; and 3) the share of the top-10 markets declined from 74 percent in 1997
through to around 65% in the two most recent years as Brazil achieved broader export
diversification. By commodity, the top 5 exports represented 64.1% of all exports in 2011.
Soybeans, sugar, coffee, and poultry dominate the commodities, with large increases from
others such as beef, corn, and cotton. China was the number one destination for soybeans,
while sugar exports were more diversified but with Russia and China the main markets. For
coffee, the main destination was the US, while for nine of the top 11 commodities the main
destination was the EU. Importantly for South Africa, for refined cane sugar, exports for six
of the top 10 destinations were from African countries.
Beef, sugar, and soybeans have consistently been the top three products by production value,
while chickens have moved to number four as a result of the growth in recent years. They are
followed by pig meat and cow’s milk. Brazil is the number one world producer of sugar cane,
oranges and coffee; number two in beef and soybeans; number three in chicken meat and
maize; number four in cow’s milk; number five in pig meat; and number nine in rice.
Importantly, as discussed more fully in the chapter, while sugar is a significant percentage of
the output in Brazil, it is also used for ethanol fuel production.
18 BRICS – South Africa’s Way Ahead? Summary
BRICS: South Africa's Way Ahead?
© 2013 Trade Law Centre, National Agricultural Marketing Council, Royal Danish Embassy, Swedish Embassy Nairobi.
An update shows that the global agricultural exports declined by 33% during 2012, with sugar
and soybeans showing massive declines while maize exports doubled. Agricultural exports to
Africa declined by a slightly greater 37%, and those to SACU by a lesser 23%. Agricultural
exports to China declined by a massive 78%, with the 2011 top-two commodity exports of
both soybeans and sugar virtually ceasing.
To put the growth of Brazilian agriculture over the period 1985 to 2010 into perspective, we
compared the indexed growth for Brazil with selected other countries. Brazil had a
commendable performance but was marginally below that of India and particularly the
spectacular performance of China. South Africa’s performance has been just above the world
average since 2004-2006 but below the average before then. The difference between India and
China, on one hand, and Brazil on the other, is that the former boosted domestic consumption
while Brazil was able to focus on exports.
Examining policy we find two distinctive periods of Brazilian agricultural policies in recent
years. The first period through to the early 1990s was characterised by policy interventions to
promote industrialisation through an import substitution regime that resulted in both direct
and indirect taxation of the agricultural sector. This led to a chronically overvalued exchange
rate that was accentuated by direct export taxes. Agriculture remained effectively closed to
trade thanks to the set of trade policy instruments that skewed prices on import-competing
crops by direct intervention and unintended consequences. The legendary inflation of the time
created problems for the rural sector that have not yet fully dissipated. The second (and
overlapping) period, from around the very late 1980s, has seen macroeconomic stability and
most importantly a stable exchange rate, coupled with trade liberalisation and generally much
less intervention in agricultural markets. Post-2000, a devaluing local currency and higher
international prices allowed the larger commercial farmers with their technological
enhancements to significantly increase production and consequently agricultural exports.
Brazil increasingly became a major international player with much of this result credited to
enhanced productivity flowing from fresh investment in agricultural research and currency
stability in a more neutral policy environment.
The end result was that Brazil went from a regime that was detrimental to the agricultural
sector to one that is neutral to slightly supportive overall. The Producer Support Estimate
(PSE) that was used in the OECD to measure supports to agriculture is low, and Brazil is in
the group of countries of New Zealand, Australia, Chile and South Africa that provide

BRICS – South Africa’s Way Ahead? Summary 19
BRICS: South Africa's Way Ahead?
© 2013 Trade Law Centre, National Agricultural Marketing Council, Royal Danish Embassy, Swedish Embassy Nairobi.
minimal support to agriculture. Conversely, the highly protected EU agricultural market has a
much higher PSE. The salient point is that Brazilian agricultural expansion has not been
driven by direct supports.
In examining what has driven Brazilian agriculture we find that it is accepted that public
research and infrastructural policies have made a major contribution by enhancing on-farm
technical efficiency, and that furthermore, Brazil has ample capacity for further productivity
improvements. The development of the Brazilian savannah (Cerrado) into agricultural land
required a portfolio of technologies that have made the region one of the top grain and beef-
producing regions in the world. These technologies concentrated upon biological nitrogen
fixation for soybeans on poor acid soils of the Cerrado; new plant varieties and hybrids and
the use of no-tillage systems; and the integrated crop-livestock systems and the adoption of
double-cropping where possible.
A crucial question is the extent to which the expansion of Brazilian soybean and sugar
production is contributing to Amazon Basin land clearing. The answer seems to be an
unequivocal “yes and no”: no because the crop area seems to be taking over previous pastoral
land that was being used for cattle production, and yes because this in turn is pushing the
cattle ranching further north and at times into newly cleared land in or contiguous to the
Amazon forests. Meanwhile, there remain problems in agriculture such as extreme disparities
between the export-oriented large scale commercial sector to the very poor and a numerically
strong subsistence sector.
Of special interest to South Africa is the dramatic growth in the Brazilian sugar sector, and
here future growth depends on both sugar exports and domestic sales of ethanol as the
sugar/ethanol ratios of cane use have been somewhat equal in recent years. Early government
intervention was a trademark of the ethanol industry for many years, but this was phased out
after 1990. Brazil remains the lowest cost sugar producer in the world, but this cost
competitiveness has been affected by the valuation of the Brazilian real during the 2000s, and
Brazil no longer has much of an advantage.
Also, Brazil’s ability to raise more than 40 million people into middle-class income
categories, and the lowering of abject poverty levels from 23% to 8% in less than two
decades, should serve as a source of inspiration for South Africa. And looking to the next 40
years, The Economist (2010) succinctly considered that:
20 BRICS – South Africa’s Way Ahead? Summary
BRICS: South Africa's Way Ahead?
© 2013 Trade Law Centre, National Agricultural Marketing Council, Royal Danish Embassy, Swedish Embassy Nairobi.
“if you were asked to describe the sort of food producer that will matter most in the next
40 years, you would probably say something like this: one that has boosted output a lot and
looks capable of continuing to do so; one with land and water in reserve; one able to sustain
a large cattle herd (it does not necessarily have to be efficient, but capable of improvement);
one that is productive without massive state subsidies; and maybe one with lots of
savannah, since the biggest single agricultural failure in the world during past decades has
been tropical Africa, and anything that might help Africans grow more food would be
especially valuable. In other words, you would describe Brazil”.
Chapter 9: Agriculture in Russia, India and China
The aim of this chapter is to provide some background on the agricultural sectors in Russia,
India and China. It starts with a comparative description of the agricultural sectors in these
three countries from a global perspective before giving more details on agricultural
production and trade, and concluding with perspectives on their agricultural policy.
We find that the BRICS are providing a slowly increasing share of world production (42.4%
in 2010), with China the dominant producer in the group. Similarly, some BRICS sit at the
top of the table for world trade, with Brazil and China the second and third leading
agricultural exporters, respectively, and India just making the top 10. China and Russia are
both top-five importing countries. Overall, agriculture is very important to both India and
China as measured by their direct contribution to GDP, but this has been steadily declining in
the three economies examined. Meanwhile, despite recent spectacular Gross Domestic
Product (GDP) growth rates, there is a range in the Gross National Income (GNI) per capita in
the BRICS: from India’s $3,620 as the lowest to Russia’s $19,940 as the highest, with
South Africa, China and Brazil having very similar figures about half-way between India and
Russia.
Examining the individual agricultural sectors we find that since the breakup of the old Soviet
Empire in 1991, Russian agriculture has been in turmoil, with agricultural production still
lower than in 1990 even though Russia currently ranks amongst the top 12 producers globally
in all of its major commodities. Livestock production declined more than the overall sector
but cattle products (cow’s milk and beef) still dominate overall production, followed by wheat
and then chicken and pig meat. Meanwhile, grain and related crops dominate Russian exports,
with wheat increasing to be some 40% of the total while exports of commodities such as

BRICS – South Africa’s Way Ahead? Summary 21
BRICS: South Africa's Way Ahead?
© 2013 Trade Law Centre, National Agricultural Marketing Council, Royal Danish Embassy, Swedish Embassy Nairobi.
sunflowers and sunflower oil, rapeseed oil, and maize have increased from virtually zero,
emphasising the emergence of a new agricultural system in Russia. The European Union (EU)
is becoming less important as a destination as Africa (and Egypt in particular) is taking its
place, and the linkages to the old Soviet Empire remain important. Import sources are globally
widespread, with the EU remaining in the top spot. Brazil has become an active trading
partner, while Africa as an entity would be just ahead of China in fourth place. Russia remains
a net importer of agricultural goods, with exports ($9bn) barely a quarter of imports by value,
importing relatively higher value products (dairy and fresh fruit) as opposed to the grain
exports.
Aggregate agricultural production in India has increased steadily in recent years, with most of
the main products being familiar. The product rankings are consistent, reflecting a country
with centuries of established agricultural expertise. The EU is India’s major export market
(but closely matched by challenges from China, the United States (US) and Vietnam), and is
losing market share as India’s total agricultural exports have increased some fivefold in little
more than a decade. Africa as a whole would be in fourth place. Rice is both the largest
commodity produced and exported in most years, but other exports such as cotton, beef, cane
sugar, and maize are increasing. Palm oil from Indonesia and soybeans from Argentina are the
main imports.
China, home to some 1.33 billion people, is a mountainous country with high plateaus and
deserts in the west constraining arable land for permanent crops, a constraint that is
accentuated by scarce water resources. Nevertheless, China has made dramatic strides in
agricultural production in the last few decades and now produces nearly one-quarter of the
world’s agricultural output by value, with most of the main commodities produced having a
global ranking of number one or two. China’s biggest export destination is Japan, and if
Africa was a country it would be ranked fifth. Africa in aggregate would be in 11th position as
an import source while India has been the big import mover, followed by a similar growth
from Indonesia, Argentina and, at number two, Brazil.3 The composition of imports is
changing as China’s income growth has spurred changes in demand for more luxury-type
foods. This is exemplified in the imports of protein for animal feeds, as soybean products and
palm oil now constitute nearly 43% of China’s agricultural imports.
3 We note from recent 2012 Brazilian data that there has been a steep decline of almost 80% in Brazil’s agricultural exports to China – chiefly as a result of a dramatic decline in exports of soybeans and related products. This is confirmed from Chinese import data for 2012.

22 BRICS – South Africa’s Way Ahead? Summary
BRICS: South Africa's Way Ahead?
© 2013 Trade Law Centre, National Agricultural Marketing Council, Royal Danish Embassy, Swedish Embassy Nairobi.
Related to agricultural policies is the issue of farm structures. Here, Brazil, Russia and South
Africa all exhibit dualistic farm structures while in both China and India, (very) small
holdings dominate. Also interrelated with policies is the issue of technology in the agricultural
sector. Here, the performance of India’s agricultural sector has been erratic over the past
decades: output recorded a quantum leap in growth during the Green Revolution of the 1960s
to the 1980s in response to the widespread adoption of new seed and fertiliser-based
technologies, but in recent years, agricultural growth has slowed while the agricultural
population has continued to increase. In China, once the overall enabling policy framework
was in place, the agricultural expansion was driven by technology. This has been mainly new
plant varieties, augmented by the associated increases in inputs. Production rose sharply,
poverty fell dramatically, and the level and quality of food consumption improved
significantly.
Examining the general picture for support to agriculture, we find that both South Africa and
Brazil join New Zealand, Australia and Chile as the least subsidised global agricultural
producers. Support to Indian agriculture is hard to ascertain but seems to be around that of the
Organisation for Economic and Cooperation Development (OECD) average, which would put
it on a par with China but possibly just below Russia. In China, transfers to specific
commodities vary widely, while in India, the tension between the desire to raise food prices
for farmers but lower them for consumers leads to heavy intervention. In Russia, support has
increased through a tightening of border protection and an increase in budgetary transfers to
the sector.
What can Africa learn from these three BRICs? Both Russia and India would seem to offer
few lessons for Africa, but certainly the dramatic increase in Chinese agriculture can offer
more. This increase started from an enabling macroeconomic and policy environment and was
fuelled by an impressive research and development programme that focused on new plant
varieties and the associated inputs to support their improved performance. Also, although not
discussed in this chapter, China instigated an impressive extension service to deliver these
technologies to every farmer. The threat from BRIC agricultural exports to Africa is discussed
elsewhere in this book, while the increases in imports of higher-value products and wine into
Russia, India and China as the wealth of their consumers increase offers export opportunities
for South Africa.

BRICS – South Africa’s Way Ahead? Summary 23
BRICS: South Africa's Way Ahead?
© 2013 Trade Law Centre, National Agricultural Marketing Council, Royal Danish Embassy, Swedish Embassy Nairobi.
Chapter 10: South African agricultural imports and policy space
This chapter starts with an examination of South African agricultural imports, and then
assesses the degree to which South Africa has policy space to provide tariff protection against
these agricultural imports.
The EU remains the main source of agricultural imports, followed by the South American
region bloc of Brazil, Argentina, Uruguay and Paraguay (Mercosur), the 10-nation Asean
regional bloc, the four BRIC countries of Brazil, Russia, India and China (although Brazil is
listed twice here, as it is in both Mercosur and BRIC), and then the African sequence of firstly
whole of Africa, followed by the so-called East African tripartite FTA group with its
associated sub-regional SADC grouping. Argentina tops the rankings for the individual
countries, followed by Brazil and then Thailand and the United States, while SADC accounts
for most of the South African agricultural imports from the entire African continent4.
Since 2000, the EU has gained share modestly, while both Mercosur and Asean have strongly
increased. China is also growing strongly, and these general shifts in sources have been in part
at the expense of the United States. At the HS 6 line level, wheat was the main import in
2011, although in earlier years rice had been the main import and in 2010 both palm oil and
soybean cake were above wheat. These four commodities dominate the list. Palm oil, soybean
oil, and chicken cuts have been fastest growing imports in recent years.
The top import from the EU was whisky, with soybean oil increasing dramatically to
challenge that top spot while chicken cuts similarly increased from a zero base. Imports from
Mercosur show that soybean oilcake for animal feed is the number one line, followed by
wheat and then chickens and chicken cuts. Imports of the latter have increased dramatically,
while both sugar and soybean oil have grown off a zero base in the last 10 years. Asean
imports are dominated by palm oil (again for animal feed) and rice. Africa was the source of
cotton, tobacco and tea, almost exclusively from SADC.
Wheat is generally regarded as a generic international commodity and this trade has been
sourced from four main suppliers – Argentina, US, Australia and the EU – in recent years.
Imports of rice have also been sourced from a variety of countries in recent years. The EU has
virtually ceased to be a source, while Thailand has become the main supplier with India
4 Note that intra-SACU trade from Botswana, Lesotho, Namibia and Swaziland is not included in this analysis.

24 BRICS – South Africa’s Way Ahead? Summary
BRICS: South Africa's Way Ahead?
© 2013 Trade Law Centre, National Agricultural Marketing Council, Royal Danish Embassy, Swedish Embassy Nairobi.
consistently in second place. Palm oil is almost exclusively from Malaysia and Indonesia,
while until 2010 Argentina and Brazil had been virtually the exclusive suppliers of soybeans
and soybean oilcake; since then, the EU has become a major supplier of soybean oil.
Similarly, the EU and United States have a domination of the whisky market. Finally, chicken
cuts are from dramatically changing import sources, as the United States has dropped away
while imports from both the EU and Brazil have increased sharply.
In general, South African agricultural imports are often very concentrated by both product and
sources, and this has major implications for trade policy options and in particular the tariff
policy space available.
Sandrey et al. (2008) discussed how under trade liberalisation of the 1990s, South African
border tariffs were reduced and export subsidies were eliminated through unilateral reductions
that went beyond the mandatory requirements negotiated under the Agreement on
Agriculture. This was, however, somewhat balanced by the introduction of the WTO tariff
rate quota (TRQ) regimes for several countries. They went on to analyse individual
agricultural imports to assess whether the policy space exists for an option of increasing
agricultural tariffs to afford some protection to domestic producers. The critical parts of this
analysis were commitments given to multilateral trading partners through the World Trade
Organisation (WTO), and regional partners through the Trade and Development Cooperation
Agreement (TDCA) with the EU and preferences granted to SADC, along with the space that
South Africa had reserved through its WTO Bound rates. In general, policy space available to
South African agriculture was limited. The objective for the second part of this chapter is to
move on six years and re-examine the policy space issue based upon 2011 agricultural
imports.
Two aspects of the WTO are important. One is bound versus applied tariff rates, while the
other is the TRQs. Bound tariffs are those where South Africa has made a commitment to
WTO members that it will not exceed these rates, while the applied tariff is the one that is
actually ‘applied’ or levied at the border. Associated with applied rates is the MFN or most
favoured nation rates that ‘apply’ to all imports not under some special concession
preferential rates. The applied rate is usually but not always below (and in some instances
substantially below) the bound rates, thus giving ‘policy space’ where the applied rates could
be raised to the bound rates. TRQs are special access commitments where a country agrees to
imports of a commodity line that has reduced TRQ rates that are below the MFN rate, and in

BRICS – South Africa’s Way Ahead? Summary 25
BRICS: South Africa's Way Ahead?
© 2013 Trade Law Centre, National Agricultural Marketing Council, Royal Danish Embassy, Swedish Embassy Nairobi.
South Africa’s case the TRQ rate is a maximum of 20 percent of the bound rate for the agreed
quantity of imports, after which the MFN rate will apply. Complicating TRQs in
South Africa’s case is the situation where, although technically under TRQ administration,
many of the TRQ lines are operating in an environment where the restrictions operate in name
only and the applied rate is actually the TRQ rate or below and not the higher bound rate.
They still, however, present challenges for policy changes.
To put tariffs in perspective, based on the Tariff Schedule, the 2011 agricultural imports
would have attracted $309.5 million in duties, with all but $6.45 million of this from non-EU
or SADC imports. This gives an overall tariff rate of 4.89%. Thus, increasing government
revenues cannot realistically be considered a motive for such a move, leaving purely
protectionist motives and a reversion from South Africa’s liberalisation moves of the
immediate post-Apartheid period.
Examining policy space to increase border taxes, we found, firstly, that some $1,667 million
or 26.5% of the total was effectively immune from increased tariffs as at least 40%, and in
many instances 100%, of imports in the particular lines were sourced from the EU with
TDCA rates or from SADC with its associated zero duty access; and secondly, that $2,203
million or 34.8% of the total was associated with Tariff Rate Quota (TRQ) lines where
increasing applied tariffs may be complicated.
Another $863 million (13.6% of imports) were in lines where the applied rates are equal to the
bound rates at zero, while a further $72 million (1.14%) were where the applied rates were
above zero but still equal to the bound rates.
This left only $1,867 million or 29.5 percent of the imports where there was clear policy
space to increase tariffs. However, some $845 million (13.5 % of total imports) were in four
lines of animal feeds that are direct inputs into South African domestic animal or poultry
raising sectors and as such increasing tariffs would raise domestic costs, and another
$121 million are actually processed fishery products. Deleting these animal feeds and fishery
imports reduces strictly agricultural policy space to $901 or 14.3% of the total agricultural
imports. The clear-cut policy space is limited. Notably, some $245 million of these imports
are in HS 020714, frozen chickens and chicken cuts from Brazil and the EU, products that are
causing consternation in trade policy circles.

26 BRICS – South Africa’s Way Ahead? Summary
BRICS: South Africa's Way Ahead?
© 2013 Trade Law Centre, National Agricultural Marketing Council, Royal Danish Embassy, Swedish Embassy Nairobi.
Chapter 11: Trade remedies
Trade remedies are legal instruments countries use to protect their domestic industries against
foreign imports. Traditionally, trade remedies consist of anti-dumping measures,
countervailing duties, and safeguards. Over the last decades there has been a significant
change in the countries that implement and are affected by anti-dumping measures,
countervailing duties, and safeguards. Since the launch of the Uruguay Round of Multilateral
Trade Negotiations, there has also been a significant change in the number and variety of
countries using trade remedies and safeguards. Prior to the Uruguay Round the primary users
of these instruments were developed countries, however, the composition has changed
dramatically over the last decades. Since 1995, developing countries have become the main
users of both anti-dumping measures and safeguards, while developed countries have always
been the main users of countervailing duties. It also seems that developing country exports
have always been the main target of anti-dumping and countervailing investigations by all
other WTO member countries.
The BRICS countries are some of the most prominent users of trade remedies and safeguards.
Out of all the developing countries, these are also the economies most affected by anti-
dumping measures, countervailing duties and safeguards, especially exports from China. The
statistical databases of the World Trade Organisation on anti-dumping measures,
countervailing duties, and safeguards show the prominent role BRICS countries play in the
utilisation of multilateral trade remedies and safeguards:
• Between 1995 and June 2012, China was affected by 24 percent of all anti-dumping
measures implemented by other WTO members, the most measures implemented on
the exports of a WTO member over the time period.
• India not only implemented the most anti-dumping measures of all WTO members,
between 1995 and June 2012, but also the highest number of safeguards between 1996
and April 2012.
• 47 percent of all countervailing measures implemented after 1995 were on exports
from BRICS countries, mostly China and India.

BRICS – South Africa’s Way Ahead? Summary 27
BRICS: South Africa's Way Ahead?
© 2013 Trade Law Centre, National Agricultural Marketing Council, Royal Danish Embassy, Swedish Embassy Nairobi.
Chapter 12: South Africa’s economy-wide effects as a result of increased total
factor productivity (TFP) on the country’s agricultural sector: a preliminary
investigation
The world economy is expected to grow moderately over the period to 2025 with
South Africa’s real GDP growth rate average estimates of 3.5%. During the same period,
South Africa’s population growth is anticipated to average 0.5% average annually, with total
factor productivity (TFP) increases of 0.2% annually. Importantly, both China and India are
expected to have annual TFP growth rates significantly above the South African 0.2% figure,
and this chapter examines the impacts of South Africa being able to increase its TFP in
agriculture to be nearer that of the Chinese overall TFP levels. There is no doubt that
productivity has been the driving force in Brazil’s spectacular growth in recent years (see the
Brazilian agriculture chapter in this publication), while similarly the same has held for
Chinese agriculture.
Sandrey et al. (2010) found that, by keeping everything else constant and increasing TFP
across the board to 0.6 percent, the South African economy increased by an additional four
percentage points over the 2007 to 2020 time period. This led to South Africa’s aggregate
welfare being around $250 billion higher over this period than it otherwise would have been.
Most of this gain was from increased capital as investment flowed into the more efficient
South African economy, and the gains were concentrated in the manufacturing sectors –
partially at the expense of agriculture. To undertake this current analysis we use the GTAP
AEZ model and examine changes to the agricultural sector only. It is an augmented standard
GTAP model where the land account is disaggregated into 18 agro-ecological zones, enabling
substitution of crops and livestock by land type to be shown. We simulated the effects of
enhanced TFP from 0.2 to 0.6% across all agricultural (and forestry and fisheries) sectors
only.
The results from the agriculture-only simulations indicate that the whole economy stands to
benefit as incomes will increase from increases to factor endowment, allocative efficiency,
increased technical change, and other effects. The dominance of the share of output by
livestock in the agricultural sector continues through the relative share of pasture land in
South Africa. The crop area harvested will shift between agricultural commodities as relative
returns result in substitution for the fixed land supply, with wheat in particular expected to
gain. The value of output in South Africa is expected to increase even for non-agricultural

28 BRICS – South Africa’s Way Ahead? Summary
BRICS: South Africa's Way Ahead?
© 2013 Trade Law Centre, National Agricultural Marketing Council, Royal Danish Embassy, Swedish Embassy Nairobi.
products as a more efficient agricultural sector drives a wider expansion. The value of
aggregate exports in South Africa as a result of the policy changes is expected to increase
while the value of aggregate imports is expected to decrease. The South Africa position in
terms of self-sufficiency is expected to improve considerably, and even for traditionally
import-augmented products such as wheat. The chapter indicates that increased total factor
productivity in South Africa’s agriculture will have positive but minimal changes to the whole
economy but profound positive changes to the agricultural sector.
Importantly, the annual growths in both skilled and unskilled labour are, however, too small
for a country where the current level of unemployment, at around 24%, is expected to only
reduce by one percentage point over this period with enhanced TFP. That these simulated TFP
increases do not have meaningful impact on unemployment gives a clear indication that
increasing agricultural total factor productivity is only a partial answer to the country’s
unemployment challenge.
Chapter 13: South Africa’s way ahead: into the MIST?
Much interest and high expectations have been associated with South Africa’s entry into the
BRICs club of developing economies. An examination of this club and how South Africa
compares to the other members is presented in Chapter 2. In summary, although South Africa
has a significantly smaller economy, with a GDP around one quarter of the Indian and
Russian economies, and its population of around 50 million is around one quarter to one third
of Brazil’s and Russia’s respectively and well behind the billion plus in both China and India,
it does compare well in GDP per capita by both conventional and purchasing power parity
(PPP) measures. South Africa’s merchandise trade as a percentage of GDP, an indication of
openness in an economy, is the highest in the group, but the real Achilles heel for South
Africa is the very high unemployment rate. Contrary to general perceptions, the BRICs have
not had uniformly spectacular GDP growth in recent years. It seems that GDP growth is
clearly neither a necessary nor a sufficient condition for BRIC membership.
The aim of this chapter is to start from the concept of the BRICs at their birth and follow their
progress through to 2011, and to speculate through for the next few years. Has South Africa
profited from the BRIC growth? Next, we introduce the latest acronym MIST, and from there
seek in the mist and among possible ‘dark horses’ for the next BRICs. We find that the MIST
countries of Mexico, Indonesia, South Korea and Turkey are, in effect, the ‘next cabs off the
BRICS – South Africa’s Way Ahead? Summary 29
BRICS: South Africa's Way Ahead?
© 2013 Trade Law Centre, National Agricultural Marketing Council, Royal Danish Embassy, Swedish Embassy Nairobi.
rank’ as far as developing countries ranked by total GDP are concerned, with all four tightly
grouped and ranked between 14th and 18th place on the world GDP table. All four have had
consistently good GDP growth rates, and except for agricultural exports to Turkey, all four
are becoming increasingly important as South African trading partners. Overall their trade and
economic performance has not been as strong as that of the BRICs, and their trading
relationships with South Africa are generally not as strong as the BRICs, but then the Chinese
data strongly influences overall BRIC data for just about every indicator. Nonetheless,
combined with the BRICs, the MIST effectively embraces most of the so-called South-South
trade between developing countries, and especially those outside of Africa. Given the current
economic woes of the EU, South Africa’s largest trading partner, and the muted current
performance and future prospects for the US, it is inevitable that South-South trade will
become more important for South Africa.
Fellow African countries have not been included in the analysis, which has however been
extended to Argentina and Saudi Arabia as ‘countries of interest’. It behoves South Africa to
maintain an interest in these two countries as both have exhibited solid economic growth in
recent years.
Chapter 14: BLNS: the BRIC trading relationships in perspective with their
US and EU trade
In considering South Africa’s trading relationships, we must always be careful to recognise
that South Africa is one of five members of the Southern African Customs Union (SACU),
and that the interests of the other four SACU members of Botswana, Lesotho, Namibia and
Swaziland (BLNS) must be taken into account. This chapter examines the merchandise
trading relationships between the BLNS and the BRIC countries of Brazil, Russia, India and
China. It starts with an overview of the BLNS 2011 trade and then sets the BLNS
relationships with the BRICs against their trading relationships with the United States (US)
and the European Union (EU). To obtain consistent and timely data, we have used the Global
Trade Atlas (GTA) data as sourced from the BRIC country authorities and the EU, and the
AGOA trade data as sourced from the AGOA.info website for the US data rather than using
the difficult to obtain BLNS data directly. All data is expressed in US dollars.
With the BRICs, China is heavily engaged in trade with both Botswana and Namibia, while
both Lesotho and Swaziland are exporting moderate values to China. India is exporting to the
30 BRICS – South Africa’s Way Ahead? Summary
BRICS: South Africa's Way Ahead?
© 2013 Trade Law Centre, National Agricultural Marketing Council, Royal Danish Embassy, Swedish Embassy Nairobi.
four BLNS countries and importing from all excepting for the minor values from Lesotho.
Russia is only engaged in importing from Namibia and exporting small values to that country,
while Brazil is really only exporting to Namibia and importing from Swaziland. In general,
outside of South Africa, the EU is the main trading partner for all except the case of Lesotho
where almost all of the ‘external’ exports are clothing destined for the US.
We have not tried to analyse the BLNS trading relationships with South Africa, but recognise
that this relationship is crucial as (a) the imports from South Africa into the respective BLNS
countries forms the basis for their shares of the common SACU revenue pool and that this in
turn provides a significant share of their external revenues, and (b) this trading relationship
distorts and potentially underestimates the import flow from third parties such as the BRICs
as South Africa may be a transit source.
In general, the relationship with the EU dominates for exports from Botswana, Namibia and
Swaziland (i.e., imports into the EU) and imports from Namibia (EU exports). Lesotho is
heavily dependent on the US for its exports while for the other three BLNS countries, exports
to the US are the second most important behind the EU and well above any BRIC trade as
reported. Conversely, for BLNS imports (partner exports), the US features between the
second most important for Lesotho to the fourth most important for Swaziland. Botswana’s
trade with India has grown significantly, with Indian imports rising dramatically from a very
low base. India is actively exporting to all but importing virtually nothing from Lesotho as
imports from the other three countries increased from around 2005. Data for both the growth
rates and total trade between Russia and the BLNS confirms the 2011 position of imports
from Namibia being the only real engagement, while the more recent 2012 data from Brazil
confirms an engagement with exports to Namibia and some imports from Swaziland in both
2010 and 2011 as the only meaningful trade.
The individual Brazilian trade shows that sugar and sugar products feature with both
Botswana and Namibia, while the largest individual HS 6 line is the exports to Namibia of
furniture and warships. Namibia also features as having the largest bilateral trade with Russia,
as Russian imports from the BLNS (for 2011) are almost exclusively uranium imports from
Namibia – although an encouraging gradual build-up over the last few years for imports of
grapes from Namibia, and oranges and grapefruit from Swaziland, is recorded. The Indian
trade is diverse by both partner and commodity. Indian imports of diamonds, gold minerals
and wool feature, while the major Indian exports to the BLNS focus on mendicants, fabrics,

BRICS – South Africa’s Way Ahead? Summary 31
BRICS: South Africa's Way Ahead?
© 2013 Trade Law Centre, National Agricultural Marketing Council, Royal Danish Embassy, Swedish Embassy Nairobi.
wire, vehicles and motorcycles, sulphuric acid, and oil. The Chinese relationship is important
and becoming increasingly so – also, however, at the same time many of the HS lines have
been consistent in recent years. General and electrical machinery, fabrics and clothing,
television sets, and ‘special category’ are all important exports from China, while imports into
China from BLNS feature ores, diamonds, some electrical parts, wood pulp, fish meal, and
wool.
The US data again shows the BLNS trade from the partner mirror perspective and highlights
US imports of (1) the textile and clothing trade from Lesotho and to a lesser extent Swaziland
and then Botswana, and (2) the significant values of minerals and fuels from both Namibia
and Botswana in particular but also Lesotho. There is little else. Exports from the US to the
BLNS are, firstly, generally below the imports into the US values and often significantly
below them, and secondly, more diversified. The EU data is similar to the US pattern in that
exports from the EU to the BLNS are also generally below the import values and usually
significantly below them. They are, however, unlike the US in that agricultural products do
feature in EU imports although diamonds and ores dominate, excepting for Swaziland where
agriculture (sugar) dominants. Exports from the EU to the BLNS are not surprising – except
for perhaps exports of (1) diamonds to Botswana and (2) copper ores to Namibia.

32 BRICS – South Africa’s Way Ahead? Summary
BRICS: South Africa's Way Ahead?
© 2013 Trade Law Centre, National Agricultural Marketing Council, Royal Danish Embassy, Swedish Embassy Nairobi.
References
CIA. 2011. World Factbook. Brazil. Washington, D.C.: Central Intelligence Agency.
[Online]. Available: https://www.cia.gov/library/publications/the-world-factbook/geos/
br.html
Freemantle, S. and Stevens, J. 2010. BRIC and Africa: Placing the BRIC and Africa
commercial partnership in a global perspective. Standard Bank Group Economics. [Online].
Available: http://ws9.standardbank.co.za/sbrp/DocumentDownloader?docId=3276
Holslag, J. 2007. The new scramble for Africa. Europe’s World. Available:
http://www.europesworld.org/NewFrancais/Accueil/Article/tabid/190/ArticleType/articleview
/ArticleID/20430/Default.aspx
Sandrey, R., Jensen, HG. and Vink, N. (2012). South Africa – how do we become a BRIC?
Conference paper presented during the 50th
annual conference of the Agricultural Economics
of South Africa (October 2012, Bloemfontein). A revised version was published as a tralac
Working Paper S11WP142011, February 2012. Available: www.tralac.org
Sandrey, R., Mohammad, K. and Vink, N. 2008. Is there policy space to protect South
African agriculture? South African Journal of Economics, 76:1 March: 89-103
UNCTAD. 2011. World Investment Report Non-Equity Modes of International Production
and Development. Geneva: United Nations Conference on Trade and Development
(UNCTAD).
The Economist. 2010. ‘Brazilian agriculture: The miracle of the Cerrado – Brazil has
revolutionised its own farms. Can it do the same for others?’ 26 August 2010.
WEF. 2011. Africa Competitiveness Report 2011. World Economic Forum (WEF). [Online].
Available: http://www3.weforum.org/docs/WEF_GCR_Africa_Report_2011.pdf

Chapter 2
South Africa’s way ahead: are we a BRIC?
Ron Sandrey
1. Introduction and summary
South Africa recently received an invitation to join the party of the so-called BRIC nations (Brazil,
Russia, India and China). On the face of it this is indeed an honour, and it supports the case made
by many that South Africa is one of the BRIC ‘countries of the future’. But does South Africa
match up with Brazil, Russia, India and China in economic and trade performance or is it trying to
crash the party as an imposter? Is the recent Gross Domestic Product (GDP) growth and trade
performance worthy of being at the party? The objective for this chapter is to critically analyse the
relative performance of South Africa in recent times and assess that performance against that of the
BRICs to suggest a guide as to where South Africa sits vis-à-vis the BRICs. Emphasis will be
placed upon GDP growth and trade, as these criteria are generally associated with the BRICs. The
chapter updates a tralac Trade Brief of the same name published in April 2011 (Sandrey, 2011).
We find the first point is that South Africa has a significantly smaller economy than the BRICs,
with a GDP around one-quarter of the Indian and Russian economies, and its population of around
50 million is around one-quarter to one-third of Brazil’s and Russia’s, respectively, and well
behind the billion plus in both China and India. It does, however, sit comfortably in the upper-
middle of the GDP per head statistics by both conventional and purchasing power parity (PPP)
measures. But South Africa’s real Achilles heel is the very high unemployment rate. Merchandise
trade as a percentage of GDP, an indication of openness in an economy, is actually the highest in
the group.

34 South Africa’s way ahead: are we a BRIC?
BRICS: South Africa's Way Ahead?
© 2013 Trade Law Centre, National Agricultural Marketing Council, Royal Danish Embassy, Swedish Embassy Nairobi.
Contrary to general perceptions, the BRICs have not had uniformly spectacular GDP growth in
recent years. Since 1980, Chinese and Indian growth (along with Botswana’s) is in the top four
globally, but both Brazil and South Africa, with almost identical growth paths since 1992, have
been just above the bottom third of the roughly comparable global economies. Russia spent the
early years of this century rebuilding the extreme knock it took in the 1990s. GDP growth is clearly
neither a necessary nor sufficient condition for BRIC membership despite the popular myth.
By any imaginable measure, China’s export performance since 1980 has been remarkable and
significantly better than that of the other countries studied. Over this same period, India has more
or less tripled its global export share while Brazil has regained the levels it had in the 1980s. South
Africa has steadily and consistently lost global share, while Russia has done very well since 1999.
The European Union (EU) is the major export destination for all five countries except for China
where the United States (US) is marginally ahead. Similarly, the EU is the major source of imports
for the most recent trade data, although the fastest growing source of imports is invariably China.
There are few discernible patterns in the merchandise profile of intra-BRIC/South African imports
other than perhaps iron and steel products, fuel and ores. Surprisingly, levels of intra-BRIC/South
African trade are very low for exports from each member to the other four, but are higher for
imports as, universally, the percentage of imports from China of between 11.2 and 17.9%1 raises
the average for the other BRICs/South Africa.
We can make generalisations from the study that South Africa does not measure up in terms of
economic size, but fits the middle patterns of GDP growth in recent years where the perceived
concept of the BRICs’ dynamic GDP growth is biased by the spectacular growth of China and
India. South Africa also does not measure up in terms of trade levels and its performance has been
below that of the other members. Overall, the BRIC ‘club’ is not one where South Africa belongs
as of right given the measures we have assessed membership against. But then, perhaps, Russia
does not either.
2. The economic background
This background is shown in Table 1, where the first row highlights that the overall GDP of South
Africa is much lower than that of the other four countries. This is mostly a result of the smaller
population of just over 50 million, well below that of Brazil and Russia and significantly below the
billion plus people living in both India and China; nevertheless, the GDP per head in both standard
1 2010 data.
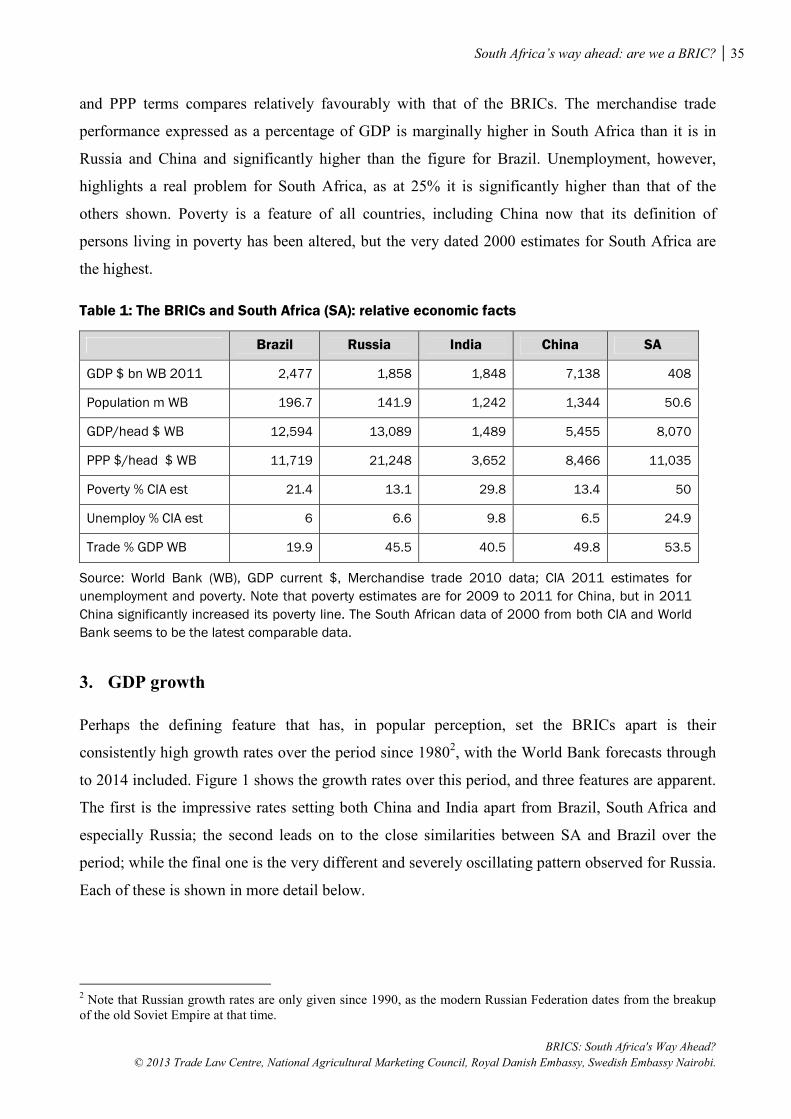
South Africa’s way ahead: are we a BRIC? 35
BRICS: South Africa's Way Ahead?
© 2013 Trade Law Centre, National Agricultural Marketing Council, Royal Danish Embassy, Swedish Embassy Nairobi.
and PPP terms compares relatively favourably with that of the BRICs. The merchandise trade
performance expressed as a percentage of GDP is marginally higher in South Africa than it is in
Russia and China and significantly higher than the figure for Brazil. Unemployment, however,
highlights a real problem for South Africa, as at 25% it is significantly higher than that of the
others shown. Poverty is a feature of all countries, including China now that its definition of
persons living in poverty has been altered, but the very dated 2000 estimates for South Africa are
the highest.
Table 1: The BRICs and South Africa (SA): relative economic facts
Brazil Russia India China SA
GDP $ bn WB 2011 2,477 1,858 1,848 7,138 408
Population m WB 196.7 141.9 1,242 1,344 50.6
GDP/head $ WB 12,594 13,089 1,489 5,455 8,070
PPP $/head $ WB 11,719 21,248 3,652 8,466 11,035
Poverty % CIA est 21.4 13.1 29.8 13.4 50
Unemploy % CIA est 6 6.6 9.8 6.5 24.9
Trade % GDP WB 19.9 45.5 40.5 49.8 53.5
Source: World Bank (WB), GDP current $, Merchandise trade 2010 data; CIA 2011 estimates for
unemployment and poverty. Note that poverty estimates are for 2009 to 2011 for China, but in 2011
China significantly increased its poverty line. The South African data of 2000 from both CIA and World
Bank seems to be the latest comparable data.
3. GDP growth
Perhaps the defining feature that has, in popular perception, set the BRICs apart is their
consistently high growth rates over the period since 19802, with the World Bank forecasts through
to 2014 included. Figure 1 shows the growth rates over this period, and three features are apparent.
The first is the impressive rates setting both China and India apart from Brazil, South Africa and
especially Russia; the second leads on to the close similarities between SA and Brazil over the
period; while the final one is the very different and severely oscillating pattern observed for Russia.
Each of these is shown in more detail below.
2 Note that Russian growth rates are only given since 1990, as the modern Russian Federation dates from the breakup of the old Soviet Empire at that time.

36 South Africa’s way ahead: are we a BRIC?
BRICS: South Africa's Way Ahead?
© 2013 Trade Law Centre, National Agricultural Marketing Council, Royal Danish Embassy, Swedish Embassy Nairobi.
Figure 1: GDP growth rates for BRICs and SA, annual %
Source: World Bank
Figure 2 highlights the first point above more forcefully – that of the very high growth rates for
both China and India, with India being more variable and almost invariably being below China.
The dramatic impacts of these high growth rates can be demonstrated by the generalisation of the
‘rule of 72’ which states that the growth rate divided by the number 72 gives a close approximation
to the time it takes to double the original number. In this case, the average known growth rates
through to 2010 were 10% and 6.1% for China and India, respectively, meaning that over the
period, the Chinese GDP is roughly 16 times that from which it started out while the Indian GDP is
about six times that of the 1980 starting figure. For Brazil and South Africa, the averages are 2.6%
and 2.8%, respectively, meaning that the economies have roughly doubled over the period.
Russia’s performance up to 2009 suggests that it would take at least 100 years to similarly double
from 1990!
Figure 3 highlights the similarities between the growth rates of Brazil and South Africa over the
period, where from 1992 they moved remarkably in tandem. This includes an almost matching
decline in 2008 and 2009, although Brazil had a good year in 2010 that was not matched by
South Africa.
-20
-15
-10
-5
0
5
10
15
20
1980 1985 1990 1995 2000 2005 2010 2014f
Brazil
China
India
Russia
RSA

South Africa’s way ahead: are we a BRIC? 37
BRICS: South Africa's Way Ahead?
© 2013 Trade Law Centre, National Agricultural Marketing Council, Royal Danish Embassy, Swedish Embassy Nairobi.
Figure 2: GDP growth % for China and India, 1980-2014 (forecasts)
Source: World Bank
Figure 3: GDP growth % for Brazil and South Africa, 1980-2014 (forecasts)
Source: World Bank
The dramatic collapse of Russia from 1990 following the breakup of the old Soviet Empire is
apparent in Figure 4, as is the consistent strong growth from 1999 through to 2008 before another
collapse in 2009.
0
2
4
6
8
10
12
14
16
China
India
-6
-4
-2
0
2
4
6
8
10
RSA
Brazil

38 South Africa’s way ahead: are we a BRIC?
BRICS: South Africa's Way Ahead?
© 2013 Trade Law Centre, National Agricultural Marketing Council, Royal Danish Embassy, Swedish Embassy Nairobi.
Figure 4: GDP growth % for Russia, 1990-2014 (forecasts)
Source: World Bank
Of the 111 countries that have a full set of World Bank GDP growth data from 1980 through to
2009, China, with an average of 10%, had the highest average growth rate over the period. India is
in number four position, and, unsurprisingly, seven of the top eight places are Asian economies
(with Singapore, Korea, Malaysia, Thailand and Indonesia as the other five Asian countries). What
is notable, however, is that the second ranked country is not Asian, but rather South Africa’s fellow
Southern African Customs Union (SACU) member Botswana. Brazil ranked in 66th position (one
place behind the US), while South Africa is in 75th position. Since the Russian Federation does not
have a full data set it is not ranked here, but from 1990 through to 2009, its average is a dismal
0.29%. Clearly, a high growth rate is neither a necessary nor sufficient condition for ‘membership’
of the BRIC club.
This GDP data is extended in Table 2 to introduce the World Bank forecasts through to 2014 for
the five countries. Here the World Bank is suggesting a similar growth path for the five countries to
their recent paths, albeit with South Africa still marginally below Brazil and Russia but with these
three significantly below both India and China.
-20
-15
-10
-5
0
5
10
15
1990 1992 1994 1996 1998 2000 2002 2004 2006 2008 2010 2012e 2014f
% GDP
% GDP
% GDP
% GDP

South Africa’s way ahead: are we a BRIC? 39
BRICS: South Africa's Way Ahead?
© 2013 Trade Law Centre, National Agricultural Marketing Council, Royal Danish Embassy, Swedish Embassy Nairobi.
Table 2: World Bank GDP forecasts
GDP growth 2010 2011 2012e 2013f 2014f
Brazil 7.5 2.7 2.9 4.2 3.9
Russia 4.3 4.3 3.8 4.2 4
India 9.6 6.9 6.6 6.9 7.1
China 10.4 9.2 8.2 8.6 8.4
South Africa 2.9 3.1 2.7 3.4 3.5
Source: World Bank forecasts
4. International trade
4.1 The big picture
International trade is generally thought of as the defining characteristic of a BRIC. The following
chart shows that this is not necessarily so. China completely dominates the chart with its rise from
0.89% of global exports in 1980 to 10.40% in 2011. India increases from 0.42% to 1.67% over the
same period, while Brazil increases marginally from 0.99 to 1.40%. South Africa’s trade decreased
from 1.25% to 0.53%. The performance of Russia is not shown before 1994, as the data source is
the World Trade Organisation (WTO) and Russia was not a member until 2012. A similar picture
is apparent from the global import shares (not shown), although the Chinese trend is not quite so
dominant in that the increase in China’s share of world imports over the same period was from 0.96
to 9.46%.
Figure 5: Percentage shares of global exports, 1980-2011
Source: WTO database
0.00%
2.00%
4.00%
6.00%
8.00%
10.00%
12.00%
1980 1985 1990 1995 2000 2005 2008 2011
Br Cn In Ru RSA

40 South Africa’s way ahead: are we a BRIC?
BRICS: South Africa's Way Ahead?
© 2013 Trade Law Centre, National Agricultural Marketing Council, Royal Danish Embassy, Swedish Embassy Nairobi.
Figure 6 isolates the same WTO data for Russia, Brazil, India and South Africa. This enables the
rise of India, the relatively stable profile for Brazil, and the steady decline of South Africa to be
seen more clearly, but it also highlights that Russia is ahead and has been ahead since the data was
collected for Russia in 1994.
Figure 6: Percentage share of global exports, 1980-2009
Source: WTO
The actual values of merchandise exports from the five countries from 2000 to 2011 are shown in
Table 3, with the data expressed in US dollars (billions). China dominates, while South Africa is
the junior participant in exports.
Table 3: Exports from BRICs and SA, 1999-2010, US$ billion
Exp/Yr 2000 2001 2002 2003 2004 2005 2006 2007 2008 2009 2010 2011
China 249 267 326 438 594 762 969 1,218 1,429 1,202 1,578 1,899
Brazil 55 58 60 73 96 118 137 161 198 153 202 256
India 42 43 49 57 76 100 121 148 195 165 223 307
Russia 88 68 75 96 137 185 227 280 368 234 349 379
SA 30 27 27 35 46 52 58 70 80 62 81 7
Source: World Trade Atlas (WTA)
An alternative way to show the relative export growth is to index the export data for each
individual country to a value of 1.0 at 1980, and this is shown in Table 4. The data is from the
WTO rather the Global Trade Atlas, as the time series is longer, but that means that Russia cannot
Br, 1.40%
In, 1.67%
Ru, 2.86%
RSA, 0.53%
0.00%
0.50%
1.00%
1.50%
2.00%
2.50%
3.00%
3.50%
1 2 3 4 5 6 7 8 9 101112131415161718192021222324252627282930 3132
% Global exports
Russia, India, Brazil & South Africa: % global exports 2011

South Africa’s way ahead: are we a BRIC? 41
BRICS: South Africa's Way Ahead?
© 2013 Trade Law Centre, National Agricultural Marketing Council, Royal Danish Embassy, Swedish Embassy Nairobi.
be included as the time series is not long enough to make a meaningful comparison since 1980.
Again, the salient feature is the growth of China, with South Africa showing how it has
dramatically lost global export share over the period when compared to the world index in the
bottom line. The 2009 global decline and subsequent recovery by 2011 is evident for all countries.
Table 4: Relative growth in BRIC and SA exports, 1980-2011
1980 1990 1995 2000 2005 2008 2009 2011
Brazil 1.0 1.56 2.31 2.74 5.89 9.83 7.60 12.72
China 1.0 3.43 8.22 13.77 42.10 79.05 66.39 104.89
India 1.0 2.09 3.57 4.94 11.60 22.69 19.21 35.47
South Africa 1.0 0.92 1.09 1.17 2.02 3.16 2.42 3.79
World 1.0 1.70 2.54 3.17 5.16 7.94 6.17 8.97
Source: WTO data.
The concluding remarks are that China clearly dominates BRIC export trade by all measures used.
Similarly, South Africa tends to lag the other BRICs in these same measures of export performance
over recent years.
4.2 Export destinations and import sources3
The major export destinations for the BRICs and South Africa are shown in Table 5 for the most
recent year. These destinations are all dominated by the EU rather than the US. We note that this is
a distinct change away from the generally accepted situation of the so-called ‘Asian miracle’
economies of the end decades of the 20th century where the US was the dominant market for the
largely manufacturing exports from Asia. Furthermore, intra-BRIC trade is not that high. The
exceptions are where Brazil sends 17.3% of its exports to China, and South Africa sends 12.1% to
the same destination. All other intra-cells are below 10%. Thus, there is little suggestion of a ‘club’
operating here among the BRICs.
3 Note that this section has not been updated to account for what are likely to be marginal changes in 2011 over 2010.
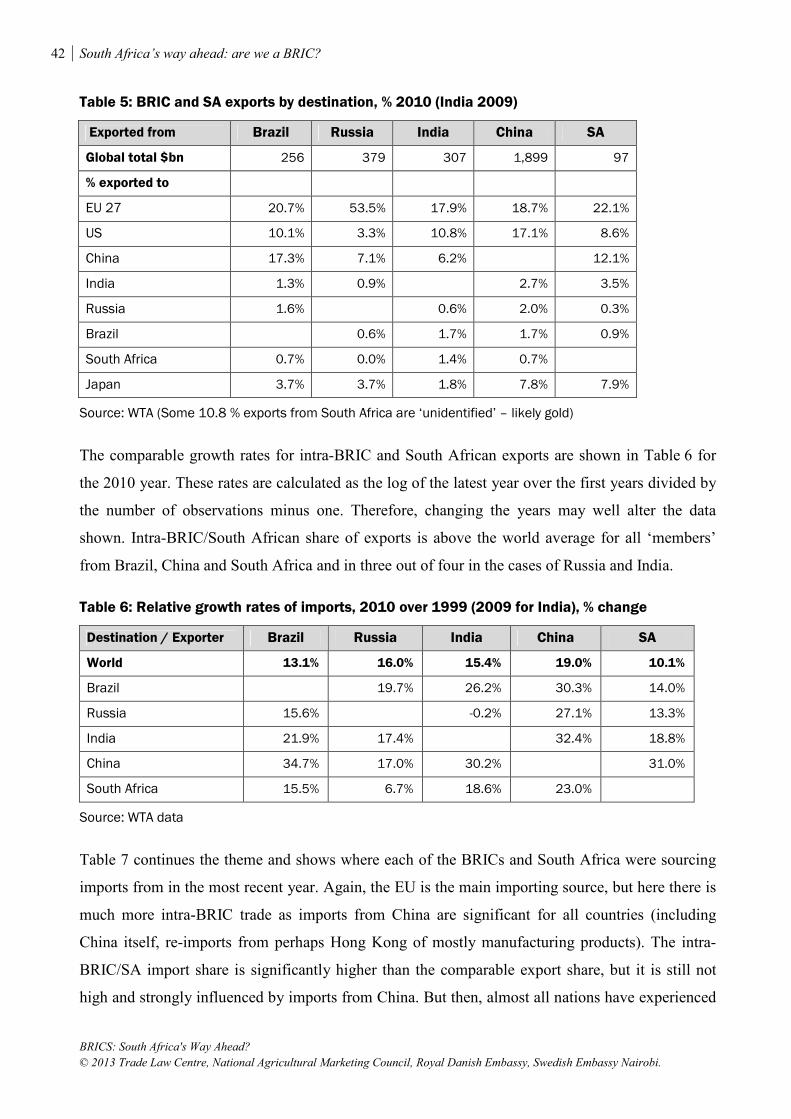
42 South Africa’s way ahead: are we a BRIC?
BRICS: South Africa's Way Ahead?
© 2013 Trade Law Centre, National Agricultural Marketing Council, Royal Danish Embassy, Swedish Embassy Nairobi.
Table 5: BRIC and SA exports by destination, % 2010 (India 2009)
Exported from Brazil Russia India China SA
Global total $bn 256 379 307 1,899 97
% exported to
EU 27 20.7% 53.5% 17.9% 18.7% 22.1%
US 10.1% 3.3% 10.8% 17.1% 8.6%
China 17.3% 7.1% 6.2%
12.1%
India 1.3% 0.9%
2.7% 3.5%
Russia 1.6%
0.6% 2.0% 0.3%
Brazil
0.6% 1.7% 1.7% 0.9%
South Africa 0.7% 0.0% 1.4% 0.7%
Japan 3.7% 3.7% 1.8% 7.8% 7.9%
Source: WTA (Some 10.8 % exports from South Africa are ‘unidentified’ – likely gold)
The comparable growth rates for intra-BRIC and South African exports are shown in Table 6 for
the 2010 year. These rates are calculated as the log of the latest year over the first years divided by
the number of observations minus one. Therefore, changing the years may well alter the data
shown. Intra-BRIC/South African share of exports is above the world average for all ‘members’
from Brazil, China and South Africa and in three out of four in the cases of Russia and India.
Table 6: Relative growth rates of imports, 2010 over 1999 (2009 for India), % change
Destination / Exporter Brazil Russia India China SA
World 13.1% 16.0% 15.4% 19.0% 10.1%
Brazil
19.7% 26.2% 30.3% 14.0%
Russia 15.6%
-0.2% 27.1% 13.3%
India 21.9% 17.4%
32.4% 18.8%
China 34.7% 17.0% 30.2%
31.0%
South Africa 15.5% 6.7% 18.6% 23.0%
Source: WTA data
Table 7 continues the theme and shows where each of the BRICs and South Africa were sourcing
imports from in the most recent year. Again, the EU is the main importing source, but here there is
much more intra-BRIC trade as imports from China are significant for all countries (including
China itself, re-imports from perhaps Hong Kong of mostly manufacturing products). The intra-
BRIC/SA import share is significantly higher than the comparable export share, but it is still not
high and strongly influenced by imports from China. But then, almost all nations have experienced
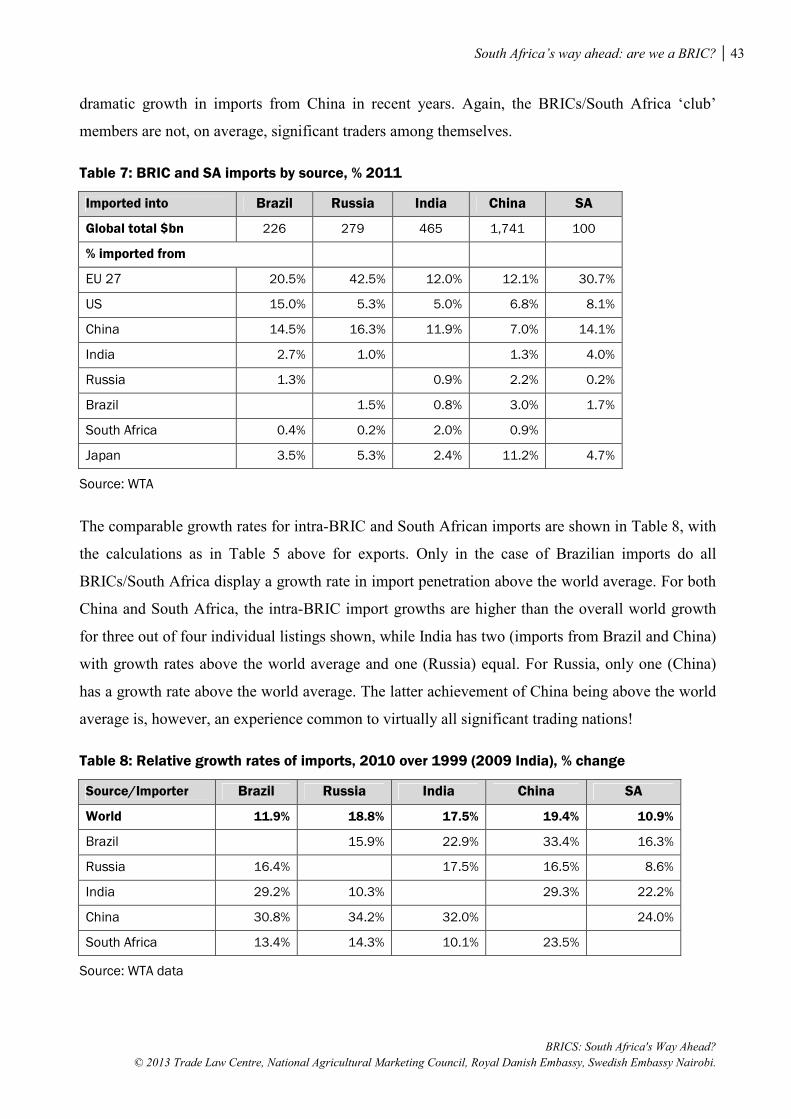
South Africa’s way ahead: are we a BRIC? 43
BRICS: South Africa's Way Ahead?
© 2013 Trade Law Centre, National Agricultural Marketing Council, Royal Danish Embassy, Swedish Embassy Nairobi.
dramatic growth in imports from China in recent years. Again, the BRICs/South Africa ‘club’
members are not, on average, significant traders among themselves.
Table 7: BRIC and SA imports by source, % 2011
Imported into Brazil Russia India China SA
Global total $bn 226 279 465 1,741 100
% imported from
EU 27 20.5% 42.5% 12.0% 12.1% 30.7%
US 15.0% 5.3% 5.0% 6.8% 8.1%
China 14.5% 16.3% 11.9% 7.0% 14.1%
India 2.7% 1.0%
1.3% 4.0%
Russia 1.3%
0.9% 2.2% 0.2%
Brazil
1.5% 0.8% 3.0% 1.7%
South Africa 0.4% 0.2% 2.0% 0.9%
Japan 3.5% 5.3% 2.4% 11.2% 4.7%
Source: WTA
The comparable growth rates for intra-BRIC and South African imports are shown in Table 8, with
the calculations as in Table 5 above for exports. Only in the case of Brazilian imports do all
BRICs/South Africa display a growth rate in import penetration above the world average. For both
China and South Africa, the intra-BRIC import growths are higher than the overall world growth
for three out of four individual listings shown, while India has two (imports from Brazil and China)
with growth rates above the world average and one (Russia) equal. For Russia, only one (China)
has a growth rate above the world average. The latter achievement of China being above the world
average is, however, an experience common to virtually all significant trading nations!
Table 8: Relative growth rates of imports, 2010 over 1999 (2009 India), % change
Source/Importer Brazil Russia India China SA
World 11.9% 18.8% 17.5% 19.4% 10.9%
Brazil
15.9% 22.9% 33.4% 16.3%
Russia 16.4%
17.5% 16.5% 8.6%
India 29.2% 10.3%
29.3% 22.2%
China 30.8% 34.2% 32.0%
24.0%
South Africa 13.4% 14.3% 10.1% 23.5%
Source: WTA data

44 South Africa’s way ahead: are we a BRIC?
BRICS: South Africa's Way Ahead?
© 2013 Trade Law Centre, National Agricultural Marketing Council, Royal Danish Embassy, Swedish Embassy Nairobi.
4.3 Imports – the details
The objective for this section is to examine the bilateral trade flows between each of the BRIC
members and between the BRICs and South Africa to set the trade in perspective. We use import
data for 2010 except for Indian data which is for 2009. For consistency, we follow the BRIC and
then the South Africa sequence in the tables, and give (a) in the two left hand columns, the top five
global imports and their overall value and relative shares of those imports from the world; and then
(b) in the following pairs moving across the table, the same format for imports from the relevant
BRICs and South Africa. Not shown but verifiable is that in almost every case these top five trade
items at the HS 2 chapter level represented at least 50% of global imports and at least 60% of intra-
BRIC/South African imports. Note that imports from the world are in US dollars (billion) while
intra-imports are in US dollars (million).
Table 9 starts with Brazil’s trade. Imports from the world were $182 billion in 2010 with fuel
(16.5% of total), machinery (15.7%), electrical machinery, vehicles, and organic chemicals being
the main imports. Next are Brazilian imports from Russia of $1,911 million, with fertilisers
(43.1%), iron and steel products, fuel, rubber products, and aircraft being the top five imports. This
is followed by imports from India ($4,242 million with 44.15% being fuel), China and South
Africa.
Table 9: Brazilian import trade profile, 2010
World Russia India China SA
$182 billion $1,911 million $4,242 million $25,593 million $753 million
Fuel 16.5% Fertilisers 43.1% Fuel 44.1% Electrical 31.2% Iron/Steel 18.5%
Machinery 15.7% Iron/Steel 18.4% Organic Chemical
10.4% Machinery 22.0% Fuel 13.5%
Electric Machinery
12.2% Fuel 14.7% Electrical 5.6% Organic Chemical
5.0% Machinery 13.5%
Vehicles 9.5% Rubber 4.9% Machinery 5.1% Iron/Steel 4.7% Precious stone/Metal
10.7%
Organics Chemical
4.6% Aircraft 4.0% Fabric 4.8% Medical Instruments
3.6% Organic Chemical
10.3%
Source: WTA data
Table 10 reports exactly the same profile for Russia, the next BRIC country in the sequence. Note
that fruit is the main import from South Africa, and an examination of the data shows that this
consists mostly of oranges. Tables 11, 12 and 13 report on imports from the world, BRICs and
South Africa into India, China and South Africa, respectively.
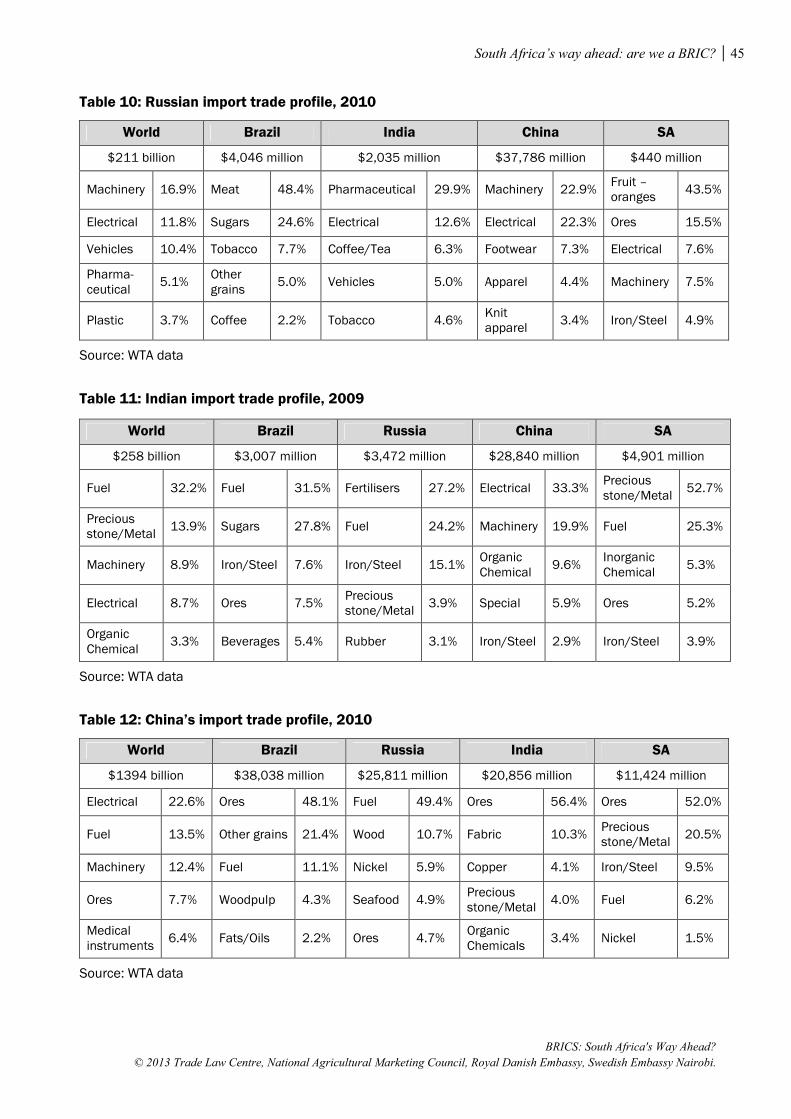
South Africa’s way ahead: are we a BRIC? 45
BRICS: South Africa's Way Ahead?
© 2013 Trade Law Centre, National Agricultural Marketing Council, Royal Danish Embassy, Swedish Embassy Nairobi.
Table 10: Russian import trade profile, 2010
World Brazil India China SA
$211 billion $4,046 million $2,035 million $37,786 million $440 million
Machinery 16.9% Meat 48.4% Pharmaceutical 29.9% Machinery 22.9% Fruit – oranges
43.5%
Electrical 11.8% Sugars 24.6% Electrical 12.6% Electrical 22.3% Ores 15.5%
Vehicles 10.4% Tobacco 7.7% Coffee/Tea 6.3% Footwear 7.3% Electrical 7.6%
Pharma-ceutical
5.1% Other grains
5.0% Vehicles 5.0% Apparel 4.4% Machinery 7.5%
Plastic 3.7% Coffee 2.2% Tobacco 4.6% Knit apparel
3.4% Iron/Steel 4.9%
Source: WTA data
Table 11: Indian import trade profile, 2009
World Brazil Russia China SA
$258 billion $3,007 million $3,472 million $28,840 million $4,901 million
Fuel 32.2% Fuel 31.5% Fertilisers 27.2% Electrical 33.3% Precious stone/Metal
52.7%
Precious stone/Metal
13.9% Sugars 27.8% Fuel 24.2% Machinery 19.9% Fuel 25.3%
Machinery 8.9% Iron/Steel 7.6% Iron/Steel 15.1% Organic Chemical
9.6% Inorganic Chemical
5.3%
Electrical 8.7% Ores 7.5% Precious stone/Metal
3.9% Special 5.9% Ores 5.2%
Organic Chemical
3.3% Beverages 5.4% Rubber 3.1% Iron/Steel 2.9% Iron/Steel 3.9%
Source: WTA data
Table 12: China’s import trade profile, 2010
World Brazil Russia India SA
$1394 billion $38,038 million $25,811 million $20,856 million $11,424 million
Electrical 22.6% Ores 48.1% Fuel 49.4% Ores 56.4% Ores 52.0%
Fuel 13.5% Other grains 21.4% Wood 10.7% Fabric 10.3% Precious stone/Metal
20.5%
Machinery 12.4% Fuel 11.1% Nickel 5.9% Copper 4.1% Iron/Steel 9.5%
Ores 7.7% Woodpulp 4.3% Seafood 4.9% Precious stone/Metal
4.0% Fuel 6.2%
Medical instruments
6.4% Fats/Oils 2.2% Ores 4.7% Organic Chemicals
3.4% Nickel 1.5%
Source: WTA data

46 South Africa’s way ahead: are we a BRIC?
BRICS: South Africa's Way Ahead?
© 2013 Trade Law Centre, National Agricultural Marketing Council, Royal Danish Embassy, Swedish Embassy Nairobi.
Table 13: South Africa’s import trade profile, 2010
World Brazil Russia India China
$80 million $1,354 million $105 million $2,846 million $11,535 million
Fuel 19.6% Special* 22.7% Fertilisers 19.9% Fuel 29.7% Electrical 22.5%
Machinery 14.8% Meat 13.2% Copper 17.6% Vehicles 13.5% Machinery 21.3%
Electrical 10.7% Machinery 9.8% Fats/Oils 10.6% Electrical 8.7% Footwear 4.8%
Vehicles 8.8% Vehicles 9.0% Fuel 8.9% Pharmaceutical 7.8% Apparel 4.2%
Special 6.5% Electrical 5.7% Precious stone/Metal
6.4% Machinery 4.2% Apparel 3.7%
Source: WTA data, where Special* is almost certainly motor vehicles from Brazil in addition to the ‘Vehicles’ listed.
Examination of the data shows that iron and steel products are the only import that features in the
top five from South Africa in every BRIC import list. Precious stones and metals (mostly diamonds
and gold) feature as major imports into Brazil, India and China; fuel (possibly coal) features as a
major import into Brazil, India and China; and ores (iron ore probably) feature as major imports
into Russia, India and China. The others are machinery and organic chemicals into Brazil; fruit
(oranges) and smaller values of both machinery and electrical machinery into Russia; inorganic
chemicals into India; and nickel-related products into China. Machinery and electrical machinery
from China appear in every list, and, interestingly, footwear and clothing make up the other three
imports in both Russia and South Africa. Fertilisers, fuel, and iron and steel dominate Russian
imports into the countries shown. Agricultural products completely dominate Russian imports from
Brazil but not the other countries, while imports from India are a more eclectic mix with fuels,
pharmaceuticals, fertilisers, and ores featuring at different times.
An interesting end note can be made regarding vehicles, as the concept of BRICs is often
associated with the future of the motor vehicle industry. Three countries (Brazil, Russia and South
Africa) all report around 10% of their global imports being motor vehicles, although we note that
the use of the ‘special’ category in South African imports means that this 10% figure is an
underestimate. The salient point here is that no BRIC country or South Africa is registered as a
major source of imports for Brazil; only India features in Russian imports, but vehicle imports are a
strong feature of South Africa imports from both Brazil and India, and especially so when a cross-
check of Brazilian exports to South Africa reveals that the top import of ‘special’ from Brazil is
almost certainly vehicles. During 2010, vehicles were the fourth largest export from Brazil, and
South Africa was the seventh most important destination. In addition, examination of Russian

South Africa’s way ahead: are we a BRIC? 47
BRICS: South Africa's Way Ahead?
© 2013 Trade Law Centre, National Agricultural Marketing Council, Royal Danish Embassy, Swedish Embassy Nairobi.
import data for 2010 shows that vehicles were the third most significant import, and of these, China
with 4.0% ranked sixth as supplier; India with 0.4% ranked 24th as supplier; and both Brazil and
South Africa in 36th and 37th place, respectively, had a minuscule market share of 0.07% each.
Reference
Sandrey, R. 2011. South Africa’s way ahead: are we a BRIC? Trade Brief No. D11TB06/2011.
Stellenbosch: tralac.
Chapter 3
Trade at a glance: the BRICS’ engagement with Africa
Taku Fundira
Introduction
Since the beginning of the new millennium, we are increasingly noticing the influence on the
structure of the world economy not only of some major emerging markets, namely Brazil,
India and China, from a developing country perspective, but also the rise of Russia (since the
collapse of the Soviet Union). Their role in the global arena, from an economic and political
perspective, has raised concern in the developed world about the manner in which their
influence is shaping or shifting the balance of power. Concerns about the impact on the
environment and governance issues have also been raised. However, in Africa, the role of
some of these countries under the auspices of the so-called South-South alliances can be
viewed as an opportunity to enhance cooperation with other developing countries, playing a
significant role in the economic and social development of the region.
Poverty, poor infrastructure, lack of productive capacity and transfer of technology, the
emerging threats associated with climate change as well as the food, energy, financial and
economic crises, have been identified as areas where Africa can enhance its capacity by
cooperating with other developing countries. Furthermore, the increased bargaining power of
developing countries in multilateral negotiations, as reflected in the current Doha negotiations
of the World Trade Organisation (WTO), has been cited as another reason for cooperation. It
is against this background that since 2000, African countries have entered into new
partnerships and arrangements with the South, increasingly driven by economic rather than
political motives. The new partnerships are often based on formal frameworks with dialogue
forums and action plans.

Trade at a glance: the BRICS’ engagement with Africa 49
BRICS: South Africa's Way Ahead?
© 2013 Trade Law Centre, National Agricultural Marketing Council, Royal Danish Embassy, Swedish Embassy Nairobi.
The agenda behind the renewed and increased global economic interest in Africa, a continent
that was once dubbed ‘hopeless’, should be considered. In historical representations, Africa
has been regarded as underdeveloped and poor, but of late Africa has been regarded as a
continent brimming with potential and opportunities. The need of boom economies, like
China and India, for raw materials, is generating valuable new opportunities. Can this be
regarded as a new scramble for Africa in a post-colonial era? Concern should be raised if this
increased interest goes unchecked, as this could be no different from the way in which Africa
was previously colonised for the sake of its resources.
This argument is certainly plausible if one looks at the majority of investments in Africa from
the so-called emerging markets. These are concentrated in the traditional resource-rich
primary sectors. The difference, however, is that this renewed economic interest in Africa is
enabling African countries to add terms and conditions into the mix, such as concessions
attached to infrastructure development projects. For example, according to Holslag (2007), in
Mozambique, Indian contractors were allowed to exploit the coal mines only after the Indian
government had promised to invest in public infrastructure. Furthermore, this renewed
interest in Africa has provided a front line for competition between the traditional investors –
the United States of America (US) and the European Union (EU) on the one hand, and other
emerging players, such as China, India, Brazil, Russia and South Africa on the other.
Africa’s cooperation with especially the emerging markets such as Brazil, Russia, India,
China and South Africa (the BRICS) offers new options that can be turned into opportunities.
It is important to note that the opportunities are not automatic and African countries need to
create an environment conducive for tapping into the benefits that accrue. In this regard, there
is need for a proactive approach that allows for the development of cooperation strategies that
are in line with national and regional development goals.
The Trade Law Centre (tralac) has prepared an analysis of the BRICS’ engagement with
Africa. This chapter provides a summary of the key factors in the involvement of the BRICS
with Africa. Highlights of the analysis include:
Economic and trade policy overview: The BRICS nations represent 42% of the world’s
population and 18% of its Gross Domestic Product (GDP). Among the BRIC economies,
Brazil ranked third, behind India, where growth reached 8.6%, and China, where GDP figures

50 Trade at a glance: the BRICS’ engagement with Africa
BRICS – South Africa's Way Ahead?
© 2013 Trade Law Centre, National Agricultural Marketing Council, Royal Danish Embassy, Swedish Embassy Nairobi.
rose by 10.3%. Russia had the poorest result, with a 3.8% increase. For the new entrant, South
Africa, real GDP recovered from -1.7% in 2009 to 2.8% in 2010 (Richardson, 2011).
Developing economies increased further in importance in 2010, both as recipients of Foreign
Direct Investment (FDI) and as outward investors. They absorbed more than half of global
FDI inflows. Half of the top 20 host economies for FDI were developing or transition
economies. FDI outflows from developing and transition economies also increased strongly,
by 21%. They now account for 29% of global FDI outflows. Six developing and transition
economies were among the top 20 investors during the same review period (UNCTAD,
2011).
In terms of trade policy, the BRICS have made significant policy reforms over the past five
decades. From inward-looking protectionist policies to outward-looking market oriented
policies, these emerging economies have risen above expectations to become the new major
economies. Japan, on the other hand, has also maintained its outward-looking policies with
the objective of ensuring its competitive edge in high-value manufactured products. The
accession of Russia to the WTO will certainly have positive economic impacts on the Russian
economy.
Africa as investment destination: Africa is now both a new frontier of economic and other
opportunities and host to some of the fastest-growing economies in the world. The Real Gross
Domestic Product of Africa increased by 5.2% annually in the past decade, compared with
2.3% in the 1990s (WEF, 2011).
Investments are diversified albeit still concentrated in infrastructure and commodities, but we
currently see an increase in investment in services. Sectors receiving special investment
attention include telecoms (towers, broadband services), financial services (commercial
banks, insurance, ancillary services such as ATMs), agribusiness, infrastructure, oil and gas
(marginal fields, oil field services, gas development), mining, and electric power (energy
infrastructure, energy services).
A survey conducted by the Africa Business Panel among 800 business professionals involved
with Africa shows that South Africa is ranked first, followed by Nigeria and Kenya, as the
most attractive investment destination in 2011. Other countries in the top ten include Angola,
Tanzania, Rwanda, Botswana, Uganda and Mozambique out of 53 economies on the African
continent.

Trade at a glance: the BRICS’ engagement with Africa 51
BRICS: South Africa's Way Ahead?
© 2013 Trade Law Centre, National Agricultural Marketing Council, Royal Danish Embassy, Swedish Embassy Nairobi.
In addition to interregional FDI from developing and transition economies, intraregional FDI
in Africa is increasing. The share of African host countries in the outward stock of South
African FDI has increased from less than 5% before 2000 to 22% in 2008, reaching almost
US$11 billion. South African projects in other African countries are concentrated in
infrastructure, telecoms, mining, and energy (UNCTAD, 2010).
The trading environment with Africa: Individually, the BRIC countries’ trade growth with
Africa has outpaced global trade and BRICS’ trade with the rest of the world (UNCTAD,
2012). India and China’s trade with Africa as a proportion of GDP in 2012 is 1.4% and 1.6%
respectively, while Brazil’s stands at 1.2% and Russia’s at 0.3% (CIA Factbook, 2013; World
Trade Atlas, 2012). South Africa has the highest trade with Africa with its proportion of GDP
estimated at about 4% for 2011. China – the largest trading partner with Africa – has
increased trade with Africa from US$3.5 billion in 1990 to over US$198 billion in 2012,
which equates to roughly 61% of Africa’s total BRICS trade (World Trade Atlas, 2012).
Given Russia’s significant natural resource reserves and South Africa’s economic dominance
in the region, the two are the only BRICS countries with an overall trade surplus with Africa.
Main products from BRICS to Africa feature diversified value-added products while exports
from Africa to BRICS are mainly resource-based primary products with little or no value
addition.
Africa – working towards an enabling environment:1 African countries continue to
liberalise their investment environments. In the past few decades, Africa has made significant
strides toward democratic governance, transparent economic systems, and the elimination of
some of the crippling bureaucratic barriers to trade and investment. Since 2005, of the 53
regulatory changes observed by the United Nations Conference on Trade and Development
(UNCTAD) in Africa, four-fifths (42) were favourable to FDI, while 11 made the
environment less favourable.
Angola, Ethiopia, Mozambique and Rwanda saw inflation-adjusted growth rates higher than
India, Russia or Brazil. The World Bank rates Mauritius a better place to do business than
Germany, and South Africa ranks above Chile. Botswana, Tunisia, Rwanda, Ghana, Namibia
and Zambia all offer a more favourable entrepreneurial environment than China (de
Vignemont and Smallwood, 2011).
1 Unless otherwise stated, summary taken from WIR (2006).

52 Trade at a glance: the BRICS’ engagement with Africa
BRICS – South Africa's Way Ahead?
© 2013 Trade Law Centre, National Agricultural Marketing Council, Royal Danish Embassy, Swedish Embassy Nairobi.
The trend towards privatisation continued across Africa. Algeria, Angola, Comoros, Congo,
Côte d’Ivoire, Kenya, Libya, Mauritius, Morocco, Nigeria, Sierra Leone and Tunisia either
privatised specific sectors or introduced plans to enhance cross-sectoral liberalisation. The
industries affected included utilities, telecommunications, and tourism. Some programmes
attracted Trans-National Corporations (TNCs) from developing countries. In Angola, for
example, the privatisation agency approved Telecom Namibia’s bid to become the first
private operator of Angola’s fixed-line network. Egypt has pursued a policy aimed at opening
up its markets in activities where it has a clear advantage (e.g. tourism) as well as in some
manufacturing.
Another set of favourable changes concerns attempts to improve the investment climate.
Recognising that an investor-friendly admission phase has a beneficial effect on the
subsequent relationship between host and investor, a number of countries have reformed their
admission procedures by introducing one-stop shops. A number of African countries, such as
Egypt, Ghana, Senegal and South Africa, have reformed their tax systems, often reducing
corporate income taxes. Some have eased operational conditions for TNCs. For example,
Egypt is facilitating the entry and residence of foreigners.
• Other governments have acted to remove some of the key constraints on attracting and
benefiting from FDI. For example, South Africa has introduced a Skills Support
Programme (SSP) to enhance the supply of skilled labour. According to the UNCTAD
(2006), similar measures could be usefully adopted by other African countries seeking
FDI in high-value processing.
So what does this mean for Africa?2
• The important question is “What can African firms do to compete with the emerging
giants of Asia and/or the Americas?” Can the solutions be found through
infrastructural development, export incentives promoting, technology development
and/or transfer, or is it simply through simple free market competition?
• The success stories of Asian economies span five decades, with China following suit
as the new emerging economy and potential market. This also begs the question
“What can Africa learn from these stories?”
2 Excerpt taken from Freemantle and Stevens (2010).

Trade at a glance: the BRICS’ engagement with Africa 53
BRICS: South Africa's Way Ahead?
© 2013 Trade Law Centre, National Agricultural Marketing Council, Royal Danish Embassy, Swedish Embassy Nairobi.
• Given the trend towards liberalized trade within a rules-based system, African firms
can no longer call on Government to impose protectionist measures. Only in a few
instances will this be legally possible and economically appropriate. Indeed, narrow
firm and sector interests must be weighed against wider interests that are usually not
expressed as vocally.
• Long-term careful and innovative strategic planning with clear objectives is therefore
required to succeed in this new trading environment. This is also important for African
firms competing with imports from countries such as China as well as competing
against China in the rest of the world.
• China, India and Brazil amongst others have indicated their willingness to enhance
technology transfer and investment cooperation with African countries. Such
collaboration is imperative in the development of strategic and important sectors for
Africa such as Agriculture, Mining and Medical industries.
• There nevertheless remain many challenges for African firms to face in exploiting
these opportunities. These include extending beyond Africa’s current advantage in
primary and resource based goods to include competitively manufactured products. In
the long-run, African firms should thus seek out value-adding opportunities.
• In light of this, these challenges and opportunities should be addressed with the
recognition that Government cannot protect uncompetitive firms. Although there are
some policy options for development, in the longer term Government is best able to
promote growth by creating conditions that allow for firms to compete internationally.
• The rules-based trade system does afford developing countries some flexibility in this
regard. African firms, and indeed all stakeholders, are thus well advised to engage
more meaningfully, and less rhetorically, with Government in achieving optimal
outcomes.
Brazil-Africa trade at a glance
Economic and trade policy overview
With its 190 million inhabitants, Brazil has the largest population in Latin America and ranks
fifth in the world. Brazil’s importance in the global market has grown to the extent where it is

54 Trade at a glance: the BRICS’ engagement with Africa
BRICS – South Africa's Way Ahead?
© 2013 Trade Law Centre, National Agricultural Marketing Council, Royal Danish Embassy, Swedish Embassy Nairobi.
playing a significant role in the world trading system. In the current round of WTO Doha
negotiations, its influence is being strongly felt as member countries seek to find a successful
conclusion to the negotiations.
Brazil’s transition from a regional to a global player is attributed to several factors. A
prevailing strong domestic demand and a favourable external environment have led to an
annual growth of over 6% since 2008, and more recently in 2010, a growth peak of 7.5%. Its
solid performance during the financial crisis and its strong and early recovery also contributed
to this. Sectors such as agriculture and the manufacturing industries played a large role in the
increase, with yearly growth reaching 6.5% and 10.1%, respectively (Richardson, 2011;
WTO, 2009).
This solid economic performance saw Brazil reaching a GDP of over US$2 trillion in 2010.
This means that Brazil overtook Italy to rank as the world’s seventh largest economy, up from
eighth place (‘Measuring Brazil’s economy’, 2011). Among the BRIC economies, Brazil
ranked third, behind India, where growth reached 8.6%, and China, where GDP figures rose
by 10.3%. Russia had the poorest result, with a 3.8% increase (Richardson, 2011). For the
new entrant, South Africa, real GDP recovered from -1.7% in 2009 to 2.8% in 2010. GDP
growth estimates for Brazil in 2012 were expected to be around 1.3%3.
From a trade policy perspective, Brazil has undertaken policy reforms. The country has
traditionally been an inward-looking economy, but changes to Brazil’s trade policy began to
occur from the late 1970s when the import substitution system started to break down. This
was accentuated by two major oil crises in that period, a major recession in the early 1980s,
and the infamous Brazilian inflation of around 2000% by 1990 (OECD, 2005). Over the past
15 years, Brazil’s economy has undergone radical reforms that have provided a more stable
investment climate and stimulated growth. Economic growth and poverty alleviation remain
the main drivers of Brazil’s trade policy strategy where the government is using export
promotion as one of the main components to generate growth. This strategy has led the
Brazilian government to seek foreign market access through trade negotiations as well as
export promotion measures.
3 Final figure not confirmed at time of publication (CIA, 2013).

Trade at a glance: the BRICS’ engagement with Africa 55
BRICS: South Africa's Way Ahead?
© 2013 Trade Law Centre, National Agricultural Marketing Council, Royal Danish Embassy, Swedish Embassy Nairobi.
Brazil in Africa initiatives
Brazil’s engagement with Africa dates back to the slavery era in the 18th century, and
although this engagement over time was interfered by changes in mainly the political
environment both in Brazil and Africa, the relationship in recent times has been strengthened
and is growing.
The ascent to the helm of Brazil’s Lula da Silva in 2003 opened up a new era in Brazil-Africa
relations, represented by the combination of a new stance towards global engagement and
social domestic reform. Economic and political ties with Africa have been established or
strengthened, and to date Brazil has about 31 formal African diplomatic posts.
Brazil’s engagement with Africa has seen bilateral and plurilateral agreements in areas
ranging from education and health to investment cooperation agreements in energy,
manufacturing, and services. An important diplomatic engagement was the establishment of
the India, Brazil, and South Africa (IBSA) Forum where the promotion of South-South
partnerships were discussed. Recently, the IBSA countries have agreed to boost trade amongst
themselves to US$10 billion in 2011. On a continent-wide engagement, the first Africa-South
America Summit in 2006 also highlighted Brazil’s serious consideration of Africa as an
important and strategic partner.
Brazil’s investments in Africa are quite modest and also concentrated in only a few countries
when compared to other emerging markets such as China and India. Most of the investments
have been in mining, construction, agriculture, bio-diesel, energy and pharmaceutical
industries where their resource-driven goals mirror those of China and India, and at times
collide with interests of host African states (Lewis, 2011). Investments go mainly to former
Portuguese colonies (Angola and Mozambique) and to suppliers of hydrocarbon (Algeria and
Nigeria). Other destinations are Guinea, South Africa and Zambia. Food products have found
significant new markets in Egypt.
A major reason attributed to the low levels of investments in Africa has been the fact that
although Brazil’s main supplier of capital finance – the Brazil National Development Bank
(BNDES) – plays an important role, it is limited by conditions that prohibit it from financing
in more unstable markets as compared to, for example, China’s no-strings-attached approach
(Lewis, 2011). Box 1 below is an excerpt of some of the major Brazilian players in Africa.

56 Trade at a glance: the BRICS’ engagement with Africa
BRICS – South Africa's Way Ahead?
© 2013 Trade Law Centre, National Agricultural Marketing Council, Royal Danish Embassy, Swedish Embassy Nairobi.
Box 1: Major Brazilian players in Africa
Mining giant Vale is to invest a total of $15 – 20 billion in Africa within the next five years with
most of the money spent in Mozambique, Zambia, Guinea and Liberia. The aim is to become the
third biggest copper producer on the continent. Total investment in Africa so far is about $2.5
billion but as most of the projects are in the exploration phase, there is a chance to significantly
increase investment.
Infrastructure firm Odebrecht operates in Angola, Libya, Liberia, Mozambique and Ghana and has
also completed projects in Congo, Botswana, South Africa, Gabon and Djibouti. In 2009, Africa
accounted for $2.427 billion in revenues for the group, or about 10% of its earnings.
Oil company Petrobras plans to invest some $3 billion in Africa from now until 2013, mainly in
Angola and Nigeria. Following 2009 discoveries of huge reserves far below ultra-deep waters off
the Brazilian coast, some experts believe similar deposits may exist along the West African coast.
In Nigeria, the company operates one block and is a non-operating partner in two others.
Agriculture is one of the main areas of technical cooperation with Africa. Brazil provides technical
assistance to the cotton sector in Benin, Burkina-Faso, Chad and Mali through EMBRAPA, a state
agricultural research institute. In 2008, Brazil opened an EMBRAPA office in Accra to facilitate the
transfer of agricultural technology from Brazil to Africa.
Source: Excerpt from Lewis (2011)
The trading environment with Africa
As highlighted already, Brazil’s influence in Africa, although growing, is still very small.
Access to natural resources remains Brazil’s principal interest in the continent but it is not its
only interest. Its economic interests are wider. A look at the bilateral trade with Africa reveals
the following (see Figure 1):
• Trade between Brazil and Africa increased significantly since 2001, with exports to
and imports from Africa recording a compound growth of 18% and 14%, respectively,
for the period between 2001 and 2012.
• Latest 2012 trade data reveals that over US$26 billion worth of goods was traded
between Brazil and Africa. Imports from Africa accounted for about US$14 billion
while exports were a lesser approximately US$12 billion.
• The 2008 global crisis significantly affected Brazil’s trade with Africa, where imports
from Africa were affected the most by a decline of almost 50% in value terms from a
high of US$16 billion in 2008 to just over US$8 billion in 2009. Since then, trade has

Trade at a glance: the BRICS’ engagement with Africa 57
BRICS: South Africa's Way Ahead?
© 2013 Trade Law Centre, National Agricultural Marketing Council, Royal Danish Embassy, Swedish Embassy Nairobi.
recovered with imports rising to about US$141 billion in 2012. Exports were not
significantly affected over this period.
• By market, we note that for both exports and imports, Brazil trades relatively with the
same countries. For exports, Egypt (22%), South Africa (14%), and Algeria (10%)
account for 46% of total exports. On the other hand, Nigeria (56%), Algeria (22%),
and Morocco (9%) account for 87% of total imports (See Figure 2).
Figure 1: Trade patterns between Brazil and Africa from 2001 to 2012
Source: World Trade Atlas
Figure 2: Brazil’s share of exports to and imports from Africa (2012)
Source: World Trade Atlas

58 Trade at a glance: the BRICS’ engagement with Africa
BRICS – South Africa's Way Ahead?
© 2013 Trade Law Centre, National Agricultural Marketing Council, Royal Danish Embassy, Swedish Embassy Nairobi.
A look at product composition for 2012 reveals a concentration of trade in relatively few
product groups. Brazil exports mainly agricultural and manufactured products while imports
from Africa are mainly primary resource-based products in nature.
• Main exports of Brazil to Africa include sugar (HS17) (33%) and meat (HS02) (15%),
which in combination account for almost 50% of total exports. Other exports include
ores (HS26), vehicles (HS87), cereals (HS10), and machinery (HS84).
• The main import from Africa is mineral fuels (HS27), which account for 83% of total
imports. The other notable import is fertilisers (HS31), which accounts for only 8%.
Table 1: Product composition of Brazil’s trade with Africa
Brazil’s top 10 exports to Africa Brazil’s top 10 imports from Africa
HS Description
2012 (US$ m)
% share (2010) HS
Description 2012
(US$ m) % share (2012)
All products 12 210.09 100 All products 14 265.68 100
17 Sugars 4 070.05 33 27 Mineral Fuel, Oil Etc
11 854.17 83
02 Meat 1 778.77 15 31 Fertilizers 1 107.36 8
10 Cereals 1 578.72 13 18 Cocoa 150.40 1
87 Vehicles, Not Railway
657.58 5 72 Iron And Steel 136.37 1
26 Ores, Slag, Ash 598.48 5 25 Salt; Sulfur; Earth, Stone
125.56 1
84 Machinery 584.17 5 28 Inorg Chem; Rare Earth Mt
101.35 1
88 Aircraft, Space-craft
268.40 2 38 Misc. Chemical Products
97.52 1
94 Furniture And Bedding
254.84 2 39 Plastic 79.93 1
15 Fats And Oils 231.28 2 29 Organic Chemicals
63.84 0
85 Electrical Machinery
156.05 1 84 Machinery 63.70 0
OTHER 2 031.74 17
OTHER 485.49 3
Source: World Trade Atlas

Trade at a glance: the BRICS’ engagement with Africa 59
BRICS: South Africa's Way Ahead?
© 2013 Trade Law Centre, National Agricultural Marketing Council, Royal Danish Embassy, Swedish Embassy Nairobi.
Russia-Africa trade at a glance
Economic and trade policy overview
Russia’s transition since the collapse of the Soviet Union has seen the country transform from
an isolated, centrally-planned economy to a more globally integrated market-based economy.
With a population of over 142 million and a per capita Gross Domestic Product (GDP – PPP)
of US$17,700, Russia is the ninth most populous country in the world and it has several
ethnic groups dominated mainly by the Russian ethnic group (CIA, 2013 (Russia)).
Since the country’s 1998 financial crisis, the economy has grown at an average of 7%
annually, which has led to a doubling of real disposable incomes and the emergence of a
middle class. This growth was mainly due to a devalued rouble, implementation of key
economic reforms, tight fiscal policy, and favourable commodities prices. The 2008-2009
financial crisis did not spare Russia, however, as oil prices plummeted and the foreign credits
that Russian banks and firms relied on dwindled (US Bureau of Public Affairs, 2011).
After a series of economic measures to respond to the crisis, including the use of Russia’s
international reserves and a rescue plan for struggling banks and companies, economic
decline was curtailed in mid-2009 and the economy began to grow again in the first quarter of
2010. The global rebound and a rise in oil prices also bolstered the Russian economy’s
modest recovery. The growth was, however, hampered by a reduction in agricultural output as
a result of severe drought and fires, a reduction that in turn impacted on and slowed growth in
other sectors such as manufacturing and retail trade. It is expected that prevailing high oil
prices (2011) will continue to bolster Russian growth and help reduce the budget deficit,
although inflation and increased government spending may get in the way. In the long run, a
shrinking workforce, a high level of corruption, difficulty in accessing capital for smaller,
non-energy companies, and poor infrastructure in need of large investments remain a threat to
Russia’s economic performance (CIA, 2013 (Russia)).
In terms of trade policy, Russia has undergone significant change in the post-Soviet Union
era. In the days of the Soviet Union, trade was bi-faceted, with internal trade (trade among the
former Soviet states) on the one hand, and trade with the West (external) on the other.
According to Tarr (2009), the trade adjustment pattern and political economy of the trade
policy that developed in the post-Soviet period were very different between the two regions.
In the immediate post-Soviet era, Russia was confronted with the fact that there were

60 Trade at a glance: the BRICS’ engagement with Africa
BRICS – South Africa's Way Ahead?
© 2013 Trade Law Centre, National Agricultural Marketing Council, Royal Danish Embassy, Swedish Embassy Nairobi.
enormous disparities between prices in Russia and world market prices. Domestic prices of
commodities and raw materials were dramatically lower, and as a result, some form of
protection was required during the transition to a globally integrated economy. Furthermore,
Russia’s manufactured products were not of sufficient quality to be exported to Western
markets.
Tarr (2009) notes that the Russian government took the position to apply three main export
restraint mechanisms (export quotas, export taxes and foreign exchange surrender
requirements) as opposed to import protection. Use of the tariff was not significant due
largely to the undervalued rouble which made importing economically unviable to the extent
that government would subsidise imports. According to the World Bank, in 1992, subsidies
accounted for about 17.5% of GDP (US$18 billion). Machinery and equipment received 49%
of the import subsidies and food products received 35% of the subsidies, with subsidies
varying by sector from a low of 61% for food imports to a high of 90% on food processing
equipment.
With negotiations for accession to the WTO currently underway, Russia has been reforming
and harmonising its trade legislation to conform to WTO rules over the past 15 years, which
has made it more transparent and predictable for the outside world. Membership of the WTO
was finalised at the end of 2011.
Russia’s initiatives in Africa
Russia’s engagement in Africa dates back to the time when most of the African countries
achieved their independence, about five decades ago. However, ties were severed in the 1990s
due to the financial crunch that the new Russian state experienced, among other factors. But
now the Russian Federation aspires to re-engage Africa. This renewed interest has been
demonstrated by the recent visits by several African leaders to Russia and by Russian leaders
to the continent. Visitors to Africa have included President Dmitry Medvedev, who
highlighted ‘a new dynamism’ in ‘Russia-Africa traditional friendly relations’ during his visit
in 2009. This visit produced several bilateral agreements with African states. Other visits have
included Russian First Deputy Prime Minister Sergey Ivanov’s trip to South Africa and
Foreign Minister Sergey Lavrov’s 2008 visit to Senegal for the Organisation of the Islamic
Conference (OIC) summit, as well as his meetings with heads of foreign affairs agencies of
African countries in Moscow and New York. Ministers of foreign affairs from South Africa
Trade at a glance: the BRICS’ engagement with Africa 61
BRICS: South Africa's Way Ahead?
© 2013 Trade Law Centre, National Agricultural Marketing Council, Royal Danish Embassy, Swedish Embassy Nairobi.
and Kenya, leaders of the foreign affairs agencies of Cameroon, Gabon and Madagascar, and
other officials from a number of African states attended the Moscow visits (Natufe, 2011).
Saltanov (2008) notes that Russia’s foreign policy approach to Africa is to work on
strengthening the traditionally friendly relations with the states of the African continent by
developing bilateral and plurilateral cooperation arrangements with them. Priority attention
has been paid to intensifying the Russian-African dialogue and developing common positions
on key aspects of the international agenda, including the issues of promoting strategic
stability, strengthening the central United Nations (UN) role, and countering new challenges
and threats, primarily terrorism and extremism. This cooperation with Africa was confirmed
in the 12 July 2008 revised version of the Russian Federation Foreign Policy Concept,
approved by the President of Russia. Among Russia’s principal partners are Angola, Guinea,
Namibia, Nigeria, Ethiopia and South Africa. Prospects for the advancement of cooperation
with DR Congo, Gabon, Zimbabwe, Cameroon, Côte d’Ivoire, Kenya, Madagascar, Mali and
other countries are also envisaged.
With respect to investment, Russia has become one of the leading foreign direct investors
among emerging markets in the last decade. The Russian expansion abroad started in the
Commonwealth of Independent States (CIS) and has moved forward to industrialised
countries as well as Africa. Oil, gas and other natural resource sectors, which have been the
major contributors to the Russian economic boom, are at the forefront of Russian outward
investment. However, despite resource-based industries continuing to dominate outward
investment, Russian financial, telecom, and retail trade companies are also venturing abroad.
According to Nestmann and Orlova (2008), expanding abroad provides Russian companies
with access to new technologies, know-how, and resources. In addition, higher revenues and
lower funding costs achieved by investing abroad support the build-up of the capital stock and
infrastructure investment within Russia.
Focusing on African investments, although still lagging behind its other emerging and
developed country counterparts, Russia peaked its investments in Africa to US$20 billion in
2008 (AfDB, 2011). The new foreign investment policy employed by Russia is to ensure the
success of ‘Russian businesses’ on this continent. The growing demand for securing energy
resources amongst global players investing in Africa puts Russia at a competitive advantage,
being the only oil and gas exporter in this group, as it seeks partnerships that go beyond
extracting resources but also ensuring technology development and transfer (Natufe, 2011).

62 Trade at a glance: the BRICS’ engagement with Africa
BRICS – South Africa's Way Ahead?
© 2013 Trade Law Centre, National Agricultural Marketing Council, Royal Danish Embassy, Swedish Embassy Nairobi.
However, according to African Development Bank (AfDB, 2011), the depletion of the
resource base in Russia partly explains the motivation behind Russian business expansion.
‘The absence of new discoveries and technological advancement, which are weakening
Russia’s domestic energy, together with the lack of easy access to the remaining underground
mineral deposits in Russia’, are some of the factors attracting Russia to Africa’s considerable
natural resources. Russian companies with operations in Africa include Alrosa, Gazprom,
Lukoil, Rusal, Renova, Gammakhim, Technopromexport, and VEB and VTB banks, which
are engaged in large-scale investment projects on the continent. Below is a summary of
Russia’s major investors in Africa.
Table 2: Major Investments of Russian companies in Africa
Company/ Investor name
Host country/ Company
Industry Type of investment Value Year
Norilsk Nickel South Africa Gold Fields
Gold mining and processing
M&A (acquired 30% of Gold Fields)
US$1.16 billion
2004
Norilsk Nickel Botswana Tati Nickel
Nickel mining and processing
M&A (acquisition of Canada Lion Ore Mining gave it 85% stake in Tati Nickel
US$2.5 billion 2007
Sintez South Africa, Namibia, Angola
Oil, gas, diamonds and copper exploration
‘Greenfield’ Investment US$10 – 50 million
2006
Lukoil
Côte d’Ivoire, Ghana
Oil exploration M&A (acquired interest in 10,500 km² deep water blocks)
US$900 million
2010
Rusal Nigeria ALSCON
Aluminium refining
M&A (acquired majority stake in Aluminium Smelter Company – ALSCON of Nigeria)
US$250 million
Severstal Liberia Iron ore M&A (acquired control of iron ore deposit in Putu Range area of Liberia)
US$40 million
2008
Gazprom Algeria Sonatrach
Natural gas exploration
Joint exploration and development projects by debt write-off agreement and arms deal
US$4.7 billion and US$7.5 billion
2006
Alrosa Angola, Namibia, DRC
Diamond mining and hydroelectricity
Greenfield Investment US$300 – 400 million
1992
Rosatom Egypt Nuclear power Ongoing negotiations to build Egypt’s first nuclear power plant
US$1.8 billion 2010
Source: Adapted from AfDB (2011)

Trade at a glance: the BRICS’ engagement with Africa 63
BRICS: South Africa's Way Ahead?
© 2013 Trade Law Centre, National Agricultural Marketing Council, Royal Danish Embassy, Swedish Embassy Nairobi.
Russian trading relations with Africa
Figure 3 below shows the trade patterns between Russia and Africa from 2001 to 2012 – the
latest available trade data year. The graph clearly highlights the increased interest or
cooperation between this economic giant and the African continent.
Figure 3: Trade patterns between Russia and Africa from 2001 to 2012
Source: World Trade Atlas
An analysis of the trade flows reveals the following:
• Between 2001 and 2012, the compounded growth of Russia’s total trade (imports +
exports) with Africa increased by 20%, with imports and exports increasing by 18%
and 20%, respectively. The global financial crisis had an impact on Russia’s trade with
Africa where during the 2008/2009 period, the value of total trade between Russia and
Africa decreased by 23%, from approximately US$7.4 billion in 2008 to
approximately US$5.7 billion at the end of 2009. Exports to Africa were affected the
most, declining by 25%, while imports from Africa declined by a relatively smaller
18% over the same period. In value terms, imports declined by approximately US$359
million while exports declined by approximately US$1.3 billion during this period.
• However, we witnessed some recovery in 2010 when the rate of decline in total trade
eased to an estimated -1% annual growth to almost reach the 2009 levels of
US$5.7 billion. The rate of decline was slowed by a recovery in imports which
experienced positive growth, in comparison to exports where we witnessed a further
decline (see graph above).

64 Trade at a glance: the BRICS’ engagement with Africa
BRICS – South Africa's Way Ahead?
© 2013 Trade Law Centre, National Agricultural Marketing Council, Royal Danish Embassy, Swedish Embassy Nairobi.
• The bulk of Russia’s current trade with Africa is concentrated among a few countries
for both imports and exports. The chart below depicts Russia’s respective African
trading partners for both imports and exports in 2012, together with the market share
of each country.
• Among the major trading partners, trade is concentrated among just a few countries in
2012. For imports, South Africa (27%), Morocco (22%) and Egypt (14%) account for
about 63% of total imports trade, while in terms of exports, Egypt (44%), Morocco
(16%), and Algeria (12%) account for about a 72% share.
Figure 4: Russia: imports from and exports to Africa (2012)
Source: World Trade Atlas
• The top 10 products Russia imported from Africa in 2012 accounted for 80% of
Russia’s total imports from Africa over this period. There is a greater concentration of
trade in a few mainly agricultural products, as reflected by Russia’s composition of
imports in which the top four products accounted for 53% of total of imports from
Africa. These were edible fruit and nuts (27%), cocoa (11%), tobacco (8%), and
Vehicles (7%).
• In terms of exports, the top 10 products Russia exported to Africa during the same
period represented about 94% of total Russian exports to Africa. The products traded
are relatively diversified and to a certain extent processed products, comprising cereals
(31%); mineral fuel, oil, etc. (29%); wood (12%); fertilisers (7%); and iron and steel
(6%). Together, these products accounted for over 85% of total exports. Table 3 below
highlights the product composition of Russian trade with Africa.

Trade at a glance: the BRICS’ engagement with Africa 65
BRICS: South Africa's Way Ahead?
© 2013 Trade Law Centre, National Agricultural Marketing Council, Royal Danish Embassy, Swedish Embassy Nairobi.
Table 3: Product composition of Russian trade with Africa
Top 10 imports Top 10 exports
HS Description
2012 (US$ m)
% share (2012) HS
Description 2012
(US$ m) % share (2012)
All products 2 480.43
All products 7 068.56
08 Edible Fruit And Nuts 659.39 27 10 Cereals 2 167.24 31
18 Cocoa 270.55 11 27 Mineral Fuel, Oil Etc 2 031.27 29
24 Tobacco 206.37 8 31 Fertilizers 487.91 7
87 Vehicles, Not Railway 166.09 7 44 Wood 440.94 6
07 Vegetables 165.50 7 72 Iron And Steel 398.24 6
26 Ores, Slag, Ash 126.22 5 25 Salt; Sulfur; Earth, Stone
327.01 5
62 Woven Apparel 115.63 5 15 Fats And Oils 324.52 5
09 Spices,Coffee And Tea
110.87 4 85 Electrical Machinery 212.68 3
28 Inorg Chem; Rare Earth Mt
98.48 4 87 Vehicles, Not Railway 140.45 2
64 Footwear 62.81 3 84 Machinery 116.40 2
OTHER 498.53 20
OTHER 421.90 6
Source: World Trade Atlas
India-Africa trade at a glance
Economic and trade policy overview
With a population of over 1.2 billion people and a per capita Gross Domestic Product (GDP –
PPP) of US$3,900, India is ranked the second most populus country characterised by a
diverse and rich cultural heritage (CIA, 2013). The nation is home to several hundred
languages, of which 33 have 100,000 or more speakers. India is the birthplace of Buddhism,
Hinduism, Jainism, and Sikhism (IBER, 2011).
Also viewed as the second fastest-growing emerging economy in the world, India was
historically considered to be underdeveloped with low levels of mechanised industry.
Economic reforms that began in the 1990s have served to accelerate the country’s growth and
turned the country into an open-market economy with a modern industrial sector. These
measures comprise economic liberalisation, including industrial deregulation, privatisation of
state-owned enterprises, and reduced controls on foreign trade and investment. GDP (PPP) in

66 Trade at a glance: the BRICS’ engagement with Africa
BRICS – South Africa's Way Ahead?
© 2013 Trade Law Centre, National Agricultural Marketing Council, Royal Danish Embassy, Swedish Embassy Nairobi.
2010 was estimated at over US$4 trillion, with an average growth of about 7% over the past
decade. A strong domestic demand partly contributes to India’s positive economic
performance, which saw a rebound in GDP growth after the financial crisis in 2009 to reach
8.5% growth in 2010. The services and manufacturing sectors contribute over 80% of GDP,
although agriculture continues to play a significant role in the economy in terms of providing
livelihoods in this populous country, accounting for about 52% of the total labour force (CIA,
2013 (India)).
Export promotion remains the focus of India’s trade and investment policy. The effects of the
global financial crisis have led to India adopting policies in the short term that are aimed at
curbing and reversing the declining trend of exports and at providing additional support,
especially to those sectors which have been badly hit by recession in the developed world.
Amongst the measures adopted to meet India’s objective is the need for export diversification
and enhanced market access both at the multilateral and bilateral level (India Ministry of
Commerce and Industry, 2009).
According to IBER (2011), ‘liberalisation in overseas investment policy, in order to improve
exports and strengthen economic linkages with foreign countries, has intensified India’s
participation on the international canvas in terms of investment’. India has been ranked in
sixth place in global FDI and is expected to remain among the top ten most attractive
destinations for international investors during 2010-2012, according to a 2010 report on world
investment prospects titled, ‘World Investment Prospects Survey 2010-2012’ by the United
Nations Conference on Trade and Development (UNCTAD).
India-in-Africa initiatives
There is a growing realisation that the future growth of Indian companies will be substantially
driven by the share they have in the global market. Indian companies are acquiring overseas
assets to establish their presence in foreign markets and to upgrade their competitive strength
(IBER, 2011).
The India-Africa Forum Summit is the official platform for the African-Indian relations. It
was first held from April 4 to April 8, 2008, in New Delhi, India. It was the first such meeting
between the heads of state and government of India and 14 Africa countries chosen by the
African Union. The summit, an important platform for India and Africa to cooperate and
coordinate in a spate of political and economic issues, is held every three years.

Trade at a glance: the BRICS’ engagement with Africa 67
BRICS: South Africa's Way Ahead?
© 2013 Trade Law Centre, National Agricultural Marketing Council, Royal Danish Embassy, Swedish Embassy Nairobi.
India has invested more than US$33 billion in Africa to date (Indian Investments in Africa,
2011). Initially limited to Kenya, Nigeria and Uganda in the 1970s, its influence has expanded
geographically between 2000 and 2007, with Indian companies now doing business in over 20
African countries (Dickerson-Nyema, 2011). The entry of Indian companies into Africa has
largely been market seeking, and has been driven by the liberalisation of regulations and
lowering of entry barriers in the host countries (Gelb, 2005). Indian companies are active in a
range of sectors, including mining, pharmaceuticals, machinery and equipment, chemicals,
textiles, paper and paper products, financial services, software, refinery, and printing.
The East African region has been the main recipient of Indian investment, accounting for over
two-thirds of FDI flows in Africa. Major recipients in this region include Mauritius (which
has attracted a large number of software companies), Kenya, Ethiopia and Uganda. North
Africa, which is also an attractive region for Indian investment, has attracted significant
investments since 2007, mainly in Sudan where most concessions were in the oil and gas
sector, but some investments in automobiles and light engineering goods have also been
recorded. West Africa has received a smaller amount of investment when compared to the
East and North African regions due to the political instability of this region, although there is
a strong presence of Indian companies especially in Nigeria, Liberia and Senegal. The
Southern African region to date has attracted a minimal proportion of total Indian direct
investment to Africa. However, major Indian corporations now have a presence in industries
such as mining (Verdanta, Arcelor Mittal), steel (Tata Steel), pharmaceuticals (Dr Reddy’s
Lab, Ranbaxy), and automotives (Tata, Mahindra). The bulk of the investments have been in
South Africa, which is increasingly becoming the gateway to the region (Dickerson-Nyema,
2011). Box 2 below provides an overview of the bilateral investment relationship between
India and South Africa.

68 Trade at a glance: the BRICS’ engagement with Africa
BRICS – South Africa's Way Ahead?
© 2013 Trade Law Centre, National Agricultural Marketing Council, Royal Danish Embassy, Swedish Embassy Nairobi.
Box 2: India-South Africa investment relationship
Since the renewal of diplomatic ties in 1993, India and South Africa have been continually forging
and developing stronger ties, both economically and politically. Investments in both directions have
increased and there are indications of more to come, especially under the BRICS, IBSA and India-
South Africa Free Trade Agreement (FTA) banners.
With close to 100 Indian companies operating in South Africa on projects worth over $6 billion,
India features among the top 10 countries investing in South Africa. From an Indian perspective,
South Africa is considered a good investment destination and gateway to the rest of the African
markets. Most of the current investments are privately driven and are mainly in the
pharmaceutical, financial and automobile sectors. Information technology (IT) has also attracted
interest from India.
Companies such as Tata, Cipla, Apollo, Godrej, Genpact, Aegis, M&M, Ashok Leyland, Ranbaxy and
Aurobindo Pharmaceuticals are among the companies in the pharmaceutical and automobile
sectors. Several Indian banks are also moving in, with the State Bank of India, ICICI Bank and Bank
of Baroda already established. The richly endowed mining sector has also not been spared, with
Indian companies expressing interest in acquiring coal, iron ore, and manganese mines.
On the other hand, investment opportunities in the fields of agro processing and cold chains,
tourism, hotel, the retail sector, iron and steel, organic and inorganic chemicals, and precious
metals have attracted the interest of South African companies. In the financial sector, besides
South African banks, insurance and financial services companies have also developed their India-
specific strategies to increase their presence in India.
Sources: KPMG (2011); PWC (2008)
Indian trading relations with Africa
Figure 5 below shows the trade patterns between India and Africa from 2001 to 2011 – the
latest available trade data year. The picture depicted clearly highlights the increased interest
or cooperation between this economic giant and the African continent.
An analysis of the trade flows reveals the following:
• Between 2001 and 2011, the compounded growth of India’s total trade with Africa
increased by 29%, with imports and exports increasing by 32% and 24%, respectively.
• The global financial crisis had an impact on India’s trade with Africa where during the
2008/2009 period, the value of total trade between India and Africa decreased by 24%
from approximately US$43 billion in 2008 to approximately US$33 billion at the end
of 2009. Imports from Africa were affected the most, declining by 26% while exports
to Africa declined by a relatively smaller 20% over the same period. In value terms,

Trade at a glance: the BRICS’ engagement with Africa 69
BRICS: South Africa's Way Ahead?
© 2013 Trade Law Centre, National Agricultural Marketing Council, Royal Danish Embassy, Swedish Embassy Nairobi.
imports declined by approximately US$7 billion while exports declined by
approximately US$3 billion during this period.
• However, we witnessed some recovery in 2010 where total trade increased by an
estimated 44% annual growth to reach US$47 billion. Imports recovered significantly
in comparison to exports, where we witnessed a 49% annual growth recovery for
imports to reach about US$30 billion and a relatively lower 36% annual growth for
exports to reach about US$17 billion.
• The bulk of India’s current trade with Africa is concentrated among a few countries
for both imports and exports. The chart below (Figure 6) depicts India’s respective
African trading partners for both imports and exports in 2011, together with the
market share of each country.
• Among the major trading partners, trade is concentrated among just a few countries.
For imports, Nigeria (34%), South Africa (23%), and Angola (15%) account for about
72% of total import trade, while in terms of exports, South Africa (18%), Nigeria
(11%), Egypt (10%), and Kenya (9%), account for about 48% share.
Figure 5: Trade patterns between India and Africa from 2001 to 2011
Source: World Trade Atlas

70 Trade at a glance: the BRICS’ engagement with Africa
BRICS – South Africa's Way Ahead?
© 2013 Trade Law Centre, National Agricultural Marketing Council, Royal Danish Embassy, Swedish Embassy Nairobi.
Figure 6: India’s top 10 African import and export markets (2011)
Source: World Trade Atlas
• The top 10 products India imported from Africa in 2011 accounted for 96% of India’s
total imports from Africa over this period. There is a greater concentration of trade in
a few primary resource-based products, as reflected by India’s composition of imports
in which the top three products accounted for 87% of total of imports from Africa.
These were mineral fuel, oil, etc. (67%); precious stones, metals (16%); and inorganic
chemicals (4%).
• In terms of exports, the top 10 products India exported to Africa during the same
period represented about 70% of total Indian exports to Africa. The products traded
are relatively diversified and to a certain extent largely value-added manufacturing
products comprising mineral fuel, oil, etc. (21%); vehicles, not railway (11%);
Pharmaceutical Products (8%); electrical machinery (7%); and machinery (6%).
Together, these products accounted for over 53% of total exports. Table 4 below
highlights the product composition of Indian trade with Africa.

Trade at a glance: the BRICS’ engagement with Africa 71
BRICS: South Africa's Way Ahead?
© 2013 Trade Law Centre, National Agricultural Marketing Council, Royal Danish Embassy, Swedish Embassy Nairobi.
Table 4: Product composition of Indian trade with Africa
India’s Top 10 imports from Africa India’s Top 10 exports to Africa
HS Description
2011 (US$ m)
% share (2011) HS
Description 2011
(US$ m) % share (2011)
-AFRICA- 39 923.34 All products 24 204.65
27 Mineral Fuel, Oil Etc 26 728.24 67 27 Mineral Fuel, Oil Etc 5 128.76 21
71 Precious Stones,Metals
6 407.91 16 87 Vehicles, Not Railway
2 685.77 11
28 Inorg Chem; Rare Earth Mt
1 601.16 4 30 Pharmaceutical Products
2 003.54 8
08 Edible Fruit And Nuts
1 073.93 3 85 Electrical Machinery
1 611.34 7
72 Iron And Steel 672.82 2 84 Machinery 1 354.75 6
31 Fertilizers 547.77 1 72 Iron And Steel 1 051.93 4
26 Ores, Slag, Ash 517.20 1 17 Sugars 805.81 3
25 Salt; Sulfur; Earth, Stone
400.55 1 73 Iron/Steel Products 782.89 3
76 Aluminum 217.51 1 52 Cotton+Yarn,Fabric 766.59 3
44 Wood 214.27 1 39 Plastic 722.03 3
OTHER 1 541.98 4
OTHER 7 291.22 30
Source: World Trade Atlas
China-Africa trade at a glance
Economic and trade policy overview
With a population of over 1.3 billion and a GDP growth of 10%, China’s GDP was US$8.25
trillion in 2012. GDP composition by sector reveals manufacturing (47%) leading, followed
by services (44%) and agriculture (10%). The country’s per capita GDP (PPP) of about
$9,100 ranks the country at 118 in the world (CIA, 2013 (China)).
China’s impressive economic performance in the past two decades has led to China being
touted as the next economic superpower to become the world’s top manufacturer, surpassing
the United States. Export growth has contributed significantly to China’s economic
performance and, currently, China is the largest exporter and second largest importer of goods
in the world.
The success of China is partly attributed to the economic reforms that were undertaken since
the 1970s. We have witnessed China’s economy change from a closed, centrally-planned
72 Trade at a glance: the BRICS’ engagement with Africa
BRICS – South Africa's Way Ahead?
© 2013 Trade Law Centre, National Agricultural Marketing Council, Royal Danish Embassy, Swedish Embassy Nairobi.
system to a market-oriented economy that has a rapidly growing private sector. According to
the CIA World Factbook (2013 (China)), the reforms saw the phasing-out of collective
farming, the gradual liberalisation of prices, fiscal decentralisation, increased autonomy of
state enterprises, a diversified banking system, and trade liberalisation, among others.
The WTO Trade Policy Review (TPR) (2010) notes that trade and investment liberalisation
played an important role in extending China’s reform programme to the manufacturing sector.
Since its accession to the WTO in 2001, China has continued to further undertake sweeping
economic reforms towards a market economy.
China has also renewed its support for state-owned enterprises (SOE) in sectors it considers
important to ‘economic security’, explicitly looking to foster globally competitive national
champions. Agriculture and light industry have largely been privatised, while the state still
retains control over some heavy industries. Despite the dominance of state ownership in
finance, telecommunications, petroleum and other important sectors of the economy, private
entrepreneurs continue to expand into sectors formerly reserved for SOEs (CIA, 2013
(China)).
The government of China plans to continue reforming the economy with an emphasis on
increasing domestic consumption and lowering dependence on exports for GDP growth. This
may be in response to the effects of the global economic recession which left China
vulnerable when exports declined by 16%, thus affecting its export-led growth. Real GDP
growth declined from 9.6% in 2008 to a year-on-year rate of 6.2% in the first quarter of 2009,
the lowest rate in more than a decade (WTO, 2010).
China-in-Africa initiatives
With China’s social, political and economic landscape changing for the long term, its need for
more and diverse raw materials and different types of international business relationships has
become significant. This has led to Chinese companies going global, a trend that has become
a defining feature of the present stage of China’s integration with the global economy. This
trend has also marked a new phase in China’s relations with Africa, with the continent
increasingly becoming the target of Chinese foreign investment initiatives.
The establishment of the Forum on China-Africa Cooperation (FOCAC) Summit marked a
significant turning point in China-Africa relations. The convergence of over 40 African Heads

Trade at a glance: the BRICS’ engagement with Africa 73
BRICS: South Africa's Way Ahead?
© 2013 Trade Law Centre, National Agricultural Marketing Council, Royal Danish Embassy, Swedish Embassy Nairobi.
of State and Governments in Beijing, China, for the third Ministerial Conference in 2006 was
suggested to be possibly the largest gathering ever of African leaders in Asia. From debt
cancellations to preferential loans, China was making a statement on how serious it considers
diplomatic relations with poor African countries as partners.
Official statistics from the Ministry of Commerce of the People’s Republic of China reveal
that from 2003 to 2008, China’s outward FDI outflows to Africa increased by over
US$5 billion. The major recipients of the FDI for 2008 were South Africa (US$4.8bn),
Zambia (US$214m), and Nigeria (US$163m). An important aspect to note is that these
figures do not clearly reflect the actual FDI and caution needs to be taken in terms of them
being an indication of Chinese activity on the continent, simply because, in most cases, the
recorded figures do not reconcile relations between China and the recipient country.4 Despite
these shortcomings, evidence on the ground reveal the growing presence of Chinese influence
in Africa. Box 3 below highlights some of China’s most recent engagements in Africa.
The re-engagement of Africa by China is a strategic move that cannot be viewed as
coincidental. Driven by its need to sustain its rapid growth as its economy booms, China
requires adequate resources and Africa has resources and investment opportunities to offer.
This includes the relatively unexploited oil and gas, metals and minerals, and might also
include agricultural or fishery products, but the main focus is on energy, metals and minerals.
The economic and strategic consequences of China’s increased focus on Africa have been the
subject of much debate around the world. The resonating question has been, “How good is
this for Africa?”
Some commentators have suggested that China’s involvement will erode efforts to promote
transparency and reduce corruption in Africa. China has also been viewed as having no
interest in pressing African governments to respect human rights issues or be more
democratic. However, others have suggested that by importing Africa’s raw commodities and
more recently, African-manufactured value-added goods such as processed foods and
household consumer goods, China has helped integrate the continent further into the global
economy.
Box 3: Major Chinese investment activity in Africa (actual and planned) (August 2010 to
February 2011)
4 This information was made available during a personal communication with Hannah Edinger, Senior Manager & Head of Research, Frontier Advisory (Pty) Ltd.

74 Trade at a glance: the BRICS’ engagement with Africa
BRICS – South Africa's Way Ahead?
© 2013 Trade Law Centre, National Agricultural Marketing Council, Royal Danish Embassy, Swedish Embassy Nairobi.
Angola: A framework agreement was signed for a joint venture between Liaoning Huajin Tongda
Chemicals (a Chinese manufacturer of industrial equipment) and Sonangol (Angola’s parastatal
petroleum conglomerate) that is worth US$2.1 billion. The deal is yet to be approved by both
governments.
Ethiopia: A new leather factory worth US$67 million was opened by Chinese firm Xinxiang Kuroda
Mingliang Leather Co. The project was financed to the value of 45% by the China-Africa
Development Fund (CADF).
Ghana: Several investments were made; three investments fall under the auspices of CADF which
allows Chinese investors to inject about US$570 million into three projects in Ghana’s mining,
agriculture, and health sector. These were i) US$500 million available for the upgrade of the Korle-
Bu Teaching hospital in Accra; ii) a new gold refinery worth US$42 million in Accra; iii) a new palm
oil refinery and processing factory worth US$25 million; and finally iv) new loans available to fund
energy, agriculture, and transport development worth US$13 billion.
Mozambique: A rehabilitation of existing road infrastructure, jointly funded by the Mozambican
government and World Bank to the value of US$35 million, was handed over by the Chinese Henan
International Cooperation Group. The 100 km section of the road was between Gazza and
Inhambane.
Nigeria: CADF entered into a 40/60 joint venture with China Merchant Holdings to buy a stake in a
container terminal operator for US$154 million. The deal gives the partnership a 47.5% stake in
the operator.
South Africa: Chinese company Yingli Solar signed an agreement which will see it partner with a
yet unnamed South African company to build a manufacturing plant for solar products. The deal is
worth approximately US$435 million.
Uganda: An agreement between the Chinese and Ugandan governments was signed to build and
manage a toll road from Kampala to the Entebbe airport. The 36 km toll road is worth US$350
million. China is Uganda’s main source of FDI.
Zambia: Luanshya Copper Mine is Zambia is set to receive rehabilitation and an upgrade of the
underground mine. The China Non-ferrous Mining Corporation (CNMC), which runs the mine,
expects to invest more than US$4 million in an attempt to improve safety and efficiency at the
mine.
Source: Excerpt from The Beijing Axis, March 2011
The trading environment with Africa
Figure 7 below shows the trade patterns between China and Africa from 2001 to 2012 – the
latest available trade data year. The graph clearly highlights the increased interest or
cooperation between this economic giant and the African continent.
Figure 7: Trade patterns between China and Africa from 2001 to 2012

Trade at a glance: the BRICS’ engagement with Africa 75
BRICS: South Africa's Way Ahead?
© 2013 Trade Law Centre, National Agricultural Marketing Council, Royal Danish Embassy, Swedish Embassy Nairobi.
Source: World Trade Atlas
An analysis of the trade flows reveals the following:
• Between 2001 and 2012, the compounded growth of China’s total trade with Africa
increased by 30%, with imports and exports increasing by 33% and 27%, respectively.
• The impact of the global financial crisis had an impact on China’s trade with Africa
where, during the 2008/2009 period, the value of total trade between China and Africa
decreased by 16%, from approximately US$106 billion in 2008 to approximately
US$90 billion at the end of 2009. Imports from Africa were affected the most,
declining by 24%, while exports to Africa declined by only 6% over the same period.
In value terms, imports declined by approximately US$13 billion while exports
declined by approximately US$3 billion during this period.
• However, we witnessed a recovery in 2010 where total trade increased by 37% to
US$123 billion. Imports from Africa had a spectacular recovery, recording a 50%
annual growth to reach US$63 billion, while exports recorded a relatively lesser 25%
annual growth to reach about US$60 billion.
• The bulk of China’s current trade with Africa is concentrated among a few countries
which have more or less the same value for imports and exports. The chart below
depicts China’s African trading partners for both imports and exports respectively in
2012, together with the market share of each country.

76 Trade at a glance: the BRICS’ engagement with Africa
BRICS – South Africa's Way Ahead?
© 2013 Trade Law Centre, National Agricultural Marketing Council, Royal Danish Embassy, Swedish Embassy Nairobi.
• Amongst the major trading partners as already highlighted, trade is concentrated
among few countries. For imports, South Africa (39%) and Angola (30%) account for
almost 70% of total trade, while in terms of exports, South Africa (18%), Nigeria
(11%), and Egypt (10%) account for about a 39% share.
Figure 8: China’s share of exports to and imports from Africa (2012)
Source: World Trade Atlas
• The top 10 products China imported from Africa in 2012 accounted for 97% of
China’s total imports from Africa over this period. There is a greater concentration of
trade in a few primary resource-based products, as reflected by China’s imports
composition in which the top four products accounted for 90% of total African
imports. These were mineral fuels (50%); Special Other (26%); ores and slag (10%);
and copper (4%).
• In terms of exports, the top 10 products China exported to Africa during the same
period represented a relatively lesser 61% of the total Chinese exports to Africa. This
is an indication of the diversity of China’s export product base, which are largely
value-added manufacturing products comprising electrical machinery (12%);
machinery (12%); vehicles, not railway (7%); iron/steel products (5%); and knit
apparel (5%), among others. Table 5 below highlights the product composition of
China’s trade with Africa.

Trade at a glance: the BRICS’ engagement with Africa 77
BRICS: South Africa's Way Ahead?
© 2013 Trade Law Centre, National Agricultural Marketing Council, Royal Danish Embassy, Swedish Embassy Nairobi.
Table 5: Product composition of China’s trade with Africa
China’s top 10 imports from Africa China’s top 10 exports to Africa
HS Description
2012 (US$ m)
% share (2012) HS
Description 2012
(US$ m) % share (2012)
All products 113 086.90
-AFRICA- 85 238.70
27 Mineral Fuel, Oil Etc 56 083.68 50 85 Electrical Machinery 10 552.40 12
98 Special Other 28 940.91 26 84 Machinery 10 356.25 12
26 Ores, Slag, Ash 11 320.01 10 87 Vehicles, Not Railway
6 122.61 7
74 Copper + Articles Thereof
4 924.02 4 73 Iron/Steel Products 4 317.49 5
71 Precious Stones, Metals
3 889.68 3 61 Knit Apparel 4 286.68 5
44 Wood 1 448.37 1 94 Furniture And Bedding
4 222.22 5
52 Cotton+Yarn, Fabric 1 247.72 1 39 Plastic 3 240.27 4
72 Iron and Steel 967.75 1 64 Footwear 3 119.91 4
12 Misc Grain, Seed, Fruit
515.91 0 89 Ships And Boats 2 748.59 3
24 Tobacco 441.66 0 52 Cotton+Yarn, Fabric 2 656.63 3
OTHER 3 307.19 3
OTHER 33 615.66 39
Source: World Trade Atlas
Since tralac began monitoring the Africa-China trading relationship over the past seven years
(2006-2012), the evaluation has revealed the following:
• In 1995, China’s total trade with Africa was only 1% of China’s total world trade.
However, total China-Africa trade steadily increased from 1995 to 2006 and has
remained constant, ranging between 3% and 4%, over the last five years.
• Over the last five years, mineral products have dominated China’s imports from
African countries, with Angola and South Africa as China’s main African trading
partners.
• China’s main export products have remained unchanged; however, the composition of
the top five export products has changed on an annual basis.
78 Trade at a glance: the BRICS’ engagement with Africa
BRICS – South Africa's Way Ahead?
© 2013 Trade Law Centre, National Agricultural Marketing Council, Royal Danish Embassy, Swedish Embassy Nairobi.
South Africa-Africa trade at a glance
Economic and trade policy overview
South Africa has a population of over 48 million people and an estimated GDP (PPP) of
US$579 billion in 2012 (CIA, 2013). The country employs a mixed economy to address the
legacies of apartheid, with the state’s role being dynamic, shifting emphases to meet the
changing developmental needs of society. It is the economic powerhouse of Africa, with a
GDP four times that of its Southern African neighbours, and accounts for approximately 30%
of the continent’s GDP. Its industrial output and mineral production is 40% and 45% of total
output in the continent, respectively, and the country generates over 50% of Africa’s
electricity (DTI, 2010).
South Africa enjoyed an exceptional 62 quarters of uninterrupted economic growth from the
first quarter of 1993 to the second quarter of 2008. However, as the effects of the global crisis
hit, GDP contracted in the last two quarters of 2008, officially plunging the economy into its
first recession in 18 years. Higher interest rates, power shortages, and weakening commodity
prices were also contributory factors. Real GDP, however, recovered from -1.7% in 2009 to
2.8% in 2010, albeit below the estimated potential of around 4% per annum for South Africa.
According to the African Economic Outlook (2011), GDP is expected to grow at a rate of
3.6% in 2011 and 4.3% in 2012.
Over the review period, South Africa has also managed to keep inflation within the target
range of between 3% and 6% per annum. Current inflation indicators reveal that
South Africa’s inflation for 2011 is expected to be about 5% year-on-year (Nedbank Group,
2011). Despite achieving budgetary discipline and contained inflation, South Africa still faces
the daunting task of reducing inequalities and enhancing growth performances 17 years after
the end of apartheid.
Looking at the trade policies adopted by South Africa over the past few decades, we note that
historically, South Africa’s trade policy was guided by three interrelated strategies, that is,
import substituting industrialisation, the development of strategic industries (in arms, oil and
coal) – due to imposed sanctions – and the development of minerals-related exports. This was
aided by heavy incentives to develop and sustain these industries (Lewis, 2001).

Trade at a glance: the BRICS’ engagement with Africa 79
BRICS: South Africa's Way Ahead?
© 2013 Trade Law Centre, National Agricultural Marketing Council, Royal Danish Embassy, Swedish Embassy Nairobi.
Accession to the WTO increased the pace of trade policy reform, where the key aspects of
liberalisation were contained in an offer to the WTO of phased tariff-reduction measures. The
tariff reform programme took effect in early 1995, signalling the commitment of the new
government to trade reform which resulted in the reduction of the average tariff from about
15% in 1996 to below 7% in 2011. To date, South Africa has shifted its policy towards
market-led, supply-side support measures that are in line with WTO rules to facilitate
industrial restructuring, technology upgrading, investment and export promotion as well as
small, medium and micro enterprises (SMME) development.
South African initiatives in Africa
South African businesses have made great strides in Africa, and particularly in southern
Africa. This expansion of South African companies into African markets has displayed the
vast opportunities that Africa has to offer in terms of investment. Joint ventures, Greenfield
investments, and mergers and acquisitions characterise South African business presence
throughout Africa. Key to the success of South African investments has also been the state’s
promotional role through entities such as the Industrial Development Corporation (IDC) and
the Development Bank of Southern Africa (DBSA), which not only provide funding but also
share the risk by taking a direct stake in some projects.
We therefore expect South Africa’s role as a major investor in the region to continue,
assuming that the trend seen over the past decade prevails. For instance, more than 22% of
FDI flows received by the Southern African Development Community (SADC) between 1994
and 2004 were from South Africa, with the share in some years exceeding 40% (UNCTAD,
2004). Between 2005 and 2009, South Africa increased investments in Africa by around
US$13 billion, from US$3 billion in 2005 to US$16 billion in 2009 (UNCTAD, 2011). Again,
the bulk of this has been in neighbouring countries, where South African companies have
continued to establish a visible footprint.
Six main sectors of the South African economy can be identified that have taken the lead in
terms of investing in Africa. Companies from the mining, retail, construction/manufacturing,
financial services, telecommunications, and tourism sectors have ensured that South Africa is
clearly visible as a major investor in Africa. In the past decade, investments that were usually
concentrated in mining have tended to move into other, mainly services, sectors. According to
UNCTAD (2004), ‘since 2000, 8 of 21 major investments by South Africa in Africa were in

80 Trade at a glance: the BRICS’ engagement with Africa
BRICS – South Africa's Way Ahead?
© 2013 Trade Law Centre, National Agricultural Marketing Council, Royal Danish Embassy, Swedish Embassy Nairobi.
natural resource sectors; 8 in services, 1 in utilities (electricity), and 2 in basic industries’. In
recent years, however, South Africa has also become prominent as an investor in
telecommunications, financial and retail sectors in Africa, as reflected by the expansion and
increased appetite for investment into Africa by major players in these particular sectors.
Countries where South Africa has a visible footprint include Angola, Botswana, DRC,
Namibia, Mozambique, Swaziland, Tanzania, Zimbabwe (all SADC), Cameroon, Ghana,
Guinea, Mali, Nigeria, Rwanda and Uganda. The big investors are MTN, Vodacom, Eskom,
Sasol, SABMiller, Shoprite, Protea, Multichoice, Standard Bank, ABSA and, recently, FNB,
among others. In Table 7 below is a list of companies with operations in Africa.
Table 6: South Africa Outward FDI stock
2005 2009
To Africa 3,017 15,676
To the World 36,826 72,583
Africa % share of world 8 22
Source: UNCTAD (2011)
Table 7: Main South African investors in Africa (2010)
Company FDI Recipient Sector
SecureData Holdings Kenya Software & IT services
Tourvest Zimbabwe Hotels & tourism
MTN Group Rwanda Communications
Dimension Data Holdings (DiData) Uganda Communications
Standard Bank Group Zimbabwe Financial services
Sanlam Group Uganda Financial services
Pick n Pay Zambia, Mauritius Food & tobacco
JHI Zimbabwe Real estate
Basil Read Zimbabwe Metals
Altech Group Kenya Communications
Source: COMESA Investment Report (2011)
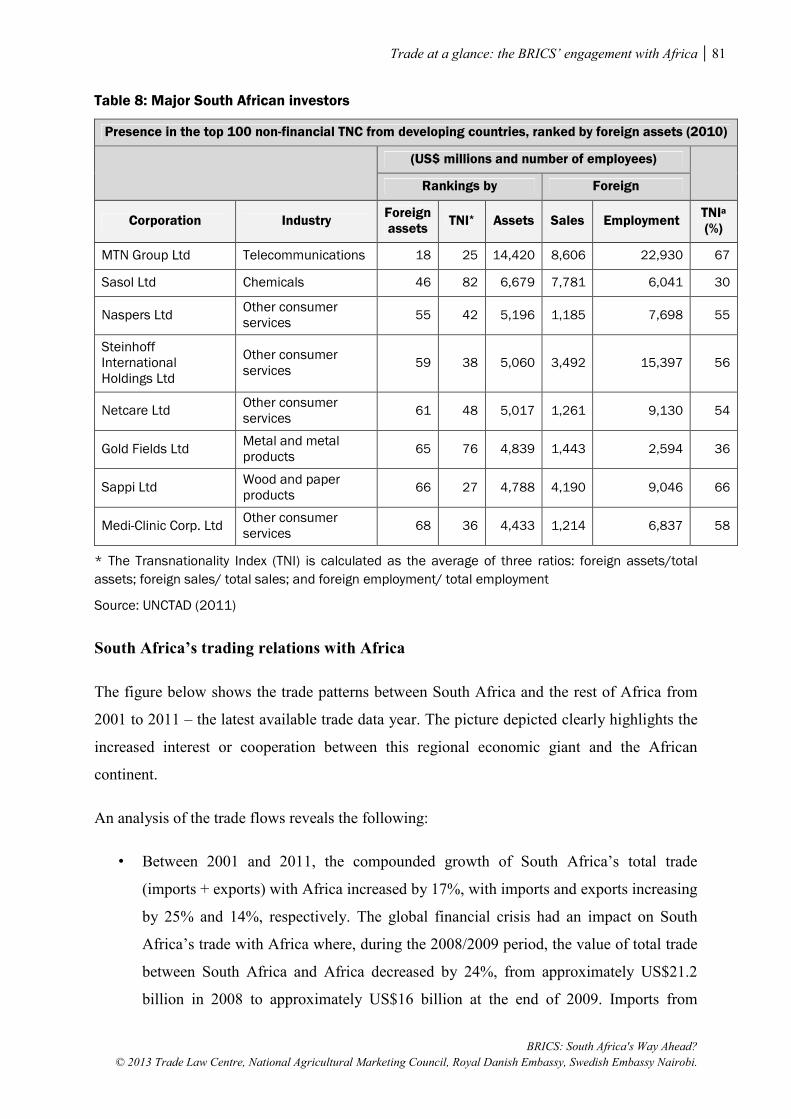
Trade at a glance: the BRICS’ engagement with Africa 81
BRICS: South Africa's Way Ahead?
© 2013 Trade Law Centre, National Agricultural Marketing Council, Royal Danish Embassy, Swedish Embassy Nairobi.
Table 8: Major South African investors
Presence in the top 100 non-financial TNC from developing countries, ranked by foreign assets (2010)
(US$ millions and number of employees)
Rankings by Foreign
Corporation Industry Foreign assets
TNI* Assets Sales Employment TNIa
(%)
MTN Group Ltd Telecommunications 18 25 14,420 8,606 22,930 67
Sasol Ltd Chemicals 46 82 6,679 7,781 6,041 30
Naspers Ltd Other consumer services
55 42 5,196 1,185 7,698 55
Steinhoff International Holdings Ltd
Other consumer services
59 38 5,060 3,492 15,397 56
Netcare Ltd Other consumer services
61 48 5,017 1,261 9,130 54
Gold Fields Ltd Metal and metal products
65 76 4,839 1,443 2,594 36
Sappi Ltd Wood and paper products
66 27 4,788 4,190 9,046 66
Medi-Clinic Corp. Ltd Other consumer services
68 36 4,433 1,214 6,837 58
* The Transnationality Index (TNI) is calculated as the average of three ratios: foreign assets/total
assets; foreign sales/ total sales; and foreign employment/ total employment
Source: UNCTAD (2011)
South Africa’s trading relations with Africa
The figure below shows the trade patterns between South Africa and the rest of Africa from
2001 to 2011 – the latest available trade data year. The picture depicted clearly highlights the
increased interest or cooperation between this regional economic giant and the African
continent.
An analysis of the trade flows reveals the following:
• Between 2001 and 2011, the compounded growth of South Africa’s total trade
(imports + exports) with Africa increased by 17%, with imports and exports increasing
by 25% and 14%, respectively. The global financial crisis had an impact on South
Africa’s trade with Africa where, during the 2008/2009 period, the value of total trade
between South Africa and Africa decreased by 24%, from approximately US$21.2
billion in 2008 to approximately US$16 billion at the end of 2009. Imports from

82 Trade at a glance: the BRICS’ engagement with Africa
BRICS – South Africa's Way Ahead?
© 2013 Trade Law Centre, National Agricultural Marketing Council, Royal Danish Embassy, Swedish Embassy Nairobi.
Africa were affected the most, declining by 40%, while exports to Africa declined by a
relatively smaller 13% over the same period. In value terms, imports declined by
approximately US$3.5 billion while exports declined by approximately US$1.6 billion
during this period.
• However, we witnessed a recovery in 2010 where growth in total trade increased by
an estimated 17% annual growth, from US$16 billion in 2009 to US$18.8 billion in
2010.
• The bulk of South Africa’s current trade with Africa is concentrated among a few
countries for both imports and exports. The chart below (Figure 10) depicts South
Africa’s respective African trading partners for both imports and exports in 2011,
together with the market share of each country.
• Among the major trading partners, trade is concentrated among just a few countries.
For imports, Nigeria (41%), Angola (21%) and Mozambique (13%) account for about
75% of total trade, while in terms of exports, Zimbabwe (17%), Mozambique (17%),
and Zambia (16%) account for about a 50% share.
Figure 9: Trade patterns between South Africa and Africa from 2001 to 2011
Source: World Trade Atlas

Trade at a glance: the BRICS’ engagement with Africa 83
BRICS: South Africa's Way Ahead?
© 2013 Trade Law Centre, National Agricultural Marketing Council, Royal Danish Embassy, Swedish Embassy Nairobi.
Figure 10: South Africa’s share of exports to and imports from Africa (2011)
Source: World Trade Atlas
• The top 10 products South Africa imported from Africa in 2011 accounted for 92% of
South Africa’s total imports from Africa over this period. There is a greater
concentration of trade in a few products as reflected by South Africa’s composition of
imports, in which the top three products accounted for 84% of total of imports from
Africa. Mineral fuel, oil (75%) accounted for the bulk of imports.
• In terms of exports, the top 10 products South Africa exported to Africa during the
same period represented about 65% of total South African exports to Africa. The
products traded are relatively diversified, and to a certain extent processed products,
comprising machinery (14%); vehicles, not railway (10%); mineral fuel, oil, etc.
(10%); iron and steel (8%); and electrical machinery (6%). Together, these products
accounted for 48% of total exports. Table 9 below highlights the product composition
of South African trade with Africa.

84 Trade at a glance: the BRICS’ engagement with Africa
BRICS – South Africa's Way Ahead?
© 2013 Trade Law Centre, National Agricultural Marketing Council, Royal Danish Embassy, Swedish Embassy Nairobi.
Table 9: Product composition of South Africa’s trade with Africa
South Africa Imports from Africa South Africa Exports to Africa
HS Description
2011 (US$ m)
% share (2011) HS
Description 2011
(US$ m) % share (2011)
-AFRICA- 7 668.44
-AFRICA- 14 826.00
27 Mineral Fuel, Oil Etc 5 719.18 75 84 Machinery 2 079.49 14
71 Precious Stones, Metals
348.79 5 87 Vehicles, Not Railway
1 493.80 10
74 Copper + Articles Thereof
274.35 4 27 Mineral Fuel, Oil Etc 1 459.50 10
26 Ores, Slag, Ash 159.66 2 72 Iron and Steel 1 174.75 8
52 Cotton + Yarn, Fabric
112.76 1 85 Electrical Machinery 952.82 6
84 Machinery 101.89 1 73 Iron/Steel Products 813.98 5
85 Electrical Machinery 88.92 1 39 Plastic 675.18 5
61 Knit Apparel 87.26 1 48 Paper, Paperboard 412.75 3
24 Tobacco 71.11 1 38 Misc. Chemical Products
312.15 2
62 Woven Apparel 68.13 1 22 Beverages 275.04 2
OTHER 636.40 8
OTHER 5 176.54 35
Source: World Trade Atlas

Trade at a glance: the BRICS’ engagement with Africa 85
BRICS: South Africa's Way Ahead?
© 2013 Trade Law Centre, National Agricultural Marketing Council, Royal Danish Embassy, Swedish Embassy Nairobi.
References
AfDB. 2011. Russia’s Economic Engagement with Africa. Africa Economic Brief, 2(7), 11
May. African Development Bank.
African Economic Outlook. 2011. South Africa. [Online]. Available:
http://www.africaneconomicoutlook.org/en/countries/southern-africa/south-africa/
Bloomberg 2010. NTT to Buy Dimension Data for $3.2 Billion. 2010. Bloomberg, July 15.
[Online]. Available: http://www.bloomberg.com/news/2010-07-15/ntt-agrees-to-purchase-of-
south-africa-s-dimension-data-for-3-2-billion.html
Broadman, H.G. 2010. Africa’s Silk Road: China and India’s New Economic Frontier.
Washington, D.C.: World Bank. [Online]. Available: http://go.worldbank.org/PKNA9OP5E0
CIA. 2013. World Factbook. Brazil. Washington, D.C.: Central Intelligence Agency.
[Online]. Available: https://www.cia.gov/library/publications/the-world-
factbook/geos/br.html
CIA. 2013. World Factbook. China. Washington, D.C.: Central Intelligence Agency.
[Online]. Available: https://www.cia.gov/library/publications/the-world-
factbook/geos/ch.html
CIA. 2013. World Factbook. India. Washington, D.C.: Central Intelligence Agency. [Online].
Available: https://www.cia.gov/library/publications/the-world-factbook/geos/in.html
CIA. 2013. World Factbook. Russia. Washington, D.C.: Central Intelligence Agency.
[Online]. Available: https://www.cia.gov/library/publications/the-world-factbook/geos/rs.html
CIA. 2013. World Factbook. South Africa. Washington, D.C.: Central Intelligence Agency.
[Online]. Available: https://www.cia.gov/library/publications/the-world-factbook/geos/rs.html
COMESA. 2011. COMESA Investment Report. COMESA Secretariat. [Online]. Available:
http://www.comesa.int/attachments/article/239/2011%20COMESA%20Investment%20Repor
t.pdf

86 Trade at a glance: the BRICS’ engagement with Africa
BRICS – South Africa's Way Ahead?
© 2013 Trade Law Centre, National Agricultural Marketing Council, Royal Danish Embassy, Swedish Embassy Nairobi.
Cooper, W.H. 2011. U.S.-Japan Economic Relations: Significance, Prospects, and Policy
Options. CRS report for Congress, March 2011. [Online]. Available:
http://www.fas.org/sgp/crs/row/RL32649.pdf
Daniel, J., Naidoo, V. and Naidu, S. 2003. Post-Apartheid South Africa’s Corporate
Expansion into Africa. Traders: African Business Journal, Issue 15, August – November
2003. [Online]. Available: http://www.sarpn.org/documents/d0000556/P515_Post-
Apartheid_SA.pdf
De Vignemont, G. and Smallwood, R. 2011. Africa: the next investment destination. Price
Waterhouse Coopers (PWC). September. [Online]. Available:
https://www.africataxsymposium.co.za/downloads/ATBS-Ses-2011-28-15-00-06.pdf
Dickerson-Nyema, A.E. 2011. Investment in Africa. The Diaspora Voice, May 2011.
[Online]. Available:
http://www.thediasporavoice.com/index.php?option=com_content&view=article&id=141:inv
estment-in-africa
Freemantle, S. and Stevens, J. 2010. BRIC and Africa: Placing the BRIC and Africa
commercial partnership in a global perspective. Standard Bank Group Economics. [Online].
Available: http://ws9.standardbank.co.za/sbrp/DocumentDownloader?docId=3276
Frontier India News Network, 2011. Indian Investments in Africa Touche USD 33 B, USD 70
B trade expected by 2015. 2011. Frontier India News Network, May. [Online]. Available:
http://frontierindia.net/indian-investments-in-africa-touche-usd-33-b-usd-70-b-trade-expected-
by-2015
Gelb, S. 2005. South-South Investment: The Case of Africa. In Teunissen J.J. and Akkerman
A. (eds). Africa in the World Economy - The National, Regional and International
Challenges. The Hague: Fondad. December 2005. [Online]. Available: www.fondad.org
Holslag, J. 2007. The new scramble for Africa, Europe’s World. Available:
http://www.europesworld.org/NewFrancais/Accueil/Article/tabid/190/ArticleType/articleview
/ArticleID/20430/Default.aspx
IBER. 2011. India trade at a glance. India Brand Equity Foundation. [Online]. Available:
http://www.ibef.org
Trade at a glance: the BRICS’ engagement with Africa 87
BRICS: South Africa's Way Ahead?
© 2013 Trade Law Centre, National Agricultural Marketing Council, Royal Danish Embassy, Swedish Embassy Nairobi.
India. Ministry of Commerce and Industry. 2009. Highlights of Foreign Trade Policy 2009 –
2014. [Online]. Available: http://164.100.9.245/exim/2000/dn/ftpdnl/high0910-eng.pdf
KPMG. 2011. Building Relations. India-South Africa Corridor Newsletter. February 2011,
Available: http://www.pcb.org.za/upload/files/IndiaSACorridorFeb2011.pdf
Lewis, D. 2011. Special Report. In Africa, Brazil takes a different track. Thompson Reuters.
February 2011. [Online]. Available:
http://graphics.thomsonreuters.com/specials/Brazil%20in%20Africa.pdf
Lewis, J. D. 2001. Reform and Opportunity: The Changing Role and Patterns of Trade in
South Africa and SADC. Africa Region Working Paper Series No. 14
Makeeva, A. and Chaplygina, A. 2008. Russia Trade Policy. ECO-Accord: Center for
Environment and Sustainable Development. December 2008. [Online]. Available:
http://trade.ecoaccord.org/2008/trade_policy_engl.pdf
Natufe, I. O. 2011. A review of Russia-Africa relations. New challenges and new
opportunities. Geopolitics, August 2011, Volume 6, No. 7. [Online]. Available:
http://www.trcw.ru/en/articles/detail.php?ID=2791
Nedbank Group. 2011. Facts and Forecasts of Key Economic Variables. October, 2011.
[Online]. Available:
http://www.nedbankgroup.co.za/pdfs/economic/economicForecasts/2011-
10_yearlyForecast.pdf
Nestmann, T. and Orlova, D. 2008. Russia’s Outward Investment. Deutsche Bank Research.
April 30. [Online]. Available: http://www.dbresearch.de/PROD/DBR_INTERNET_EN-
PROD/PROD0000000000224964.pdf
PWC. 2008. Trade Winds: Setting Sail for Investment Opportunities in South Africa and
India. Price Waterhouse Coopers. May 22
Richardson, H. 2011. Brazil economy achieves highest growth in 25 years. [it] Decisions
Research Network. March 2011. [Online]. Available: http://itdecs.com/2011/03/brazil-
economy-achieves-highest-growth-in-25-years/

88 Trade at a glance: the BRICS’ engagement with Africa
BRICS – South Africa's Way Ahead?
© 2013 Trade Law Centre, National Agricultural Marketing Council, Royal Danish Embassy, Swedish Embassy Nairobi.
Saltanov, A. 2008. Russian relations with the sub-Saharan African countries in 2008.
Ministry Of Foreign Affairs of the Russian Federation. [Online]. Available:
http://www.mid.ru/brp_4.nsf/itogi/600123F8FC5F74B6C325752E00373694
Schuman, M. 2011. Will Japan’s earthquake shake up its economic policy? TIME, March 21.
[Online]. Available: http://curiouscapitalist.blogs.time.com/2011/03/21/will-
japan%e2%80%99s-earthquake-shake-up-its-economic-policy/#ixzz1VwgvsZwT
South Africa. Department of Trade and Industry (DTI). 2010. South Africa Investor’s
Handbook 2010. [Online]. Available:
http://www.jadafa.co.za/LinkClick.aspx?fileticket=bttsWoGEX5M%3D&tabid=173
Tarr, D.G. 2009. Political Economy of Russian Trade Policy: Early Transition, Customs
Unions, WTO Accession and Protection for Industrial Diversification, Paper prepared for
conference on “The Political Economy of Trade Policy in the BRICS” March 27-28, 2009
New Orleans, La. Available:
http://www.tulane.edu/~dnelson/PEBricsConf/Tarr%20Russia.pdf
The Beijing Axis. 2011. China Analyst. Doing Business in a Fast Changing China. Beijing:
The Beijing Axis. March. http://www.thebeijingaxis.com/en/news-a-media/the-china-analyst
The Economist. 2011. Measuring Brazil’s economy: statistics and lies. 2011. The Economist.
March 10. [Online]. Available: http://www.economist.com/node/18333018
Times of India. 2011. Indian economy will grow faster than Chinese in 2012: World Bank.
2011. Times of India, January 14. [Online]. Available:
http://timesofindia.indiatimes.com/business/india-business/Indian-economy-will-grow-faster-
than-Chinese-in-2012-World-Bank/articleshow/7280367.cms
UNCTAD. 2004. World Investment Report: The Shift towards Services. Geneva: United
Nations Conference on Trade and Development (UNCTAD).
UNCTAD. 2006. World Investment Report: FDI from Developing and Transition Economies:
Implications for Development. Geneva: United Nations Conference on Trade and
Development (UNCTAD).

Trade at a glance: the BRICS’ engagement with Africa 89
BRICS: South Africa's Way Ahead?
© 2013 Trade Law Centre, National Agricultural Marketing Council, Royal Danish Embassy, Swedish Embassy Nairobi.
UNCTAD. 2010. World Investment Prospects Survey 2010-2012. United Nations Conference
on Trade and Development (UNCTAD). [Online]. Available:
http://www.unctad.org/en/docs/diaeia20104_en.pdf
UNCTAD. 2011. World Investment Report: Non-Equity Modes of International Production
and Development. Geneva: United Nations Conference on Trade and Development
(UNCTAD).
UNCTAD. 2012. South-South Trade Monitor. Issue 1, June 2012, United Nations Conference
on Trade and Development. Geneva. [Online]. Available
http://unctad.org/en/PublicationsLibrary/webditctab2012d2_en.pdf
United States of America. Bureau of Public Affairs. 2011. Russia. [Online]. Available:
http://www.state.gov/r/pa/ei/bgn/3183.htm
WEF. 2011. Africa Competitiveness Report 2011. World Economic Forum (WEF). [Online].
Available: http://www3.weforum.org/docs/WEF_GCR_Africa_Report_2011.pdf
WTO. 2009. Brazil Trade Policy Review. Secretariat Report. Geneva: World Trade
Organisation.
WTO. 2010. China Trade Policy Review. Secretariat Report. Geneva: World Trade
Organisation. http://www.wto.org/english/tratop_e/tpr_e/tp330_e.htm
Xinhua. 2011. Backgrounder: India-Africa Forum Summit. People’s Daily Online. [Online].
Available: http://english.peopledaily.com.cn/90001/90777/90851/7385691.html
Chapter 4
Foreign Direct Investment in South Africa: the BRIC
perspective
Ron Sandrey
Investment is the fuel of economic growth, and in a closed economy, domestic savings are the
only source of investment. However, in an open economy, these domestic savings may be
augmented by borrowing from abroad (the savings of others). The objective for this chapter is
to present a recent view of investment for South Africa, both in inflows (liabilities) and
outflows (assets), with a concentration on the role of the BRIC countries (Brazil, Russia, India
and China) in these flows.
There are three categories of investment recorded by the South African Reserve Bank. These
are:
1. Foreign direct investment (FDI), as defined by the net inflow of investment to acquire
a lasting management interest (10% or more of voting stock) in an enterprise operating
in an economy other than that of the investor. It is the sum of equity capital,
reinvestment of earnings, other long-term capital, and short-term capital as shown in a
country’s balance of payments.
2. FDI is distinct from portfolio investment, which is considered to be the purchase of
stocks, bonds, and money market instruments by foreigners for the purpose of
realising a financial return, which does not result in foreign management, ownership,
or legal control.
3. In general terms, any foreign investment that is not direct or portfolio investment is
considered ‘other’ investment (loans, trade finance, currency and deposits, and other

Foreign Direct Investment in South Africa: the BRIC perspective 91
BRICS: South Africa's Way Ahead?
© 2013 Trade Law Centre, National Agricultural Marketing Council, Royal Danish Embassy, Swedish Embassy Nairobi.
assets with unaffiliated parties), and, in contrast to FDI, both foreign portfolio and
‘other’ investments have no controlling interest in their investment.
In summary, we find that South Africa has somewhat less of a call on funds held offshore
(assets) than others have on their funds held in South Africa for each of the three years from
2008 to 2010 examined. Based on 2010 data, Europe was the main destination for assets
(59.8%) and the main source for liabilities (63.3%), with this followed by the Americas for
both. Both Africa and Asia are more important as an investment destination than as an
investment source. Changes over the period show that Asia had the biggest increase in assets
by percentage but that Europe’s increase by value remained the largest. For liabilities or
inbound, Europe again displayed the largest increase but in percentage terms Europe,
Americas and Asia were very similar. In 2010, most of the total South African assets (43%)
were held in portfolio assets abroad, followed almost equally by direct and other investments.
By region, most of the 2010 portfolio is held in Europe (77%) while in Africa, Asia, the
Middle East and Oceania it is predominantly direct investment. The comparable picture for
liabilities (investments held in South Africa by others) shows that overall more is held in
portfolio than in direct investment for each year. European and Asian money in South Africa
is held more in direct investment (54% and 69% respectively), while the American money
(85%) is concentrated in portfolio investments. Examining the BRIC countries, we find that
China was the fourth most significant destination for South African assets held abroad, with
most of these assets direct investments associated with banks. A very similar position is found
for Chinese investments in South Africa (ranked at number nine in 2010), where the majority
are direct investments associated with banks. South African investments in Brazil are
predominantly portfolio investments associated with banks, while in India they are more
associated with ‘other’ investments and banks.
The overall picture for South African Foreign Direct Investment
We will start with an examination of FDI and then move to portfolio and ‘other’ investments.
Firstly, we need a discussion on the data and its interpretation used in this chapter. The data is
stock data and it has been sourced directly from the South African Reserve Bank. It is the
results of their survey data to assess the values of foreign assets in South Africa (liabilities
resulting from inflows of foreign capital) and South African assets abroad (assets resulting
from outflows of South African capital). The other data series available from the South
92 Foreign Direct Investment in South Africa: the BRIC perspective
BRICS – South Africa's Way Ahead?
© 2013 Trade Law Centre, National Agricultural Marketing Council, Royal Danish Embassy, Swedish Embassy Nairobi.
African Reserve Bank is the annual flows, or the values of capital inflows (liabilities) and
outflows (assets) to (a) FDI investment, (b) portfolio investment, or (c) ‘other’ investment, as
defined above.
From the stocks data we have analysed the annual changes to the liabilities and assets for
South Africa. This is not flows, but reported annual changes to stocks, whether they be in
foreign firms in South Africa or in South African firms abroad. An important factor here is
that by definition the stocks given by the Reserve Bank are denominated in South African
rand, while the actual values of these stocks are, of course, in the host foreign country when
they are held abroad. Consequently, the foreign currency value of the stocks held abroad will
reflect recent currency fluctuations, but they should not influence the foreign stocks in South
Africa to the same extent.1 In addition, there are profit/loss adjustments and other related
factors that need to be considered.
Inward Foreign Direct Investment (liabilities)
The next series of tables present the data2 for South African FDI inflows. Table 1 starts by
showing the cumulative FDI inflows (stocks of FDI) denominated in R1 000 million3. These
stocks increased from R81 000 million in 1997 through to R1 016 000 million in 2010. The
dominance of Europe as a source can be seen by viewing the table, with the United Kingdom
(UK), Netherlands, Germany, and Switzerland all in the top five stock totals for 2010. Also
shown are the totals from Europe4, with these ranging from a low of 71.5% in 1998 to a high
of 89.6% in 2001, and a total average of 83.5% over the period shown. Much has been made
of the role of China as a source of FDI for South Africa, but Table 1 shows that, while
certainly increasing over recent years, these stocks are still relatively modest.
1 These same fluctuations will, of course, influence the value for the mirror image of the source country’s stock in South Africa when they are viewed from that country’s perspective. 2 As at January 2012 from the South African Reserve Bank (Pieter Swart, personal communication). Neth is the Netherlands, Germ is Germany, Swiss is Switzerland, Malay is Malaysia, and Lux is Luxemburg. 3 We use the so-called ‘short’ billion of one thousand million rather than the more uncommon ‘long’ billion of one million million rand. 4 As defined by total Europe, not just European Union.

Foreign Direct Investment in South Africa: the BRIC perspective 93
BRICS: South Africa's Way Ahead?
© 2013 Trade Law Centre, National Agricultural Marketing Council, Royal Danish Embassy, Swedish Embassy Nairobi.
Table 1: South African FDI stocks, R1 000 million
Total Europe UK Neth US Germ Swiss China Japan Malay Lux
1997 81.5 61.1 37.1 4.6 12.1 10.0 3.8 0.0 1.1 3.5 0.4
1998 91.9 65.7 36.6 4.8 13.8 10.5 7.6 0.0 1.3 7.0 0.3
1999 318.6 288.0 248.3 5.4 17.3 16.8 8.4 0.0 0.9 6.6 0.7
2000 328.9 292.6 242.9 11.0 19.6 19.1 10.3 0.1 1.5 6.8 0.8
2001 370.7 332.2 281.2 10.7 18.9 22.4 6.8 0.2 2.0 6.5 2.5
2002 264.4 211.1 158.1 12.8 23.9 22.0 6.0 0.2 3.4 7.1 3.0
2003 311.2 245.7 188.3 16.1 29.5 22.9 6.1 0.2 7.1 10.0 1.8
2004 362.9 294.0 227.9 16.2 31.2 25.8 6.4 0.3 7.4 2.4 1.9
2005 499.6 425.1 350.4 14.1 32.1 29.9 10.6 0.3 9.9 2.3 2.2
2006 611.7 535.4 440.3 22.1 37.4 34.1 12.3 0.5 14.7 2.4 1.9
2007 751.9 655.9 524.2 29.0 46.3 41.4 21.3 0.5 12.9 2.3 8.6
2008 632.6 492.2 342.5 32.2 47.2 47.0 29.2 26.8 17.0 12.8 8.4
2009 866.7 691.9 468.0 91.4 55.8 58.1 28.8 34.0 17.5 14.6 10.7
2010 1,016 842.8 504.3 177.9 62.7 60.9 46.1 37.3 19.3 17.2 15.8
Source: South African Reserve Bank
Of more interest is the changes to these resource stocks (note that these are not ‘flows’), and
the highlights of these changes are shown in Table 2 (again in thousand million – or billion –
rand). These changes will reflect new inflows (investment) or outflows (disinvestment) by the
foreign firms as well as adjustments such as profit/loss data. Column 2 shows the total annual
changes, with the penultimate row showing the grand total change over the period and the
bottom row showing the percentage of the total change from that source. The grand total
change from 1998 has been R934 billion, with some distinct variations apparent. The period
through to 2005 was especially volatile, with solid increases in 1999 but major decreases in
2002 with modest changes in the other periods. From 2005 onwards, there were significant
increases with the exception of decreases in 2008. The dominance of Europe is again
apparent, although note the European (mostly UK) changes during the 2002 and the 2008
years where these changes were strong enough to dictate the overall result. China was an
important source of FDI for South Africa in 2008.

94 Foreign Direct Investment in South Africa: the BRIC perspective
BRICS – South Africa's Way Ahead?
© 2013 Trade Law Centre, National Agricultural Marketing Council, Royal Danish Embassy, Swedish Embassy Nairobi.
Table 2: Inward FDI, year on year changes, R1 000 million (billion)
Total Europe UK Neth Germ US Swiss China Japan Lux
1998 10.4 4.6 -0.5 0.2 0.6 1.7 3.8 0.0 0.2 -0.1
1999 226.8 222.4 211.6 0.6 6.3 3.5 0.8 0.0 -0.4 0.5
2000 10.2 4.6 -5.3 5.6 2.3 2.3 1.9 0.1 0.7 0.0
2001 41.8 39.6 38.2 -0.3 3.3 -0.7 -3.5 0.1 0.5 1.7
2002 -106.3 -121.1 -123.1 2.0 -0.4 5.0 -0.8 0.1 1.5 0.5
2003 46.8 34.6 30.2 3.3 0.8 5.6 0.1 0.0 3.7 -1.1
2004 51.7 48.3 39.6 0.1 2.9 1.7 0.3 0.1 0.3 0.1
2005 136.7 131.1 122.5 -2.1 4.1 0.9 4.2 0.0 2.5 0.2
2006 112.1 110.3 89.9 8.0 4.2 5.2 1.6 0.1 4.8 -0.3
2007 140.2 120.6 83.9 6.8 7.2 9.0 9.1 0.0 -1.8 6.7
2008 -119.3 -163.8 -181.7 3.3 5.6 0.8 7.9 26.3 4.1 -0.2
2009 234.0 199.7 125.6 59.2 11.1 8.6 -0.5 7.2 0.4 2.3
2010 148.9 151.0 36.2 86.5 2.8 6.9 17.4 3.3 1.8 5.1
total 934.1 781.8 467.2 173.3 50.9 50.6 42.3 37.2 18.2 15.4
% total 100% 83.7% 50.0% 18.6% 5.4% 5.4% 4.5% 4.0% 1.9% 1.7%
Source: South African Reserve Bank
Other major investors not shown over the period have been Malaysia (R10.4 billion in 2008),
France, Bermuda, and Russia. At the other extreme, Saudi Arabia disinvested slightly more
than a billion rand over the period in total, with a variation between reasonable investments
some years and disinvestments in others. Panama and ‘other Central America’ are the other
two main disinvesting sources, although these are relatively small players.
Much has been made of the so-called BRICs as a source of FDI. The data shown in Table 3
suggests that these changes are important, with China being a major FDI source in both 2008
and 2009. In particular, Chinese investments offset disinvestment from other sources in 2008.
Russia is the second most important BRIC source (inflows/increases in 2004, 2005 and 2009
but outflows/decreases in 2006), followed by India (2009) and a modest contribution from
Brazil.

Foreign Direct Investment in South Africa: the BRIC perspective 95
BRICS: South Africa's Way Ahead?
© 2013 Trade Law Centre, National Agricultural Marketing Council, Royal Danish Embassy, Swedish Embassy Nairobi.
Table 3: South African FDI annual changes from BRICs, R1 000 million
Year end Total China Russia India Brazil BRICs
Dec flows % total
1998 10.4 0.0 0.0 0.0 0.0 0.1%
1999 226.8 0.0 0.0 0.0 0.0 0.0%
2000 10.2 0.1 0.0 0.0 0.0 0.8%
2001 41.8 0.1 0.0 0.0 0.0 0.2%
2002 -106.3 0.1 0.0 0.0 0.1 0.1%
2003 46.8 0.0 0.0 0.0 0.0 0.0%
2004 51.7 0.1 6.9 0.0 0.0 13.6%
2005 136.7 0.0 4.2 0.0 0.1 3.1%
2006 112.1 0.1 -11.1 0.1 0.0 9.7%
2007 140.2 0.0 0.0 0.3 0.0 0.2%
2008 -119.3 26.3 0.0 0.3 0.0 22.3%
2009 234.0 7.2 5.4 1.5 0.0 6.0%
2010 148.9 3.3 1.7 0.2 0.2 3.6%
Source: South African Reserve Bank
Outward FDI (assets)
We next turn to the reverse ‘mirror’ side of FDI, that of the value of investment from South
Africa to control business activity elsewhere in the world. The stock data for this is shown in
Table 4, again in R1 000 million. These stocks will reflect both the initial investments and
changes to the values of these investments over time from currency changes and other factors
(such as unremitted profits/losses). Again, Europe dominates as a destination, but not as
comprehensively as it does for foreign assets (liabilities) held in South Africa. Luxemburg is
the main destination, but from there the trail is likely to be a little hard to decipher as this
destination is somewhat akin to a flag of convenience that shipping countries use. Using the
International Monetary Fund (IMF) guidelines, the Reserve Bank only reports on the ‘first
port of call’ for these funds.

96 Foreign Direct Investment in South Africa: the BRIC perspective
BRICS – South Africa's Way Ahead?
© 2013 Trade Law Centre, National Agricultural Marketing Council, Royal Danish Embassy, Swedish Embassy Nairobi.
Table 4: South African FDI foreign stocks by destination, R1 000 million (billion)
Year end (Dec)
Total Lux UK China Mauritius US Austria Nigeria
1997 113 42 32 0 1 3 0 0
1998 157 44 45 0 1 4 0 0
1999 203 42 79 -0 2 6 11 0
2000 245 58 77 0 3 11 2 0
2001 213 60 62 0 6 10 18 0
2002 190 48 36 0 3 21 27 0
2003 181 44 44 0 4 15 11 0
2004 220 51 66 2 8 15 17 5
2005 238 75 72 4 3 14 18 5
2006 354 106 80 16 34 22 22 10
2007 449 122 93 33 33 24 23 32
2008 465 54 115 29 44 27 28 28
2009 536 66 87 101 49 35 17 30
2010 593 103 99 93 53 29 25 24
Source: South African Reserve Bank
Table 5 examines the annual changes to stocks from South African outward FDI as
represented by the annual changes from Table 6. Again, this will represent both new
investments and valuation changes to existing investments. There has been much variation in
these changes, with the first three years showing consistent increases and then three years of
decreases. This is followed by seven years of increases albeit with aggregate variations from
lows in 2005 and 2008 and a high in 2006. An examination of the data shows considerable
annual variations in the individual destinations, with some significant increases taking place
in some countries while others have shown major decreases. For example, 2009 shows
increases (mostly investments in this instance) of R72 billion in China and large
disinvestments in the UK and to a lesser extent Austria, while there were disinvestments of
R68 billion in Luxemburg during 2008.

Foreign Direct Investment in South Africa: the BRIC perspective 97
BRICS: South Africa's Way Ahead?
© 2013 Trade Law Centre, National Agricultural Marketing Council, Royal Danish Embassy, Swedish Embassy Nairobi.
Table 5: Outbound South African FDI changes by destination, R1 000 million
Total Europe Africa China UK Lux Maur US Austria Nigeria
1998 44 40 3 0 13 2 0 1 0 -0
1999 46 38 1 -0 34 -2 1 2 11 0
2000 42 32 2 0 -1 16 1 5 -9 0
2001 -31 -31 3 0 -16 1 3 -1 15 -0
2002 -23 -35 -2 0 -26 -12 -3 11 9 0
2003 -9 -5 3 0 8 -4 1 -6 -16 0
2004 40 29 8 2 22 7 4 0 6 5
2005 18 24 -5 2 6 24 -5 -1 1 -0
2006 116 48 40 12 8 32 30 7 4 5
2007 94 38 25 17 13 16 -1 2 0 22
2008 16 -23 18 -4 22 -68 11 4 6 -3
2009 71 -31 13 72 -28 12 5 7 -12 2
2010 58 61 6 -9 12 36 4 -6 9 -6
Total 480 184 116 93 68 61 53 25 25 24
Total % 100% 38% 24% 19% 14% 13% 11% 5% 5% 5%
Source: South African Reserve Bank
Recent balance of payment flow data
Table 6 shows the annual balance of payment data as published by the South African Reserve
Bank for international investment flow data, where ‘liabilities’ are outflows, ‘assets’ are
inflows, ‘net’ is the balance for each sector, and ‘balance’ is the overall balance as shown.
Note that an increase in liabilities (inflow of capital) is denoted by a positive value, while a
decrease in liabilities (outflow of capital) is denoted by a negative value. For assets, the
position is reversed: an increase is a negative value (South African money leaving the
country) while a decrease is an inflow of capital denoted by a positive value. Also note that
this data is denoted in rand (million) and not in billion as in the series of tables above.
The first segment is FDI, where there was an outflow of FDI during 2006 as liabilities
declined, and for most years assets abroad increased as indicated by the negative signs. The
central segment shows that except for 2008 there have been significant portfolio inflows into
South Africa, and these are generally greater than the outflows of portfolio investment going
offshore. Note also that this portfolio flow is generally greater than the comparable FDI
values, and sometimes significantly so. Finally, the lower segment shows the ‘other’ category

98 Foreign Direct Investment in South Africa: the BRIC perspective
BRICS – South Africa's Way Ahead?
© 2013 Trade Law Centre, National Agricultural Marketing Council, Royal Danish Embassy, Swedish Embassy Nairobi.
as discussed above, and the totals here are also variable and often significant. The bottom row
is literally ‘the bottom line’ and shows the total effects.
Table 6: Overall update on balance of payment data for South Africa, R million (Flows)
Year 2003 2004 2005 2006 2007 2008 2009 2010
Direct Invest
Liabilities 5,550 5,155 42,270 -3,567 40,120 74,403 45,465 8,993
Assets -4,275 -8,271 -5,916 -41,058 -20,896 25,888 -9,757 554
Net direct 1,275 -3,116 36,354 -44,625 19,224 100,291 35,708 9,547
Portfolio Invest
Liabilities 7,548 46,262 36,188 144,501 97,485 -71,540 107,234 107,876
Assets -1,001 -5,946 -6,123 -15,044 -24,026 -63,325 -13,470 -33,374
Net direct 6,547 40,316 30,065 129,457 73,459 -134,865 93,764 74,502
Other Invest
Liabilities 14,594 10,944 32,735 60,750 58,711 47,730 -39,956 7,899
Assets -36,919 -3,555 -2,895 -38,823 2,119 82,983 23,703 -22,138
Net direct -22,325 7,389 29,840 21,927 60,830 130,713 -16,253 -14,239
Balance -14,503 44,589 96,259 106,759 153,513 96,139 113,219 69,810
Source: South African Reserve Bank, Quarterly Bulletin, December 2011
Recent global FDI patterns and the BRICs
The Organisation for Economic and Cooperation Development (OECD) regularly reports on
global FDI data and trends, and Table 7 below duplicates the data from its January 2011
update to put the BRICs in a global perspective. It shows global figures for the years 2006
through to 2010, and for 2011 data/forecasts. Flows for 2009 were down considerably on the
previous three ‘pre-crash’ years, although flows have increased over 2010 and our ‘estimates’
for 2011 have not reached pre-crash levels. OECD countries continue to be the main
attraction for FDI inflows, but the third-from-bottom line of Table 7 shows that the BRICs are
becoming increasingly attractive to investors. The penultimate line shows that as a percentage
of global inflows South Africa peaked at 0.52% in 2008, while the bottom line shows that
OECD countries, while still the destination for over half of the flows, are becoming less
attractive as a destination.
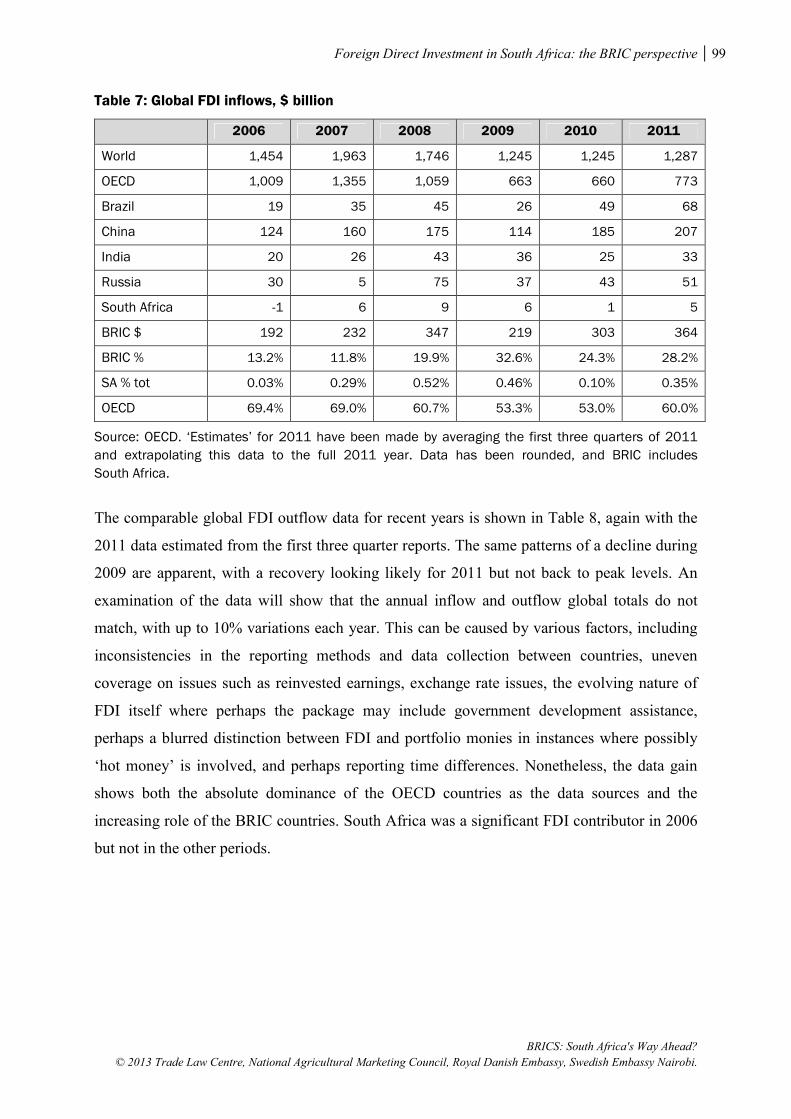
Foreign Direct Investment in South Africa: the BRIC perspective 99
BRICS: South Africa's Way Ahead?
© 2013 Trade Law Centre, National Agricultural Marketing Council, Royal Danish Embassy, Swedish Embassy Nairobi.
Table 7: Global FDI inflows, $ billion
2006 2007 2008 2009 2010 2011
World 1,454 1,963 1,746 1,245 1,245 1,287
OECD 1,009 1,355 1,059 663 660 773
Brazil 19 35 45 26 49 68
China 124 160 175 114 185 207
India 20 26 43 36 25 33
Russia 30 5 75 37 43 51
South Africa -1 6 9 6 1 5
BRIC $ 192 232 347 219 303 364
BRIC % 13.2% 11.8% 19.9% 32.6% 24.3% 28.2%
SA % tot 0.03% 0.29% 0.52% 0.46% 0.10% 0.35%
OECD 69.4% 69.0% 60.7% 53.3% 53.0% 60.0%
Source: OECD. ‘Estimates’ for 2011 have been made by averaging the first three quarters of 2011
and extrapolating this data to the full 2011 year. Data has been rounded, and BRIC includes
South Africa.
The comparable global FDI outflow data for recent years is shown in Table 8, again with the
2011 data estimated from the first three quarter reports. The same patterns of a decline during
2009 are apparent, with a recovery looking likely for 2011 but not back to peak levels. An
examination of the data will show that the annual inflow and outflow global totals do not
match, with up to 10% variations each year. This can be caused by various factors, including
inconsistencies in the reporting methods and data collection between countries, uneven
coverage on issues such as reinvested earnings, exchange rate issues, the evolving nature of
FDI itself where perhaps the package may include government development assistance,
perhaps a blurred distinction between FDI and portfolio monies in instances where possibly
‘hot money’ is involved, and perhaps reporting time differences. Nonetheless, the data gain
shows both the absolute dominance of the OECD countries as the data sources and the
increasing role of the BRIC countries. South Africa was a significant FDI contributor in 2006
but not in the other periods.

100 Foreign Direct Investment in South Africa: the BRIC perspective
BRICS – South Africa's Way Ahead?
© 2013 Trade Law Centre, National Agricultural Marketing Council, Royal Danish Embassy, Swedish Embassy Nairobi.
Table 8: Global FDI outflows, $ billion
2006 2007 2008 2009 2010 2011
World 1,376 2,170 1,902 1,122 1,355 1,536
OECD 1,188 1,932 1,636 903 1,063 1,343
Brazil 28 7 21 -10 12 -14
China 21 17 54 44 60 47
India 14 17 19 16 15 16
Russia 23 46 56 44 53 61
South Africa 6 3 -3 1 0 -1
BRIC $ 92 90 147 95 140 108
BRIC % 6.7% 4.1% 7.7% 8.5% 10.3% 7.0%
SA % total 0.44% 0.14% 0.16% 0.11% 0.01% 0.07%
OECD 86.3% 89.0% 86.0% 80.5% 78.5% 87.4%
Source: OECD. ‘Estimates’ for 2011 have been made by averaging the first three quarters of 2011
and extrapolating this data to the full 2011 year. Data has been rounded, and BRIC includes South
Africa.
To put the BRIC FDI data in perspective, we show data for flows as a percentage of the Gross
Domestic Product (GDP) for the OECD, BRICs, and South Africa over the 2006-2010 period
in Table 9 and the stocks as a percentage of GDP over the same period in Table 10. The left-
hand side of the tables shows the inflows and the right-hand side the outflows. FDI inflows
for the BRICs are generally above the developed OECD average while outflow values are
more variable.
Table 9: FDI flows as % of GDP
Inflows
Outflows
2006 2007 2008 2009 2010
2006 2007 2008 2009 2010
OECD 2.7 3.3 2.4 1.6 1.5 3.1 4.7 3.7 2.2 2.5
Brazil 1.7 2.5 2.7 1.6 2.3
2.6 0.5 1.2
0.6
China 4.6 4.6 3.9 2.3 3.1 0.8 0.5 1.2 0.9 1.0
India 2.2 2.2 3.4 2.8 1.6 1.6 1.5 1.5 1.3 1.0
Russia 3.0 4.2 4.5 3.0 2.9 2.3 3.5 3.3 3.6 3.5
South Africa 2.0 3.3 2.0 0.3 2.3 1.0 0.4
Source: OECD (Negative values are not calculated)

Foreign Direct Investment in South Africa: the BRIC perspective 101
BRICS: South Africa's Way Ahead?
© 2013 Trade Law Centre, National Agricultural Marketing Council, Royal Danish Embassy, Swedish Embassy Nairobi.
The stocks for FDI inflows into South Africa as a percentage of GDP are higher than the other
values shown, while for outflows South Africa is positioned between the mature OECD
average and the developing BRICs – with the exception of Russia.
Table 10: FDI stocks as % of GDP
Inflows
Outflows
2006 2007 2008 2009 2010
2006 2007 2008 2009 2010
OECD 26.0 29.0 26.0 30.4 30.0 30.5 34.4 33.1 39.3 39.4
Brazil 20.2 22.5 17.4 25.0 22.6
10.4 10.1 9.4 10.3 9.1
China 22.6 20.1 20.3 26.4 25.1 3.3 3.3 4.1 4.9 5.3
India 7.7 9.2 9.9 13.2 12.9 3.0 3.8 5.0 6.2 6.1
Russia 26.9 37.8 13.0 31.0 33.3 21.9 28.5 12.4 24.8 24.9
South Africa 33.6 38.6 24.7 41.5 42.1 19.5 23.0 18.1 25.7 24.6
Source: OECD (Note that the South African data for 2008 appears to be an outlier)
The African picture
The IMF (2011) found that a reorientation toward new markets is underway in sub-Saharan
Africa, with nontraditional partners now accounting for about 50% of the region’s exports and
almost 60% of its imports. This is driven mostly by Brazil, India, and China, but it is
augmented by increasing trade within the region, and the rise of emerging partners is broadly
homogeneous across the various sub-Saharan African country subgroups. A similar
reorientation is also taking place in investment flows, with China now accounting for 16% of
total FDI flows to the region and other emerging countries also making considerable
investments in sub-Saharan Africa. Chinese investment is geographically spread, while most
Indian investment is concentrated in Mauritius, and Brazil’s investment is focused on Angola,
Mozambique and, more recently, Liberia. Top destinations of Chinese investment in the
region are South Africa, Nigeria, Zambia, Niger, Ethiopia, and the Democratic Republic of
the Congo. While most of the emerging partners’ investments are in mining, Chinese
investment is also directed toward manufacturing, construction, finance, agriculture and
services while India has significant investment in Mauritius’ manufacturing sector. The
Chinese FDI profile is interesting, with packages that can involve large state-owned
enterprises linking investment in natural resources with related infrastructure projects to
adroitly avoid political interference and corruption – the so-called ‘Angolan model’. This is
not the complete picture, however, as the IMF reports that the Export-Import Bank of China

102 Foreign Direct Investment in South Africa: the BRIC perspective
BRICS – South Africa's Way Ahead?
© 2013 Trade Law Centre, National Agricultural Marketing Council, Royal Danish Embassy, Swedish Embassy Nairobi.
estimated that of the 800 Chinese companies operating in Africa in 2006, approximately 85%
were privately owned and were small or medium-sized enterprises (SMEs).
Gelb (2010) warns of the problems associated with obtaining reliable data on Chinese FDI in
South Africa, and decries much of the published literature on the subject as being of very
limited value.5 This data problem is echoed by Grimm (2011), who likens obtaining accurate
information on Chinese overseas development aid (ODA) to ‘putting together a jigsaw
puzzle’. While concentrating on Chinese ODA, Grimm expands on the very real issue of how,
for a variety of reasons, Chinese ODA and FDI become blurred, and how these problems are
accentuated in Africa. Gelb (2010) outlines the problems associated with assessing FDI stock
data of the respective two-way positions in both South Africa and China, and explains how
the different reporting practices led to much confusion on actual data. These problems include
the use of survey data methodology used in South Africa that may be incomplete in addition
to giving the option of valuations at book value or market value, the use of approvals in China
where these projects may or may not eventuate, and the general problem of FDI routed
through a third country. His assessment is that South African data probably substantially
underestimates the stock of Chinese FDI in South Africa but significantly overstates South
African stocks in China. Conversely, he considers that Chinese data seems reasonable for
Chinese stocks in South Africa but seriously underestimates South African FDI in China.
Using the EDGE FDI Database, Gelb (2010: 13) reports that there are:
[…] more than 4,100 operations of foreign firms in South Africa, of which only 47
(just over 1%) are Chinese. In addition, 19 Chinese firms entered South Africa but
subsequently withdrew while 12 firms have signalled their intention to enter but are
yet to do so, making a total of 78 Chinese firms recorded. The database also records
over 3,500 operations of South African firms (including ‘émigrés’) in the rest of the
world, of which a mere 32 are in China (also about 1%). Another seven South African
firms entered China but later withdrew, and there are nine possible future entries,
making a total of 48 firms.
For Chinese stocks in South Africa, the Industrial and Commercial Bank of China (ICBC)
with its 20% holding in Standard Bank is the largest Chinese FDI holding, followed by six
Chinese mining companies with their investments in mining and metal manufacturing.
5 He specifically states that ‘much of the information presented is erroneous, incomplete or outdated’ (Gelb, 2010: 2).

Foreign Direct Investment in South Africa: the BRIC perspective 103
BRICS: South Africa's Way Ahead?
© 2013 Trade Law Centre, National Agricultural Marketing Council, Royal Danish Embassy, Swedish Embassy Nairobi.
Conversely, only four ‘genuinely’ South African companies had holdings in China: Bidvest,
Sappi, Sasol and Naspers (Gelb, 2010).
South Africa’s Foreign Investment Position: portfolio and ‘other’
The discussion to date has concentrated upon South Africa’s FDI policies and positions over
recent years. This section will expand upon that analysis by extending the three broad
categories of FDI, portfolio and ‘other’ investment for both assets (South African investment
abroad) and liabilities (investments in South Africa by other countries), and to give a more
detailed analysis of the destination for assets and sources of liabilities. Again, the data is
sourced from the South African Reserve Bank (this will not be acknowledged in the
individual tables), and all data is expressed in R100 million amounts for the respective
December years. The data is stock data, derived from the Reserve Bank surveys. We will
present both this stock data and changes to the stock data, and again we emphasise that these
changes to the stocks are NOT flows, but merely changes to the annual stock positions. Flows
are the data for new monies coming into South Africa for liabilities and leaving South Africa
for assets abroad. Any information given in this chapter relating to changes to stock data will
include these flows and also changes in stocks from changes such as those from currency
valuations, profit/loss amounts that may or may not be remitted, and other factors.
In summary, we find that most of the South African investments abroad (assets) are held in
Europe with these investments followed by the Americas. Other destinations and sources are
much less significant. The total assets abroad are very evenly split between the three
categories of direct, portfolio, and ‘other’ investment. The most recent 2010 data for liabilities
shows that portfolio investments are somewhat more significant than direct investments, with
‘other’ investments a more distant third.
The big picture
Table 12 starts by giving the broad overall aggregate position for the December year 2008
through to and including 2012 for both assets and liabilities. The ‘Change 10/08’ is the
amount with which the investment position changed in 2012 from the 2008 position, while
‘Change 10/08 %’ is the relevant percentage change for that same period. The ‘% share 2010’
denotes the relevant shares of the total for 2010. The term ‘IntOrg’ is the investment position
relating to International Organisations.

104 Foreign Direct Investment in South Africa: the BRIC perspective
BRICS – South Africa's Way Ahead?
© 2013 Trade Law Centre, National Agricultural Marketing Council, Royal Danish Embassy, Swedish Embassy Nairobi.
Table 12: South African investment assets and liabilities, R100 million
Assets Total Europe America Africa Asia IntOrg MidEast Oceania
2008 Totals 17,138 9,837 4,312 1,414 489 642 218 226
2009 Totals 18,137 10,352 3,781 1,528 1,203 769 253 252
2010 Totals 20,358 12,172 4,058 1,622 1,173 779 285 269
Change 3,221 2,335 -253 208 684 136 68 43
Change % 15.8% 19.2% -6.2% 12.9% 58.3% 17.5% 23.7% 16.0%
% share 2010 100% 59.8% 19.9% 8.0% 5.8% 3.8% 1.4% 1.3%
Liabilities Total Europe America Asia Africa IntOrg MidEast Oceania
2008 Totals 18,189 11,509 4,472 917 825 314 112 40
2009 Totals 20,899 13,354 5,402 1,010 707 257 135 35
2010 Totals 24,845 15,718 6,697 1,182 840 202 117 88
Change 10/08 6,656 4,209 2,226 265 16 -112 5 48
Change 10/08 % 26.8% 26.8% 33.2% 22.5% 1.9% -55.6% 3.9% 54.5%
% share 2010 100% 63.3% 27.0% 4.8% 3.4% 0.8% 0.5% 0.4%
Source: South African Reserve Bank
The table highlights that:
• South Africa has somewhat less of a call on funds held offshore (assets) than others
have on their funds held in South Africa for each of the three years.
• Based on 2010 data, Europe was the main destination for assets (59.8%) and the main
source for liabilities (63.3%), followed by the Americas for both.
• Both Africa and Asia are more important as an investment destination than an
investment source, while IntOrg is the destination for a modest 3.8% of South African
foreign investments.
• MidEast and Oceania hold 1.4% and 1.3% of the assets, respectively, but are minor
sources for the liabilities.
• Changes over the period show that Asia had the biggest increase in assets by
percentage but Europe retained the largest increase by value. For liabilities or inbound,
Europe again displayed the largest increase but in percentage terms, Europe, the
Americas and Asia were very similar.

Foreign Direct Investment in South Africa: the BRIC perspective 105
BRICS: South Africa's Way Ahead?
© 2013 Trade Law Centre, National Agricultural Marketing Council, Royal Danish Embassy, Swedish Embassy Nairobi.
In Table 13, the three investment categories of FDI, portfolio and ‘other’ are shown by region
for assets for the years 2008-2010 by total and then 2010 by (a) percentage share held by each
region in the three categories in 2010, and in the lower part of the table, (b) percentage share
held by each region of the three categories in 2010.
Table 13: South African foreign investment abroad (assets) by region & category
Total Europe America Africa Asia IntOrg MidEast Oceania
Assets (R100 m)
2008 Direct 4,648 2,537 341 1,022 335 1 200 214
2008 Portfolio 6,018 4,242 1,640 103 20 1 9 4
2008 Other 6,471 3,059 2,331 289 134 640 9 8
2008 Total 17,138 9,837 4,312 1,414 489 642 218 226
2009 Direct 5,357 2,228 462 1,157 1,057 1 230 221
2009 Portfolio 7,126 5,380 1,593 88 36 8 12 9
2009 Other 5,655 2,744 1,727 283 110 759 10 22
2009 Total 18,137 10,352 3,781 1,528 1,203 769 253 252
2010 Direct 5,932 2,834 431 1,218 971 1 245 232
2010 Portfolio 8,696 6,737 1,768 92 45 11 28 15
2010 Other 5,730 2,602 1,859 313 156 766 12 22
2010 Total 20,358 12,172 4,058 1,622 1,173 779 285 269
Assets – (a) % share held by each region in the three categories in 2010
Direct 29% 23% 11% 75% 83% 0% 86% 86%
Portfolio 43% 55% 44% 6% 4% 1% 10% 6%
Other 28% 21% 46% 19% 13% 98% 4% 8%
2010 Total 100% 100% 100% 100% 100% 100% 100% 100%
Assets – (b) % share held by each region of the three categories in 2010
Direct 100% 48% 7% 21% 16% 0% 4% 4%
Portfolio 100% 77% 20% 1% 1% 0% 0% 0%
Other 100% 45% 32% 5% 3% 13% 0% 0%
2010 Total 100% 60% 20% 8% 6% 4% 1% 1%
Source: South African Reserve Bank
In 2010, most of the total South African assets (43%) were held in portfolio assets abroad,
followed almost equally by direct and other investments. In 2008, however, there was more
held in ‘other’ than in portfolio. By region, most of the 2010 portfolio is held in Europe (77%)

106 Foreign Direct Investment in South Africa: the BRIC perspective
BRICS – South Africa's Way Ahead?
© 2013 Trade Law Centre, National Agricultural Marketing Council, Royal Danish Embassy, Swedish Embassy Nairobi.
while in Africa, Asia, the Middle East and Oceania it is predominantly direct. Investments
held in International Organisations are almost exclusively ‘other’.
The comparable picture for liabilities (investments held in South Africa by others) is shown in
Table 14, for 2008-2010 and by percentage shares for 2010, as in Table 13. Overall, there is
more held in portfolio than in direct for each year. European and Asian money is held more in
direct (54% and 69% respectively), while the American money (85%) is concentrated in
portfolio investments. The International Organisation money is almost exclusively ‘other’,
and ‘other’ is also the main African investment.
Table 14: Foreign investment in South Africa (liabilities) by region & category
Total Europe America Africa Asia IntOrg MidEast Oceania
Liabilities (R100 m)
2008 Direct 6,326 4,922 652 52 619 1 64 16
2008 Portfolio 7,971 4,149 3,406 267 139 0 3 7
2008 Other 3,891 2,439 414 505 159 312 46 17
2008 Total 18,189 11,509 4,472 825 917 314 112 40
2009 Direct 8,667 6,973 801 59 721 2 95 16
2009 Portfolio 9,337 4,551 4,353 278 140 1 5 8
2009 Other 2,895 1,830 248 370 148 255 35 10
2009 Total 20,899 13,354 5,402 707 1,010 257 135 35
2010 Direct 10,155 8,499 735 66 810 2 28 15
2010 Portfolio 11,923 5,621 5,691 306 197 1 43 63
2010 Other 2,767 1,598 271 468 175 199 45 10
2010 Total 24,845 15,718 6,697 840 1,182 202 117 88
Liabilities – % share held by each region in the three categories in 2010
Direct 41% 54% 11% 8% 69% 1% 24% 17%
Portfolio 48% 36% 85% 36% 17% 0% 37% 72%
Other 11% 10% 4% 56% 15% 99% 39% 11%
2010 Total 100% 100% 100% 100% 100% 100% 100% 100%
Liabilities – % share held by each region of the three categories in 2010
Direct 100% 84% 7% 1% 8% 0% 0% 0%
Portfolio 100% 47% 48% 3% 2% 0% 0% 1%
Other 100% 58% 10% 17% 6% 7% 2% 0%
2010 Total 100% 63% 27% 3% 5% 1% 0% 0%
Source: South African Reserve Bank

Foreign Direct Investment in South Africa: the BRIC perspective 107
BRICS: South Africa's Way Ahead?
© 2013 Trade Law Centre, National Agricultural Marketing Council, Royal Danish Embassy, Swedish Embassy Nairobi.
The investment positions for the seven main individual countries for assets and liabilities over
the 2008-2010 period are shown in Table 15. The UK and the US are the two main
destinations and sources, while Luxemburg and China are third and fourth for assets. Also
note that Mauritius is a popular destination for South African funds, and more will be shown
on these investments later. Assets in the US have declined over the period (recall that
currency fluctuations may play a part in this), while those in both China and Bermuda have
increased sharply. The Netherlands is the third main caller on foreign investments (liabilities)
in South Africa, as these investments increased by some 77.8% over the period. Not shown is
that for liabilities, China ranked at number nine in 2010.
Table 15: Investment positions for the seven main countries in both assets & liabilities
Assets Total UK US Lux* China Berm* IntOrg Maur*
2008 17,138 6,266 3,744 996 312 426 628 468
2009 18,137 6,924 2,827 1,115 1,035 800 758 536
2010 20,358 8,213 2,995 1,513 959 866 762 586
Change 3,221 1,947 -749 517 646 440 134 117
Change % 15.8% 23.7% -25.0% 34.2% 67.4% 50.8% 17.5% 20.0%
Liabilities Total UK US Neth* German Swiss Belgium Lux
2008 18,189 7,148 4,248 406 914 686 433 383
2009 20,899 8,494 5,129 966 884 701 397 446
2010 24,845 9,279 6,569 1,829 904 854 740 695
Change 10/08 6,656 2,131 2,321 1,424 -10 168 307 313
Change 10/08 % 26.8% 23.0% 35.3% 77.8% -1.1% 19.7% 41.5% 45.0%
* Lux is Luxemburg, Berm is Bermuda, Maur is Mauritius, and Neth is Netherlands.
The investment patterns for the world as shown in Table 16 are a more complex picture,
although most, but certainly not all, of the capital is associated with the private sector. Assets
held abroad with Monetary Authorities in Europe, America and International Organisations
are significant, as are the liabilities associated with South African banks.

108 Foreign Direct Investment in South Africa: the BRIC perspective
BRICS – South Africa's Way Ahead?
© 2013 Trade Law Centre, National Agricultural Marketing Council, Royal Danish Embassy, Swedish Embassy Nairobi.
Table 16: Details on assets and liability investment for world, R100 million at 2010
Europe America Africa Oceania MidEast Asia IntOrg Total
Assets (2010)
Direct total 2,834 431 1,218 232 245 971 1 5,932
Public corporations 0 0 35 0 0 5 0 40
Banks 0 0 0 0 0 2 0 3
Private sector 2,833 431 1,182 232 245 964 1 5,889
Portfolio total 6,737 1,768 92 15 28 45 11 8,696
Banks 159 98 37 4 0 12 0 309
Private sector 6,578 1,670 55 11 28 33 11 8,387
Other total 2,602 1,859 313 22 12 156 766 5,730
Monetary authority 793 1,554 1 0 0 0 751 3,098
Public corporations 14 16 63 0 0 0 0 93
Banks 1,589 182 153 14 7 117 14 2,076
Private sector 167 108 97 7 5 39 1 424
Liabilities (2010)
Direct total 8,499 735 66 15 28 810 2 10,155
Banks 624 69 0 0 0 382 0 1,075
Private sector 7,875 666 66 15 28 428 2 9,080
Portfolio total 5,621 5,691 306 63 43 197 1 11,923
Public authorities 1,180 868 41 0 0 51 0 2,141
Public corporations 140 33 9 0 0 1 0 183
Banks 504 519 74 0 3 17 1 1,118
Private sector 3,796 4,271 183 63 40 127 0 8,480
Other total 1,598 271 468 10 45 175 199 2,767
Monetary authority 0 0 40 0 0 0 191 231
Public authorities 188 0 0 0 0 1 1 190
Public corporations 207 13 96 0 0 34 0 350
Banks 956 82 277 3 40 46 7 1,411
Private sector 246 176 56 7 5 94 1 585
Source: South African Reserve Bank
Again we have isolated out the BRIC countries of Brazil, Russia, India and China in Table 17.
Referring back to Table 4, we can see that China was the fourth most significant destination
for South African assets held abroad, and Table 17 shows that most of these assets are direct
investments associated with banks. A very similar position is found for Chinese investments

Foreign Direct Investment in South Africa: the BRIC perspective 109
BRICS: South Africa's Way Ahead?
© 2013 Trade Law Centre, National Agricultural Marketing Council, Royal Danish Embassy, Swedish Embassy Nairobi.
in South Africa, where the majority are direct investments associated with banks.
South African investments in Brazil are predominantly portfolio investments associated with
banks, while in India they are more associated with ‘other’ and banks. For BRIC investment
in South Africa, China is the main player and again it is direct investment in banks.
Table 17: Details on South African assets and liability investment with BRICs, R100
million at 2010
BrazilBrazilBrazilBrazil RussiaRussiaRussiaRussia IndiaIndiaIndiaIndia ChinaChinaChinaChina
Assets (2010)
Direct total 6.0 4.5 10.6 928.1
Public corporations
5.0
Private sector 6.0 4.5 5.6 928.1
Portfolio total 66.5 0.6 8.6 11.7
Banks 64.2
3.3 8.4
Private sector 2.3 0.6 5.3 3.2
Other total 13.2 0.9 20.5 18.9
Banks 12.1 0.9 12.0 11.4
Private sector 1.1
8.5 7.4
Liabilities (2010)
Direct total 3.8 70.6 25.1 372.5
Banks
8.1 359.2
Private sector 3.8 70.6 17.0 13.3
Portfolio total
0.3 17.4
Banks
0.3 0.6
Private sector
0.0 16.8
Other total 5.8 0.2 9.5 66.3
Banks 0.1 0.1 3.9 24.4
Private sector 5.7 0.1 5.6 41.9
Source: South African Reserve Bank

110 Foreign Direct Investment in South Africa: the BRIC perspective
BRICS – South Africa's Way Ahead?
© 2013 Trade Law Centre, National Agricultural Marketing Council, Royal Danish Embassy, Swedish Embassy Nairobi.
References
Creamer, T. 2011. FDI inflows to SA slumped 70% in 2010, recovery expected in 2011.
Polity.org.za, 26 July. [Online]. Available: http://www.polity.org.za/article/unctad-2011-07-
26
Gelb, S. 2010. Foreign Direct Investment Links between South Africa and China. Paper
prepared for the African Economic Research Consortium project on China-Africa Economic
Relations. 2010. [Online]. Available: www.aercafrica.org
Gelb, S. and Black, A. 2007. Foreign Direct Investment in South Africa. [Online]. Available:
http://www.dfid.gov.uk/R4D/PDF/Outputs/CNEM/drc07_south_africa.pdf
Grimm, S. 2011. Transparency of Chinese aid: an analysis of the published information on
Chinese external financial flows. Stellenbosch: Centre for Chinese Studies.
IMF. 2011. Sub-Saharan Africa: sustaining the expansion. World Economic and Financial
Surveys, Regional Economic Outlook, 2011. Washington, D.C.: International Monetary Fund.
October.
OECD. 2012. FDI in figures. Secretariat of the OECD Investment Committee, Investment
Division.
South African Reserve Bank. 2011a. Annual Economic Report.
South African Reserve Bank. 2011b. Quarterly Economic Bulletin.

Chapter 5
Chinese domination of the African industrial goods
market
Ron Sandrey, Taku Fundira and Hans Grinsted Jensen
Introduction
Sandrey and Edinger (2011) show that while a succession of Asian countries have exhibited
dramatic growth over the last thirty to fifty years, Africa has largely stagnated. This Asian
expansion has been driven by manufacturing exports to the United States (US) in particular,
and has been enabled through an overall constructive policy package that opened markets,
implemented favourable trade and exchange rate policies, and provided a sound and stable
government that inspired investment and secured property rights. Conversely, Africa has
been unable to put the full package in place, and this has resulted in a manufacturing sector
whose contribution to both Gross Domestic Product (GDP) and export shares is significantly
below the continent’s developing-country peers. Growth in natural resource-rich developing
countries in general has lagged behind those with a manufacturing focus, and this is
especially the case in Africa with its poor linkages to unskilled labour and its appetite for
rent-seeking activities. Africa’s industrial base is not as robust as theory suggests it should be.
Except for South Africa, manufacturing exports are notably absent, with only textiles and
clothing featuring in those countries where manufacturing also features. Importantly, Africa
has failed to capitalise on its significant tariff preferences into the US. Sandrey and Edinger
(2011) examined the thesis that China is making it harder for Africa to diversify away from
its natural resource-based export profile.

112 Chinese domination of the African industrial goods market
BRICS – South Africa's Way Ahead?
© 2013 Trade Law Centre, National Agricultural Marketing Council, Royal Danish Embassy, Swedish Embassy Nairobi.
We consider that over a similar period of time, South Africa has emerged from an isolationist
period and endeavoured to leverage upon its undoubted industrial capacity by enhancing
manufacturing exports; and it is natural to assume that South Africa would have some
advantage in its own ‘backyard’ of the African continent. The objective of this chapter is to
build upon Sandrey and Edinger’s proposition and to assess the recent export performance of
South African industrial goods to the African market against the rise of China in that same
market. We shall do this by analysing the World Trade Atlas data for both South Africa and
China over the period, both at the aggregate level to assess the big picture, and, at the more
detailed levels, to examine the niche markets where South Africa may be outperforming
China, or, in a more pessimistic scenario, examine where South Africa at least is doing
comparatively better. In taking the approach of assessing South Africa against China we are
ignoring the possibility that a third party such as the US, European Union (EU) or India, for
example, may be doing even better than China. And while we recognise that these third
parties may be competing in several products, we consider that, given China’s global
dominance, assessing South Africa against the Chinese benchmark provides an adequate
analysis of South Africa’s industrial performance in Africa.
Data and methodology issues
In an ideal world we would use the individual import data for each and every African
country. However, when examining African trade data we are not in an ideal world, and the
usual global data sources such as Comtrade are often forced to use so-called mirror data for
many of the African countries. This is used when a more reliable partner’s export data is
viewed as the mirror for the import data, a system that is generally reliable but still leaves
unanswered the question of what to do with African partners when none have reliable data.
Therefore, given that our examination is focused upon South Africa’s export performance
against China, we will use the primary sources of export–to-Africa data in each case. To
standardise the data series we have netted out Chinese exports to the Southern African
Customs Union (SACU) from Chinese exports to Africa, so we are consistently examining
both South African and Chinese export data to non-SACU Africa.
As we are concentrating the analysis on manufactured products, we use the International
Standard for Industrial Classification (ISIC) Revision 4 codes that are translated to the HS
system to guide us in the selection process of manufactured goods only. The ISIC is a United

Chinese domination of the African industrial goods market 113
BRICS: South Africa's Way Ahead?
© 2013 Trade Law Centre, National Agricultural Marketing Council, Royal Danish Embassy, Swedish Embassy Nairobi.
Nations (UN) classification system which is widely used in classifying data according to a
kind of economic activity in the fields of production. Furthermore, agricultural manufactured
products were not included in the analysis.
To calculate growth rates we used the compound annual growth rate (CAGR), which is
calculated by taking the nth root of the total percentage growth rate, where n is the number of
years in the period being considered. This can be written as follows:
Furthermore, we calculated weighted averages for the review period under consideration to
get the value for each specific period. Therefore, the value reflected for the period, for
example 1996-2000, is a weighted average of the values recorded from 1996 through to 2000.
Data analysis – the big picture
Data for Chinese industrial exports to Africa are shown in Table 1. The data is grouped in
four sets. The first two sets show the exports from China to Africa in total (including SACU)
for the periods 1996-2000 (inclusive) and 2007-2011 (again inclusive), while the right-hand
side of the table shows just the exports to SACU for the same periods. For the first time
period, 1996-2000, exports to Africa averaged $3,022 million with a growth rate of 19%. By
the second period these exports had increased to an average of $49,223 million and the
growth rate over the period was 12%. Similarly, for 1996-2000, exports to SACU were $489
million on average, with a growth of 14% over the period. The extreme right-hand set shows
that exports to SACU over the latest 2007-2011 period were $8,508 million with an
associated growth rate of 17%. Thus, Chinese exports to non-SACU Africa were increasing
faster than the comparable exports to SACU over the period.
Table 1: Chinese industrial exports to Africa, both total and SACU
Manufactures: all minus agro-products and mineral products. 5-year average $ million & growth rate
Chinese exports to Africa (1996-2000)
Chinese exports to Africa (2007-2011)
Chinese exports to SACU (1996-2000)
Chinese exports to SACU (2007-2011)
(US$) CAGR (US$) CAGR (US$) CAGR (US$) CAGR
$ million 3,022 19% 49,223 12% 489 14% 8,508 17%
Source: Global Trade Atlas data, tralac analysis.

114 Chinese domination of the African industrial goods market
BRICS – South Africa's Way Ahead?
© 2013 Trade Law Centre, National Agricultural Marketing Council, Royal Danish Embassy, Swedish Embassy Nairobi.
Table 2 shows firstly the Chinese exports to non-SACU Africa on the left-hand side, and then
the Republic of South Africa (SA) exports to non-SACU Africa on the right-hand side, for
the two periods under examination. Note that from this point on we shall refer to non-SACU
Africa just as ‘Africa’ for simplicity. The bottom line in Table 2 clearly shows the rising
dominance of China over the period. In the 1996-2000 period, South African exports were
65% of the Chinese exports, but by the latter period this reduced dramatically to just 14.8%.
Table 2: Chinese and SA industrial exports to Africa, excluding SACU
Manufactures exports to non-SACU Africa, Chinese & SA. 5-year average $ million & growth rate
Chinese exports to Africa (1996-2000)
Chinese exports to Africa (2007-2011)
SA exports to Africa (1996-2000)
SA exports to Africa (2007-2011)
(US$)
(US$)
(US$) CAGR (US$) CAGR
$million 2,533
40,715
1,647 0.44% 6,038 12%
SA exports as % Chinese exports 65% 14.8%
Source: Global Trade Atlas data, tralac analysis
This data is represented in graphical form in Figure 1, where Chinese exports to Africa in
total are represented in the top line with their exports to non-SACU below that (the difference
being exports to SACU), and South African exports are shown in the lower line. During the
early years there was little difference between China and South Africa, but from around the
new millennium, Chinese exports really took off while those from South Africa increased
modestly at best.
Figure 1: SA and Chinese manufacturing exports to Africa, $ million
Source: Global Trade Atlas data, tralac analysis
0
10,000
20,000
30,000
40,000
50,000
60,000
70,000
US$ m
illions
RSA exports
China exports
China non SACU

Chinese domination of the African industrial goods market 115
BRICS: South Africa's Way Ahead?
© 2013 Trade Law Centre, National Agricultural Marketing Council, Royal Danish Embassy, Swedish Embassy Nairobi.
The next level down
Table 3 shows the more disaggregated HS Chapters for the comparable time periods. These
chapters are ranked by the average value of South African to Africa exports for the period
2007-2011 inclusive. Column 1 and 2 show the HS codes and descriptions respectively, while
3 and 4 show the values of Chinese exports for the first and second periods respectively. The
comparable export data for South Africa is displayed in Columns 5 and 6, while the ratios of
the South African exports to the Chinese exports are shown in Columns 7 and 8. The
combined average values of the exports are in Column 9, while the final Column 10 indicates
where South Africa is doing relatively better in that particular chapter. Note that relatively
better is defined as South African exports doing better than the average, and it is not an
absolute advantage.
The table shows that South Africa is doing relatively better in several chapters (as expected),
given that these only have to be above the overall position. Notable are Chapters 85
(electrical machinery), 90 (optical and medical instruments), 34 (soaps, etc.), and 33
(perfumes, etc.). Not shown is that South Africa has an absolute advantage only in HS 88
(aircraft), 86 (railway equipment), and 42 (leather articles). None of these chapters are
important trade lines for South Africa, although the export of aircraft and parts has averaged
around $82 million in the most recent five-year period. Where the values in Column 8 are
above 1.0, South African exports still outrank Chinese exports to Africa, and there are some
examples of this happening. However, in most cases, these Column 8 values are declining on
the Column 7 values, showing that China is making inroads even in these chapters.

116 Chinese domination of the African industrial goods market
BRICS – South Africa's Way Ahead?
© 2013 Trade Law Centre, National Agricultural Marketing Council, Royal Danish Embassy, Swedish Embassy Nairobi.
Table 3: China vs South African manufacturing goods, HS Chapters $ million and ratios
China to non-
SACU SA to Africa
Ratio SA/China
Totals Relative
HS Product description 1st 2nd 1st 2nd 1st 2nd Av. 2nd
1 2 3 4 5 6 7 8 9 10
2,069.7 33,370.6 1,647.2 6,026.6 0.80 0.18 39,397.26
84 Machinery 238.7 5,485.4 385.5 1,395.9 1.61 0.25 6,881.38
87 Motor vehicles 115.9 3,762.6 264.0 1,153.8 2.28 0.31 4,916.43
85 Electrical machinery 260.1 4,686.0 101.3 587.8 0.39 0.13 5,273.81 better
39 Plastic 34.8 1,076.0 135.8 471.0 3.91 0.44 1,547.00
48 Paper, paperboard 1.8 348.0 99.9 352.9 54.91 1.01 700.99
31 Fertilisers 0.1 84.7 87.3 201.2 large 2.38 285.86
90 Optical, medical instr 30.0 520.8 35.0 196.9 1.17 0.38 717.65 better
38 Misc. chemical products 7.0 200.2 30.9 174.3 4.39 0.87 374.49
40 Rubber 55.6 1,110.7 49.9 173.6 0.90 0.16 1,284.31
34 Soap, wax, etc. 19.3 204.9 42.6 167.1 2.22 0.82 372.00 better
33 Perfumery, cosmetic, etc 6.6 45.8 32.8 159.7 4.97 3.48 205.49 better
94 Furniture and bedding 31.6 926.2 44.3 136.8 1.40 0.15 1,062.99
28 Inorganic chemicals, etc. 23.4 270.8 52.1 112.3 2.23 0.41 383.17
30 Pharmaceuticals 41.1 299.7 48.0 95.6 1.17 0.32 395.35 better
32 Tanning, dye, paint 34.5 155.5 28.3 91.9 0.82 0.59 247.41 better
88 Aircraft 22.9 12.8 29.5 81.9 1.29 6.38 94.71 better
36 Explosives 7.0 16.2 30.3 69.2 4.31 4.27 85.40 better
29 Organic chemicals 29.3 405.7 23.6 63.3 0.81 0.16 469.00
49 Book & newspaper, etc. 0.8 28.2 12.0 49.1 15.96 1.74 77.31
86 Railway 40.1 84.7 11.5 43.9 0.29 0.52 128.58 better
44 Wood 1.1 250.8 15.6 41.1 14.57 0.16 291.92
63 Misc textile articles 25.6 505.0 12.1 35.0 0.47 0.07 540.03
89 Ships and boats 62.4 2,554.2 2.5 23.8 0.04 0.01 2,578.00 better
62 Woven apparel 131.7 636.3 9.2 19.0 0.07 0.03 655.23 better
64 Footwear 153.8 1,137.6 6.2 18.5 0.04 0.02 1,156.09 better
95 Toys and sports equip 12.9 156.4 1.8 17.5 0.14 0.11 173.95 better
35 Albumins, etc. 0.9 53.1 3.6 16.4 3.94 0.31 69.45
61 Knit apparel 119.0 1,646.4 4.1 12.7 0.03 0.01 1,659.15
96 Miscellaneous manufact 38.4 351.0 2.0 10.5 0.05 0.03 361.46 better
59 Impregnated text fabrics 5.5 248.7 4.9 8.6 0.88 0.03 257.30
37 Photographic/Cinematogr 0.4 21.2 4.0 5.7 10.03 0.27 26.88
42 Leathr art; saddlery; bags 45.5 464.5 0.4 5.3 0.01 0.01 469.82 better
56 Wadding, felt, rope 17.4 223.7 1.4 5.1 0.08 0.02 228.81 better
Below $5 million SA ex 454.7 5,396.5 17.2 21.0 0.04 0.00 5,417.5
Grand Total 2,069.7 33,370.6 1,646.9 6,039.3 0.80 0.18
Source: Global Trade Atlas data, tralac analysis

Chinese domination of the African industrial goods market 117
BRICS: South Africa's Way Ahead?
© 2013 Trade Law Centre, National Agricultural Marketing Council, Royal Danish Embassy, Swedish Embassy Nairobi.
The detailed analysis
This section will examine the data at the detailed HS 6 line level for the two periods. For the
first 1996-2000 period, there were 1,440 lines where aggregated trade was at least $10,000,
and, as noted above, the total South African exports were some 79.6% of the Chinese total
over this period. Further analysis shows that of these 1,440 lines, there were 456 where China
was not competing with South Africa, and that some 40.6% of the total South African exports
over the period were in these lines that were uncontested by China. Conversely, there were
559 lines where South Africa was not competing with China, and these lines comprised some
47.1% of the total China exports to non-SACU Africa by value. Thus, in each case, nearly
half of the trade lines were uncontested by either China or South Africa, as the case may be.
By the second period, the full might of China’s industrial export performance was starting to
become apparent. There was now trade in a total of 2,460 HS 6 lines, and South Africa was
not competing in 1,125 lines (or 45.7% of the total). These lines comprised 29.6% of the total
Chinese exports. Conversely, there were a fewer 245 lines where China was not competing,
and these lines comprised a minor niche export value of $261.8 million or 4.3% of the South
African total. Further illustrating the dominance of China, in the second period, there were
118 lines where South Africa had been exporting in the first period but was no longer
exporting. Earlier exports in these lines were 4.5% of the South African total in the first
period. We would caution, however, that changes to the detailed HS 6 line classifications in
some HS chapters may have been a minor factor here.
South African exports are concentrated, with 61.1% of the trade in HS 6 lines where the
exports were at least $10 million each. In these 130 lines, China was not competing in only 4
lines, whereas in the first period, China was not competing in 55 lines (42%). Of these four
lines where China was not competing, three were in Chapter HS 33 (cosmetics, etc.), while
the fourth was a paper product, and the total South African exports were $56.8 million. In
each period, the combined total exports as a percentage were very similar, with 27.6% in the
first period and a marginally higher 28.7% in the second period. Further evidence of the
Chinese competition is that in the first period, South African exports in these lines were
$816.2 million or 3.91 times the Chinese figure of $208.7 million. By the second period,
China had increased its exports to $7,611 million, a figure just over double the South African
figure of $3,681 million. Thus, even in the South African strongholds, overall China was
making major inroads.

118 Chinese domination of the African industrial goods market
BRICS – South Africa's Way Ahead?
© 2013 Trade Law Centre, National Agricultural Marketing Council, Royal Danish Embassy, Swedish Embassy Nairobi.
Of these 130 lines where South African exports were greater than $10 million, some 60 lines
had greater export values than their Chinese equivalents (including the four lines where
China was not competing). These dominant South African exports totalled $2,320 million or
38.5% of the South African total, and this total was 3.02 times the Chinese equivalent overall.
The dominance, however, was down from a figure of 12.15 times in the first period, when
China was not exporting in 37 of the 130 lines.
The main individual HS 6 line exports from South Africa for the second period are shown in
Table 4 below. Vehicles for the transportation of goods (trucks and vans) are the major export
line, and here South Africa dominates the market. Second below this is the export of
passenger vehicles, and it can clearly be seen that China is making inroads here as its five-
year average is almost as much as South Africa’s despite a very low export average in the
Table 4: South Africa’s main export lines to Africa relative to China, 2nd period $ million
HS Description China to Africa $m SA to Africa $m SA ratio
1st 2nd 1st 2nd 1st 2nd
Total
2,069.7 33,370.6 1,647.2 6,026.6 0.8 0.2
870421 Trucks/vans 2.6 152.8 56.8 530.1 22.1 3.5
870323 Cars 2.0 103.7 47.1 116.7 23.4 1.1
390210 Polypropylene 0.0 3.1 20.5 110.4 large 35.3
847490 Parts mining gear 1.7 65.1 17.1 98.1 10.2 1.5
310520 Fertiliser 0.0 7.3 40.4 87.3 large 12.0
480256 Paper & paperboard 0.0 3.0 0.0 82.0 large 27.4
843149 Machinery parts 3.0 70.7 12.5 78.2 4.2 1.1
870431 Trucks/vans 2.8 87.0 23.3 73.3 8.3 0.8
870410 Dumper trucks 3.0 105.4 21.2 70.7 7.0 0.7
300490 Medicaments 12.8 128.8 25.4 64.1 2.0 0.5
390230 Propylene 0.0 1.5 4.1 60.8 large 39.4
902830 Electricity meters 1.4 26.1 3.2 57.3 2.3 2.2
401120 Tyres 22.0 555.6 23.2 55.5 1.1 0.1
841391 Pump parts 1.1 19.7 8.6 54.7 7.9 2.8
841381 Pumps 2.3 21.4 5.8 50.1 2.5 2.3
380850 Chemicals 0.0 0.5 0.0 46.4 large 99.1
940600 Prefab buildings 1.3 152.7 8.0 39.5 5.9 0.3
Source: Global Trade Atlas data, tralac analysis

Chinese domination of the African industrial goods market 119
BRICS: South Africa's Way Ahead?
© 2013 Trade Law Centre, National Agricultural Marketing Council, Royal Danish Embassy, Swedish Embassy Nairobi.
first period. In several of these lines South Africa is the dominant trader, but in every instance
China is gaining export share.
The 2012 Chinese data update
Trade data for China for the 2012 year became available as this chapter went to print.
Overall, merchandise exports to Africa increased by 17.4%, while those to South Africa
increased by a slightly lesser 14.8%. These increases were above the global average of
8.41%, and significantly above the decline to EU of 6.05%. By destination, Nigeria at
number two stayed virtually the same, while further down there were significant increases to
Ghana, Algeria and Togo, and at number eleven exports to Libya more than doubled. There
appears to be few notable changes at the commodity level overall; vessels for goods and
passengers declined by a third while further down the list furniture more than doubled.
The other BRIC countries’ manufacturing exports to Africa: the data analysis
While the primary focus of this chapter is on Chinese manufacturing exports to Africa, it
behoves us to also look over South Africa’s shoulder at competition in Africa from the other
of the BRIC countries (Brazil, Russia and India). These exports are shown in Table 5, along
with Chinese and South African exports. The manufacturing exports to the world are shown
in the first section and their manufacturing exports to Africa in the lower section, along with
their associated growth from 2006 to 2011, shown as a ratio of 2011 over 2006, and the
relative shares destined for Africa of their total manufacturing exports. Several points can be
highlighted from this table. Chinese dominance of both exports to the world and exports to
Africa is apparent, although Indian growth to the world over the period is greater than that of
China’s growth to the world, while India is only marginally below China’s growth in
merchandise exports to Africa. Exports to the world are very similar for both Brazil and
Russia, with both around 50% above South Africa’s, while their growth to the world is
similar for all three countries. China clearly dominates exports to Africa, followed by India
and then South Africa, with modest exports from Brazil and especially Russia. As expected,
South Africa has the largest share of its manufacturing exports destined for Africa, with
Russia the lowest. Note also the decline from all countries in their 2009 exports compared to
2008, a level that Brazil and Russia had not largely recovered from even by 2011.

120 Chinese domination of the African industrial goods market
BRICS – South Africa's Way Ahead?
© 2013 Trade Law Centre, National Agricultural Marketing Council, Royal Danish Embassy, Swedish Embassy Nairobi.
Table 5: BRICs manufacturing exports to Africa
Reporter BRICs manufacturing exports to world & Africa, $ million 2006 - 2011
2006 2007 2008 2009 2010 2011 growth
To World
Brazil 76,682 86,553 96,413 66,477 82,691 97,020 1.3
China 880,923 1,144,874 1,338,262 1,128,443 1,483,867 1,786,852 2.0
India 83,052 96,798 129,038 111,874 149,232 198,122 2.4
Russia 74,096 98,150 112,863 72,022 84,229 98,651 1.3
SA 44,542 52,717 57,909 42,791 55,693 63,759 1.4
To Africa
% to Africa
Brazil 3,101 3,702 4,171 3,276 2,644 3,093 1.0 3.2%
China 24,789 35,240 48,075 45,059 56,640 68,481 2.8 3.8%
India 5,994 7,750 10,024 9,135 12,348 16,092 2.7 8.1%
Russia 1,434 2,051 2,393 1,850 1,560 1,873 1.3 1.9%
SA 5,454 6,896 8,339 7,315 8,556 10,124 1.9 15.9%
Source: Global Trade Atlas
India
The destination of these Indian manufacturing exports is shown in Table 6, expressed firstly
as global totals and then as the relative percentage share destined for each market. The EU
has consistently been the main market, but its relative importance has steadily been declining
in recent years. Similarly, the earlier second-placed US market has also been declining, and
indeed was overtaken in 2008 by the United Arab Emirates (UAE). Africa’s share increased
earlier in the years shown but has stabilised or even declined marginally since 2007. SACU
(South Africa) has demonstrated a similar time-path profile to that of Africa: steadily
increasing earlier and stabilising since 2008. Note that behind these three countries, Africa is
the next most important market for Indian manufactures; and not shown but can be calculated
is that between a low of 12.2% in 2001 and a high of 21.3% in 2005 of these African exports
are destined for SACU (South Africa).

Chinese domination of the African industrial goods market 121
BRICS: South Africa's Way Ahead?
© 2013 Trade Law Centre, National Agricultural Marketing Council, Royal Danish Embassy, Swedish Embassy Nairobi.
Table 6: Destination of India’s manufacturing exports
1999 2001 2003 2005 2007 2008 2009 2010 2011
World $ bn 35.4 43.3 57.5 99.7 147.6 195.1 165.2 222.9 306.7
Africa 5.4% 6.4% 6.1% 6.9% 8.9% 8.2% 7.7% 8.1% 7.9%
SACU 0.8% 0.8% 0.9% 1.5% 1.6% 1.4% 1.2% 1.7% 1.5%
EU-27 26.7% 23.4% 22.4% 22.3% 21.3% 20.6% 20.8% 18.3% 17.7%
UAE 5.5% 5.9% 7.2% 8.5% 9.8% 12.5% 12.5% 13.2% 12.7%
United States 22.6% 19.2% 19.1% 16.6% 13.7% 11.5% 11.0% 10.6% 10.8%
China 1.4% 2.1% 4.3% 6.6% 6.4% 5.4% 6.1% 7.9% 6.2%
Singapore 1.8% 2.1% 2.9% 5.5% 4.3% 4.7% 4.1% 4.1% 5.3%
Unidentified 0.1% 4.8% 0.1% 0.2% 0.2% 1.8% 2.7% 1.3% 4.9%
Hong Kong 6.2% 5.6% 5.6% 4.5% 4.0% 3.6% 4.2% 4.3% 4.1%
Indonesia 0.8% 1.1% 1.8% 1.4% 1.3% 1.5% 1.7% 2.1% 2.2%
Japan 4.7% 3.5% 2.9% 2.4% 2.2% 1.9% 1.9% 2.2% 1.8%
Saudi Arabia 2.1% 1.8% 1.7% 1.7% 2.2% 2.8% 2.3% 2.0% 1.8%
Brazil 0.4% 0.5% 0.7% 1.0% 1.3% 1.6% 1.1% 1.6% 1.7%
Korea South 1.3% 1.0% 1.1% 1.5% 1.7% 2.0% 2.3% 1.6% 1.6%
Source: Global Trade Atlas data, tralac analysis
Table 7 shows the composition in HS 2 chapters of India’s manufacturing exports to Africa,
ranked by their 2011 export value as shown in the second to right-hand side column. The
extreme right-hand column shows the percentage of the total that is destined for Africa in
each line, and it can be seen that all the main export lines going to Africa have a higher
percentage than the overall 7.9% of manufacturing exports. This is especially so for both
vehicles and pharmaceuticals, the top two export chapters shown. Also, in most, but not all
cases, the percentage going to Africa in 2011 is above that destined for Africa in the 2000 to
2002 period, although this is to be expected as the average percentage for Africa increased
from 5.8% to 7.9% over the period.
In summary, Africa is becoming an increasingly important market for Indian manufactures,
and it has been outperforming South Africa in the continent over the last few years. Over the
years, between 12 and 21% of African exports have been destined for South Africa (SACU)
and, by product, the top two chapters are vehicles and pharmaceuticals.

122 Chinese domination of the African industrial goods market
BRICS – South Africa's Way Ahead?
© 2013 Trade Law Centre, National Agricultural Marketing Council, Royal Danish Embassy, Swedish Embassy Nairobi.
Table 7: Composition of India’s manufacturing exports to Africa, $ million
Avg 00-02 %Africa 00-02 2010 2011 %Africa 2011
HS code All commodities 2,613 5.8% 17,947 24,242 7.9%
87 Vehicles 166 18.3% 1,885 2,692 23.1%
30 Pharmaceutical 231 21.9% 1,534 1,999 24.6%
85 Electric machinery 90 7.1% 1,027 1,612 13.2%
84 General machinery 185 12.5% 1,164 1,355 12.6%
52 Cotton fabric 394 18.3% 556 767 10.2%
39 Plastics 78 10.1% 533 723 13.3%
55 Manmade fibres 55 11.5% 269 432 19.2%
28 Inorganic chemicals 20 7.2% 118 412 19.3%
54 Manmade filaments 78 14.2% 304 412 15.6%
29 Organic chemicals 55 3.2% 307 408 3.7%
40 Rubber & articles 56 14.2% 232 329 12.9%
48 Paper & paperboard 40 20.5% 198 254 27.1%
38 Miscellaneous chemicals 24 5.3% 182 218 8.2%
61 Apparel 15 0.8% 101 215 3.8%
63 Textile used 39 3.4% 166 215 5.7%
Source: Global Trade Atlas data, tralac analysis
Brazilian and Russian manufacturing exports to Africa
Details of the top 10 exports to Africa from, firstly, Brazil in Table 8, and then Russia in
Table 9, are presented for the period 2006 to 2011 inclusive. The main trade lines from Brazil
are transport and transport related equipment and vehicles.
Exports from Russia to Africa are more diversified, as shown in Table 9.

Chinese domination of the African industrial goods market 123
BRICS: South Africa's Way Ahead?
© 2013 Trade Law Centre, National Agricultural Marketing Council, Royal Danish Embassy, Swedish Embassy Nairobi.
Table 8: Brazilian manufacturing exports to Africa, 2006 - 2011 and $ million
HS code Description 2006 2007 2008 2009 2010 2011
Total 3,101 3,702 4,171 3,276 2,644 3,093
8701 Tractors 184 217 314 170 167 197
8802 Aircraft 23 231 82 282 131 155
8429 Bulldozers, etc. 88 103 141 81 78 140
8704 Vans, etc. 220 305 303 135 112 135
8708 Parts for vehicles 180 190 182 103 118 133
8706 Parts for vehicles 116 116 177 143 97 99
2818 Corundum 207 138 165 97 114 90
3901 Polymers 87 104 78 71 61 82
2922 Amino-compounds 44 46 54 54 54 77
9403 Furniture 49 63 95 74 68 62
Source: Global Trade Atlas data
Table 9: Russian manufacturing exports to Africa, 2006-2011 and $ million
HS code Description 2006 2007 2008 2009 2010 2011
Total 1,434 2,051 2,393 1,850 1,560 1,873
4407 Timber 258 396 350 291 361 302
7208 Iron & steel 197 250 341 173 130 169
8802 Aircraft 0 431 195 202 6 129
3105 Fertiliser 14 42 228 147 88 114
3102 Nitrogen fertiliser 52 18 68 108 82 94
4412 Plywood 48 40 83 68 68 92
8526 Radar 6 1 1 45 11 79
7207 Iron & steel 246 146 287 221 213 56
7203 Ferrous products 0 0 0 0 26 53
8704 Trucks, etc. 35 44 82 35 41 51
Source: Global Trade Atlas data
The global “big picture”
In this section we analyse the Chinese manufacturing export picture to Africa using the
Global Trade Analysis Project (GTAP) database (note that the data may differ from the
Global Trade Atlas data used elsewhere in the chapter, as the definitions may be different).
Using this GTAP database we are able to break down manufacturing into the main sectors, as

124 Chinese domination of the African industrial goods market
BRICS – South Africa's Way Ahead?
© 2013 Trade Law Centre, National Agricultural Marketing Council, Royal Danish Embassy, Swedish Embassy Nairobi.
shown on the left-hand side in Table 10, and show the Chinese exports to, firstly, the world
for the average of the two periods 2000-2001 (World 1) and 2008-2009 (World 2); then
Chinese exports to Africa for the same two periods (Afr 1 and Afr 2); and finally Chinese
exports to South Africa (SA 1 and SA 2). This data is shown on the left-hand half of the table
as US$ million and on the right-hand side of the table as the percentage share of global
exports in each period by GTAP sector. Note that we have used changes in percentage shares
as the best measure of assessing the relative changes in exports to each market. The ranking
used is by value for the exports to Africa during the second period, and the totals used in row
2 are the subtotals from the sectors shown in the top part of the table. It is these top sectors
that most closely, but not exactly, reconcile with the definition of ‘manufacturing’ that we
have used in the main body of the chapter. Those excluded manufacturing sectors are shown
in the lower part of the table and include sectors such as petroleum products, fabricated
metals, and lumber and paper products. They arguably resort under manufacturing but may
not be the definitions we have used.
Taking the subtotal of the GTAP sectors at the top of the table, we find that these exports
from China to the world in the first period were $273.9 billion, with $4,265 million of the
global total destined for Africa and $932 million of the African total destined for
South Africa. During this same first period, these exports were 6.8% of the total global
exports to the world, 5.3% of the global exports going to Africa (including South Africa), and
the same 5.3% of the global exports destined for South Africa. By the second period, China
was exporting 13.4% of the global exports in these products, 15.4% of the exports to Africa
and 16.3% of the exports to South Africa. Global exports as a percentage share had almost
doubled, while those to Africa in total had almost tripled! From the total, looking down the
table as far as the ‘Other GTAP manufacturing sector’, we see that China’s percentage share
had increased in each GTAP sector to each of the global, African and Chinese markets
between the two periods, and in some instances dramatically (vehicles and electrical goods,
for example). Similarly, in the lower part of the table, although outside our focus, we see that
China’s percentage shares have increased to all markets in all products except petroleum and
similar products such as natural gas. Although not explicitly shown, China’s exports to Africa
all increased by more percentage points than did the comparable exports to the world.

Table 10: Chinese exports in a global perspective, $ million and % shares in global exports
$ million % share
GTAP sector / Period World 1 World 2 Afr 1 Afr 2 SA 1 SA 2 World 1 World 2 Afr 1 Afr 2 SA 1 SA 2
Total 273,905 1,071,130 4,265 40,396 932 7,223 6.8% 13.4% 5.3% 15.4% 5.3% 16.4%
Other machinery 54,325 250,785 944 11,031 157 1,766 5.3% 11.8% 4.0% 13.6% 3.2% 12.2%
textiles 22,405 83,809 921 6,188 105 734 11.8% 27.4% 12.5% 36.6% 14.1% 48.5%
Electric goods 63,684 322,952 379 5,159 176 1,519 7.5% 25.8% 4.7% 26.2% 6.4% 30.5%
Chemicals, rubber, plastic 22,698 107,106 546 4,471 114 895 3.3% 5.9% 3.6% 8.7% 3.3% 9.7%
Vehicles 2,503 24,792 62 2,976 11 297 0.5% 2.4% 0.8% 8.1% 0.4% 3.7%
Other transport 5,756 30,290 293 2,583 14 70 3.0% 7.2% 3.2% 11.2% 1.3% 4.3%
Iron steel 3,647 36,777 63 2,435 13 241 2.5% 9.0% 1.7% 11.9% 3.8% 20.3%
Wearing apparel 33,751 91,090 448 2,369 146 769 22.6% 37.6% 24.1% 50.9% 47.7% 72.3%
Leather, etc. 26,772 48,905 378 1,923 115 603 33.2% 37.1% 31.7% 55.4% 40.1% 69.5%
Other manufactures 38,364 74,624 231 1,261 81 329 22.3% 29.6% 10.8% 28.4% 12.2% 40.0%
Other GTAP manufacturing sectors
Paper products 3,106 12,929 45 391 5 84 2.1% 5.2% 1.5% 5.0% 0.8% 7.0%
Lumber 11,545 44,198 35 981 21 208 9.4% 20.5% 2.1% 16.7% 7.0% 30.9%
Petroleum, etc. 3,246 11,951 51 407 34 132 2.1% 1.8% 1.1% 1.0% 10.8% 3.9%
Non-ferrous metal 3,316 14,632 30 595 13 95 2.1% 3.1% 1.6% 6.5% 1.5% 2.2%
Fabricated metal 11,132 52,959 333 2,994 45 368 8.7% 16.8% 10.4% 20.1% 8.3% 26.0%
Non-metallic mineral 7,955 26,727 168 1,697 60 239 7.2% 17.5% 5.5% 21.5% 9.3% 22.8%
Source: GTAP database

126 Chinese domination of the African industrial goods market
BRICS – South Africa's Way Ahead?
© 2013 Trade Law Centre, National Agricultural Marketing Council, Royal Danish Embassy, Swedish Embassy Nairobi.
Table 11 replicates the Table 10 data for China in that it shows South Africa’s relative
position, albeit without the exports to South Africa of course.1 Again, the data for the top part
of the table is ranked by South Africa’s exports to Africa during the 2008-2009 period
average. Overall, the relative share of global exports has increased from 0.36% to 0.39%, but
the share to Africa has declined from 5.17% to 3.63%. The global share has increased in other
machinery, vehicles and electrical goods, while the share to Africa has declined in all of the
sectors at the top of table except for the small increase in other transport. Shares in all sectors
at the bottom of the table have declined to both the world and Africa. Clearly, South Africa is
losing ground in global manufacturing exports.
Table 11: South African exports in a global perspective, $ million and % shares
$ million % share
GTAP sector / Period World 1 World 2 Afr 1 Afr 2 World 1 World 2 Afr 1 Afr 2
Total 14,540 31,114 4,161 9,502 0.36% 0.39% 5.17% 3.63%
Other machinery 3,139 6,891 1,349 3,013 0.31% 0.33% 5.73% 3.72%
Chemicals, rubber, plastic 2,751 6,314 1,224 2,588 0.40% 0.35% 8.00% 5.03%
Vehicles 2,116 6,707 491 1,759 0.40% 0.65% 6.05% 4.81%
Iron, steel 2,839 7,552 291 866 1.96% 1.84% 7.66% 4.24%
Electric goods 522 846 305 457 0.06% 0.07% 3.78% 2.33%
Other transport 416 693 91 242 0.22% 0.16% 0.99% 1.05%
Textiles 472 517 160 213 0.25% 0.17% 2.17% 1.26%
Wearing apparel 285 190 113 165 0.19% 0.08% 6.07% 3.55%
Other manufactures 1,784 1,196 78 107 1.04% 0.47% 3.66% 2.41%
Leather, etc. 216 208 59 92 0.27% 0.16% 4.95% 2.65%
Other GTAP manufacturing sectors
Paper products 1,094 1,475 378 571 0.74% 0.60% 12.52% 7.25%
Lumber 887 1,054 175 255 0.72% 0.49% 10.26% 4.35%
Petroleum, etc. 893 1,843 728 1,531 0.59% 0.27% 15.16% 3.95%
Non-ferrous metal 7,184 16,274 54 197 4.50% 3.41% 2.81% 2.14%
Fabricated metal 860 1,951 401 1,095 0.67% 0.62% 12.57% 7.34%
Non-metal mineral 482 510 250 336 0.43% 0.33% 8.12% 4.26%
Source: GTAP database
1 This raises the question of South African manufacturing capacity, and what effects the Chinese (and other) exports to South Africa are having on South African domestic capacity. This question is outside the scope of this chapter.

Chinese domination of the African industrial goods market 127
BRICS – South Africa's Way Ahead?
© 2013 Trade Law Centre, National Agricultural Marketing Council, Royal Danish Embassy, Swedish Embassy Nairobi.
In Tables 6 and 7 above, we showed India’s export performance to Africa. In Table 12 we
show these Indian exports using the same GTAP database as above for China and
South Africa. Here the performance is somewhat mixed, but in general a very positive one for
India, further reinforcing the message above that India is an increasingly competitive threat to
South Africa in the African market.
Table 12: Relative performance of India’s manufacturing exports to world, Africa and
South Africa
GTAP sector/Period W 1 W 2 Af 1 Af 2 SA 1 SA 2
Subtotal 0.80% 1.47% 2.05% 3.42% 1.28% 3.05%
Other machinery 0.29% 0.67% 1.16% 2.08% 0.58% 1.16%
Textiles 3.80% 4.79% 8.11% 7.05% 5.11% 6.22%
Electric goods 0.08% 0.36% 0.29% 3.54% 0.11% 2.87%
Chemicals, rubber, plastic 0.86% 1.43% 3.09% 5.20% 1.46% 4.48%
Vehicles 0.12% 0.53% 0.83% 2.04% 0.44% 2.00%
Other transport 0.25% 1.01% 1.24% 1.85% 0.19% 0.61%
Iron steel 1.15% 2.18% 5.05% 4.39% 4.11% 3.78%
Wearing apparel 3.72% 4.04% 5.05% 3.91% 15.03% 4.89%
Leather, etc. 1.98% 2.61% 2.52% 1.59% 6.62% 3.69%
Other manufactures 4.07% 8.86% 2.02% 3.96% 2.41% 5.47%
Other GTAP manufacturing sectors
Paper products 0.19% 0.38% 1.69% 3.05% 0.46% 1.33%
Lumber 0.28% 0.32% 0.18% 0.41% 0.66% 1.04%
Petroleum, etc 0.51% 4.08% 0.27% 8.96% 1.59% 24.54%
Non-ferrous metal 0.40% 1.36% 0.57% 1.77% 0.11% 0.40%
Fabricated metal 1.17% 1.47% 4.51% 5.20% 2.75% 4.87%
Non-metallic mineral 0.88% 1.71% 2.31% 2.41% 1.08% 2.20%
Source: GTAP database

128 Chinese domination of the African industrial goods market
BRICS – South Africa's Way Ahead?
© 2013 Trade Law Centre, National Agricultural Marketing Council, Royal Danish Embassy, Swedish Embassy Nairobi.
References
Sandrey, R. and Edinger, H. 2011. China’s manufacturing sector and industrialisation in
Africa. Working Paper Series, No. 128, April. Tunis: African Development Bank (AfDB)
[Online]. Available:
http://www.afdb.org/fileadmin/uploads/afdb/Documents/Publications/WORKING%20128%2
0word%20document%20docx-OK-RS.PDF
Also released as Sandrey, R. and Edinger, H. 2011. China’s manufacturing sector and
industrialisation in Africa. In Schiere, R. et al. China-Africa: An Emerging Partnership for
Development? Tunis: AfDB. [Online]. Available:
http://www.afdb.org/fileadmin/uploads/afdb/Documents/Publications/Anglaischina.pdf

Chapter 6
The BRICs and agricultural exports to Africa: are they a
threat to South African interests?1
Ron Sandrey2, Nick Vink
3 and Hans Grinsted Jensen
4
1. Introduction
Much has been written about the BRICS countries (Brazil, Russia, India, China and South
Africa) in recent years, mostly because of the rising industrial power of especially China. Yet
these countries are becoming global agricultural trade players as well. As a group, the BRICS
are now second only to the European Union as an agricultural exporter. In 1961, the five
countries collectively exported some 48% of the value of agricultural exports of the US, while
they overtook the US in 2009 (FAOSTAT, 2012). Brazil (3rd in the world when the EU is
regarded as a single entity) is the largest agricultural exporter among the group, followed by
China (5th), India (12th), Russia (21st) and South Africa (28th) in 2009. South Africa is the only
African country amongst this grouping; South Africa’s agricultural exports into the rest of
Africa have been growing rapidly, and South Africa regards the African market as
strategically important. In this regard, the main aim of this chapter is to examine agricultural
exports from the non-African BRICS countries (hereafter BRIC) as they impact upon South
African agricultural trade interests on the African continent. This will be done by assessing
export data from the BRIC and South Africa to the continent from 1997 to 2011 inclusively,
1 Paper presented at the 50th Conference of the Agricultural Economics Association of South Africa, Bloemfontein, October 2012. 2 Senior Researcher, tralac and Professor Extraordinaire, Department of Agricultural Economics, University of Stellenbosch, Private Bag X1, Matieland, 7602. Contact: [email protected] 3 Professor, Department of Agricultural Economics, University of Stellenbosch, Private Bag X1, Matieland, 7602, respectively. 4 Research Fellow, Institute for Food and Resource Economics, University of Copenhagen, Rolighedsvej 25; DK-1958 Frederiksberg C. Contact: [email protected]

130 The BRICs and agricultural exports to Africa: are they a threat to South African interests?
BRICS – South Africa's Way Ahead?
© 2013 Trade Law Centre, National Agricultural Marketing Council, Royal Danish Embassy, Swedish Embassy Nairobi.
using data from the Global Trade Atlas and the Global Trade Analysis Project (GTAP)
database.
2. Agricultural exports of the BRICS: general
Global exports of the major agricultural commodities by the BRICS countries into the world,
into Africa and into South Africa, respectively, are shown in Table 1 for the two periods
(2000/01 and 2008/09). The data are ranked by value of exports from the BRICS to Africa in
the second period. The three top exports are sugar, ‘other foods’ (further processed foods),
and wheat.
Table 1: Agricultural exports from the BRICS, $m
World Africa South Africa
2000/01 2008/09 2000/01 2008/09 2000/01 2008/09
Agriculture total 42,253 134,036 2,816 11,384 158 853
Sugar 2,201 8,073 473 2,421 0 109
Other foods 14,916 36,228 518 2,138 28 184
Wheat 428 3,420 58 1,275 1 5
Beef/sheep meat 1,404 5,150 144 846 0 0
Other meats 2,981 10,944 97 694 25 144
Other crops 5,657 12,243 316 566 27 101
Rice 1,140 3,842 283 507 33 83
Vegetable oils 949 12,146 194 621 15 94
Vegetable & fruit 3,687 11,215 167 419 12 48
Other grains 1,679 3,311 120 607 2 6
Dairy 311 1,289 101 321 0 3
Oilseeds 3,348 14,599 68 188 3 17
Beverages and tobacco 1,413 5,939 222 607 4 10
Other products 1,654 2,616 28 118 6 48
Source: GTAP database
Table 2 puts this data in perspective by displaying the percentage share of BRICS exports in
the global total. In 2000/01, the BRICS exported 9.5% of global agricultural exports5, 8.2% of
global exports to Africa, and 9.0% of global exports to South Africa. By 2008/09, these
percentages had increased to 11.5%, 14.6% and 18.1%, respectively. The BRICS were
5 Note that these data include intra-EU agricultural trade.

The BRICs and agricultural exports to Africa: are they a threat to South African interests? 131
BRICS – South Africa's Way Ahead?
© 2013 Trade Law Centre, National Agricultural Marketing Council, Royal Danish Embassy, Swedish Embassy Nairobi.
commanding a significant share of the African market by the second period, and in the top
five GTAP commodities these percentage increases have been significant.
Table 2: Agricultural exports from the BRICS, % share of global exports
World Africa South Africa
2000/01 2008/09 2000/01 2008/09 2000/01 2008/09
Agriculture total 9.5 11.5 8.2 14.6 9.0 18.1
Sugar 21.3 35.4 31.2 66.2 0.0 83.8
Other foods 11.4 11.6 12.5 17.7 5.4 17.3
Wheat 2.7 8.4 1.9 12.3 1.4 1.4
Beef/sheep meat 6.5 12.0 27.0 54.4 0.0 0.0
Other meats 10.5 16.1 17.8 42.7 23.4 56.5
Other crops 13.9 17.7 22.7 21.5 13.9 32.0
Rice 21.2 20.9 23.8 11.4 21.3 18.6
Vegetable oils 6.1 11.9 13.0 8.1 10.6 10.5
Vegetable & fruit 8.6 10.1 24.5 17.4 26.7 37.2
Other grains 12.4 9.8 9.2 20.2 5.0 12.2
Dairy 1.1 2.0 6.6 7.9 0.0 2.7
Oilseeds 22.5 27.6 26.0 16.2 12.5 45.9
Beverages and tobacco 2.9 5.3 17.9 15.0 3.1 1.7
Other products 12.0 10.9 15.8 23.2 10.3 56.5
Source: GTAP database
An updated and more historical picture for the agricultural trade flows to firstly the world and
then Africa, in selected years in the period 1997-2011, is shown in Table 36. The top part of
Table 3 shows total agricultural exports by BRICS countries to the world. Brazil is the largest
exporter, with exports of $81.5bn for 2011, followed by China, India, Russia and lastly South
Africa with $7.2 billion. Exports during 2011 were 5.8 times those of 1999 for Brazil, 4.3
times for China, 6.3 times for India, a large 13.1 times for Russia, and a modest 3.0 times for
South Africa. For the most recent five year period (2007-2011), global export increases were
more closely grouped: 1.8 times for Brazil, 1.5 for China, 2.1 for India, 1.2 for Russia, and 1.7
times for South Africa.
6 Note that these data are sourced from the Global Trade Atlas and use the WTO definitions of agricultural commodities, so the totals may not reconcile with Tables 1 and 2.

132 The BRICs and agricultural exports to Africa: are they a threat to South African interests?
BRICS – South Africa's Way Ahead?
© 2013 Trade Law Centre, National Agricultural Marketing Council, Royal Danish Embassy, Swedish Embassy Nairobi.
In the second block, agricultural exports to Africa are shown. Again, Brazil is the main
exporter, with its $8.4 billion being almost as much as the combined total of $9.1 billion from
the remaining four exporters, with from $2.0 to 2.8 billion each. Over the 1999 to 2011
period, exports from Brazil increase by 12.5 times, China 5.2 times, India 11.5 times, Russia a
massive 548 times, and South Africa a lesser 3.4 times. Again, increases over the last five-
year period have been more even, ranging from Russia’s low of 1.3 times to Brazil’s 2.4 times
with South Africa just behind at 2.3 times, and both China and India at 1.9 times.
Table 3: BRICS agricultural exports to the world and Africa, $million
1997 1999 2001 2003 2005 2007 2008 2009 2010 2011
$m to World
Brazil 16,659 13,999 16,251 21,247 31,772 44,547 58,063 54,609 63,486 81,469
Russia 1,583 696 1,227 2,375 3,564 7,844 8,043 7,747 5,921 9,088
India na 4,827 5,051 5,727 8,835 14,680 19,892 14,871 20,465 30,372
China 12,776 11,386 13,188 17,711 22,618 31,540 34,629 32,037 39,695 48,643
South Africa 2,515 2,370 2,349 3,148 4,057 4,243 5,535 5,626 6,455 7,227
$m to Africa (including SACU)
Brazil 765 669 1,031 1,291 2,634 3,494 4,459 4,651 5,792 8,377
Russia 8 4 57 194 596 1,717 1,071 1,257 1,196 2,190
India n/a 242 316 383 1,062 1,473 1,389 824 1,270 2,783
China 219 409 418 646 652 1,113 1,497 1,482 1,641 2,132
South Africa 644 586 586 857 951 863 1,680 1,804 1,880 1,966
Source: Global Trade Atlas data
Table 4 shows the relative shares of BRICS agricultural exports going, firstly, to Africa as a
whole (top block), and then to non-SACU Africa in the lower segment – i.e. except South
Africa, given the integrated nature of the SACU market and the dominance of South Africa
within that market. For Brazil, for example, 10.3% of total agricultural exports in 2011 were
destined for Africa, with 93.1% to non-SACU, thus, 6.9% to SACU (South Africa). Brazil,
China and India have regained market share that was lost during the first part of the decade.
Almost all the Russian exports go to non-SACU.
Over the period, South Africa’s share going to Africa grew to a high of over 32% in 2009.
Shares for the BRIC countries have all been increasing, and in 2011 one quarter of Russian
agricultural exports were destined for the continent (up from under one per cent in the earlier
years). Brazil and India both have around 10% of their exports destined for Africa, and in

The BRICs and agricultural exports to Africa: are they a threat to South African interests? 133
BRICS – South Africa's Way Ahead?
© 2013 Trade Law Centre, National Agricultural Marketing Council, Royal Danish Embassy, Swedish Embassy Nairobi.
both cases the bulk is for non-SACU Africa. China is different in that (a) only around four per
cent of total exports in recent years have gone to Africa, and (b) around 15% of these exports
are to South Africa (SACU).
In summary, for the BRICS, Brazil dominates agricultural exports to both the world and
Africa, with African exports being tightly bunched in the remaining four countries albeit with
India at the head of this pack. Both Russia and South Africa have around one quarter of their
global exports destined for Africa, with China and India both around 10 per cent and China a
modest four per cent.
Table 4: BRICS agricultural exports to Africa and SACU
1997 1999 2001 2003 2005 2007 2008 2009 2010 2011
Relative shares to Africa (including SACU) (%)
Brazil 4.6 4.8 6.3 6.1 8.3 7.8 7.7 8.5 9.1 10.3
Russia 0.5 0.6 4.6 8.2 16.7 21.9 13.3 16.2 20.2 24.1
India na 5.0 6.3 6.7 12.0 10.0 7.0 5.5 6.2 9.2
China 1.7 3.6 3.2 3.6 2.9 3.5 4.3 4.6 4.1 4.4
South Africa 25.6 24.7 24.9 27.2 23.4 20.3 30.4 32.1 29.1 27.2
Relative shares to Africa (excluding SACU) (%)
Brazil 93.7 94.2 92.3 86.6 84.4 84.3 88.3 90.2 93.4 93.1
Russia 100.0 100.0 100.0 99.0 99.8 100.0 99.9 99.3 99.2 98.4
India na 74.0 88.6 74.2 84.2 87.8 90.5 87.9 88.5 92.5
China 84.0 90.7 90.2 80.7 84.8 82.4 85.4 82.4 83.5 84.2
Source: Global Trade Atlas
Table 5 examines the details of where in Africa these exports are going to, both in aggregate
and by BRIC and South African exports, followed by the percentage share of each destination
by exporter. It shows the data for the first periods as three year averages and the last three
individual years. Ranked by 2011, Egypt has been the main destination, followed by Algeria,
Nigeria and South Africa. Angola and Morocco have been consistent destinations over the
entire period.
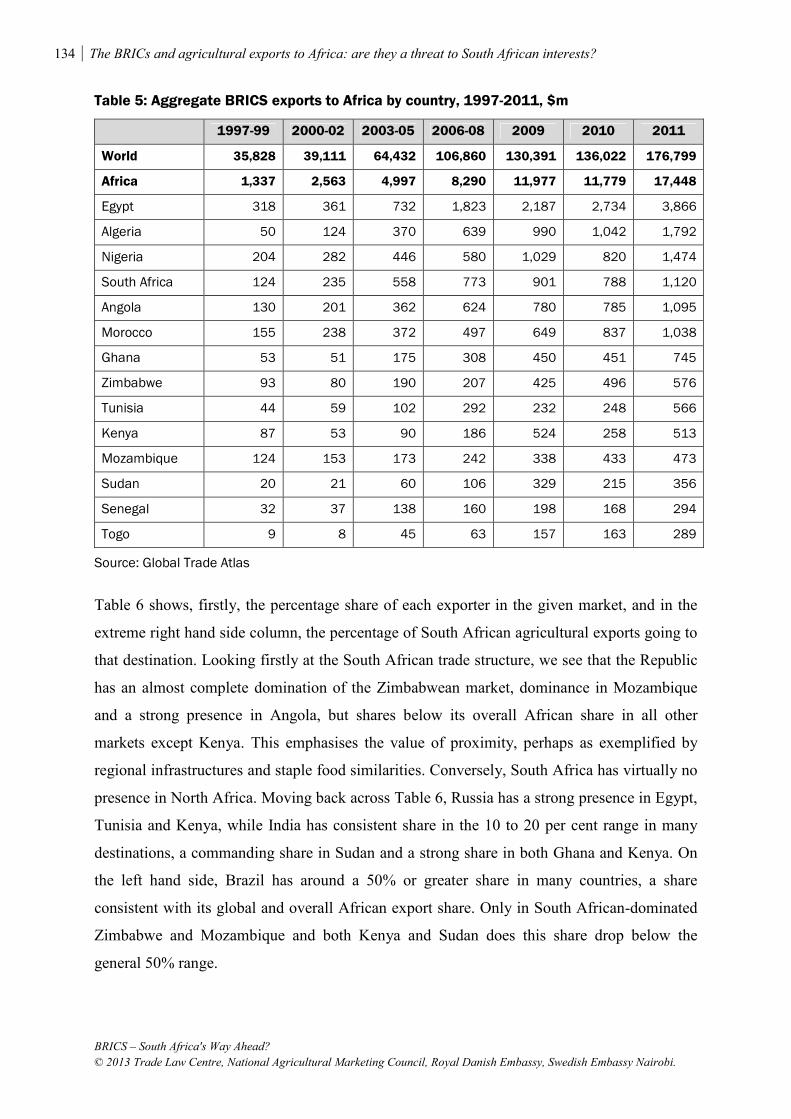
134 The BRICs and agricultural exports to Africa: are they a threat to South African interests?
BRICS – South Africa's Way Ahead?
© 2013 Trade Law Centre, National Agricultural Marketing Council, Royal Danish Embassy, Swedish Embassy Nairobi.
Table 5: Aggregate BRICS exports to Africa by country, 1997-2011, $m
1997-99 2000-02 2003-05 2006-08 2009 2010 2011
World 35,828 39,111 64,432 106,860 130,391 136,022 176,799
Africa 1,337 2,563 4,997 8,290 11,977 11,779 17,448
Egypt 318 361 732 1,823 2,187 2,734 3,866
Algeria 50 124 370 639 990 1,042 1,792
Nigeria 204 282 446 580 1,029 820 1,474
South Africa 124 235 558 773 901 788 1,120
Angola 130 201 362 624 780 785 1,095
Morocco 155 238 372 497 649 837 1,038
Ghana 53 51 175 308 450 451 745
Zimbabwe 93 80 190 207 425 496 576
Tunisia 44 59 102 292 232 248 566
Kenya 87 53 90 186 524 258 513
Mozambique 124 153 173 242 338 433 473
Sudan 20 21 60 106 329 215 356
Senegal 32 37 138 160 198 168 294
Togo 9 8 45 63 157 163 289
Source: Global Trade Atlas
Table 6 shows, firstly, the percentage share of each exporter in the given market, and in the
extreme right hand side column, the percentage of South African agricultural exports going to
that destination. Looking firstly at the South African trade structure, we see that the Republic
has an almost complete domination of the Zimbabwean market, dominance in Mozambique
and a strong presence in Angola, but shares below its overall African share in all other
markets except Kenya. This emphasises the value of proximity, perhaps as exemplified by
regional infrastructures and staple food similarities. Conversely, South Africa has virtually no
presence in North Africa. Moving back across Table 6, Russia has a strong presence in Egypt,
Tunisia and Kenya, while India has consistent share in the 10 to 20 per cent range in many
destinations, a commanding share in Sudan and a strong share in both Ghana and Kenya. On
the left hand side, Brazil has around a 50% or greater share in many countries, a share
consistent with its global and overall African export share. Only in South African-dominated
Zimbabwe and Mozambique and both Kenya and Sudan does this share drop below the
general 50% range.
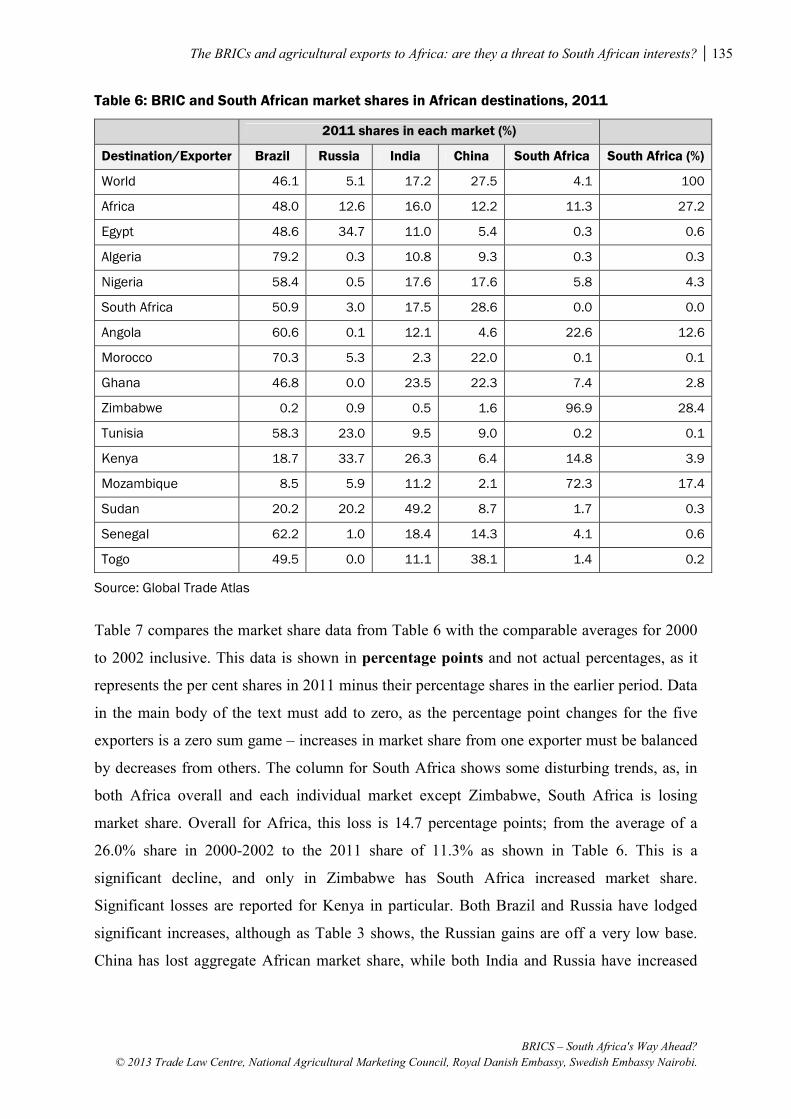
The BRICs and agricultural exports to Africa: are they a threat to South African interests? 135
BRICS – South Africa's Way Ahead?
© 2013 Trade Law Centre, National Agricultural Marketing Council, Royal Danish Embassy, Swedish Embassy Nairobi.
Table 6: BRIC and South African market shares in African destinations, 2011
2011 shares in each market (%)
Destination/Exporter Brazil Russia India China South Africa South Africa (%)
World 46.1 5.1 17.2 27.5 4.1 100
Africa 48.0 12.6 16.0 12.2 11.3 27.2
Egypt 48.6 34.7 11.0 5.4 0.3 0.6
Algeria 79.2 0.3 10.8 9.3 0.3 0.3
Nigeria 58.4 0.5 17.6 17.6 5.8 4.3
South Africa 50.9 3.0 17.5 28.6 0.0 0.0
Angola 60.6 0.1 12.1 4.6 22.6 12.6
Morocco 70.3 5.3 2.3 22.0 0.1 0.1
Ghana 46.8 0.0 23.5 22.3 7.4 2.8
Zimbabwe 0.2 0.9 0.5 1.6 96.9 28.4
Tunisia 58.3 23.0 9.5 9.0 0.2 0.1
Kenya 18.7 33.7 26.3 6.4 14.8 3.9
Mozambique 8.5 5.9 11.2 2.1 72.3 17.4
Sudan 20.2 20.2 49.2 8.7 1.7 0.3
Senegal 62.2 1.0 18.4 14.3 4.1 0.6
Togo 49.5 0.0 11.1 38.1 1.4 0.2
Source: Global Trade Atlas
Table 7 compares the market share data from Table 6 with the comparable averages for 2000
to 2002 inclusive. This data is shown in percentage points and not actual percentages, as it
represents the per cent shares in 2011 minus their percentage shares in the earlier period. Data
in the main body of the text must add to zero, as the percentage point changes for the five
exporters is a zero sum game – increases in market share from one exporter must be balanced
by decreases from others. The column for South Africa shows some disturbing trends, as, in
both Africa overall and each individual market except Zimbabwe, South Africa is losing
market share. Overall for Africa, this loss is 14.7 percentage points; from the average of a
26.0% share in 2000-2002 to the 2011 share of 11.3% as shown in Table 6. This is a
significant decline, and only in Zimbabwe has South Africa increased market share.
Significant losses are reported for Kenya in particular. Both Brazil and Russia have lodged
significant increases, although as Table 3 shows, the Russian gains are off a very low base.
China has lost aggregate African market share, while both India and Russia have increased

136 The BRICs and agricultural exports to Africa: are they a threat to South African interests?
BRICS – South Africa's Way Ahead?
© 2013 Trade Law Centre, National Agricultural Marketing Council, Royal Danish Embassy, Swedish Embassy Nairobi.
theirs. Of interest is that Brazil, in particular, and to a lesser degree both China and Russia,
have increased market share in the South African market at the expense of India.
Table 7: Market share changes in African destinations from 2000/2002 to 2011
Change in shares in each market (percentage points);
2011 from 2000-02 averages
% of South Africa’s
Africa exports going to
Brazil Russia India China South Africa
World 5.5 1.3 4.1 -8.8 -2.1
Africa 9.7 7.1 3.8 -5.9 -14.7 100.0
Egypt -6.5 22.8 -10.0 -5.4 -0.9 -0.2
Algeria 42.7 -36.7 7.8 -13.5 -0.2 0.2
Nigeria -12.8 0.2 6.3 13.0 -6.7 -0.8
SACU 8.3 2.9 -13.8 2.5 0.0 0.0
South Africa 9.2 3.0 -14.4 2.2 0.0 0.0
Angola 21.9 0.1 6.2 2.2 -30.5 -3.1
Morocco 10.8 -5.0 1.2 -6.1 -0.9 -0.3
Ghana 0.7 0.0 13.6 10.2 -24.5 0.4
Zimbabwe -0.3 0.9 -0.8 -4.8 4.9 16.9
Tunisia -9.7 8.1 3.8 -1.8 -0.4 0.0
Kenya 13.3 33.7 13.5 4.4 -64.9 -2.4
Mozambique 2.6 5.9 8.7 0.5 -17.7 -3.6
Sudan 15.3 19.0 -25.2 0.2 -9.3 -0.2
Senegal 20.7 1.0 13.4 -31.3 -3.8 0.2
Togo 49.5 0.0 11.1 -45.3 -15.3 0.0
Source: Global Trade Atlas
The top 15 export products by HS 2 Chapters are shown in Table 8, along with the relative
contribution from each exporter, and, in the right hand columns, firstly the percentage share
of South Africa in these exports and then the percentage that this particular HS 2 Chapter
contributes to South Africa’s exports to Africa. Dominating the table are exports of sugar,
where these exports are in turn dominated by Brazilian exports. South Africa is an exporter of
sugar, and although this HS Chapter contributes 9.6% of the Republic’s African exports, they
are still only one quarter of the sugar exports to Africa from India, the second major
contributor. Sugar is followed by cereals and then meats, and again Brazil is a significant
exporter of both these products. Note also that cereals comprise almost all of the Russian

The BRICs and agricultural exports to Africa: are they a threat to South African interests? 137
BRICS – South Africa's Way Ahead?
© 2013 Trade Law Centre, National Agricultural Marketing Council, Royal Danish Embassy, Swedish Embassy Nairobi.
exports to Africa, and that South Africa is a minor player in both cereals and meat. These top
three HS Chapters make up two-thirds (65.8%) of the total exports to Africa from the parties
under consideration, with a dominating 96.0% of Brazilian exports and 88.9% of the Russian
contribution. At the other extreme, they are only 6.4% of China’s exports. Dominance in the
other HS Chapters below these top three is shared; four each by South Africa and China, three
by Brazil and one by India. Thus, South Africa is doing much better in these “lesser”, but still
important, markets in Africa. Note here that South Africa is, in essence, competing against
itself by the definition of exports from the BRICs to an Africa that includes SACU, a market
that South Africa is not, by definition, exporting into.
Table 8: Main products by HS 2 Chapters, 2011 $m
Total Brazil Russia India China
South Africa
South Africa (%)
Share of South Africa’s
exports to Africa
Total 17,448 8,377 2,190 2,783 2,132 1,966 11.3
Sugar etc. 5,479 4,399 0 805 86 189 3.4 9.6
Cereals 4,090 1,414 1,946 588 49 93 2.3 4.7
Meat 1,911 1,390 479 1 41 2.1 2.1
Sub-total 11,480 7,203 1,946 1,872 136 323 2.8 16.4
Top 3 share (%) 65.8 86.0 88.9 67.3 6.4 16.4
Fats, Oils 865 460 158 11 25 211 24.4 10.7
Coffee, Tea 732 66 0 149 490 27 3.7 1.4
Prepared vegetables, fruit, etc.
668 17 0 11 520 120 18.0 6.1
Beverages 551 81 3 131 71 265 48.1 13.5
Miscellaneous edible preparations
481 25 1 43 183 229 47.6 11.6
Tobacco 399 133 0 86 81 99 24.8 5.0
Vegetables 341 12 5 74 199 51 15.0 2.6
Prepared cereals etc. 263 41 0 101 35 86 32.7 4.4
Milling products 240 48 49 21 15 107 44.6 5.4
Fruit and nuts 216 2 0 43 17 154 71.3 7.8
Oilseeds 204 21 4 46 95 38 18.6 1.9
Prepared meat 204 101 0 5 74 24 11.8 1.2
Sub-total top 15 16,644 8,210 2,166 2,593 1,941 1,734 10.4 88.2
Top 15 share (%) 95.4 98.0 98.9 93.2 91.0 88.2
Source: Global Trade Atlas

138 The BRICs and agricultural exports to Africa: are they a threat to South African interests?
BRICS – South Africa's Way Ahead?
© 2013 Trade Law Centre, National Agricultural Marketing Council, Royal Danish Embassy, Swedish Embassy Nairobi.
Table 9 shows the changes in market shares for these top 15 2011 exports from the average of
the 2000 to 2002 period. Table 7 showed that South Africa had dropped 14.7 percentage
points in African market share, and that same figure appears in the top right hand corner
again. Looking down the column from there it can be seen that South Africa has lost market
share in every HS Chapter except the export of fats and oils. Brazil has both gained and lost
market shares, but the gains in Cereals and Meats in particular (given their importance in total
trade) has contributed to an overall gain of almost 10 percentage points. Russia’s gains have
come almost exclusively from cereals and milling products, while China has gained in 12 of
the 15 Chapters. India has managed to register more gains than losses to record its overall
gain.
Table 9: Market share changes in African HS2 Chapters (percentage points), 2000-2011
Brazil Russia India China South Africa
Total 9.7 7.1 3.8 -5.9 -14.7
Sugar -2.2 0.0 12.9 1.4 -12.2
Cereals 28.8 25.2 -7.2 -33.0 -13.8
Meat 19.6 0.0 -7.3 -6.8 -5.5
Fats, oils -17.0 6.5 -2.7 2.9 10.4
Coffee, tea 2.3 0.0 9.0 -10.0 -1.3
Preparations of vegetables, fruit etc. -2.1 0.0 1.6 45.7 -45.3
Beverages 3.2 0.2 22.9 11.7 -38.0
Miscellaneous edible preparations -9.6 0.2 3.3 22.7 -16.6
Tobacco 8.2 -0.5 14.3 2.7 -24.7
Vegetables 0.6 1.5 -7.5 8.6 -3.2
Preparations of cereals etc. 8.6 0.0 19.1 6.3 -34.0
Milling products 11.1 20.4 5.8 6.3 -43.5
Fruit and nuts -2.6 0.0 1.6 7.0 -6.1
Oilseeds -17.8 1.4 -0.2 18.5 -1.9
Preparations of meat -3.0 0.0 2.5 21.3 -20.7
Sub-total top 15 31.2 13.0 8.7 11.7 -64.6
Source: Global Trade Atlas
Table 10 shows the details of the significant trade lines at the HS 6 level for exports of cereals
to Africa during 2011. Wheat dominates the trade, with Brazil and Russia being the main
providers followed by India, then China and South Africa. Next is rice (from India) and then
corn from Brazil.

The BRICs and agricultural exports to Africa: are they a threat to South African interests? 139
BRICS – South Africa's Way Ahead?
© 2013 Trade Law Centre, National Agricultural Marketing Council, Royal Danish Embassy, Swedish Embassy Nairobi.
Table 10: Market share for exporters of cereals into Africa, 2011
Total $m Brazil (%) Russia (%) India (%) China (%) South Africa (%)
HS Chapter 10, Cereals 4091 34.6 47.6 14.4 1.2 2.3
100190 Wheat 2423 78.6 0.0 20.3 0.7 0.4
100630 Rice 822 0.0 62.9 32.5 3.8 0.9
100590 Corn 591 2.2 0.2 90.4 0.0 7.3
100640 Rice, Broken 175 0.0 30.3 63.4 0.0 6.3
100300 Barley 30 96.7 0.0 0.0 0.0 3.3
Source: Global Trade Atlas
Table 11 shows the exports of meat to Africa in 2002 and 2011. Beef from Brazil and perhaps
surprisingly India, and chicken from Brazil dominate both periods. Neither China nor South
Africa are meaningful exporters of meat.
Table 11: Meat exports to Africa from the BRICS, 2002 and 2011
2002 2011 2002 2011 2002 2011 2002 2011
Brazil India China South Africa
Beef, boneless, frozen 48 483 42 477
1 4
Chicken cuts, frozen 13 391 7 0 5 7
Chicken pieces, frozen 20 280
2 3
Turkey cuts 3 73
Pork, frozen 1 68
1 1
Chilled boneless beef 0 28 7 0 4 1 1 5
Beef dried etc. 4 26
0 1
Beef offal 0 17 0 2
Beef bone in, Frozen 0 9 3 0
2 2
Pig offal 0 11
Chicken cuts chilled
0 5
Duck etc.
0 4
Beef bone in Chilled
1 4
Source: Global Trade Atlas
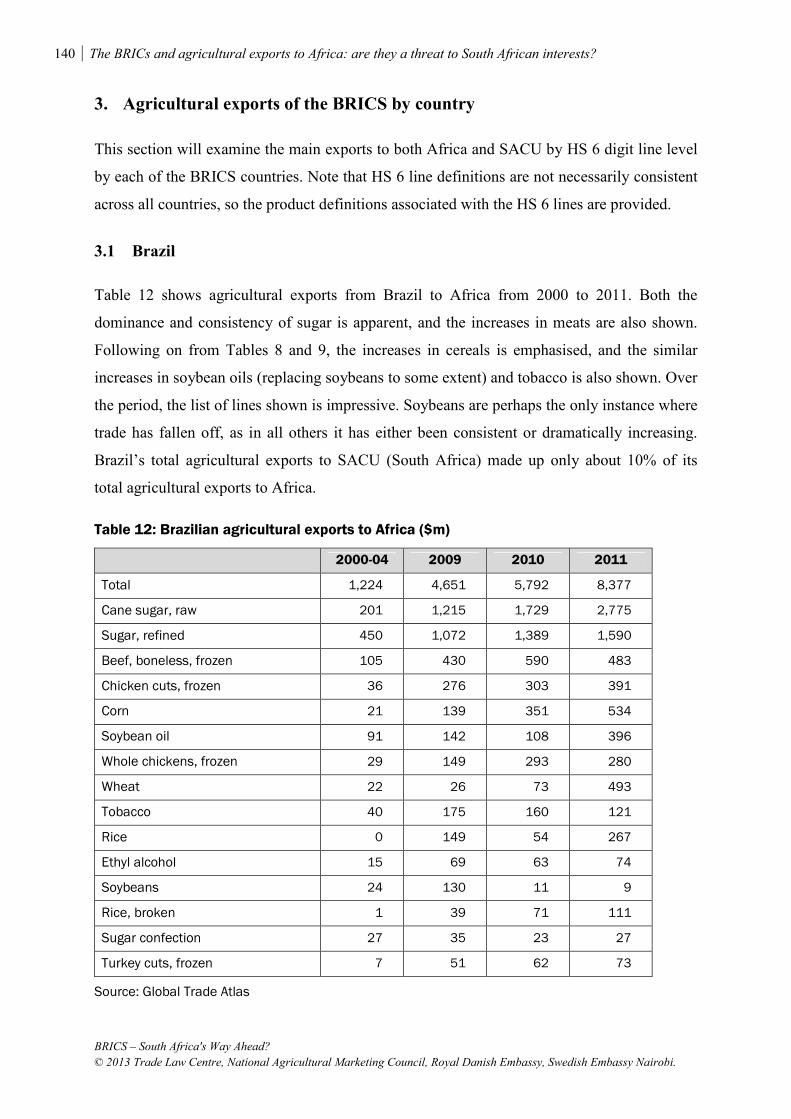
140 The BRICs and agricultural exports to Africa: are they a threat to South African interests?
BRICS – South Africa's Way Ahead?
© 2013 Trade Law Centre, National Agricultural Marketing Council, Royal Danish Embassy, Swedish Embassy Nairobi.
3. Agricultural exports of the BRICS by country
This section will examine the main exports to both Africa and SACU by HS 6 digit line level
by each of the BRICS countries. Note that HS 6 line definitions are not necessarily consistent
across all countries, so the product definitions associated with the HS 6 lines are provided.
3.1 Brazil
Table 12 shows agricultural exports from Brazil to Africa from 2000 to 2011. Both the
dominance and consistency of sugar is apparent, and the increases in meats are also shown.
Following on from Tables 8 and 9, the increases in cereals is emphasised, and the similar
increases in soybean oils (replacing soybeans to some extent) and tobacco is also shown. Over
the period, the list of lines shown is impressive. Soybeans are perhaps the only instance where
trade has fallen off, as in all others it has either been consistent or dramatically increasing.
Brazil’s total agricultural exports to SACU (South Africa) made up only about 10% of its
total agricultural exports to Africa.
Table 12: Brazilian agricultural exports to Africa ($m)
2000-04 2009 2010 2011
Total 1,224 4,651 5,792 8,377
Cane sugar, raw 201 1,215 1,729 2,775
Sugar, refined 450 1,072 1,389 1,590
Beef, boneless, frozen 105 430 590 483
Chicken cuts, frozen 36 276 303 391
Corn 21 139 351 534
Soybean oil 91 142 108 396
Whole chickens, frozen 29 149 293 280
Wheat 22 26 73 493
Tobacco 40 175 160 121
Rice 0 149 54 267
Ethyl alcohol 15 69 63 74
Soybeans 24 130 11 9
Rice, broken 1 39 71 111
Sugar confection 27 35 23 27
Turkey cuts, frozen 7 51 62 73
Source: Global Trade Atlas
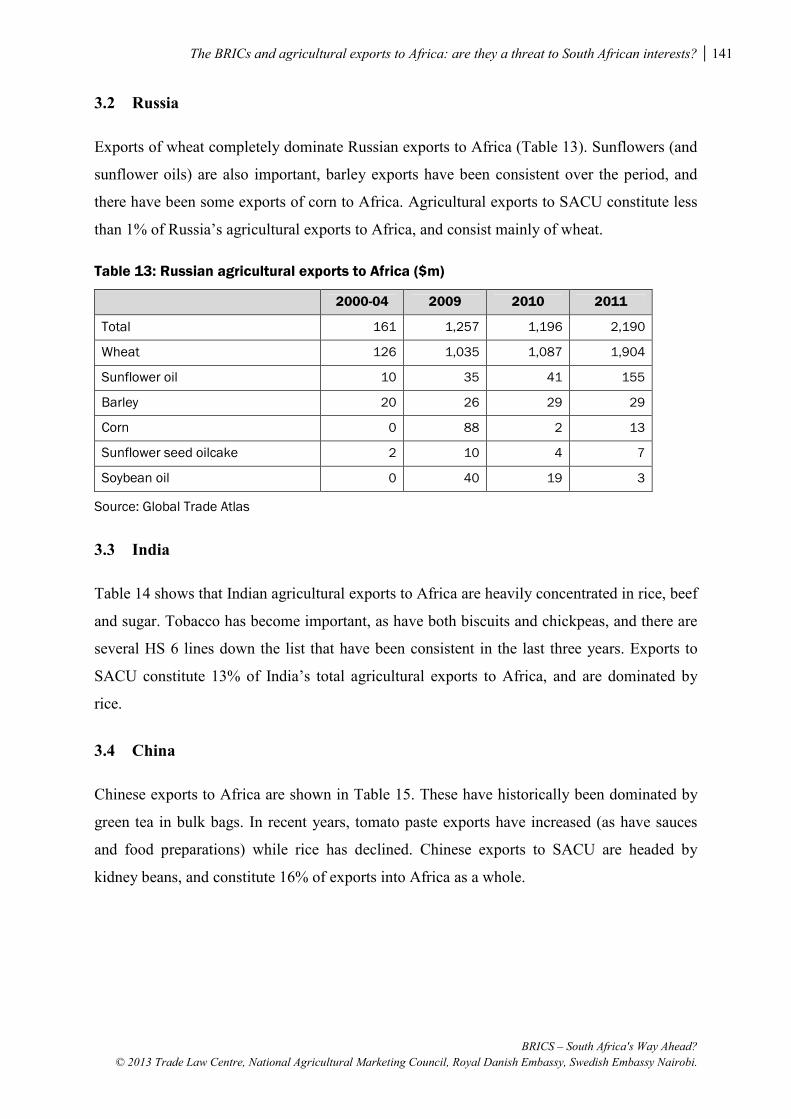
The BRICs and agricultural exports to Africa: are they a threat to South African interests? 141
BRICS – South Africa's Way Ahead?
© 2013 Trade Law Centre, National Agricultural Marketing Council, Royal Danish Embassy, Swedish Embassy Nairobi.
3.2 Russia
Exports of wheat completely dominate Russian exports to Africa (Table 13). Sunflowers (and
sunflower oils) are also important, barley exports have been consistent over the period, and
there have been some exports of corn to Africa. Agricultural exports to SACU constitute less
than 1% of Russia’s agricultural exports to Africa, and consist mainly of wheat.
Table 13: Russian agricultural exports to Africa ($m)
2000-04 2009 2010 2011
Total 161 1,257 1,196 2,190
Wheat 126 1,035 1,087 1,904
Sunflower oil 10 35 41 155
Barley 20 26 29 29
Corn 0 88 2 13
Sunflower seed oilcake 2 10 4 7
Soybean oil 0 40 19 3
Source: Global Trade Atlas
3.3 India
Table 14 shows that Indian agricultural exports to Africa are heavily concentrated in rice, beef
and sugar. Tobacco has become important, as have both biscuits and chickpeas, and there are
several HS 6 lines down the list that have been consistent in the last three years. Exports to
SACU constitute 13% of India’s total agricultural exports to Africa, and are dominated by
rice.
3.4 China
Chinese exports to Africa are shown in Table 15. These have historically been dominated by
green tea in bulk bags. In recent years, tomato paste exports have increased (as have sauces
and food preparations) while rice has declined. Chinese exports to SACU are headed by
kidney beans, and constitute 16% of exports into Africa as a whole.
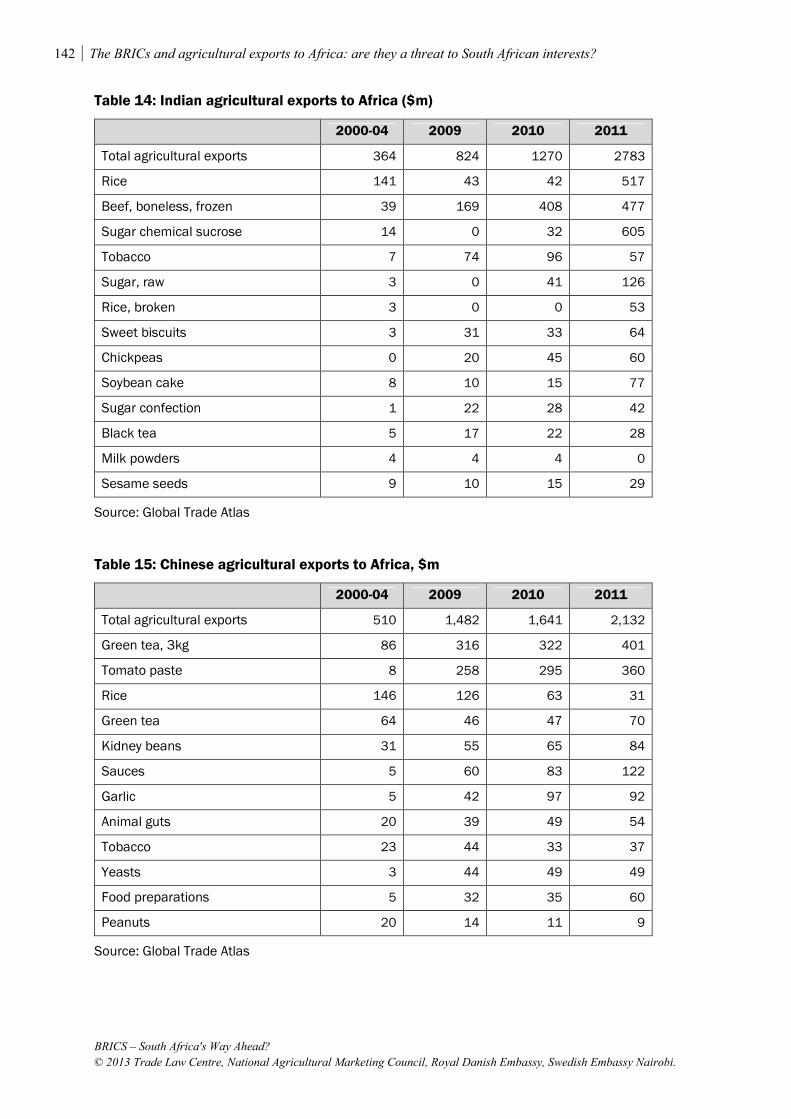
142 The BRICs and agricultural exports to Africa: are they a threat to South African interests?
BRICS – South Africa's Way Ahead?
© 2013 Trade Law Centre, National Agricultural Marketing Council, Royal Danish Embassy, Swedish Embassy Nairobi.
Table 14: Indian agricultural exports to Africa ($m)
2000-04 2009 2010 2011
Total agricultural exports 364 824 1270 2783
Rice 141 43 42 517
Beef, boneless, frozen 39 169 408 477
Sugar chemical sucrose 14 0 32 605
Tobacco 7 74 96 57
Sugar, raw 3 0 41 126
Rice, broken 3 0 0 53
Sweet biscuits 3 31 33 64
Chickpeas 0 20 45 60
Soybean cake 8 10 15 77
Sugar confection 1 22 28 42
Black tea 5 17 22 28
Milk powders 4 4 4 0
Sesame seeds 9 10 15 29
Source: Global Trade Atlas
Table 15: Chinese agricultural exports to Africa, $m
2000-04 2009 2010 2011
Total agricultural exports 510 1,482 1,641 2,132
Green tea, 3kg 86 316 322 401
Tomato paste 8 258 295 360
Rice 146 126 63 31
Green tea 64 46 47 70
Kidney beans 31 55 65 84
Sauces 5 60 83 122
Garlic 5 42 97 92
Animal guts 20 39 49 54
Tobacco 23 44 33 37
Yeasts 3 44 49 49
Food preparations 5 32 35 60
Peanuts 20 14 11 9
Source: Global Trade Atlas

The BRICs and agricultural exports to Africa: are they a threat to South African interests? 143
BRICS – South Africa's Way Ahead?
© 2013 Trade Law Centre, National Agricultural Marketing Council, Royal Danish Embassy, Swedish Embassy Nairobi.
BRIC agricultural exports to Africa: the 2012 update from Brazil and China
Trade data from China and Brazil for the 2012 year became available as this chapter went to
print. There were significant changes in the all-important agricultural global exports from
Brazil, as these were down by 33% overall. This included declines of 78% to China, 37% to
Africa in total and 23% to South Africa by destination, and globally a massive decline in
sugar and soybeans exports as they went from the two top commodities in 2011 to virtually
nothing in 2012. Most of the top export destinations in Africa declined during 2012, although
Angola at number two stayed the same while Libya at number eight almost doubled. By
commodity, sugar and wheat declined significantly while maize at number three increased by
65%. The main changes in Brazilian agricultural exports to South Africa were declines in
chicken cuts and edible offal by 22% (perhaps in the face of threatened action from South
African authorities against these imports, action which has now been dropped) and significant
increases in the export of both sugar and turkey meats. The relatively insignificant import of
agricultural products from South Africa into Brazil did increase by 50%, but this was from
$12 million in 2011 to $18 million in 2012.
Chinese global agricultural exports were down by 9.36% in 2012 over 2011, while those to
Africa were steadier with a decline of 1.3%. South Africa bucked the trend and saw Chinese
agricultural exports to them increase by 5.3%. There were few changes of note in Chinese
agricultural exports to Africa by either destination or HS 6 commodity line.
3.5 South Africa
Table 16 reports on South Africa’s agricultural exports to the continent. It is noticeable that
no commodity dominates the export portfolio: corn, sugar and food preparations have all
taken their turn as the single largest export item. Wine and apple exports have also grown
considerably over the past decade. Over the entire period corn has been the major export,
closely followed by sugar when both refined and raw sugar is considered. Sugar faces
significant competition in Africa from Brazil and to a lesser extent India, while Brazilian
exports of corn have increased in recent years.

144 The BRICs and agricultural exports to Africa: are they a threat to South African interests?
BRICS – South Africa's Way Ahead?
© 2013 Trade Law Centre, National Agricultural Marketing Council, Royal Danish Embassy, Swedish Embassy Nairobi.
Table 16: South African agricultural exports to Africa ($m)
2000-04 2009 2010 2011
Total agricultural exports 589 1,804 1,880 1,966
Corn 54 389 100 43
Sugar, refined 41 120 116 95
Cigarettes 32 47 68 73
Food preparations, other 19 70 96 123
Sugar, raw 40 46 77 64
Waters 38 51 24 31
Apples 15 53 72 98
Ethyl alcohol 12 39 114 33
Groats 5 40 34 41
Corn seed 23 28 18 20
Sunflower oil 5 55 95 69
Wine 8 31 45 46
Beer 27 18 14 18
Wheat 6 27 6 9
Wheat flour 8 21 35 44
Mixed fruit/vegetable juices 8 26 29 25
Source: Global Trade Atlas
4. South African trade with the BRICs
Table 17 shows South African agricultural imports by source, ranked by 2011 values and with
the EU aggregated. The final column enables a comparison of the relative growth over this
period. The EU has been the main source of agricultural imports over the entire period, with
Argentina in second place. However, the rapid rise of Brazil and China is also apparent.
Imports from India have been lower than the overall average, while Russia has seen dramatic
growth, but off an almost non-existent base. The losers in the top part of the table are the
United States, Australia and Zimbabwe. Thailand and Indonesia are the main non-BRIC
growth partners in the top part of the table.

The BRICs and agricultural exports to Africa: are they a threat to South African interests? 145
BRICS – South Africa's Way Ahead?
© 2013 Trade Law Centre, National Agricultural Marketing Council, Royal Danish Embassy, Swedish Embassy Nairobi.
Table 17: South Africa global agricultural imports by source, $m
1996-2000 2001-05 2006-08 2009 2010 2011 last/first
World 1,657 1,964 4,086 4,420 4,934 6,331 3.8
EU - 27 427 435 938 1,180 1,410 1,796 4.2
Argentina 184 268 760 608 589 781 4.2
Brazil 33 178 372 415 362 495 15.2
Thailand 75 129 329 483 463 482 6.4
United States 213 161 265 172 267 428 2.0
China 34 77 179 264 299 313 9.2
Malaysia 94 87 193 188 248 303 3.2
Indonesia 29 53 123 154 195 254 8.8
India 59 71 151 106 149 209 3.5
Australia 124 99 106 112 112 208 1.7
Canada 46 46 125 131 117 153 3.3
Zimbabwe 83 80 67 80 91 145 1.7
New Zealand 23 30 52 41 58 69 3.0
Vietnam 4 8 29 29 49 60 13.6
Ukraine 0 5 3 10 9 54 270
Zambia 15 37 38 29 42 51 3.5
Malawi 21 28 47 42 38 49 2.4
Mozambique 9 7 25 22 30 48 5.5
Pakistan 2 3 6 23 50 46 28.8
Switzerland 13 11 23 29 29 39 2.9
Russia 1 2 2 21 13 30 30.0
BRIC % 7.66 16.70 17.23 18.24 16.68 16.54 2
Source: Global Trade Atlas
Table 18 examines the same data, but this time by HS 6 product classification. Rice has been
the main import at this level overall and in every period except 2011, where it was overtaken
by wheat. Both soybean oilcake and palm oil, in third and fourth spots, have shown growth
well above the average, as have chicken cuts and soybean oil.

146 The BRICs and agricultural exports to Africa: are they a threat to South African interests?
BRICS – South Africa's Way Ahead?
© 2013 Trade Law Centre, National Agricultural Marketing Council, Royal Danish Embassy, Swedish Embassy Nairobi.
Table 18: South African global agricultural imports by HS 6 lines, $m
1996-2000 2001-05 2006-08 2009 2010 2011 last/first
Total 1,657 1,964 4,086 4,420 4,934 6,331 3.8
Rice 140 160 323 450 411 472 3.4
Wheat 86 118 284 282 274 600 7.0
Soybean oilcake 65 109 227 297 341 360 5.5
Palm oil 56 89 204 232 302 412 7.4
Whiskies 70 88 199 202 262 294 4.2
Chicken cuts, frozen 33 60 151 144 147 245 7.4
Food preparations, other 41 62 130 115 129 157 3.8
Tobacco 23 60 76 161 142 141 6.1
Soybean oil 0 38 91 64 225 296 740
Sunflower seed/oil 75 23 76 92 102 111 1.5
Cotton 56 73 51 46 51 102 1.8
Corn 28 47 112 5 5 23 0.8
Soybean oil 11 30 119 43 55 74 6.7
Animal guts 28 22 53 59 69 76 2.7
Coffee 32 19 46 39 51 71 2.2
Malt 30 23 32 76 19 45 1.5
Beer 7 7 65 145 22 26 3.6
Pork, frozen 12 22 37 43 57 76 6.4
Animal feed 18 22 40 33 42 63 3.4
Kidney beans 15 16 40 49 60 62 4.1
Source: Global Trade Atlas
Table 19 shows South African agricultural exports by destination, ranked by 2011 values,
with the EU aggregated. The final column enables a comparison of the relative growth over
this period. The EU has been the dominant destination of agricultural imports over the entire
period, but its growth rate has been below the overall average. Zimbabwe has been in second
place in recent years, and a notable change in 2011 is the emergence of Mexico in third place
(exclusively exports of corn). China and Russia, the only BRIC countries in the top 20, are
down the table, but China in particular is showing rapid growth. Six of the top 20 are African
markets, although only Nigeria is showing rapid growth. The main exports to Zimbabwe in
2011 were soybean oil, sunflower oil, and wheat. Exports to Mozambique were headed by
sugar, corn and prepared foods, while to Angola they were sugar, groats and fermented
beverages (cider etc.).

The BRICs and agricultural exports to Africa: are they a threat to South African interests? 147
BRICS – South Africa's Way Ahead?
© 2013 Trade Law Centre, National Agricultural Marketing Council, Royal Danish Embassy, Swedish Embassy Nairobi.
Table 19: South African agricultural exports by destination, $m
1996-2000 2001-05 2006-08 2009 2010 2011 last/first
World 2,422 3,115 4,548 5,626 6,455 7,227 3.0
EU-27 961 1,330 1,859 1,914 2,223 2,276 2.4
Zimbabwe 74 148 203 420 493 558 7.5
Mexico 8 1 3 1 2 383 46.7
Mozambique 124 135 212 251 397 342 2.8
Angola 98 127 144 173 176 247 2.5
Hong Kong 49 54 67 88 144 228 4.7
Korea South 43 41 43 20 102 228 5.4
United States 102 145 192 191 217 215 2.1
China 9 25 102 164 171 206 23.4
UAE 23 57 115 171 183 199 8.7
Japan 144 158 159 151 199 186 1.3
Russia 23 38 94 123 167 176 7.7
Zambia 47 62 125 135 129 155 3.3
Saudi Arabia 59 51 60 90 161 125 2.1
Canada 43 65 98 97 127 122 2.8
Malaysia 24 28 46 55 100 105 4.4
Nigeria 9 36 45 49 60 85 9.7
Taiwan 19 18 15 16 22 78 4.1
Australia 11 23 41 49 61 76 7.2
Kenya 56 40 69 332 114 76 1.3
BRIC total 32 63 196 287 338 382 12
BRIC % 1.32 2.02 4.31 5.10 5.24 5.29 4
Source: Global Trade Atlas
Table 20 examines the same data, but this time by HS 6 product classification. Corn has been
the main export in recent years, with the other top exports being very consistent. Note that as
the products are at the HS 6 level, some exports such as wine and sugar are listed twice when
the differences in detailed classifications are taken into account. Both lemons and macadamia
nuts have grown off a zero base, but otherwise there have been no real growth surprises.
Comparing this data with the South African exports to Africa as given in Table 16 provides an
indication of the importance of Africa for the individual commodities.

148 The BRICs and agricultural exports to Africa: are they a threat to South African interests?
BRICS – South Africa's Way Ahead?
© 2013 Trade Law Centre, National Agricultural Marketing Council, Royal Danish Embassy, Swedish Embassy Nairobi.
Table 20: South African global agricultural exports by HS 6 lines, $m
1996-2000 2001-05 2006-08 2009 2010 2011 last/first
Total 2,422 3,115 4,548 5626 6455 7,227 3.0
Corn 133 114 201 400 267 770 5.8
Oranges 147 208 390 430 601 625 4.3
Wine 156 345 492 526 549 504 3.2
Grapes 148 205 305 333 419 427 2.9
Apples, fresh 98 126 206 236 246 299 3.0
Wool 44 60 127 150 170 276 6.2
Wine 26 65 144 177 202 220 8.5
Pears 45 55 102 129 157 177 4.0
Food Preps 20 34 66 84 111 151 7.4
Lemons 0 37 65 77 107 139 na
Grapefruit 31 60 88 86 92 128 4.1
Macadamias 0 0 16 44 70 115 na
Mandarins 16 37 64 73 89 107 6.5
Ethyl Alcohol 24 62 97 99 179 102 4.2
Sugar 88 72 76 127 127 99 1.1
Sugar 173 172 160 256 115 98 0.6
Cigarettes 57 54 69 80 101 97 1.7
Soybean Oil 1 1 2 6 27 76 127
Plums 23 28 34 46 57 73 3.1
Peaches 42 53 58 64 78 71 1.7
Source: Global Trade Atlas
While perhaps not directly comparable with the Global Trade Atlas or the GTAP definitions
above, the FAO do publish agricultural trade data (FAOSTAT, 2012). Table 21 shows this
data for the BRICs and South Africa, indexed with the 2004-06 average as the base year. The
Index gives a clear idea of the relative changes in exports over time. South Africa starts
considerably ahead of the BRIC on this index at 1980. This indicates that the BRICs increased
their exports much more over the first pre-index period of 2005. After that date, from 2005
through to 2009, there are three growth groups. Both South Africa and China are at 148 by
2009, indicating an increase of 48% in value terms over this period. Brazil and India are both
similar (171 and 175, respectively), while the growth from Russia has been to a spectacular
237 index from the base 104 at 2005.

The BRICs and agricultural exports to Africa: are they a threat to South African interests? 149
BRICS – South Africa's Way Ahead?
© 2013 Trade Law Centre, National Agricultural Marketing Council, Royal Danish Embassy, Swedish Embassy Nairobi.
Table 21: Agricultural exports from the BRICS, 1980 – 2009 (Index, 2005=100)
1980 1985 1990 1995 2000 2005 2006 2007 2008 2009
Brazil 30 31 28 43 40 100 112 138 179 171
Russia 36 33 104 131 244 243 237
India 27 24 34 61 52 99 124 188 194 175
China 26 36 54 73 64 103 113 143 153 148
South Africa 69 29 51 62 59 107 101 110 144 148
Source: FAOSTAT, 2012
5. Competition for South Africa from the BRIC exporters
Tables 10 and 11 showed exports of cereals (wheat) and meat, respectively, from the BRICS
and emphasised that South Africa is not a serious exporter of these commodities. This was
further reinforced by the data in Table 18 which shows that these commodities, along with
soybean products and palm oil, are major imports into South Africa. Closer examination of
South Africa’s global exports in Table 18 and exports to Africa in Table 16 does, however,
highlight the importance of fruit exports and processed agricultural products. The chapter now
turns to an examination of the fruit exports (HS Chapter 08) and prepared foodstuffs, and
most of the other agricultural products in Section IV of the HS classifications that includes all
products in Chapters 16 (prepared meats) to 24 (tobacco and substitutes), except for HS 17,
sugar, which has been discussed earlier. Similarly, Chapters 16 (prepared meats) and 18
(cocoa and products) are also excluded as they are of minor significance.
Table 22 shows the top 20 processed agricultural products by overall exports from 1997 to
2011. These products are grouped at the HS 4 level and shown by ascending HS 4 codes.
There are three sets of data for firstly South Africa, and then Brazil, China and India. Russia
is excluded as there are only exports of $4 million in both beer and tobacco products but
otherwise no reported exports in the classifications used. The data presented enables an
assessment of where the BRIC exporters are “nipping at the heels” (or even passing
South Africa), either throughout the period or in recent years. There are several categories:
• Where South Africa faces no competition from these countries. This includes citrus
fruit, soups etc., beer, wine and fermented beverages. These make up some 21% of
South Africa’s exports into the rest of Africa in the categories included in the Table.

150 The BRICs and agricultural exports to Africa: are they a threat to South African interests?
BRICS – South Africa's Way Ahead?
© 2013 Trade Law Centre, National Agricultural Marketing Council, Royal Danish Embassy, Swedish Embassy Nairobi.
• Where there is emerging competition in recent years that is potentially threatening –
grapes and apples from China, prepared cereals from China and India, and waters from
Brazil and China. These make up 19% of South Africa’s exports into Africa in the
categories included in the Table.
• Where there already is serious competition that has grown dramatically in recent years
– malt extracts, bread and similar products, processed vegetables from China, fruit
juices from both China and a lesser extent Brazil, sauces from China, food
preparations not elsewhere specified (nes), ethyl alcohol from Brazil and India, animal
feeds from the three BRICs, and cigarettes and tobacco.
Clearly there are warning signals for South Africa from the dominant third group above, those
commodities where the competition is significant and in most instances increasing.

The BRICs and agricultural exports to Africa: are they a threat to South African interests? 151
BRICS – South Africa's Way Ahead?
© 2013 Trade Law Centre, National Agricultural Marketing Council, Royal Danish Embassy, Swedish Embassy Nairobi.
Table 22: Competition for South Africa from BRIC exports to Africa, $m
SA Brazil China India
2000/02 2009/11 2000/02 2009/11 2000/02 2009/11 2000/02 2009/11
Citrus fruit 29 68
Grapes 7 43
0 13 0 9
Apples 45 239 0 3 1 30
Malt extracts 14 50 0 40
0 11
Prepared cereals 5 68
0 4 0 11
Bread etc. 17 86 4 72 0 51 11 172
Processed vegetables
7 60 0 4 0 32
Fruit juice 42 207 1 19 7 118
Sauces etc. 14 75 0 8 22 273 0 4
Soups etc. 7 97 1 4 0 0
Food preparations nes
72 314 20 16 4 131 4 33
Waters 99 122 0 6 0 10 0 4
Beer 64 50 2 4
0 4
Wine 33 192
Fermented beverages
10 97
Ethyl alcohol 53 187 36 206
2 93
Ethyl alcohol 24 137 0 6 0 14 1 110
Animal feed 9 81 2 19 4 35 0 7
Cigarettes etc. 179 189 1 15 23 47 1 16
Tobacco etc. 3 78
3 21
Total 2440 422 758 495
Source: Global Trade Atlas
6. Conclusions
The purpose of this chapter has been to analyse the market for agricultural imports into
Africa, to establish the role that the BRICS countries play in this market, collectively and
individually, and to try and gain a better understanding of the opportunities and threats facing
South Africa in the African market. To this end, the trade data over the past decade, and in
some cases a longer period, were analysed from a number of different perspectives. The main
conclusions that are drawn from this analysis are:

152 The BRICs and agricultural exports to Africa: are they a threat to South African interests?
BRICS – South Africa's Way Ahead?
© 2013 Trade Law Centre, National Agricultural Marketing Council, Royal Danish Embassy, Swedish Embassy Nairobi.
1. BRICS agricultural exports to the rest of the world are increasing rapidly. In 2008/09,
the BRICS exported 11.5% of global agricultural exports, 14.6% of global exports to
Africa, and 18.1% of global exports to South Africa, up from 9.5%, 8.2% and 9.0% in
2000/01, respectively.
2. In 2011, South Africa (27.2%) and Russia (24.1%) had the highest proportionate
shares of their total agricultural exports going to Africa, followed by Brazil (10.3%),
India (9.2%), and China (4.4%). Nevertheless, Brazil was responsible for 48% of
BRICS agricultural exports into Africa, and South Africa for only 11.3% in 2011.
3. The agricultural exports of the BRICS countries are also concentrated by destination:
22% went to Egypt in 2011, with 54% going to the largest five destinations (Egypt,
Algeria, Nigeria, South Africa and Angola).
4. South Africa dominates agricultural exports into Zimbabwe, followed by
Mozambique, Angola and Kenya, but has no presence in North Africa. Russia has a
strong presence in Egypt, Tunisia and Kenya, while India dominates in Sudan and has
a strong share in both Ghana and Kenya. Brazil dominates across the continent, except
in Zimbabwe, Mozambique, Kenya and Sudan. South Africa is losing market share in
all markets excepting Zimbabwe, although the losses have generally been very small
over the past decade.
5. Sugar, cereals, and meat made up almost two thirds of the BRICS countries’
agricultural exports into Africa in 2011. These three commodities were 86% of
Brazil’s exports into the continent, 89% of Russia’s and 67% of India’s, but only 6%
of China’s and 16% of South Africa’s. Brazil, India and China gained market share
over the BRICS total for the period 2000-2011 for the top 15 export commodities,
while Russia and South Africa lost. Russia dominates wheat exports and Brazil the
exports of meat.
6. South Africa’s export portfolio into Africa is very diverse, with sugar, maize, and food
preparations all taking a turn as the largest over the past decade. The fastest growing
exports into Africa are wine and apples.
7. Some 16.5% of South Africa’s agricultural imports originate from the BRIC countries,
up from 7.5% a decade ago. These imports have increased more rapidly than imports

The BRICs and agricultural exports to Africa: are they a threat to South African interests? 153
BRICS – South Africa's Way Ahead?
© 2013 Trade Law Centre, National Agricultural Marketing Council, Royal Danish Embassy, Swedish Embassy Nairobi.
from the EU and from Argentina, South Africa’s biggest source of imports. Rice has
traditionally been the largest import, but was overtaken by wheat in 2011. When the
oilseeds and oilcake are combined, these make up the largest import category.
8. South Africa’s agricultural exports have tripled since the average for the period 1996-
2000, but have increased fourfold to China and Russia (agricultural exports to Brazil
and India are negligible). Nevertheless, these exports still constitute only 5.3% of
South Africa’s agricultural exports to the biggest 20 destinations, smaller than exports
to Zimbabwe, which have grown almost eight-fold since the average for 1996-2000.
9. South Africa’s exports of processed agricultural products into Africa can be divided
into three categories: a) where South Africa faces no competition from the BRIC
countries (products such as citrus fruit, soups etc., beer, wine and fermented
beverages, making up some 21% of these exports); b) where there is emerging
competition that is potentially threatening (e.g. grapes and apples from China,
prepared cereals from China and India, and waters from Brazil and China, making up
19% of the exports); and c) where there already is serious competition that has grown
dramatically in recent years (including malt extracts, bread and similar products,
processed vegetables from China, fruit juices from both China and a lesser extent
Brazil, sauces from China, food preparations not elsewhere specified (nes), ethyl
alcohol from Brazil and India, animal feeds from the three BRICs, and cigarettes and
tobacco).

Chapter 7
South African agricultural export prospects to the BRICs
Ron Sandrey and Taku Fundira1
The objective of this chapter is to examine the current South African agricultural export trade
profile to the BRIC countries of Brazil, Russia, India and China and to explore potential
future prospects for the expansion of this trade. We will be using the Global Trade Atlas data
for all direct trade flows between South Africa and the BRICs, or, more correctly, perhaps
between the BRICS as South Africa is now a member of the BRIC configuration. The data is
expressed in US dollar (million) values, and the World Trade Organisation (WTO) definition
of agriculture is used for compiling the data. We will start by showing the extant exports from
South Africa to the BRICs and follow this up with an analysis of the relative importance of
South African trade to the BRICs, completing the chapter with a presentation of the tariff
barriers and non-tariff measures that may be inhibiting this trade.
In summary, South Africa’s agricultural exports to the BRIC countries are modest, and in
recent years they have been around a slowly increasing 6% of the total agricultural exports.
China and Russia were each the destination of around $200 million during 2011, with India
taking some $43 million and Brazil an insignificant $12 million. Wool, oranges and sugar
have been the main exports, with other fruit to Russia and wine in general also important.
From a BRIC perspective, South Africa is a minor source of agricultural imports, and in no
instance has South Africa supplied even as much as 1% of the total; in most cases well below
this. Tariffs do not seem to be a major problem, although there are some instances, such as
New Zealand’s duty-free access for wool into China rather than the reported 38% general
1 We thank Nico Scheltema from the NAMC and Chad Morris from Adelaide University, Australia who undertook much of the data analysis during a Geek Week data training workshop at tralac during October 2011.

South African agricultural export prospects to the BRICs 155
BRICS – South Africa's Way Ahead?
© 2013 Trade Law Centre, National Agricultural Marketing Council, Royal Danish Embassy, Swedish Embassy Nairobi.
duty, where they are a barrier. Non-tariff measures are a problem in these BRIC markets, but
South Africa is not alone in facing these measures.
1. South Africa’s agricultural exports to the BRICs
The agricultural exports to the BRICs are shown in Table 1, from the initial period of 1996
through to the December 2011 year. China is the main BRIC destination, followed by Russia,
India and a distant Brazil. Over the period shown, the BRIC total as a percentage of South
African exports has ranged from a low of 1.29% in 2000 to the 2010 high of 6.15%. On the
right-hand side, ‘Change’ represents the increase in 2011 over the base year of 2000. The
global increase by 2011 was 3.22 times the 2000 values, while the BRIC countries of China,
Russia and India were well above that increase and only Brazil significantly below the
average. Therefore, these markets are not very important but they are growing much faster
than the traditional markets.
Table 1: South Africa’s agricultural exports to the BRICs, $ million and shares
Destination 1996 2000 2005 2008 2009 2010 2011 Change
World 2,577 2,243 4,057 5,535 5,626 6,455 7,227 3.22
China 11 9 55 127 164 171 206 22.89
Russia 25 7 40 123 123 167 176 25.14
India 5 3 21 32 34 44 43 14.33
Brazil 82 10 6 7 9 15 12 1.20
BRIC total 123 29 122 289 330 397 437 15.07
BRIC % 4.77% 1.29% 3.01% 5.22% 5.87% 6.15% 6.05%
Source: Global Trade Atlas
Starting with China, we examine the agricultural exports in detail over the same period. This
analysis and subsequent analyses are undertaken at the HS 6 line level, so in some cases there
may be two product definitions that look the same but are slightly different at the detailed
level. In recent years, wool has consistently been over half of exports, with wine, fish meal
and sheepskins becoming increasingly important. In later tables we will study the market
shares in China, the main competitors and their market shares, and the tariff rates faced by
each importer into China.

156 South African agricultural export prospects to the BRICs
BRICS – South Africa's Way Ahead?
© 2013 Trade Law Centre, National Agricultural Marketing Council, Royal Danish Embassy, Swedish Embassy Nairobi.
Table 2: Agricultural exports to China
1996 2000 2005 2007 2008 2009 2010 2011
HS Total 11 9 55 111 127 164 171 206
510111 Wool 0 4 5 54 68 114 63 111
220421 Wine 0 0 1 2 4 5 10 19
230120 Fish meal 0 0 8 14 10 8 38 19
410210 Sheep skins 0 0 2 6 9 6 12 11
080510 Oranges 0 0 3 2 2 2 4 9
410150 Hides & skins 0 0 3 1 3 4 7 9
520100 Cotton 0 0 9 0 1 3 3 5
410221 Sheep skins 0 1 2 0 0 0 2 3
110220 Maize flour 0 0 0 0 0 0 0 2
240120 Tobacco 0 1 5 13 10 4 6 2
220429 Wine 0 0 0 0 2 2 1 1
170111 Sugar 3 0 4 0 0 0 0 0
Subtotal 3 6 42 92 109 148 146 191
Source: Global Trade Atlas
Next in order of importance is Russia, and Table 3 shows that these exports are almost
exclusively fruit products (if you classify grape wine as a fruit product). Oranges have been
the star performers, followed by increasing exports of lemons, grapefruit, pears, grapes and
mandarins. Sugar, in the lower row, has been included because it has been important in some
years.
Wool almost completely dominates the exports to India, with three separate lines shown in
Table 4, although there is some activity in the fruit trade and sugar was important in the early
years. India is a large sugar producer, but it is also a large sugar consumer. Its domestic
supply/consumption equation is roughly in balance, meaning that it is a ‘swing’ trader on the
international market, importing in some years and exporting in others. Pears and oranges are
starting to gain a presence in the Indian market.

South African agricultural export prospects to the BRICs 157
BRICS – South Africa's Way Ahead?
© 2013 Trade Law Centre, National Agricultural Marketing Council, Royal Danish Embassy, Swedish Embassy Nairobi.
Table 3: Agricultural exports to Russia
1996 2000 2003 2005 2007 2008 2009 2010 2011
HS Total 25 7 55 40 89 123 123 167 176
080510 Oranges 5 4 26 18 43 41 46 76 72
080550 Lemons 0 0 3 1 1 4 7 14 18
080540 Grapefruit 0 0 1 2 8 9 7 11 16
080820 Pears 0 0 2 2 7 14 13 16 15
080610 Grapes 0 0 2 4 4 15 8 15 14
080520 Mandarins 0 0 1 3 4 6 7 8 10
080810 Apples 3 1 3 1 3 9 6 3 8
220429 Wine 0 0 0 0 1 9 4 4 5
200870 Peaches 0 0 0 1 2 3 2 8 4
220421 Wine 0 0 1 2 5 4 3 3 4
200799 Jams, etc. 1 0 1 0 0 0 0 2 3
200949 Pineapple juice 0 0 1 1 1 1 0 0 3
170111 Sugar 8 0 11 0 0 0 14 0 0
Subtotal 17 5 52 35 79 115 117 160 172
Source: Global Trade Atlas
Table 4: Agricultural exports to India
1996 2000 2003 2005 2007 2008 2009 2010 2011
HS Total 5 3 6 21 34 32 34 44 43
510111 Wool 1 0 2 6 16 20 17 31 30
080820 Pears 0 0 0 0 1 1 1 2 4
510119 Wool 0 0 0 0 0 0 0 0 2
080510 Oranges 0 0 0 0 1 0 1 2 1
510121 Wool 0 0 0 0 0 0 0 0 1
170111 Sugar 0 0 0 5 12 5 10 0 0
Subtotal 1 0 2 11 30 26 29 35 38
Source: Global Trade Atlas
South African agricultural exports to Brazil are, at best, modest. After all, what present do
you give to someone who has everything? There are two lines of alcohol dominating the
trade, and in the early years ethyl alcohol was important.

158 South African agricultural export prospects to the BRICs
BRICS – South Africa's Way Ahead?
© 2013 Trade Law Centre, National Agricultural Marketing Council, Royal Danish Embassy, Swedish Embassy Nairobi.
Table 5: Agricultural exports to Brazil
1996 2000 2003 2005 2007 2008 2009 2010 2011
HS Total 82 10 6 6 7 7 9 15 12
220870 Liqueurs 0 1 1 2 3 3 3 5 5
220421 Wine, casks 0 0 0 1 2 1 2 4 3
080620 Grapes, dried 0 0 0 0 0 0 1 2 1
120720 Cotton seeds 0 0 0 0 0 0 0 0 1
120991 Vegetable seeds 0 0 0 1 0 0 0 0 1
220300 Beer 6 0 0 0 0 0 0 0 0
220710 Ethyl alcohol 0 4 0 0 0 0 0 0 0
220720 Ethyl alcohol 74 2 0 0 0 0 0 0 0
Subtotal 80 7 1 4 5 4 6 11 11
Source: Global Trade Atlas
The grand totals for all four BRICs combined over the 16 years from 1996 to 2011 inclusive
are shown in Table 6. Over this period, some 4.3% of South Africa’s total agricultural exports
went to the BRICs, but the bottom row shows that where the BRICs are important, a greater
8.0% of the total went to these BRICs. Ranked by HS codes, wool is the top HS 6 export line,
followed by oranges, cane sugar, and ethyl alcohol. The 15 lines shown represent
$2,064 million (79.1%) of the $2,611 million in exports over the period. The exports of wool
to the BRICs represented some 39.4% of total South African global exports over the period
(right-hand column), while for oranges, the second most important export HS line, the BRICs
took 9.9% of the total global exports.

South African agricultural export prospects to the BRICs 159
BRICS – South Africa's Way Ahead?
© 2013 Trade Law Centre, National Agricultural Marketing Council, Royal Danish Embassy, Swedish Embassy Nairobi.
Table 6: Top 15 HS lines aggregated to BRICs, 1996 to 2011, $ million and % share SA
exports
to BRICs Global % to BRICs
HS code Grand total 2,611 60,636 4.3%
510111 Wool 590 1,497 39.4%
080510 Oranges 457 4,602 9.9%
170111 Cane sugar 155 2,674 5.8%
220720 Ethyl alcohol 142 331 42.9%
230120 Fish meal & pellet 106 268 39.6%
080820 Pears and quinces 90 1,269 7.1%
220421 Wine 87 5,559 1.6%
080610 Grapes 74 3,855 1.9%
240120 Tobacco 67 422 15.9%
080540 Grapefruit 62 1,024 6.1%
080550 Lemons and limes 52 702 7.4%
410210 Sheep, lamb skins 52 248 21.0%
080810 Apples 51 2,522 2.0%
080520 Mandarins 46 729 6.3%
410150 Whole hides & skins 33 140 23.6%
Subtotal 2,064 25,842 8.0%
Source: Global Trade Atlas
Table 7 again shows the top 15 aggregated HS 6 lines to the BRICs combined, but this time
the data is ranked by the percentage of the line that has gone to the BRICs over the entire
period. Ethyl alcohol, an export in earlier times, is ranked number one with 42.9% destined
for the BRICs. Table 7 emphasises the importance of the BRICs to South Africa in these
15 trade lines, as the bottom right-hand entry of the table shows that 16.3% of the global
exports in these HS lines went to the BRICs over the entire period. Nine of the entries are
common to both tables, suggesting that where the values are high, they are more important to
South Africa than just the raw data would indicate.
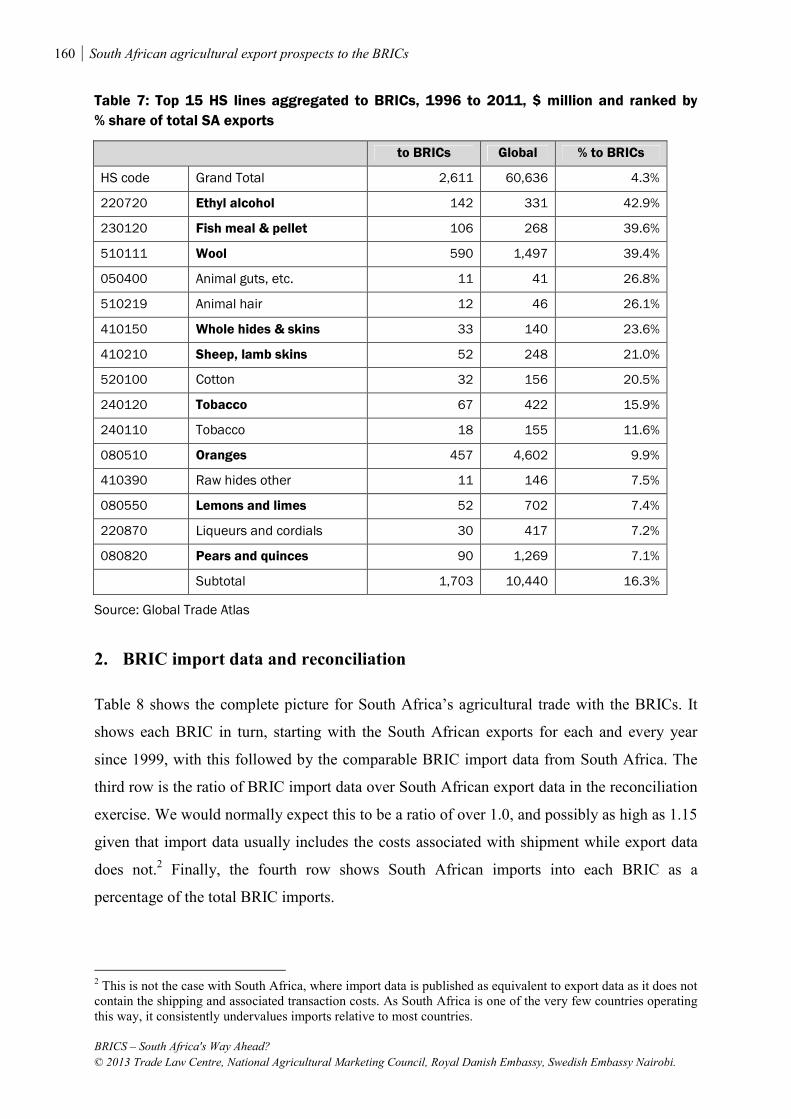
160 South African agricultural export prospects to the BRICs
BRICS – South Africa's Way Ahead?
© 2013 Trade Law Centre, National Agricultural Marketing Council, Royal Danish Embassy, Swedish Embassy Nairobi.
Table 7: Top 15 HS lines aggregated to BRICs, 1996 to 2011, $ million and ranked by
% share of total SA exports
to BRICs Global % to BRICs
HS code Grand Total 2,611 60,636 4.3%
220720 Ethyl alcohol 142 331 42.9%
230120 Fish meal & pellet 106 268 39.6%
510111 Wool 590 1,497 39.4%
050400 Animal guts, etc. 11 41 26.8%
510219 Animal hair 12 46 26.1%
410150 Whole hides & skins 33 140 23.6%
410210 Sheep, lamb skins 52 248 21.0%
520100 Cotton 32 156 20.5%
240120 Tobacco 67 422 15.9%
240110 Tobacco 18 155 11.6%
080510 Oranges 457 4,602 9.9%
410390 Raw hides other 11 146 7.5%
080550 Lemons and limes 52 702 7.4%
220870 Liqueurs and cordials 30 417 7.2%
080820 Pears and quinces 90 1,269 7.1%
Subtotal 1,703 10,440 16.3%
Source: Global Trade Atlas
2. BRIC import data and reconciliation
Table 8 shows the complete picture for South Africa’s agricultural trade with the BRICs. It
shows each BRIC in turn, starting with the South African exports for each and every year
since 1999, with this followed by the comparable BRIC import data from South Africa. The
third row is the ratio of BRIC import data over South African export data in the reconciliation
exercise. We would normally expect this to be a ratio of over 1.0, and possibly as high as 1.15
given that import data usually includes the costs associated with shipment while export data
does not.2 Finally, the fourth row shows South African imports into each BRIC as a
percentage of the total BRIC imports.
2 This is not the case with South Africa, where import data is published as equivalent to export data as it does not contain the shipping and associated transaction costs. As South Africa is one of the very few countries operating this way, it consistently undervalues imports relative to most countries.

Table 8: The big picture: South African exports and the BRIC imports, $ million; reconciliation ratio; and SA share BRIC imports
Brazil
1999 2000 2001 2002 2003 2004 2005 2006 2007 2008 2009 2010 2011 Total
SA exports $m 4 10 6 3 6 5 6 7 7 7 9 15 12 97
BRIC imports $m 6 12 7 3 6 4 5 5 8 7 9 13 12 97
Reconciliation 1.5 1.2 1.2 1.0 1.0 0.8 0.8 0.7 1.1 1.0 1.0 0.9 1.0 1.00
Imports % share total 0.15 0.30 0.21 0.09 0.17 0.13 0.16 0.12 0.15 0.09 0.14 0.16 0.11 0.15
Russia
SA exports $m 29 7 22 22 55 53 40 69 89 123 123 167 176 975
BRIC imports $m 40 13 32 48 66 69 56 104 135 194 178 215 233 1,383
Reconciliation 1.4 1.9 1.5 2.2 1.2 1.3 1.4 1.5 1.5 1.6 1.4 1.3 1.3 1.42
Imports % share total 0.50 0.18 0.36 0.49 0.60 0.55 0.36 0.53 0.55 0.61 0.68 0.69 0.63 0.57
India
SA exports $m 4 3 8 6 6 20 21 9 34 32 34 44 43 264
BRIC imports $m 34 22 16 7 15 25 28 8 20 28 37 48 41 329
Reconciliation 8.5 7.3 2.0 1.2 2.5 1.3 1.3 0.9 0.6 0.9 1.1 1.1 1.0 1.25
Imports % share total 0.89 0.77 0.48 0.19 0.33 0.51 0.51 0.14 0.29 0.33 0.32 0.36 0.25 0.36
China
SA exports $m 10 9 13 8 23 26 55 69 111 127 164 171 206 992
BRIC imports $m 15 14 19 17 16 16 47 67 140 153 215 299 333 1,351
Reconciliation 1.5 1.6 1.5 2.1 0.7 0.6 0.9 1.0 1.3 1.2 1.3 1.7 1.6 1.36
Imports % share total 0.20 0.14 0.18 0.16 0.09 0.06 0.18 0.23 0.37 0.28 0.44 0.44 0.38 0.31
Source: Global Trade Atlas

162 South African agricultural export prospects to the BRICs
BRICS – South Africa’s Way Ahead?
© 2013 Trade Law Centre, National Agricultural Marketing Council, Royal Danish Embassy, Swedish Embassy Nairobi.
In general, the table gives a consistent picture. In the right-hand column, the ratio of BRIC
imports to South African exports is 1.42 with Russia, 1.25 with India, and 1.36 with China –
all perhaps a little higher than we would have expected, but then, the high transaction costs
associated with these markets may be a factor. For Brazil, the reconciliation over the period is
exactly the same. More differences are apparent in the individual annual reconciliation, but
several factors such as shipping times and currency fluctuations may explain much of this.
Finally, the fourth row for each BRIC shows the percentage share of agricultural imports held
by the respective BRIC. South Africa has the highest overall average share in Russia, and the
0.57% share is very consistent across years. This is followed by the average share of 0.36% in
India and the slightly lower 0.31% in China, again with a degree of consistency across the
years. Finally, the lowest share is in Brazil, but again the share is reasonably consistent. This
consistency suggests that exporters are building valuable business relationships that are
standing the test of time and the markets are not being treated as one-off ‘opportunity’
markets.
The individual BRIC perspective31
The next set of four tables following from Table 8 provides trade data from the GLOBAL
Trade Analysis set from each of the BRIC countries along with tariff data sourced from the
Market Access Data (MacMaps)42website. The first two columns provide the HS code and
product description, followed by four columns that detail the four main competitors to South
African imports. In each cell are 1) the country, 2) the relative market share, and 3) the tariff
faced by that importer on these imports. Note that there may be some approximation in the
actual data as occasionally more than one tariff line is provided at the HS 6 line detail.
Finally, on the right-hand side we show firstly South Africa’s market share during 2011 for
each line and the tariff reported by MacMaps for these South African imports. The format is
the same for China, Russia, India and Brazil (listed not by their BRIC acronym but by their
importance as export destinations for South Africa). As outlined above, these tables
presenting South African imports are meagre.
31We thank Nico Scheltema from the NAMC for this information gleaned during tralac’s ‘Geek Week’ in October 2012. 42Available: http://www.macmap.org/Main

South African agricultural export prospects to the BRICs 163
BRICS – South Africa's Way Ahead?
© 2013 Trade Law Centre, National Agricultural Marketing Council, Royal Danish Embassy, Swedish Embassy Nairobi.
Table 9: Chinese agricultural imports from South Africa, 2011
Competitor shares and tariff rates and South African market shares and tariffs
HS Product Rank 1 Rank 2 Rank 3 Rank 4 SA
2011 share
SA Duty (%)
510111 Wool Australia; 79.7; 38
New Zealand; 6.9; 0
Uruguay; 1.7; 38
Argentina; 1.1; 38
4.6 38
410150 Skins US; 56.7; 6.1
Australia; 14.5; 6.1
Canada; 7.5; 6.1
Germany; 3.5; 6.1
3.9 6.1
080510 Oranges US; 66.2; 11
Taiwan; 0.9; 11
Australia; 0.2; 11
32.7 6.2
220421 Wine casks France; 55.3; 14
Australia; 15.2; 14
Italy; 6.1; 14
Chile; 5.4; 5.6
1.6 14
230120 Fish meal Peru; 38.8; 2.4
US; 13.1; 3.5
Chile; 11.4; 1.4
Russia; 3.7; 3.5
1.1 3.5
410120 Hides & skin Netherlands; 22.1; 6
New Zealand; 20.1; 0.53
US; 10.3; 6
Uruguay; 5.8; 6
29.8 6
200870 Peaches, tins Greece; 6.7; 15
Chile; 4.8; 4
88.2 15
520100 Cotton US; 29.5; 6.8
India; 28.8; 6.8
Australia; 16.5; 6.8
Brazil; 6.9; 6.8
0.1 10
080260 Macadamia Australia; 72.8; 12
Zimbabwe; 7.5; 12
Kenya; 3.2; 12
Thailand; 1.8; 0
14.5 12
Source: Chinese Global Trade Atlas data and MacMaps for tariffs
Note the high tariffs in several of the trade lines, and in particular the 38% on wool, a
common tariff for each importer except New Zealand as New Zealand has a Free Trade
Agreement (FTA) with China. This FTA applies to HS 410120 (hides and skins) where there
is an advantage through the FTA. Also note that Chile has a preference in grapes and tinned
peaches (where South Africa has an overwhelming market share), and Thailand in macadamia
nuts. South Africa appears to have a preference in oranges, an import where it has a
significant market share.

164 South African agricultural export prospects to the BRICs
BRICS – South Africa’s Way Ahead?
© 2013 Trade Law Centre, National Agricultural Marketing Council, Royal Danish Embassy, Swedish Embassy Nairobi.
Table 10: Russian agricultural imports from South Africa, 2011
Competitor shares and tariff rates and South African market shares and tariffs
HS Product Rank 1 Rank 2 Rank 3 Rank 4 SA
2011 share
SA Duty (%)
080510 Oranges Egypt; 36.8; 3.75
Turkey; 18.0; 3.75
Morocco; 13.2; 3.75
Spain; 4.7; 5.0
4.6 6.2
080550 Lemons Turkey; 52.5; 3.81
Argentina; 20.0; 3.81
Spain; 10.0; 5.08
China; 1.3; 3.81
3.9 7.6
080540 Grapefruit Turkey; 37.9; 3.75
China; 21.7; 3.75
Israel; 13.4; 5.0
Mexico; 2.5; 3.75
32.7 5.9
080820 Pears Belgium; 37.7; 6.63
Argentina; 21.3; 10
Netherlands; 15.3; 6.63
Spain; 3.8; 6.63
1.6 16.5
080610 Grapes Turkey; 35.0; 3.75
Uzbekistan; 16.0; 0.0
Chile; 11.3; 3.75
Italy; 9.6; 5.0
1.1 3.8
080520 Mandarins Morocco; 27.2; 3.75
Turkey; 23.7; 3.75
Pakistan; 11.1; 3.75
Spain; 9.4; 5.0
29.8 7.0
080810 Apples Poland; 21.3; 22.0
China; 11.0; 16.5
Italy; 10.1; 22.0
Serbia; 8.7; 0.0
88.2 22.0
Source: Russian Global Trade Atlas data and MacMaps for tariffs
There are differences in the reported tariffs here, although these are minor except for 1) South
Africa’s and to a lesser extent Argentina’s high tariffs on oranges, 2) the variation in pears
with South Africa being the highest, and 3) Uzbekistan’s preference in grapes and Serbia’s
free entry of apples. The latter is of special interest as South Africa faces high tariffs despite a
market share of 88%. We do note that the Russian tariff schedule from MacMaps has more
than one entry at times per HS 6 line, and these differences could be partly seasonal.
Table 11: Indian agricultural imports from South Africa, 2011
Competitor shares and tariff rates and South African market shares and tariffs
HS code Product Rank 1 Rank 2 Rank 3 Rank 4 SA
2011 share
SA Duty (%)
510119 Wool Australia; 63.1; 5
US; 4.3; 5
China; 4.0; 5
Argentina; 1.7; 5
10. 6 5
080820 Pears China; 42.9; 30
US; 24.0; 30
Germany; 1.5; 30
Italy; 1.4; 30
22.1 30
510129 Wool Australia; 27.3; 5
New Zealand; 23.3; 5
China; 7.5; 5
Russia; 4.3; 5
2.5 5
080510 Oranges US; 47.0; 30
Australia; 19.2; 30
Egypt; 11.8; 30
China; 3.8; 30
7.3 30
510121 Wool UK; 38.8; 5
Uruguay; 20.3; 5
Australia; 15.5; 5
China; 9.8; 5
1.3 5
Source: Indian Global Trade Atlas data and MacMaps for tariffs
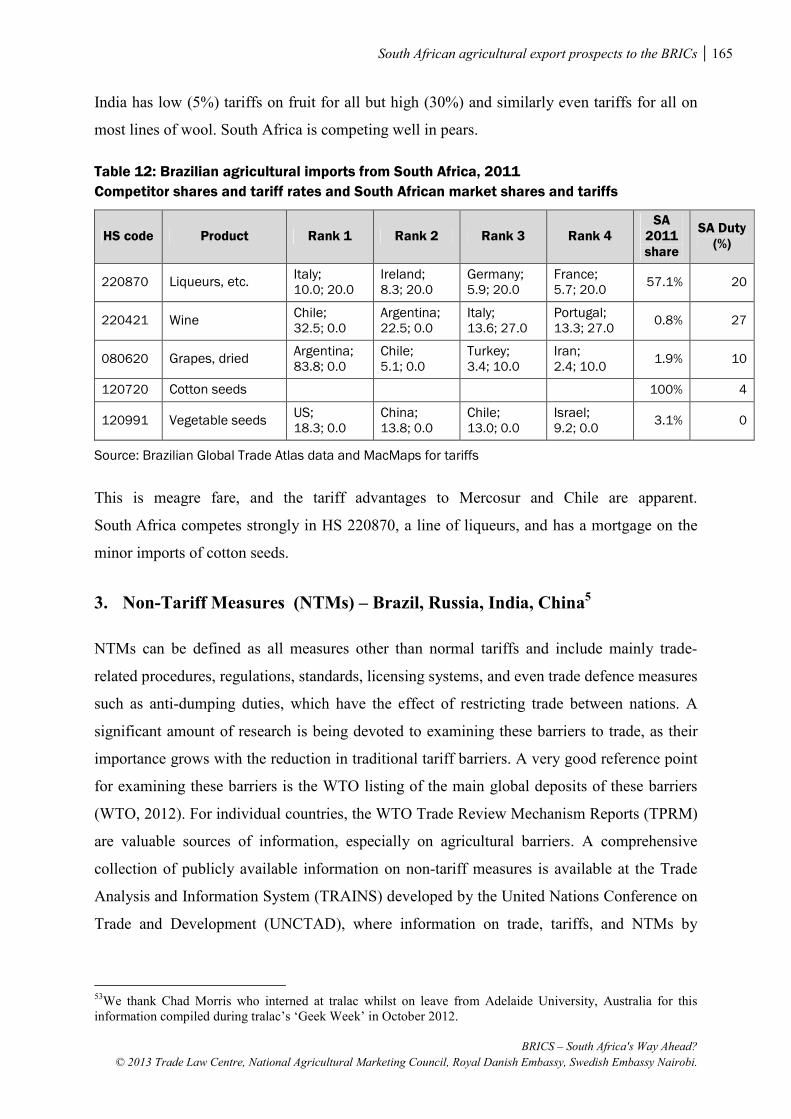
South African agricultural export prospects to the BRICs 165
BRICS – South Africa's Way Ahead?
© 2013 Trade Law Centre, National Agricultural Marketing Council, Royal Danish Embassy, Swedish Embassy Nairobi.
India has low (5%) tariffs on fruit for all but high (30%) and similarly even tariffs for all on
most lines of wool. South Africa is competing well in pears.
Table 12: Brazilian agricultural imports from South Africa, 2011
Competitor shares and tariff rates and South African market shares and tariffs
HS code Product Rank 1 Rank 2 Rank 3 Rank 4 SA
2011 share
SA Duty (%)
220870 Liqueurs, etc. Italy; 10.0; 20.0
Ireland; 8.3; 20.0
Germany; 5.9; 20.0
France; 5.7; 20.0
57.1% 20
220421 Wine Chile; 32.5; 0.0
Argentina; 22.5; 0.0
Italy; 13.6; 27.0
Portugal; 13.3; 27.0
0.8% 27
080620 Grapes, dried Argentina; 83.8; 0.0
Chile; 5.1; 0.0
Turkey; 3.4; 10.0
Iran; 2.4; 10.0
1.9% 10
120720 Cotton seeds
100% 4
120991 Vegetable seeds US; 18.3; 0.0
China; 13.8; 0.0
Chile; 13.0; 0.0
Israel; 9.2; 0.0
3.1% 0
Source: Brazilian Global Trade Atlas data and MacMaps for tariffs
This is meagre fare, and the tariff advantages to Mercosur and Chile are apparent.
South Africa competes strongly in HS 220870, a line of liqueurs, and has a mortgage on the
minor imports of cotton seeds.
3. Non-Tariff Measures (NTMs) – Brazil, Russia, India, China53
NTMs can be defined as all measures other than normal tariffs and include mainly trade-
related procedures, regulations, standards, licensing systems, and even trade defence measures
such as anti-dumping duties, which have the effect of restricting trade between nations. A
significant amount of research is being devoted to examining these barriers to trade, as their
importance grows with the reduction in traditional tariff barriers. A very good reference point
for examining these barriers is the WTO listing of the main global deposits of these barriers
(WTO, 2012). For individual countries, the WTO Trade Review Mechanism Reports (TPRM)
are valuable sources of information, especially on agricultural barriers. A comprehensive
collection of publicly available information on non-tariff measures is available at the Trade
Analysis and Information System (TRAINS) developed by the United Nations Conference on
Trade and Development (UNCTAD), where information on trade, tariffs, and NTMs by
53We thank Chad Morris who interned at tralac whilst on leave from Adelaide University, Australia for this information compiled during tralac’s ‘Geek Week’ in October 2012.

166 South African agricultural export prospects to the BRICs
BRICS – South Africa’s Way Ahead?
© 2013 Trade Law Centre, National Agricultural Marketing Council, Royal Danish Embassy, Swedish Embassy Nairobi.
Harmonised System (HS) tariff line can be found. Sandrey et al. (2008) examined specific
trade barriers in China and India facing South African agricultural exporters.
Unfortunately, these barriers seem to be increasing. According to the director-general of the
WTO in his report on trade-related developments issued on 29 June 2012, ‘there has been no
slowdown in the imposition of new trade restrictions over the past seven months’. He noted
that ‘the more recent wave of trade restrictions seems no longer to be aimed at combating the
temporary effects of the global crisis, but rather at trying to stimulate recovery through
national industrial planning, which is an altogether longer-term affair’.64This is a worrying
trend.
The objective for this section is more to provide a solid introduction to the types of barriers
expected in the BRIC markets rather than to present a detailed profile for each country. The
tables below provide an overview as given by the WTO TPRM for each country, and it can be
regarded as a base starting point rather than a comprehensive and exhaustive listing for each
country – if indeed such a list does exist.
64See http://www.wto.org/english/news_e/news12_e/devel_29jun12_e.htm

South African agricultural export prospects to the BRICs 167
BRICS – South Africa's Way Ahead?
© 2013 Trade Law Centre, National Agricultural Marketing Council, Royal Danish Embassy, Swedish Embassy Nairobi.
Table 13: A selection of the main non-tariff measures inhibiting imports into the BRICs
Brazil Russia
• Import licensing procedures, valuation of goods
at customs, pre-shipment inspection, and rules
of origin of goods are just some of Brazil’s NTMs.
• There are a number of internal measures to
assist agricultural production including
guaranteed producer prices and credit at
preferential rates.
• Internal tax system is complex and the tax
between federal and states in effect doubles the
actual cost of importing into Brazil.
• Goods from long distances are charged an
additional 25% merchant marine tax, whereas
Mercosur countries are not obliged to pay this
due to the close proximity to Brazil.
• Labelling and marking requirements are very
complex. All labels need to be in Portuguese.
• The cost of banking is high; long credit terms are
the usual practice; and a 90-day payment term
is normal.
• Automatic and non-automatic licences for
imports are applied through SECEX. Agricultural
products require mostly non-automatic licences.
• Technical Barriers to Trade (TBTs) are the most
common NTMs used in Brazil – standards and
regulations are generally more stringent than
common international standards.
• The agricultural sector receives various domestic
support measures from the government in the
form of price support and stabilisation, option
contracts and guaranteed minimum price,
although overall these support measures are
low.
• Brazil continues to be an active user of anti-
dumping measures.
• Government regularly adjusts its national import
regulations including tariffs and licensing
without notice.
• There is extensive state interference,
bureaucratic inconsistencies and regulatory
obscurity.
• Legal framework is poor, rule of law is not
strongly maintained, and the judiciary is not
independent of political pressures nor is it
consistent with applying the law.
• The protection of private property is weak.
• All labelling needs to be in Russian with the
relevant information.
• Agricultural products require a certificate of
conformity to allow customs clearance; these
are mandatory. Food products, goods of animal
origin, and plant products also require further
certifications –a hygiene certificate for food
products, a veterinary certificate for animal
products, and a phytosanitary certificate for
plant products.
• Corruption continues to remain a concern.
• State-owned enterprises continue to influence
prices as well as government subsidies.
• National standards and verification procedures
often differ from other national, regional and
international standards (ISO standards) and
foreign standards.
• Applying for an entry visa to Russia can be
rather burdensome.
• Tax laws are complicated and unpredictable,
and notifications of changes are not
communicated in a timely manner.
• Customs procedures are costly and
burdensome. Officers are arbitrary in their
interpretation of customs legislation.
• Most Sanitary and Phytosanitary (SPS)
measures are not consistent with international
standards and are not backed by any scientific
justification.

168 South African agricultural export prospects to the BRICs
BRICS – South Africa’s Way Ahead?
© 2013 Trade Law Centre, National Agricultural Marketing Council, Royal Danish Embassy, Swedish Embassy Nairobi.
India China
• Agricultural support policies promote domestic
production at the expense of import. Import
prohibitions and restrictions are used to ensure
domestic supply of specific products, and are
removed or applied as the circumstances
require.
• NTMs include price support, input subsidies,
prohibition of imports, strict inconsistent SPS
requirements, and burdensome customs
procedures.
• India’s import regime remains complex,
especially its licensing and permit system, as
well as its tariff structure which has multiple
exemptions that vary according to product, user,
or specific export promotion programs.
• Products that were previously subject to
quantitative restrictions are now considered as
sensitive products and are therefore subject to
above-average tariff rates. These include
bamboo, cocoa, copra, cotton, milk and milk
products, edible oils, food grains, fruits and
vegetables, poultry, tea and coffee, spices and
sugar.
• There is a wide gap between bound and applied
tariffs, which allows the government to modify its
tariffs substantially while still complying with
WTO requirements. However, India tends to
modify these frequently depending on domestic
and international conditions. The variability is a
complex process and creates uncertainty for
importers.
• It is common for the government to link the use
of trade policy instruments to domestic policy
considerations. The government has a tendency
to reduce the restrictions on certain imported
items when there is a need in the domestic
market for them and then to tighten them again
when they are not needed.
• In addition to the standard tariff rate, importers
are also required to pay additional duty
(‘countervailing duty’) and special additional
duty: the education cess and the secondary,
higher education cess.
• Importing companies must obtain an importer
exporter code from the General of Foreign Trade.
• Excessive government intervention occurs –
some government agencies have yet to embrace
the principles of the WTO of market access, non-
discrimination, and transparency.
• Before filing a customs declaration, the
individuals or organisation needs to be
registered as a foreign trade operator with the
Ministry of Commerce (MOFCOM) and Customs.
• SPS problems include questionable and arbitrary
practices, questionable scientific bases and
transparency, with the inconsistencies creating
confusion for traders as to if their goods will
pass. WTO members have at times questioned
the stringent SPS and TBT measures placed on
imported goods, whereas domestically made
goods are not required to meet the strict
standards.
• Increasingly, not all trade-related information is
being freely made available to the public,
thereby restricting importers to be able to make
comments or easily adjusting their products to
the new regulations.
• There are four levels of standards: national,
trade, local, and enterprise standards. These
vary according to the international standards.
Only 46% of national standards have been
adopted from international standards and
foreign standards.
• Customs officers are inconsistent with the
classification of imports and their valuation of
imports; it is therefore difficult to anticipate
border charges.
• The country does not apply the same high SPS
standards on domestic products as it does with
imported products.
• Labelling requirements with the necessary
information for all imported products need to be
in Mandarin (characters).
• State trading enterprises restrict the imports of
certain agricultural products. These state trading
companies have exclusive rights to import
certain products. Price distortion occurs as they
have a monopoly of products.

South African agricultural export prospects to the BRICs 169
BRICS – South Africa's Way Ahead?
© 2013 Trade Law Centre, National Agricultural Marketing Council, Royal Danish Embassy, Swedish Embassy Nairobi.
India China
• It currently takes 20 days to clear imported
products, including 9 days for document
preparation and 4 days for customs clearance
and technical inspections.
• A landing charge of 1% of cost, insurance, and
freight (CIF) value is added to the CIF value.
• SPS measures are applied inconsistently, are
irregular and not transparent; for example, SPS
measures seem to be less restrictive when India
has a shortage of a particular product.
• All goods imported must be labelled in English
and in Hindi; in some instances, companies may
be required to also have the local language
which could be one of India’s 16 official
languages.
• State trade companies play a significant role in
managing the supply and price of certain
agricultural products (some cereals, copra, and
coconut oil), urea, and petroleum oils. Controls
are based on domestic conditions.
• Although 84% of goods are harmonised with
international standards, 16% are based on
domestic regulatory standards.
• Some products are required to enter
predetermined ports.
• Customs clearance remains slow and expensive
compared to other international ports.
• Government frequently changes its tariff rates
without notification, particularly on agricultural
goods.
• Central and states provinces are inconsistent in
their requirements of imported goods.
• Tariff rate quotas are maintained on five lines at
the HS six-digit level.
• Corruption and the irregular application of the
law continue.
• India is one of the most active members of the
WTO to use anti-dumping measures.
• Discrepancies between central and provincial
agencies on import requirements exist, creating
delays for the approval of imports to pass.
• Value-added tax (VAT) is not applied consistently
to Chinese agricultural goods as it is to imports.
Even when the same VAT rate is applied, the way
it is calculated differs, with a more positive result
for domestic producers.
• Duplication of inspection and classification of
products occur.
• Tariff rate quotas (TRQs) are still applied to eight
categories of imported goods: wheat (6 lines),
maize (5), rice (14), sugar (6), wool (6), wool tops
(3), cotton (2), and chemical fertilisers (3).
• China still has a policy for the farming sector that
distorts the market mechanism mainly through
its subsidy on farming production and pricing.
• China also uses export prohibition to keep
domestic prices low.
• The domestic agricultural sector obtains
domestic support in the form of direct subsidies,
input subsidies, and market-price support.

170 South African agricultural export prospects to the BRICs
BRICS – South Africa’s Way Ahead?
© 2013 Trade Law Centre, National Agricultural Marketing Council, Royal Danish Embassy, Swedish Embassy Nairobi.
References
Cadot, O., Malouche, M. and Saez, S. 2012. Streamling Non Tariff Measures, A toolkit for
Policy Makers. World Bank.
Caffee, W.R. 2005. Non-tariff Barriers – Russia. University of Maryland University College.
[Online]. Available: www.globalitek.homestead.com/Wk_4_-_William_Non-
Tariff_Barriers.pdf
EU. 2012. Trade and Investment Barriers Report 2012. European Commission Brussels.
9SWD (2012) 19 Final.
Sandrey, R., Smit, L., Fundira, T. and Edinger, H. 2008. Non-tariff measures inhibiting South
African exports to China and India. Stellenbosch: tralac.
Swiss Business Hub Russia. 2012. Russia Legal Provisions. Zürich: Osec. [Online].
Available: www.osec.ch.
USITC. 2009. India: Effects of Tariffs and Non Tariffs Measures on US Agricultural exports,
Investigation No 332-504, November. US International Trade Commission.
WTO. Trade Policy Review Mechanism (TPRM) reports. Geneva: World Trade Organisation.
[Online]. Available: http://www.wto.org/english/tratop_e/tpr_e/tp_rep_e.htm#bycountry
WTO. 2012. World Trade Report 2012. Geneva: World Trade Organisation. [Online].
Available: http://www.wto.org/english/res_e/booksp_e/anrep_e/wtr12-2c_e.pdf


![China Eye - Society for Anglo-Chinese Understanding (SACU)SACU Registered Address: 15a Napoleon Road, Twickenham TW1 3EW SACU website Email info@sacu.org.uk President: [vacant] Vice](https://static.fdocuments.us/doc/165x107/5ed96724f59b0f56f45f6ce8/china-eye-society-for-anglo-chinese-understanding-sacu-sacu-registered-address.jpg)


![Q8 Answer roo*BäãJ Answer D roo*âåE] 07 Answer Answer](https://static.fdocuments.us/doc/165x107/5ab656c47f8b9a2f438d83b0/-q8-answer-roobj-answer-d-rooe-07-answer-answer.jpg)


