Columbia River System Operation Review - BPA.gov · thank those who reviewed the Columbia River...
92
Columbia River System Operation Review Final Environmental Impact Statement AppendixL Soils, Geology and Groundwater 11"" 11 us Armv Corps I , of Engineers ".'1 North Pacific Division DOEIEIS- O I 70 November 1 99 5
-
Upload
truongkhanh -
Category
Documents
-
view
216 -
download
0
Transcript of Columbia River System Operation Review - BPA.gov · thank those who reviewed the Columbia River...
Columbia River System Operation Review Final Environmental Impact Statement
AppendixL Soils, Geology and Groundwater
11"" 11 us Armv Corps I , of Engineers ".'1 North Pacific Division
DOEIEIS-O I 70 November 1995

PUBLIC INVOLVEMENT IN THE SOR PROCESS
The Bureau of Reclamation, Corps of Engineers, and Bonneville Power Administration wish to thank those who reviewed the Columbia River System Operation Review (SOR) Draft EIS and appendices for their comments. Your comments have provided valuable public, agency. and tribal input to the SOR NEPA process, Throughout the SOR. we have made a continuing effort to keep the public informed and involved.
Fourteen public scoping meetings were held in 1990. A series of public roundtables was conducted in November 1991 to provide an update on the status of SOR studies. Tbe lead agencies went back 10 most of the 14 communities in 1992 with 10 initial system operating strategies developed from the screening process. From those meetings and other consultations, seven SOS alternatives (with options) were developed and subjected to full-scale analysis. The analysis results were presented in the Draft EIS released in July 1994. The lead agencies also developed alternatives for the other proposed SOR actions, including a Columbia River Regional Forum for assisting in the detennination of future sass, Pacific Northwest Coordination Agreement alternatives for power coordination, and Canadian Entitlement Allocation Agreements alternatives. A series of nine public meetings was held in September and October 1994 to present the Draft EIS and appendices and solicit public input on the SOR. The lead agencies· received 282 fonnal written comments. Your comments have been used to revise and shape the alternatives presented in the Final EIS.
Regular newsletters on the progress of the SOR have been issued. Since 1990, 20 issues of Streamline have been sent to individuals, agencies, organizations, and tribes in the region on a mailing list of over 5,(X)(). Several special publications explaining various aspects of the study have also been prepared and mailed to those on the mailing list. Those include:
The Columbia River: A System Under Stress The Columbia River System: The Inside Story Screening Analysis: A Summary Screening Analysis: Volumes 1 and 2 Power System Coordination: A Guide to the Pacific Northwest Coordination
Agreement Modeling the System: How Computers are Used in Columbia River Planning DailylHourly Hydrosystem Operation: How the Columbia River System Responds to
Short-Tenn Needs
Copies of these documents, the Final ElS, and other appendices can be obtained from any of the lead agencies, or from libraries in your area.
Your questions and comments on these documents should be addressed to:
SOR Interagency Team P.O. Box 2988 Portland, OR 97208--2988

Geology Appendix
PREFACE: SETTING THE STAGE FOR THE SYSTEM OPERATION REVIEW
WHAT IS THE SOR AND WHY IS IT BEING CONDUCTED?
The Columbia River System is a vast and complex combination of Federal and non- Federal facilities used for many purposes including power production, irrigation, navigation, flood control, recreation, fish and wildlife habitat, and municipal and industrial water supply. Each river use competes for the limited water resources in the Columbia River Basin.
To date, responsibility for managing these river uses has been shared by a number of Federal, state, and local agencies. Operation of the Federal Columbia River system is the responsibility of the Bureau of Reclamation (Reclamation), Corps of Engineers (Corps) and Bonneville Power Administration (BPA)
The System Operation Review (SOR) is a study and environmental compliance process being used by the three Federal agencies to analyze future operations of the system and river use issues. The goal of the SOR is to achieve a coordinated system operation strategy for the river that better meets the needs of all river users. The SOR began in early 1990, prior to the filing of petitions for endangered status for several salmon species under the Endangered Species Act.
The comprehensive review of Columbia River operations encompassed by the SOR was prompted by the need for Federal decisions to (1) develop a coordinated system operating strategy (SOS) for managing the multiple uses of the system into the 21st century; (2) provide interested parties with a continuing and increased longterm role in system planning (Columbia River Regional Forum); (3) renegotiate and renew the Pacific Northwest Coordination Agreement (PNCA), a contractual arrangement among the region's major hydroelectric generating utilities and affected Federal agencies to provide for coordinated power generation on the Columbia River system; and (4) renew or develop new Canadian Entitlement Allocation Agreements
1995
(contracts that divide Canada's share of Columbia River 1featy downstream power benefits and obligations among three participating public utility districts and BPA). The review provides the environmental analysis required by the National Environmental Policy Act (NEPA).
This technical appendix addresses only the effects of alternative system operating strategies for managing the Columbia River system. The environmental impact statement (EIS) itself and some of the other appendices present analyses of the alternative approaches to the other three decisions considered as part of the SO R.
WHO IS CONDUCTING THE SOR?
The SOR is a joint project of Reclamation, the Corps, and BPA -the three agencies that share responsibility and legal authority for managing the Federal Columbia River System. The National Marine Fisheries Service (NMFS), U.S. Fish and Wildlife Service (USFWS), and National Park Service (NPS), as agencies with both jurisdiction and expertise with regard to some aspects of the SOR, are cooperating agencies. They contribute information, analysis, and recommendations where appropriate. The U.S. Forest Service (USFS) was also a cooperating agency, but asked to be removed from that role in 1994 after assessing its role and the press of other activities.
HOW IS THE SOR BEING CONDUCTED?
The system operating strategies analyzed in the SO R could have significant environmental impacts. The study team developed a three-stage process-scoping, screening, and full-scale analysis of the strategies-to address the many issues relevant to the SOR.
At the core of the analysis are 10 work groups. The work groups include members of the lead and cooperating agencies, state and local government agencies, representatives of Indian tribes, and members
FlNALEIS

of the public. Each of these work groups has a single river use (resource) to consider.
Early in the process during the screening phase, the 10 work groups were asked to develop an alternative for project and system operations that would provide the greatest benefit to their river use, and one or more alternatives that, while not ideal, would provide an acceptable environment for their river use. Some groups responded with alternatives that were evaluated in this early phase and, to some extent, influenced the alternatives evaluated in the Draft and Final EIS. Additional alternatives came from scoping for the SOR and from other institutional sources within the region. The screening analysis studied 90 system operation alternatives.
Other work groups were subsequently formed to provide projectwide analysis, such as economics, river operation simulation, and public involvement.
The three-phase analysis process is described briefly below.
•
•
ii
Scoping/Pilot Study-After holding public meetings in 14 cities around the region, and coordinating with local, state, and Federal agencies and Indian tribes, the lead agencies established the geographic and jurisdictional scope of the study and defined the issues that would drive the EIS. The geographic area for the study is the Columbia River Basin (Figure P-1). The jurisdictional scope of the SOR encompasses the 14 Federal projects on the Columbia and lower Snake Rivers that are operated by the Corps and Reclamation and coordinated for hydropower under the PNCA. BPA markets the power produced at these facilities. A pilot study examining three alternatives in four river resource areas was completed to test the decision analysis method proposed for use in the SOR.
Screening-Work groups, involving regional experts and Federal agency staff, were
FINALEIS
•
Geology Appendix
created for 10 resource areas and several support functions. The work groups developed computer screening models and applied them to the 90 alternatives identified during screening. They compared the impacts to a baseline operating year-1992-and ranked each alternative according to its impact on their resource or river use. The lead agencies reviewed the results with the public in a series of regional meetings in September 1992.
Full-Scale Analysis-Based on public comment received on the screening results, the study team sorted, categorized, and blended the alternatives into seven basic types of operating strategies. These alternative strategies, which have multiple options, were then subjected to detailed impact analysis. 1\venty-one possible options were evaluated. Results and tradeoffs for each resource or river use were discussed in separate technical appendices and summarized in the Draft EIS. Public review and comment on the Draft EIS was conducted during the summer and fall of 1994. The lead agencies adjusted the alternatives based on the comments, eliminating a few options and substituting new options, and reevaluated them during the past eight months. Results are summarized in the Final EIS.
Alternatives for the Pacific Northwest Coordination Agreement (PNCA), the Columbia River Regional Forum (Forum), and the Canadian Entitlement Allocation Agreements (CEAA) did not use the three-stage process described above. The environmental impacts from the PNCA and CEAA were not significant and there were no anticipated impacts from the Regional Forum. The procedures used to analyze alternatives for these actions are described in their respective technical appendices.
For detailed information on alternatives presented in the Draft EIS, refer to that document and its appendices.
1995
-

Geology Appendix
WHAT SOS ALTERNATIVES ARE CONSIDERED IN THE FINAL EIS?
Seven alternative System Operating Strategies (SOS) were considered in the Draft EIS. Each of the seven SOSs contained several options bringing the total number of alternatives considered to 21. Based on review of the Draft EIS and corresponding adjustments, the agencies have identified seven operating strategies that are evaluated in this Final EIS. Accounting for options, a total of 13 alternatives is now under consideration. Six of the alternatives remain unchanged from the specific options considered in the Draft EIS. One is a revision to a previously considered alternative, and the rest represent replacement or new alternatives. The basic categories of SOSs and the numbering convention remains the same as was used in the Draft EIS. However, because some of the alternatives have been dropped, the numbering of the final SOSs are not consecutive. There is one new SOS category, Settlement Discussion Alternatives, which is labeled SOS 9 and replaces the SOS 7 category. This category of alternatives arose as a consequence of litigation on the 1993 Biological Opinion and ESA Consultation for 1995.
The 13 system operating strategies for the Federal Columbia River system that are analyzed for the Final EIS are:
SOS la Pre Salmon Summit Operation represents operations as they existed from around 1983 through the 1990-91 operating year, prior to the ESA listing of three species of salmon as endangered or threatened.
SOS Ib Optimum Load-Following Operation represents operations as they existed prior to changes resulting from the Regional Act. It attempts to optimize the load-following capability of the system within certain constraints of reservoir operation.
SOS 2c Current Operation/No-Action Alternative represents an operation consistent with that specified in the Corps of Engineers' 1993 Supplemental EIS. It is similar to system operation that occurred
1995
in 1992 after three species of salmon were listed under ESA.
SOS 2d [New] 1994-98 Biological Opinion represents the 1994-98 Biological Opinion operation that includes up to 4 MAF flow augmentation on the Columbia, flow targets at McNary and Lower Granite, specific volume releases from Dworshak, Brownlee, and the Upper Snake, meeting sturgeon flows 3 out of 10 years, and operating lower Snake projects at MOP and John Day at MIP.
SOS 4c [Rev.] Stable Storage Operation with Modified Grand Coulee Flood Control attempts to achieve specific monthly elevation targets year-round that improve the environmental conditions at storage projects for recreation, resident fish, and wildlife. Integrated Rules Curves (IRCs) at Libby and Hungry Horse are applied.
SOS 5b Natural River Operation draws down the four lower Snake River projects to near riverbed levels for four and one-half months during the spring and summer salmon migration period, by assuming new low level outlets are constructed at each project.
SOS 5c [New] Permanent Natural River Operation operates the four lower Snake River projects to near riverbed levels year-round.
SOS 6b Fixed Drawdown Operation draws down the four lower Snake River projects to near spillway crest levels for four and one-half months during the spring and summer salmon migration period.
SOS 6d Lower Granite Drawdown Operation draws down Lower Granite project only to near spillway crest level for four and one-half months.
SOS 9a [New] Detailed Fishery Operating Plan includes flow targets at The Dalles based on the previous year's end-of-year storage content, specific volumes of releases for the Snake River, the drawdown of Lower Snake River projects to near spillway crest level for four and one-half months, specified spill percentages, and no fish transportation.
FINALEIS iii
•

SOS 9b [New] Adaptive Management establishes flow targets at McNary and Lower Granite based on runoff forecasts, with specific volumes of releases to meet Lower Granite flow targets and specific spill percentages at run -of-river projects.
SOS 9c [New] Balanced Impacts Operation draws down the four lower Snake River projects near spillway crest levels for two and one-half months during the spring salmon migration period. Refill begins after July 15. This alternative also provides 1994-98 Biological Opinion flow augmentation, integrated rule curve operation at Libby and Hungry Horse, a reduced flow target at Lower Granite due to drawdown, winter drawup at Albeni Falls, and spill to achieve no higher than 120 percent daily average for total dissolved gas.
SOS PA Preferred Alternative represents the operation proposed by NMFS and USFWS in their Biological Opinions for 1995 and future years; this SOS operates the storage projects to meet flood control rule curves in the fall and winter in order to meet spring and summer flow targets for Lower Granite and McNary, and includes summer draft limits for the storage projects.
WHAT DO THE TECHNICAL APPENDICES COVER?
This technical appendix is one of 20 prepared for the SOR. They are:
A. River Operation Simulation
B. Air Quality
C. Anadromous Fish & Juvenile Fish Transportation
D. Cultural Resources
E. Flood Control
F. Irrigation/Municipal and Industrial Water Supply
G. Land Use and Development
H. Navigation
iv FINALEIS
Geology Appendix
1. Power
J. Recreation
K. Resident Fish
L. Soils, Geology, and Groundwater
M. Water Quality
N. Wildlife
O. Economic and Social Impacts
p. Canadian Entitlement Allocation Agreements
Q. Columbia River Regional Forum
R. Pacific Northwest Coordination Agree-ment
S. U. S. Fish and Wildlife Service Coor-dination Act Report
T. Comments and Responses
Each appendix presents a detailed description of the work group's analysis of alternatives, from the scoping process through full-scale analysis. Several appendices address specific SO R functions (e.g., River Operation Simulation), rather than individual resources, or the institutional alternatives (e.g., PNCA) being considered within the SOR. The technical appendices provide the basis for developing and analyzing alternative system operating strategies in the EIS. The EIS presents an integrated review of the vast wealth of information contained in the appendices, with a focus on key issues and impacts. In addition, the three agencies have prepared a brief summary of the EIS to highlight issues critical to decisionmakers and the public.
There are many interrelationships among the different resources and river uses, and some of the appendices provide supporting data for analyses presented in other appendices. This Geology appendix relies on supporting data contained in Appendix M. For complete coverage of all aspects of geology, soils, and groundwater readers may wish to review both appendices in concert.
1995
OM

McHARY CofYmbLa RNw, ~ehlngmn Cor,. of £ng~ In MMc:e NoWmbw 15.1 t53 _,000 1dI0WIIItl of Cllpadly ptofect IiIM& Inc"," pewit, r.cI'NtJon, ...... -RUI'I-of-rtn( dam A~ !WIn_ ~ at 161.100 c:b
JOHN DAY Colum~. RJwr. OteganfWashfnvton CCIIr'pl of EnglnHrs In _rvIce Jury 1e. I. 2.180.000 kIowab of capKfty Prot-duuslndude power,~, __ ,Jood ............ _
R:w1-«-m.... deIn A~ ann_ d1sctt.,. of l72,JeOOcn
THE DALLES Columbia Rt\IoN, Oregon/W.~ <:«poal""""" m _nrte.1Iay 13., 1157 1.11O,DOO knowIittl: or <:aJ*flY Prvfed ...... lndlIft poMIr,~, and nlvtptlon Run-of-rfftr dem A~..,n_ lftiCMrveof 177.tOO ds
BONNeY/tiE CoIumbl.~.Or~ CotpI of EngtnMn; tn..,..JlIMa. lts1 1,D5O,OOO IdSowd:I of capIdty Ptojed ", .. Include pcIW'K. rtetHI1on, -.. -fb.I1- af-tfwoer dam Averao- annual dlsc:ha. 01 flS,300 d's
ICE HARBOR s,. ... RIftr. W.1Hngton <:«poal""""" In Mrvk:e o.e.rnw 11. ,N' eos,ooo tdlo'fttta of c:epKhy Ptofed ...... lncIud. POWW.I'8Ct'eIItion, --Run-ot-rtm' dam A ...... .ann .. dlKMI'ge of 47.&10 en
1 milion acre feet :::: 1 234 bilion cubic meters
CHIEF JOSEPH CoIUIMia fUNr, WHhIngtDn Corp$ of Engl ... In.me. August 20, 1155 2,Mt.ooo ~ Of c:eS-dty protfd " ... Indude ~ WId f'KI'NtSon Run- ot-rfwt dam A~ anrNaI dttcharge of 101POO da
LOWER MONUMENTAL .... Rtwr, WuhtnrgtDn' Corpt of Eng ... In ..mc.Mly2l.1 ...
.. 11D,OOD IdS .... of capIdtJ ~ .... tnefucfapower.~ ~.ndlmpUon
.... ---Awrage MIt. ~ Of 47.en c:h
1 cubic foot per second :::: 0.028 cubic meters per second
GRAND COULEE Col~. Rtwr. w~ ......... -1nMt'ke~r2l.1"1 8,41N,ooo knowdI: of c:apac:l'ly Protect .... IncIUde p<:IWIt, NCttlll1on. fWtttItioft. flood control, Met IntQatIon ....... -A~~~oIl07;700da $..ltmlllkH'l ~""of~," l,akeRooMwlt
.um.ECOOSE SMka Rhok, WathlngtDn c..po ...........
.. lit __no...., 2S, 1170 .,G,DOO ~ GIl capadty Proikt __ Indude poww. r'KtUIiD4. --Run-af-rfwf d.m ~ -=at dltcherOe oI47.23G da
AUlEN/FAUS P.-.d 0reIUe RMf. tdaho CorpJ of Engm..ta In HMc:e April " lt5$ 42,000 kUowda 01 capadtr Pro}td. LaAtl lnctud. poMf, taef'Udon, ~ Md flood COfItrot ........ m Aw,.ge ",mal dlKh~ of 25,340 ct. 1.1. mIWon acr.-fMt of acwave 4ft Lab .Pend Orela.
UBBY ~ RIYw. Uonb.na Corps of Engl,...,. In..me. Augu.c13. 1.75
~-"-ty Proftct UHf; Indud. poww..r.etellllon. nn1ptioa. 8nd ftood contra! --Awrage *""-1 dledwge of 11,sso eta 4-JNI mln}on Kn- fHt of"~ In Lab~nusa
HUNGRY HORSE AathNd fttwf' (SOuth Fork). Montana eu .... u of RedamdoR In ~ 0d0bef'7I. 1952 42 • .000 kBOINIIIIt 01 capacity Prot-d .... JftctLlde poww. tKrMtJon. nmpuon. ftood control. .ad lrrlptlon ........... AftnIgt- MnYlI dfa:chatge of :1.517 cfs 3.1. milion ac,.- feet of stcnge In ~ngryHorM~
DWORSHA/C CJnrwaer RIwr (North Fort:), IAho <:«po .. ........ I.n ..rvtce ... reh 1. 'BT.! 400,000 Idl~ of CIIpKI1J FroJec;t UMS include power. r-:r.tion, naotSgIItton. and tJcod conlTof Storag. datn A-.n:oe .... nual dtteherve of 5,120 d, 2..02 mBlIon IICR- feft gf ..... tn --
LOWER GRANITE SnaM R1 ....... Waahlngton Corps.of ~nnn tn M:I'YICa AprU 3. '97$ " 0,000 ldIowdtiI of capacity Ptofed. ..... lnchad. powet. t'KrMtIon,. _ ... ,-Run- ot-rtYer dam Aft,.;. ~J d~OfG,680 d,
Figure P-1. Projects in the System Operation Review.

Geology Appendix TABLE OF CONTENTS
TABLE OF CONTENTS
Chapter/Para
Prdace
I INTRODUCTION: SCOPE AND PROCESS. . . . . . . . . . . . . . . .• . . . .• . . . . . . . •.• . .. . . . . •. . I-I
1.1 SUMMARY OF ISSUES RAISED IN SCOPING . . . . . .•• . • . . •. . . . • . . . . • . . . . . . • . . . . . I-I
1.2 STUDY PROCESS ......................................................•.. . .. 1-2
1.2.1 Work Group Coordination . . . . . . . . . . . . . . . . . . . . . . . . . . . . . . . . . . . . .. . . . . . . . . . . . . . 1- 2
1.2.2 Pilot Study and Screening . ... . ............................................... )-2
1.2.3 Full-Scale Analysis . . . . . . . . . . . . . . . . . . . . . . . . . . . . . . . . . . . . . . . . . . . . . . . . . . . . . . . . . 1-2
2 GEOLOGY. SOILS AND GROUND WATER IN THE COLUMBIA RIVER BASIN TODAY . 2-1
2.1 PHySIOGRAPHy ....................................... . ..................... 2-)
2.2 GEOLOGy. ..... ....... ................ . . . .... .. ..... ... . .... . .. . .. . .... . .... 2-3
2.2.1 Geology of Physiographic Provinces .............. . . . .... ................. . .... 2 - 3
2.2.2 Geology of Project Areas . . . . . . . . . . . . . . . . . . . . . . . . . . . . . . . . . . . . . . . . . . . .. . . . . . . . 2-6
2.3 INFLUENCE OF PHYSIOGRAPHIC CHARACTERISTICS ON RIVER AND RESERVOIR CONDITIONS. . . . . . . . . . . . . . . . . . . . . . . . . . . . . . . . . . . . .• . . . . . . . 2-12
2.4 GROUNDWATER ...... ... . ..... ........ ........................ .... . .... .... 2-13
3 STUDY METHODS... .. .. ... . .. ... . .. ... . . . ... . ... •.. ... • . . . ... .. . . . . . .•. . . . • . ... 3 - 1
3.1 THE RESERVOIR ENVIRONMENT ..... . .. ..... . . . ... . .............. . ......... 3-1
3.1.1 Reservoir Variables.. .............................. . .............. . .... .... . 3-}
3.1.2 Reservoir Processes............... . . . ....................................... 3- 3
3.1.3 Erosion Response to Pool Level ...... . ............. .. ........................ 3- 7
3.1.4 Sedimentation .................... ............... .... ..... . ................ 3-9
3.2 STUDY PROCESS .... . . . ........•...........................•....•........... 3-9
3.2. 1 Erosion and Sedimentation... ... . ........................................... 3-9
3.2.2 Groundwater ....... .. ,......................... . .............. . ........... 3- 12
3.3 RElATIONSHIP TO OTHER STUDIES. . . . . . . . . . . . . . . . • . . . . . . . • . . . . •. . . . . . . . . . . 3- 13
3.3. 1 "Water Quality. . . . . . . . . . . . . . . . . . . . . . . . . . . . . . . . . . . . . • . .. . . . •. . . . . . . . . . . . . . . . . 3-13
3.3.2 Air Quality . . . . . . . . . . . . . . •. . .. . . . .. . . .. . . .. . . . . . .. . . .. . . . . . . . . . . . . . .. . . . . . . 3-13
3.3.3 Recreation ............................. ...... .... . ........... . . . ... . .. . ... 3-13
3.3.4 Cultural Resources....................... . ...... .. ........... .. ........ . ... 3- 13
4 ALTERNATIVES AND THEJR IMPACTS .. ... . .... . ..... . . . . .. . . . ... .. . ..... . ....... 4-1
4.1 GENERAL DESCRIPTION OF ALTERNATIVES. ........ . ....................... 4-1
4.1.1 SOS t·Pre-ESA Operation ...................... .. .. ........................ 4-14
1995 FlNAL EIS vII

TABLE OF CONTENTS Gro/ogy Appendix
TABLE OF CONTENTS - CONT
Chapter/Para
4.1.2 SOS 2·Current Operations ......................... , ......•.........• _ ... , _.. 4-14
4.1.3 sas 4·Slable Storage Project Operation .......•. •. ... . ..... . .•. ,..... . ........ 4-15
4.1.4 SOS 5-Natural River Operation .............••.• . .. . •.. . . • •. .... . •....... •... 4- 15
4.1.5 SOS 6-Fixed Drawdown .....................•....• _......................... 4-15
4.1.6 SOS 9-Settlement Discussion Alternatives ...... • .. ,............................ 4- 16
4.1.7 SOS PA-Preferred AJternative .................... _ • . .. _._ .. .. ... . ,. .•. .. ..... 4-16
4.1.8 Rationale for Selection of the Final SOSs .........•.........•.... •..•....•..... 4-17
4.2 SOS I, PRE-ESA OPERATION..... ............................. . .. . .......... 4-20
4.2.1 Shoreline Erosion and Mass Wasting. ........ . .... . ......... . .. . ..... .. .. . .... 4-20
4.2.2 Sedimentation .........................•.... . ......•.......•....•....•..... 4-22
4.2.3 Groundwater.... .......................................................... 4-23
4.3 SOS 2, CURRENT OPERATIONS......... .. ... . ....... . . . . . . . .. .... .... ... . .. . 4-23
4.3. 1 Shoreline Erosion and Mass Wasting..................... . .................... 4-23
4.3.2 Sedimentation ................................... . ....•....•............... 4-24
4.3.3 Groundwater ..................................................... . ........ 4-24
4.4 SOS 4, STABLE STORAGE PROJECT OPERATION ........ . ... . . . .... . . . ..... . .. 4-25
4.4.1 Shoreline Erosion and Mass Wasting ................... ....... • ... . ...•.• . .... 4-25
4.4.2 Sedimentat.ion . ......................... . ...•... .. ....•....•... . ... •.. . .... 4-25
4.4.3 Groundwater .............................•...... • ....... •.... • ....•....... 4-26
4.5 SOS 5, NATURAL RIVER OPERATION ....... . .•.... . .. . . . ............ . ...... . 4-26
4.5.1 Shoreline Erosion and Mass Wasting .......... .. . .... . ........... . . . . .. .. . .... 4-26
4.5.2 Sedimentation ............................•.... .....•....•.. ....... •.. ..... 4-28
4.5.3 Groundwater. ........................................... . ......... . ....... 4-29
4.6 SOS 6, FIXED DRAWDOWN ........ .......... .. ... . . . .... . ... . .... . .... . ..... 4-30
4.6.1 Shoreline Erosion and Mass Wasting .......•......•.... •....•....•.. .. •.. .. ... 4-30
4.6.2 Sedimentation ............................ . ..............•....•............ 4-31
4.6.3 Groundwater ........................ . ...................... . ......... . .... 4-31
4.7 SOS 9, SETTLEMENT DISCUSSION ALTERNATIVES..... ..... ... . ......... . ... 4-31
4.7. 1 Shoreline Erosion and Mass Wasting ........................... . .... . ......... 4-32
4.7.2 Sedimentation . ....................... . .•.... . .........•....•....•....•.... 4- 33
4.7.3 Groundwater...... .. . .... . .. . . . ............. . .... . .............. . .... . .... 4-34
viii FINAL EIS 1995

GeoluID' Appendix TABLE OF CONTENTS
TABLE OF CONTENTS - CONT
Chapter/Para
4.8 SOS PA: PREFERRED ALTERNATIVE .. , ......... . ............. . .. . .. . ....... .
4.8. 1
4.8.2
4.8.3
Shoreline Erosion and Mass Wasting .......... . .. . .. . ........................ .
Sedimentation
Groundwater
Page
4-35
4-35
4-35
4-35
5 COMPARISON OF ALTERNATIVES . . . .. . • ..• . . •. . •. . . . . •. . • .. • .•. .• ..•.... . . .. . .. 5-1
5.1 SUMMARY OF IMPACTS.. . ......... . . . . . .. . . ............................ . .... 5- 1
5.2 CUMULATIVE IMPACTS........ . ..... . .. . .. . .......................... . ..... . 5-4
5.2. 1 Temporal Cumulative Impacts. . . . . . . . .. . .. . . . . . . . . . . . . . . . . . . . . . . . . . . . . . . . .. . . 5-4
5.2.2 Synergistic Impacts ................................ . ... . . . . . .. . ...... .. ..... 5-4
5.3 MITIGATION OPTIONS . . . . . .. . . . . . . . . .. . . . . . . . . . . . . .. .. .. . .. . .. . .. . .. . . .. . .. . 5-6
5.4 IRREVERSIBLE AND IRRETRIEVABLE IMPACTS. . . . . . . . . . . . . . . . . . . . . . . . . . . . . . 5-8
6 LIST OF PREPARERS . ....... . .. ........... . . ........ . ...... .. ............... .... 6-1
7 GLOSSARy............ ........ .. . ....... .......... .. . ...... .. ................... 7-1
8 REFERENCES .... ... .. ....... .. ........... .. .... ..... . .. . .. .. . .. . .. ... ...... . .. . 8-1
'P.:l.ble
4-1
4-2
4-3
5-1
6- 1
6-2
2- 1
2-2
2-3
2-4
2- 5
1995
LIST OF TABLES
Title
System Operating Strategy Alternatives
Summary of Alternatives in the Draft and Final EIS .... . . . . . . . .. .. ..... . . . .. . .. .. . . . .. .
Groundwater Wells Near Lower Granite Reservo ir . ... . . • .. .. . .. . .... . .. . . . .. . . . • . ....
Summary of Impacts o f SOS Alternatives ............. . .. . .. . . .. .. . . . . . . .. . .. .. . . ... .
Bonneville Power Administration List of Preparers .... . . .. . .. . . . . .. . . . . . . . . . .. . . . . . . . .
Foster Wheeler Environmental List o f Preparers ............... . .. . . . ....... . ...... . . .
Physiographic Provinces ......... . .......................... . . . ........ . .... .. .. . . .
Stratigraphic Column for the Mid -Columbia River Region ................ . . . ........ .
Geologic Setting ofthe Mid -Columbia River Dams .................... . ....... . .... .
Generalized Geologic Map of the Area Along the Lower Columbia River . .............. .
Groundwater Pumpage from the Surface Overburden on the Columbia Plateau ....... . . .
FINALEIS
4-2
4 - 18
4-29
5-2
6- 1
6- 1
2-2
2-5
2-9
2- 11
2- 14
Ix

TABLE OF CONTENTS Geology ApJJe"dix
LIST OF FIGURES
Title
3- 1 Schematic Diagram Showing Wave Erosion During Orawdown 3-5
3-2 Photo of Lower Granite During Maximum Drawdown, March 1992 at about RM 131 ...... 3-10
5- 1 Tolal Sediment Eroded, by Alternative, for Fi rst Six Years - Lower Granite............. 5-5
x FINAL EIS /995

Geology Appendix 1
CHAPTER 1
INTRODUCTION: SCOPE AND PROCESS
This appendix addresses the study of geology, soils, and groundwater concerns relative to the System Operation Review (SOR). Chapter 1 provides an overview of the study, scope, and process for this resource area. In order. the respective sections of this chapter discuss the relevant issues for the study, and the means by which the SOR team carried out the study.
1.1 SUMMARY OF ISSUES RAISED IN SeOPING
Public comment specifically relating to geology, soils. and groundwater that was received during the SOR scaping process was limited. The SOR Interagency Team identified only two comments expressing concern over erosion caused by reservoir fluctuations. A few comments referred to groundwater aquifer depletion and noted concern over dropping water levels in wells, but these comments appeared to relate to depletion through pumping rather than potential effects of system operations on groundwater levels. Specific references to geologic considerations are not evident in the scoping comments.
While the volume of scoping input that directly and specifically addressed geology, soils, and groundwater was limited. comments that indirectly related to this subject area were more frequent. For example, a number of comments identified water quality as a general concern without specifically mentioning the amount of sediment in the water as an issue. Similarly, many comments raised protection of cultural resources as a significant concern. Because erosion is a primary process by which cultura1 resources are damaged, these comments indirectly identify the influence of system operations on erosion as an issue to be addressed by the SOK
Given the nature and the limited extent of public comment on geology, soils, and groundwater, the
1995
scope of investigation for this subject area was largely determined internally by the assigned SOR staff. The study team assigned to this resource reviewed and interpreted the public seeping comments that were directly or indirectly applicable. They also reviewed documents that address the effects of system operations on reservoir physical processes, including recent National Environmental Policy Act (NEPA) documentation on short-term river system operations and reports on the 1992 physical drawdown test of Lower Granite and unle Goose reservoirs on the lower Snake River. Based on these activities, the study team identified three specific issue areas that are summarized as follows:
Erosion
Reservoir operations cause or contribute to shoreline erosion through a variety of processes. The effect on the rate and extent of erosion could vary significantly among alternatives. A key requirement for the SOR is to investigate how operations relate to erosion, and the extent to which different operations would affect the rate and location of erosion. This information on erosion impacts will be key inputs to the analyses of water quality and cultural resources.
Sedimentation
Materia1 that is eroded is typically transported by air or water. TIansport and deposition of sediment in water is a significant SOR issue, as a result of potential effects on river and reservoir morphology and water quality, and thereby on uses influenced by
these characteristics.
Groundwater Levels
Surface water and groundwater bodies are often hydrologically connected; a change in the level of one could result in a corresponding change in the other. Therefore, the SOR analysis needs to include
F/NALEIS 1-1

1
investigation of connections between reservoirs and groundwater and identifjcation of operations effects on groundwater levels, including potential influence on wells.
1,2 STUDY PROCESS
Geology, soils, and groundwater comprise a subject area that was not assigned to I of the 10 resource work groups established by the SOR. These factors overlap with or influence a variety of resource areas, including water quality, cultural resources, air quali. ty, irrigation/municipal and industrial water supply, navigation, recreation, and possibly others. Given the degree of subject overlap, geology, soils, and groundwater became the responsibility of the SOR NEPA Group, one of the functional work groups intended to serve the entire SOR organization. The process followed by this group in conducting the study and developing the appendix is summarized below.
1.2.1 Work Group Coordination
As indicated previously, a separate SOR work group was not convened for geology, soils, and groundwa· ter. The SOR NEPA Action Group coordinated study efforts for this subject area. Foster Wheeler Environmental Corporation (formerly Enserch EnvironmentaJ), a private conswting firm, conducted the bulk of the staff work on the studies and the appendix under a contract with Bonneville Power Administration (BPA) (see Thchnical Exhibit 1 for a list of preparers for this appendix). Both entities coordinated with other SOR work groups to ensure appropriate distribution and exchange of informa· tion. Among the various SOR work groups with an interest in geology, soils, and groundwater, the linkage with the Water Quality Work Group was the strongest. Foster Wheeler Environmental developed and applied a shoreline erosion model to quantify sediment contributions to the river system from shoreline exposure, as under drawdown conditions. The results of this model analysis are reported in this appendix. and were also provided as direct inputs to the water quality modeling analysis.
1-2 F1NALEIS
Geology Appendix
1.2.2 Pilot Study and Screening
Geology, soils, and groundwater issues were not directly incorporated into either of the initial phases of study for the SOR. The pilot study was a demon· stration assessment involving a very few selected resource considerations. The screening analysis incorporated review of the screening alternatives by the 10 resource work groups, which were established on the basis of the SOR scoping input (see the previously issues Screening Analysis Report (or additional information on these study phases). As a result of the relative lack of scoping comment on geology, soils, and groundwater concerns, a separate work group for this subject area was not established. However, erosion and sedimentation concerns were indirectly reflected in the screening analyses con· ducted by other SOR work groups, particularly those for water quality and cultural resources.
1.2.3 Full-Scale Analysis
Study methods used for full-sca1e analysis are described in more detail in Chapter 3 of this appen· dix. Briefly, the study process involved the standard steps of characterizing the existing conditions; identifying the physical processes by which system operations could affect geology, soils, and groundwa· ter; and evaluating the consequences of the system operating strategy (SOS) alternatives, based on the reservoir operating patterns indicated in the hydro· regulation model results. The studies were set up to specifically address the three issues identified above in Section 1.1. Because of their direct physical linkage, erosion and sedimentation were investigated jointly in one study track, while groundwater repre· sented a second track.
Impact assessment for these subject areas was gener· ally conducted in a qualitative manner, as detailed; site-specific inventory and analysis would not be appropriate for a programmatic environmental impact statement (EIS) on such a complex system. As an exception to this general approach, a shore· line erosion model was a key part of the analysis for selected alternatives. This model yielded quantita. tive estimates of sediment contributions from ex· posed reservoir shorelines.
1995

Geology Appendix
When selecting the method of analysis, the availabil· ity of data and the types and degrees of impacts of the various alternatives had to be considered. Some of the alternatives were addressed using analysis from previous NEPA documents on river system operations.
The alternatives that would involve the most signifi· cant impacts are those with major drawdowns (SOSs 5, 6, 9a, and 9c, with their respective options). These alternatives could be studied using the data from the March 1992 drawdown test of Little Goose and Lower Granite reservoirs. In addition, much data already existed on the hydrology and sedi· mentology of Lower Granite.
The literature was reviewed for general information on shoreline erosion and sedimentation in reservoirs,
1995
1
as well as specific information on Columbia River system reservoirs. While some information exists on shoreline erosion processes in general, no predictive models have been developed. The most intensively studied erosional process among those determined to be most significant is wave erosion. However, most theoretical models of wave erosion consider beach erosion with a relatively constant base level. Many of these concepts are not readily applicable to rapidly fluctuating shorelines. The processes of slumping and incision induced by reservoir draw· down are not well known. Surface erosion due to rainfall has been studied intensively in relation to agricultural applications. As is discussed in Chapter 3, a mixture of theoretical and empirical studies was used to formulate a model for shoreline erosion to evaluate the most impacting alternatives.
FlNALE1S 1-3/(1-4 blank)

Geology Appendix 2
CHAPTER 2
GEOLOGY, SOILS AND GROUND WATER IN THE COLUMBIA RIVER BASIN TODAY
Rivers, and therefore reservoirs, are the geomorphic focal point of the drainage basins they occupy. 10 a great extent, their nature is determined not only by the physical characteristics of the basin, but by the recent geologic history as well. Understanding the nature of the valleys and the stream channels helps in understanding the impacts that reservoirs and their operation have on their immediate surroundings and downstream areas.
The beds and banks of alluvial rivers are composed of the same materials that the rivers transport. These rivers are "self-formed" and are able to adjust their shape in response to changes that occur within their drainage basin (Richards. 1985). In contrast, the beds and banks of bedrock-controlled rivers are constrained by rock, which resists or inhibits adjustments of river form to upstream (drainage basin) changes or downstream (base level) variations. The main stems and tributaries of the Columbia and Snake Rivers are constrained within mostly bedrock channels. The SOS alternatives being considered for the SOR involve only variations in reservoir pool levels to control water velocity within the Columbia River system; potential basinwide land use or management changes are not within the SOR scope. Given these conditions, and the fact that the reservoirs are within bedrock - floo red valleys, the SOS impacts must be restricted to the reservoir shorelines and to the unconsolidated materials within the drawdown zones and in minor alluvium-floored tributary valleys that intersect the reservoirs.
This chapter provides general background information on the various regions within the Columbia River Basin. It first looks at the physiographic regions within the basin, then at the general geology and groundwater conditions in those physiographic regions. Because system operations affect the mainstem valleys themselves, and not the distant
1995
sources of sediment and water, the main focus of this chapter is the mainstem valleys and the influences of physiography on the inputs to the rivers. The effects of geology and groundwater conditions on the mainstem valleys are discussed at the end of the chapter.
2.1 PHYSIOGRAPHY
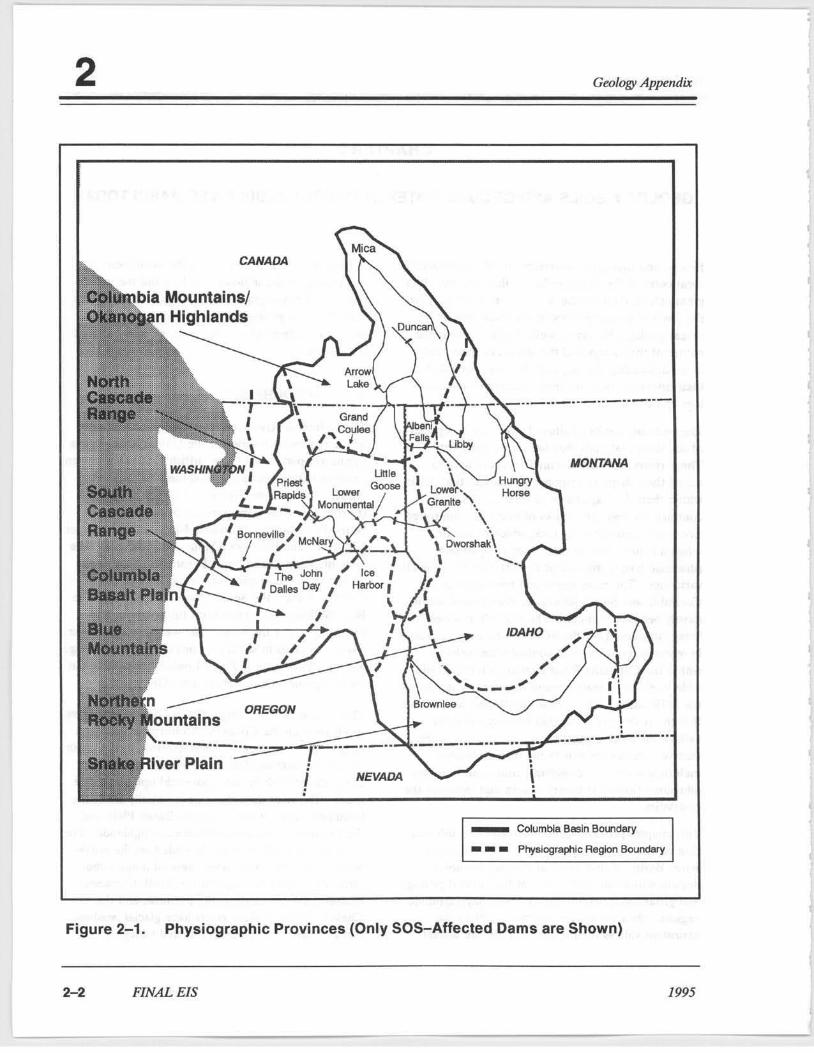
The Columbia River and its tnbutaries drain much of the northwest interior of the United States and a significant part of southern British Columbia. Seven physiographic regtons are prominent in the Columbia River Basin (see Figure 2-1). The upstream (northern and eastern) portions of the basin are generally within the Columbia Mountains/Okanogan Highlands and the Rocky Mountain provinces. The Columbia and Snake River Basalt Plains are in the center and eastern parts of the basin. The North Cascade Range, the South Cascade Range, and the Blue(WaUowa Mountains form the southern and western parts of the basin. The western edge of the basin also takes in small portions of the Coast Range and the Willamette - Puget Lowland provinces, but these regions do not include any SOR projects.
The Columbia River originates in Canada and flows south through the Columbia Mountains/Okanogan Highlands. This region is characterized in the north by high mountains, deep post-glacial valleys, and dense forest , with broad, semi-arid uplands to the south. The river then flows west, initially along the boundary between the Columbia Basalt Plain and the Columbia Mountains/Okanogan Highlands. The river subsequently becomes bounded on the northwest by the North Cascades. Several major tributaries drain the east slope of the North Cascades, including the Wenatchee, the Methow, and the Chelan. Many of these rivers have glacial headwaters and flow through deep forested valleys.
FINALEIS 2-1
,
2 Ge%gy Appendix
CANADA
MONTANA
OREGON
NEVADA
_ Columbia Basin Bo~darV
_ _ _ Phy&iographic: Region Boundary
Figure 2-1. Physiographic Provinces (Only 50S-Affected Dams are Shown)
2-2 FlNALEIS 1995

•
Geology Appendix
The Columbia then crosses the center of the Columbia Basalt Plain. joins with the Snake River. and flows through the Wallula Gap before turning west. The Columbia Basalt Plain is semi-arid to arid. and consists of flat to gentle rolling hills and a few higher ridges. The river flows through the South Cascades, the Willamette-Puget Lowland, and the Coast Range before heading out to the Pacific Ocean. The South Cascades are ge nerally lower in elevation than the North Cascades. Exceptions include the notable stratovolcanos lying along the crest of the range.
The Snake River originates in Yellowstone National Park, in the Rocky Mountains Province. The Rocky Mountains consist of high, linear mountain ranges separated by deep and often broad valleys. Extensive upland forests are present in this area. In eastern Idaho, the river flows into the Snake River Basalt Plain, a generally flat, arid area. It then (lows through Hell's Canyon, a 7,ooo-fool (2,134-m) deep gorge on the eastern edge of the Blue Mountains. The Blue Mountains are a broad, semi-arid to subhumid range. The Snake River then flows west through smaU canyons of the Snake River Basalt Plain to meet the Columbia.
Other key tributaries to the Columbia River are the Kootenai, Flathead. Qark Fork, Pend Oreille, and Clearwater rivers. The Kootenai also originates in British Columbia, flows south into northwestern Montana, then loops back into Canada where it joins the Columbia at Castlegar, B.C. The Flathead River lies entirely in the Rocky Mountains region of Montana. It flows south to meet the Clark Fork River, which flows into the Pend Oreille River and then the Columbia. The Clearwater River originates in the Rocky Mountains of central Idaho and empties into the Snake River at the Lewiston-Oarkston area on the Washington - Idaho border.
2.2 GEOLOGY
This section addresses the regional geology in the physiographic provinces and, in more detail, the shoreline geology of the reservoirs affected by SOR activities. Areas having specific geologic hazards (e.g., landslides along reservoir shorelines) or surficial deposils (loess) susceptible to impact by SOR
1995
2
activities are also described. Emphasis is placed on the existing and historical conditions of the geologic material. As the purpose of this section is to provide a description of the present environment, and the factors that have shaped the existing conditions, the influence that reservoir operations have had on geologic material has been included.
2.2.1 Geology of Physiographic Provinces
The geology (bedrock and surficial) within each physiographic province detennines the character of the sediments that reach the river.; and reselVoirs. This section provides the regional geologic framework necessary for understanding physical processes and their relation to reservoir operations. Organiza· tion is by physiographic province in a general upstream to downstream order.
Columbia Mountains/Okanogan Highlands
The Columbia MountainS/Okanogan Highlands have a complex sedimentary and tectonic history. Within this province are found the Purcell Mountains and the Selkirk Mountains. The Purcell Mountains consist of the Precambrian Purcell Group, a very thick sequence of slightly metamorphosed sandstones, shale, and limestone (see Thchnical Exhibit 2 for Geologic Time Scale). The Selldrk Mountains consist primarily of Mesozoic granites. The central and western parts of the Columbia Mountains are composed of the Shuswap Metamorphic Complex. East of here lies the Kootenai Arc, a band of Late Precambrian to early Jurassic sedimentary rocks intruded by numerous granite plutons, including the Kuskanax and Nelson Batholiths (McKee, 1972).
Rocky Mountains
The Rocky Mountains within the Columbia River Basin consist of metamorphic and igneous rocks. This area is relatively small compared to the overall Northern Rocky Mountains. The Idaho Batholith is included here as part of the Rockies. It is a huge granitoid intrusion of Mesozoic age. East of the batholith, parts of the Purcell Group (called the Belt Supergroup in the U.S.) extend into this section of the Rockies. Numerous thrust faults have placed older rocks on top of younger rocks. The ranges are
FINALEIS 2-3

2
separated by valleys often partially filled with younger, unconsolidated sediments.
Columbia And Snake River Plains
The Columbia and Snake River Basalt Plains consist primarily of thick successions of gently dipping basaltic lavas. In the Columbia Plateau area, numerous basaltic formations are distinguished within these lavas, and they are collectively known as the Columbia River Basalt Group (Galster and Sager, 1989). The sequence of basalts and interbedded sedimentary deposits is shown schematically in Figure 2-2. This group includes five distinct basalt
members. Interbedded with the basalt layers are thin layers of sediments deposited in former rivers and lakes between eruptions. In the Pliocene, about 4 million years ago, the terrain to the west began to uplift, the beginning of what is now the Cascade Range. These incipient mountains began to e rode, and some sediment eroded from this uplift forms the sandstones of the Ellensburg Formation. Similarly, nearly 1,200 feet (366 m) of sandstone, siltstone, and conglomerate are present in the Ringhold Formation, an early Pleistocene unit located in the low parts of the plateau, near Hanford.
The Snake River Plain has a volcanic history that extends to the present, while the Columbia Plain is mostly Tertiary. The two plains are thought to have been formed by a mantle-derived "hot spot", which is stationary. The North American Plate has moved west over the hot spot, and the locus of volcanism has migrated eastward. Its present position is now in the Yellowstone area. On the Snake River Plain, thick sequences of basalt a re found frequently interbedded with river gravels and other sediments. The young volcanic surface of the plain has not had time to develop strong drainage patterns, and many of the streams flowing into the plain from the Rocky Mountains to the north seep underground through the porous surface material into the Snake River Aquifer. The Snake River Canyon cuts this aquifer,
2-4 FINALEIS
Geology Appendix
and consequently thousands of high-volume springs flow into the river in the area between Milner Dam and Hell's Canyon.
The surficial geology of the basin has been heavily influenced by continental glaciation. During the Quaternary period, repeated advances of the Purcell Trench lobe of the Cordilleran ice sheet dammed the Clark Fork River and impounded glacial Lake Missoula. This lake released catastrophic floods numerous times during the Late Pleistocene, scouring much of the surface of the Columbia Basalt Plain. The floods a lso topped glacial Lake Columbia at the site of the present Lake Roosevelt behind Grand Cou lee Dam (Hansen, 1989; Atwater, 1986). Over 700 feet (213 m) of glacial lake sediment are exposed along the banks of Lake Roosevelt.
These floods eroded the river valleys and coulees, or dry canyons, and produced large deposits of river sediments (Baker, et aI., 1987). These river deposits occur as scattered terraces along the river valleys. The flood erosion also carved steep slopes that have undergone some retreat, producing steep, coarsegrained talus slopes along bedrock cliffs. Post-glacial river incision has reworked some of the older river deposits, producing the younger, lower elevation, alluvial terraces that are scattered along the rivers. Since impoundment of the rivers by dams, tributaries have deposited alluvial fan deltas where they enter the reservoirs. In steep, small drainages, these alluvial fan deltas consist of gravels and sand with minor amounts of silt and clay. Some of the larger deltas consist mostly of sand and silt.
Landslides are relatively common along the Columbia River. They generally occur within the surficial sediments, especially those that are somewhat poorly drained due to an admixture of finer grained sediment. Some landslides involve the Columbia River Basalt Group and its interbedded river and lake deposits (Sager, 1989a, 1989b, 1989c). Some of the larger landslides are currently immobile, while others are moving at slow rales (Sager. 1989a).
1995
I

Geology Appendix 2
~ ....... ,. P ......
, I I I) II I~
EllENSBURG Ii '" I I
--
_N
N
Seilh IB
rnon thin 30 IIows
.... ,-
.. oou YOUNTAINS .... "-,
WANAPOM .ASAlT
'
I GRANDE
ROO" BASAlT N1
Figure 2-2. Stratigraphic Column for the Mid-Columbia River Region.
1995
(Galster and Coombs, (1989), modified (rom Mackin (1961), Reidel and Fecht (1981), and Swanson et a!. (1979).1 M, member; FM, formation; IB. interbed; N, normal magnetic polarity; R, reversed magnetic polarity.
FlNALE1S 2-5

2
Loess (windblown glacial silt) covers an extensive area of the plateau. known as the Palouse. Here gently rolling hills of the silt (orm a productive agricultural area, and some of the most easily erod· ib le soils of the Columbia Basin. Rivers draining the Palouse carry large amounts of suspended sediments.
Blue Mountains
The Blue Mountains have a core of volcanic and sedimentary rocks that are covered by the Columbia River Basalt Group to the north. Much of the province is fonned of schists, slates, and greenstones. Also within these metamorphic rocks are major intrusions of gabbros, peridotites, and granodiorite. Younger sequences of volcanics, including ashes, tuffs, flow breccias, and lavas, also appear in the southern and western areas of the province.
North Cascades
The North Cascade Range is differentiated from its southern counterpart mainly by the lack of Cenozoic volcanics and the presence of a complex of Mesozoic orogenic belts. The mountain tops are generally higher than those in the south, and the geology is dominated by metamorphic complexes with various granitoid plutons. Also present are numerous sequences of sandstones. siltstones, and shales with interbedded volcanics. The valleys of the North Cascades are deeply eroded as a result of the glaciers that formerly occupied them.
South Cascades
The South Cascade Range, extending from Snoqualmie Pass in Washington to Lassen Peak in Northern California, consists of older volcanic and granitic rocks with a series of superimposed Quaternary volcanoes. The area of this region drained by Columbia River tributaries includes most of central and northern Oregon and all of south-central Washington. The geologic history of this province is complex, with numerous episodes of volcanism with various composition and styles. TOday the landscape is dominated by relatively recent volcanic landforms. Soils are generally thin and highly erodible.
F1NALEIS
Geology Appelldix
During Pleistocene glaciation, sea level was several hundred feet lower than it is today. The lower Columbia River (west of The Dalles) incised a deep canyon in response to this base level lowering, creating over-steeped slopes in the lower valley. Some of these slopes have failed, producing large landslides (Palmer, 1977). Rising of sea level at the end of the glaciation (about 12,000 years ago) drowned the lower Columbia River valley. This reduced river velocity and sediment transport as the river slowed, causing sediment deposition and creating numerous islands in the lower channel.
2.2.2 Geology of Project Areas
The bedrock and surficial geology at dams and reservoirs comprise resources that could be directly affected by SOS alternatives. Geologic materials on existing reservoir shorelines have been affected by historical reservoir operations, and patterns of effects could change with future operations. This section also describes the historic response of these materials to reservoir processes, in order to provide perspective on the existing conditions and a framework for understanding changes that could occur.
Kootenai, Flathead, and Pend Oreille Rivers
The Kootenai and Flathead Rivers originate in the Rocky Mountain province of the Columbia River Basin as described above (Section 2.1). The Pend Oreille catchment includes the FJathead River and empties into the Columbia River in Canada near nail, British Columbia.
Libby and Hungry Horse Dams are both located in northwestern Montana. The terrain in both project areas is characterized by high but weathered ranges separated by narrow valleys. Hungry Horse Reservoir is located in bedrock and glacial and alluvial deposits, although the dam itself is located in Paleozoic limestone (Erdmann, 1944). Several landslides occur along the reservoir shoreline, apparently related to reservoir operations near fu ll pool. Most of the colluvium formerly covering the hillslopes that now form the reservoir shoreline has been stripped away by erosion, exposing bedrock..
Libby Dam is located in Precambrian greenschist of the Belt supergroup. Wedge rock slides are present
1995

Geology Appendix
on the left abutment of the dam. Undercutting of the rocks during construction of the dam triggered one slide (Voight, 1979). Four potential rockslides are present on the left bank near the dam (Voight, 1979). The slides extend to the current drawdown zone, however, historic movement of a similar slide appears to have been triggered by an extreme precipitation event and not by water level fluctuation.
The northern end of Lake Koocanusa lies in lake sediments and consolidated glacial outwash and till. The town of Rexford lies in the Tobacco River valley. The Tobacco River itself cuts through these sediments before flowing into Lake Koocanusa. Extensive erosion has occurred in this area, and shoreline retreat has been noted as a problem.
Alben; Falls Dam is located on the Pend Oreille River in northern Idaho, in the Columbia Mountains/Okanogan Highlands province. The dam raised the level of the natural Lake Pend Oreille by 10 feet (3 meters). The Purcell Trench lobe of the Cordilleran ice sheet extended across this region in the late Pleistocene, exposing the area to the full force of the Lake Missoula flood when the lobe receded (Baker et aI., 1987). Surficial Oood deposits compose areas of the dam site and reservoir shoreline, Gatto and Doe (1983) documented that Lake Pend Oreille shorelines have experienced sliding since before Albeni Falls Dam construction and raising of lake level.
Upper and Middle Columbia River
For presentation purposes, the Columbia River is divided into upper, middle, and lower reaches. The upper Columbia River extends from the headwaters area in Canada to Grand Coulee Dam. The middle reach extends from below Grand Coulee to the head of the McNary Pool, near the confluence with the Snake River.
The Columbia River originates in the Purcell Mountains of British Columbia and flows northwest through Paleozoic sedimentary strata (McKee , 1972). The river loops to the south in the vicinity of Mica Dam, where it flows through mostly Pre-Jurassic metamorphic rocks and Late Mesozoic granit-
1995
2
ic intrusive rocks. Keenleyside Dam, which forms Arrow Lakes, is located in this section of river just above its confluence with the Kootenai River in Canada. As the Columbia flows into the United States, it passes through predominantly Paleozoic sedimentary rocks and granitic intrusives before it enters the basalts of the Columbia River Basalt Group along the shores of Lake Roosevelt behind Grand Coulee Dam.
Seven hydroelectric projects have been built on the upper and middle Columbia River in the United States, although only two of these (Grand Coulee and Ch ief Joseph) are directly affected by SOR activities. Grand Coulee Dam was built in the granitic rock of the Colville Batholith. During the Pleistocene, the Okanogan lobe of the Cordilleran ice sheet extended across the ancestral Columbia River and created glacial Lake Columbia. The lake persisted long enough to accumulate thick deposits of silts and clays as well as sands. Approximately 90 percent of the Lake Roosevelt shoreline lies within these deposits (Grand Coulee Project Office, 1992). The lake deposits have been prone to mass wasting since before construction of the dam (Hansen, 1989). Various methods have been used to stop mass wasting, including laying back slopes, dewatering the banks, and vegetating slopes. Tho hundred and forty-five landslides occurred along the 635 miles (1,022 kilometers (Ian]) of shoreline during initial filling of the reservoir. After full pool was attained, 255 additional slides occurred between 1943 and 1953. Jones et al. (1%1) provide detailed descriptions of selected areas of slide activity.
Stream terraces and alluvial fans are also present along the Lake Roosevelt shoreline. Groundwater conditions can make wet silts and clays weak and more susceptible to slides and slumps. SoH creep also occurs in these areas. In many sections, the reservoir shoreline is nearly vertical and wave action plays a significant role in instability (see Section 3.1). In some reaches, the banks are 500 feet (152 m) high in the lacustrine material, creating an environment conducive to prolonged perioos of episodic mass wasting. Banks composed mostly of sand are highly susceptible to wave erosion, while
FINALEIS 2-7

2
those banks where sand underlies si lts and clays are subject to undercutting and collapse.
Landslides occur downstream of Grand Coulee Dam, with peaking operations further aggravating the situatio n (Hansen, 1989). Daily fl uctuations in Grand Coulee tailwater elevations have been in excess of 20 feet (6.1 m). Auctuating pore water pressures, combined with the rapid changes in water volume and velocity, may be increasing the potential for deep-seated slope failure. In 1978. landslides occurred along a 6-mile (9.7-km) stretch of river immediately downstream from the dam. The largest slide was triggered by a 13-fool (4-m) drop in tailrace elevation due to failure of a turbine unit. A number of techniques were employed to ensure stability of the downstream banks in anticipation of continued peaking operations. These included extensive removal of bank material to lay back the slope, dewatering of critical areas, and installation of an extensive monitoring network consisting of uniaxial inclinometers and pore pressure transducers. Ove r 600 monitoring stations are now active and linked into a warning system at the powerplant dispatcher's station.
The middle seclion of the Columbia River forms the boundary between the northern Cascade Province to the west and the Columbia Plateau to the east. The rive r flows over mostly Paleozoic metamorphic and intrusive rocks until around Rock Island Dam. Below Rock Island Dam the river passes into the Columbia River Basalt Group. The hydroelectric projects of the middle Columbia fonn a nearly continuous section of reservoirs. The geology of the Middle Columbia is shown in Figure 2-3.
Priest Rapids Dam was built on the Priest Rapids Member of the Wanapum Basalt. 1\vo terraces are exposed on the left bank of the reservoir, a flood terrace composed of grave ls and the high Wahluke terrace, a deposit of Missoula flood gravels (Galster, 1989). The river deposits extend upstream on the right bank for about 15 miles (24.1 Ian).
Below Priest Rapids Dam is a nearly 50-mile (80.S-km) stretch of free flowing river cut in the Columbia River Basalt Group.
2-3 FINALEIS
Geology Appendix
Clearwater River
The Clearwater River flows west ou t of the northern Rocky Mountains in central Idaho. Dworshak Reservoir on the North Fork of the Clearwater is flanked by several unstable areas (Corps, 1975). These areas consist of semi-consolidated shales and deep clay deposits. Some of these areas are active and continue to move, albeit at slow rates (personal communication, R. Colgan, U.S. Army Corps of Engineers, Operations Manager, Dworshak Dam, Orofino, Idaho, August 17, 1992). One area currently active is located at RM 32 near Falls Creek. The slide areas are up to 2 acres (0.81 hectare) in size. In addition , much of the lake shore is in granitic soils, which are highly erodible, especially at steep angles on long slopes. Shoreline sloughing was a common occurrence during the flTst few years of dam operation and was expected to stabilize with time, assuming no great change in water level fl uctuations (Corps, 1975). The frequency of landslides has generally decreased since then, but problem areas remain.
Snake River
The middle and lower reaches of the Snake River are within the scope of the SOR analysis. The middle Snake River flows along the western edge of Idaho through Hells Canyon to the confluence with the Clearwater River, and includes Brownlee Reservoir. The lower Snake River extends from confluence with the Clearwater River downstream to the confluence with the Columbia. Four dams and reservoirs affected by SOS alternatives are located in this reach.
Brownlee Reservoir has significant potential for slope failure under existing operating patterns. The main impact is due to rapid drawdown decreasing the stability of existing landslide areas due to removal of the buoyant force of the water (BPA, 1985). Numerous slides are present along the perimeter of the reservoir. One large slide exists at the mouth of the Powder River and is capable of damming that drainage.
Lower Granite Dam is founded on the lower nows of the Grande Ronde Basalt and partially on Mis· soula flood gravels and recent alluvium. Most of the
1995

Geology Appendix
,-~~ ........ ...,~.,.. .... "' .... - N.W . .... "'~"'_IIad(CABI
~.bo~_.~ ... tdoowuIylOCb
~'*- .... (_tcI>ou."'Mtd ......... _ )
~Dono~ ... _ ...
~ IrIWII Ht.oatovll l ' (1MI).,.,:T_1I11 (I""
-'-
o III k
~
Figure 2-3. Geologic Setting of the Mid-Columbia River Dams. (Galster and Coombs,1989)
1995 FlNALE1S
2
2- 9

2
reservoir shoreline materials consist of either basalt or riprap levees. Scattered deposits of Missoula flood gravels occur at Siloott Island and other reaches.
Little Goose Dam is founded in the upper nows of the Grande Ronde Basalt. Here the flows are 30 to 100 feet (9.1 to 30.5 m) thick. The beds dip I degree and are relatively undeformed. Interbeds include scoriaceous basalt with an ash/cinder layer. The interbeds are the primary source of groundwater leakage around the dam (Miklancic, 1989). A ood gravels are present upstream and downstream of the dam and along the reservoir shoreline. The basalts form most of the reservoir 's banks, however.
Lower MonumentaJ Dam is founded in the upper flows of the Grande Ronde Basalt and the embankments rest on the Thuchet beds (thick flood gravels). These beds are part of the alluvial fan developed at the ou Uet of the Missoula Floods from Devil's Canyon, a deep gorge just upstream of the dam. Much of the reservoir shoreline lies in the basalt, but there are scattered patches of Touchet beds along the reservoir's length.
Ice Harbor Dam is founded in The Elephant Mountain and Pomona Member.> of the Saddle Mountain Basalt. Late Pleistocene flood gravels are also present in scattered locations along the shoreline. A major landslide occurred in a berm near the left abutment of the dam. The berm was created to protect the bank, which is formed primarily of eolian sand, from wave erosion. An estimated 500,000 (382,300 m) cubic yards of material was displaced in the slide of March 1962, two months after reservoir filling began. In July of 1962, the slide extended back to the bedrock bluff (Miklancic; 1989). In June of 1962, another slide about 1 mile (1.6 km) upstream from the dam occurred. Sliding was initiated by storm-induced wave action. The slide material moved 1,200 (365.8 m) feet into the reservoir. This slide, too, reached the basalt cliffs and is thought to have stabilized.
Lower Columbia River
The lower Columbia reach extends from Priest Rapids Dam through the Columbia Basalt Plain and the Southern Cascade Range before emptying into
2-10 FlNALEIS
Geology Apptndix
the Pacific Ocean. This reach conta ins four run of-river projects th at effectively leave no free flowing river between the Columbia-Snake confluence and Bonneville Dam, the lowermost project on the river. The geology of the lower Columbia reach is shown in Figure 2-4.
McNary Dam is founded on the Umatilla Member of the Saddle Mountains Basalt. Missoula flood gravels and loess are present at the dam and along much of the reservoir shoreline (Miklancic; 1989). At the dam, 25 feet (7.6 m) of this basalt covers the Mabton interbed, a 40 to 60 (12.2 to 18.3 m) foot layer of tuffaceous sil tstones and claystones with some coarser materials. Downstream of the dam erosion has exposed the Mabton interbed creating rapids that have migrated upstream toward the dam.
John Day Dam is built in the G rand Ronde Basalt member of the Columbia River Basalt Group (Sager, 1989c). Individual flow deposits within this sequence contain a basal zone of altered glassy basalt which is brown, soft, weak, highly fractured, and slightly cemented, making this zone susceptible to mass wasting. There are significant, deep-seated landslides in the vicinity of the dam and Lake Umatilla. In the eastern part of the lake on the Washington shore, the Priest Rapids member of the Columbia River Basalt Group contains a 25-foot (7.6-m) thick si ltstone that is the main detachment plane for rotational and translationa l failures. Other units that serve as loci for slumps include a saprolite and tephra laye r, a tuff layer, and an extensive, weakly consolidated volcaniclastic layer. Most mass wasting has occurred on the Washington shore. A landslide on the Washington shore was reactivated during dam construction, but appears stable now. Most of the shoreline is not being significantly eroded and rip rap protection seems to be adequate for lower pool operation (Gustafson, 1992). A broad, slow-moving slide is present on the Washington shore where ground cracks are 100 to 150 feet (30.5 to 45.7 m) long. This slide, located west of Alderdale, is believed to be translational rather than rotational.
At The Dalles Dam, the shoreline appears to be mostly in bedrock, which consists of the Columbia River Basalt Group, and does not appear to be affected by major landslides. However, on the
1995

-.-~---
-+- ---l--..---N ...
tI • • ... ,--_o,-~o,---,o
Unwlla. a.,1n
Figure 2-4. Generalized Geologic Map of the Area Along the Lower Columbia River. [Galster and Sager. (1989). after Hunt1ing et al. ; Peck (1961) ; Newcomb (1970) ; and Walsh et al. (1987) .1
2
Oregon shore of Lake Celilo, Quaternary fan and river deposits are highly erodible and susceptible to mass wasting, having the potential for small-scale slumps and debris flows (Sager, 1989b; Corps, 1983).
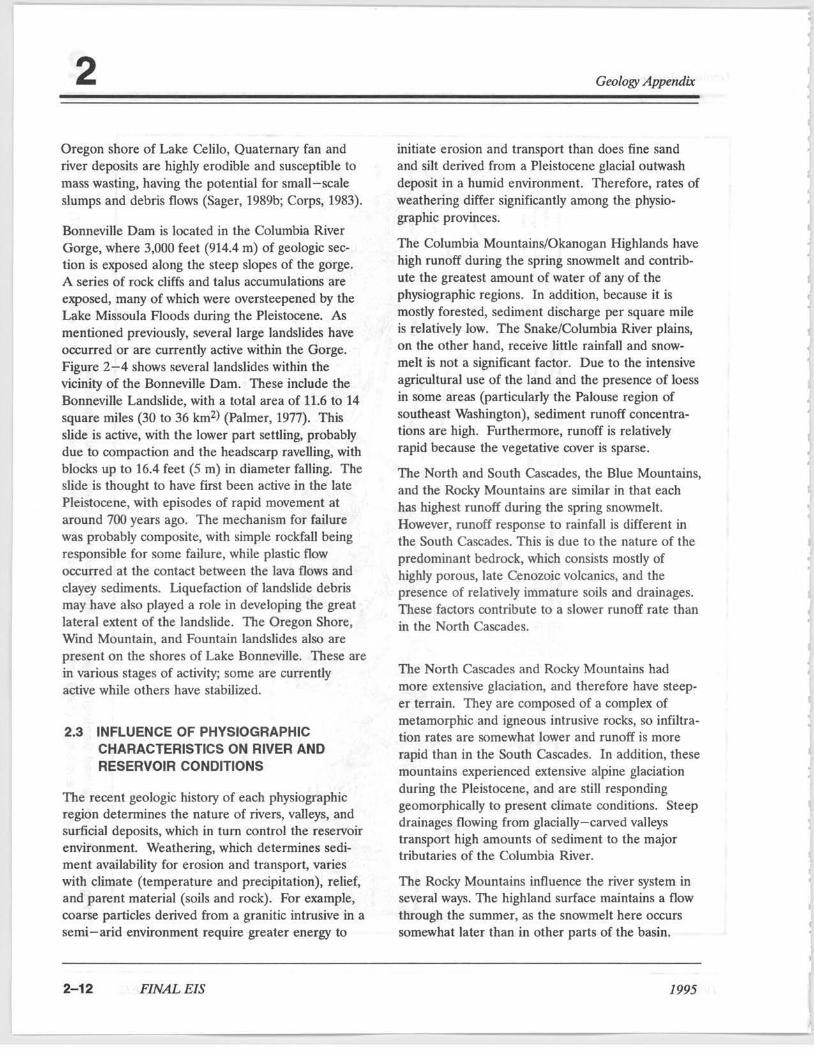
Bonneville Dam is located in the Columbia River Gorge. where 3,000 feet (914.4 m) of geologic section is exposed along the steep slopes of the gorge. A series of rock cliffs and talus accumulations are exposed, many of which were oversteepened by the Lake Missoula Floods during the Pleistocene. As mentioned previously, several large landslides have occurred or are currently active within the Gorge. Figure 2-4 shows several landslides within the vicinity of the Bonneville Dam. These include the Bonneville Landslide, with a total area of 11.6 to 14 square miles (30 to 36 km2) (Palmer, 1977). This sHde is active, with the lower part settling, probably due to compaction and the headscarp ravelling, with blocks up to 16.4 feet (5 m) in diameter falling. The slide is thought to have first been active in the late Pleistocene, with episodes of rapid movement at around 700 years ago. The mechanism for failure was probably composite, with simple rockfall being responsible for some failure, while plastic flow occurred at the contact between the lava flows and clayey sediments. Liquefaction of landslide debris may have also played a role in developing the great lateral extent of the landslide. The Oregon Shore, Wind Mountain, and Fountain landslides also are present on the shores of Lake Bonneville. These are in various stages of activity; some are currently active while others have stabilized.
2.3 INFLUENCE OF PHYSIOGRAPHIC CHARACTERISTICS ON RIVER AND RESERVOIR CONDITIONS
The recent geologic history of each physiographic region determines the nature of rivers, valleys, and surficial deposits, which in turn control the reservoir environment. Weathering, which detennines sediment availability for erosion and transport, varies with climate (temperature and precipitation), relief, and parent material (soils and rock). For example, coarse particles derived from a granitic intrusive in a semi-arid environment require greater energy to
2-12 FlNALEIS
Geology Appendix
initiate erosion and transport than does fine sand and silt derived from a Pleistocene glacial outwash deposit in a humid environment. Therefore, rates of weathering differ significantly among the physiographic provinces.
The Columbia Mountains/Okanogan Highlands have high runoff during the spring snowmelt and contribute the greatest amount of water of any of the physiographic regions. In addition, because it is mostly forested, sediment discharge per square mile is relatively low. The Snake/Columbia River plains, on the other hand, receive little rainfall and snowmelt is not a significant factor. Due to the intensive agricultural use of the land and the presence of loess in some areas (particularly the Palouse region of southeast Washington), sediment runoff concentrations are high. Furthermore, runoff is relatively rapid because the vegetative cover is sparse.
The North and South Cascades, the Blue Mountains, and the Rocky Mountains are similar in that each has highest runoff during the spring snowmelt. However, runoff response to rainfall is different in the South Cascades. This is due to the nature of the predominant bedrock, which consists mostly of high1y porous, late Cenozoic volcanics, and the presence of relatively immature soils and drainages. These factors contribute to a slower runoff rate than in the North Cascades.
The North Cascades and Rocky Mountains had more extensive glaciation, and therefore have steeper terrain. They are composed of a complex of metamorphic and igneous intrusive rocks, so infiltration rates are somewhat lower and runoff is more rapid than in the South Cascades. In addition, these mountains experienced extensive alpine glaciation during the Pleistocene, and are still responding geomorphically to present climate conditions. Steep drainages flowing from glacially-carved valleys transport high amounts of sediment to the major tributaries of the Columbia River.
The Rocky Mountains influence the river system in several ways. The highland surface maintains a flow through the summer, as the snowmelt here occurs somewhat later than in other parts of the basin.
1995
1

GroJogy Appendix
Reservoirs within the valleys of the Rocky Mountains are subject to freeze-thaw processes acting on the shorelines, due to their relatively high elevations. Freeze-thaw action in shoreline materials is known to increase rates of shoreline erosion (Lawson, 1985).
The Blue Mountains have well developed drainages and are forested, ancient mountains. Their contributio n to sediment discharge in the Columbia! Snake system is relatively limited, due in part to a smaller contributing area, forested terrain, and less relief than the other mountainous provinces.
2.4 GROUNDWATER
Compared to other parts of the country, groundwater is a relatively minor water supply source in the Columbia River Basin. This is because most water supply needs are met by diversions from the mainstem or tributary rivers. Nevertheless, hydrologic connections exist between system reservoirs and groundwater aquifers in areas surrounding the reservoirs. Groundwater conditions in these areas could potentially be affected by system operations.
This report examines areas where the aquifers are known, or inferred, to be directly connected to reservoir levels and that are currently used as water sources. These are, for the most part, unconfined aquifers. They are generally near the land surface and their upper boundary, the water table, fluctuates freely. In many cases, the effect of reservoir nuctuations does not extend very far from the shoreline. How the water table responds to changes in river hydrology depends on the abili ty of the aquifer to transmit water, or its hydraulic conductivity. In addition, groundwater flow direction, or gradient, is affected depending on whether the river or reservoir is influent or effluent. An erfluent river is one into which surrounding unconfined aquifers drain. An influent river drains into the surrounding aquifer, creating gradients that flow away from the riverbed.
Most of the reservoirs in the Columbia River Basin lie in or adjacent to the Columbia Basalt and Snake River Plains. Hydrogeology of the region is charac-
1995
2
terized by a wide range of hydraulic conductivity in the basalt aquifers. Inter(low zones have high horizontal conductivities. while the basalt flows themselves have higher vertical conductivity than horizontal conductivity. This is mostly due to vertical jointing related to basalt columns, which creates vertical migration pathways. Hydraulic gradients generally parallel the dips of the individual basalt nows, which regionally dip toward the center of a structural low near Pasco, Washington. Natural groundwater recharge in the area is typically less than 2 inches (50 millimeters imm]/year, although locally high artificial recharge due to agricultural activit ies is as much as 14.6 inches (370 mmlyear) (Lindholm and Vaccaro, 1988; Thnaka, et. a!., 1974). The Columbia and Snake Rivers are effluent streams; that is, groundwater discharges into them. The reservoirs have effectively raised the water table locally.
The Columbia Plateau occupies the large central portion of the Columbia River Basin and contains or borders six of the key dams affected by the SOR. In a recent review of groundwater pumpage in the Columbia Plateau, Cline and Collins (1992) delineate areas of groundwater usage through 1984. This study reports that groundwater accounts for only 30 percent of all acres irrigated on the Columbia Plateau, and 80 percent of all groundwater withdrawn is used for irrigation. Most of this pumpage (75 percent) comes from basalts of the Columbia River Basalt Group, with the remaining production derived from overburden (recent surficial nuvial and glaciofluvial deposits).
As surface water supplies most of the region's water needs (70 percent), the geographk:al distribution of groundwater use tends to be isolated from major surface water bodies such as rivers and reservoirs (Figure 2-5). This reduces the likelihood of significant groundwater use in areas where there is a hyd raulic connection between the system's reservoirs and groundwater aquifers. Three key exceptions to this observation are areas near Pasco, Washington, Lewiston-aarkston on the Washington-Idaho border, and south of Lake Umatilla in Oregon. Pasco is near the confluence of the Snake and
F1NALEIS 2-13

2 Geology Apptndix
t . I~ '!' l!' _ ..
o L~~~~..-w
Figure 2-5. Groundwater Pumpage from the Surface Overburden on the Columbia Plateau. (from Cline and Collins, 1992)
2-14 F1NALEIS 1995
•
1

Geology Appendix
Columbia Rivers, where groundwater withdrawal from nearsurface overburden accounts for 82 percent of groundwater pumpage. Groundwater pumpage from the Grande Ronde member of the Columbia River Basalt Group in the Lewiston-Clarkston area, where the Snake and Clearwater Rivers meet, supplies a significant source of domestic water in that area.
A third area of significant groundwater withdrawal from the surficial aquifer occurs south of Lake Umatilla behind John Day Dam. Aquifers in this area are located in unconsolidated Quaternary deposits and Tertiary basalts. The Pasco Gravels, a unit of Pleistocene, flood-deposited gravels, are utilized for domestic water by the city of Boardman, Oregon, and by some private wells. The water table associated with this aquifer is directly connected to the water level in Lake Umatilla (CH2M Hill, 1992). The wells in this area are thus partly dependent on the operation of John Day dam. The basalt aquifer may also be connected to the pool level, as indicated by a rise in water level associated with the filling of the John Day pool (Robison, 1971). However, the river's influence probably ends a very short distance away from the shoreline (CH2M Hill, 1992).
In the Snake River Plain, the area potentially affected by SOS alternatives is in the immediate vicinity of Brownlee Reservoir. While no comprehensive groundwater well database exists for Idaho, the U.S. Geological Survey staff report that there are only a few wells in the vicinity of Brownlee. These are mostly located near the southern end of
1995
2
the reservoir (personal communication, Steve Craig, U.S. Geological Survey, Boise Idaho, August 11, 1993). There are also few wells near Dworshak Reservoir.
The reservoirs behind Libby, Albeni Falls, Dworshak, and Hungry Horse dams lie in the intermontane basins of the northern Rocky Mountains. Hydrogeology of these areas is dominated by generally unconfined permeable alluvial aquifers in the valleys. In permeable, unconsolidated hydrogeologic settings, the water table tends to fluctuate directly with the reservoir level (Simms and Rorabaugh, 1971). Reservoirs here also have had the effect of locally raising the water table. These reservoirs are storage projects, and as such tend to fluctuate much more than reservoirs on the mainstem Columbia and Snake Rivers. Therefore, their influence on groundwater is probably more complex. Changes in storage reservoir elevations probably cause seasonal water table fluctuations that vary in magnitUde with the composition of aquifer materials.
Groundwater use near these intermontane reservoirs is patchy and sporadic. Due to the location of reservoirs in mountainous terrain, demand for groundwater in the immediate vicinity of these reservoirs is low. Hence there are few wells near the reservoirs. The U.S. Geological Survey in Montana reports no groundwater wells in the Hungry Horse Reservoir area. There is some groundwater use near Libby Reservoir (Lake Kookanusa), though it is not extensive.
FINALEIS 2-151(2-16 blank)
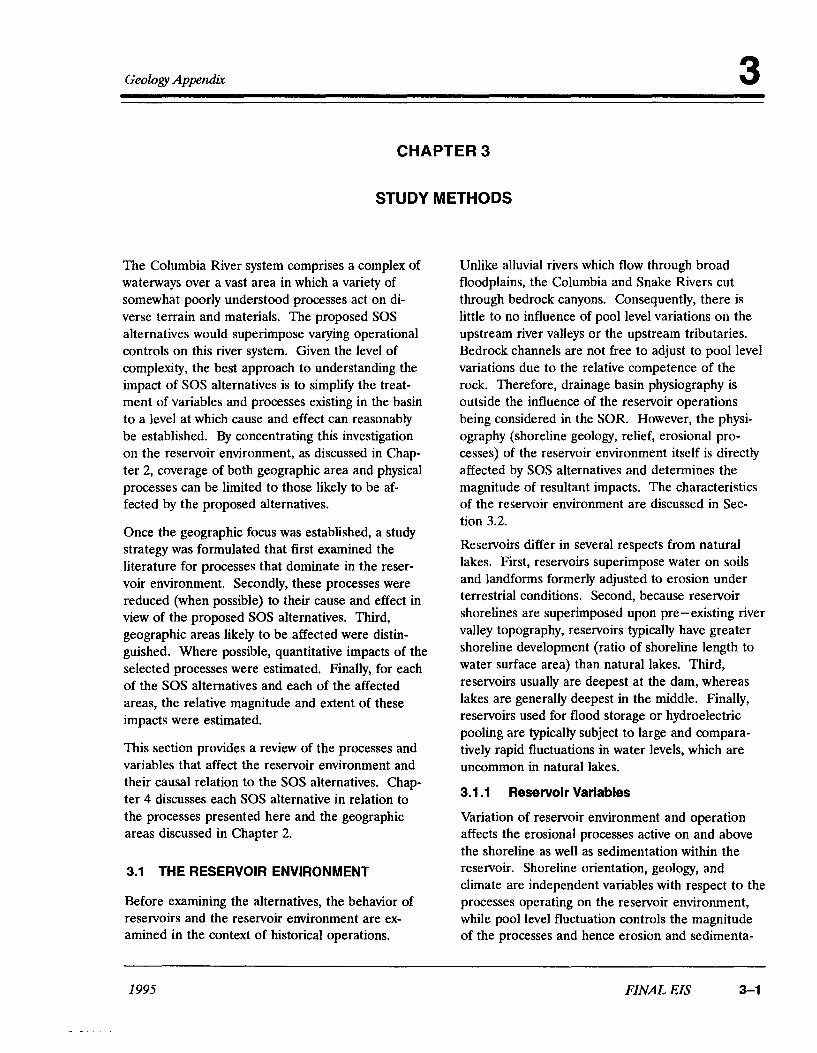
Geology Appendix 3
CHAPTER 3
STUDY METHODS
The Columbia River system comprises a complex of waterways over a vast area in which a variety of somewhat poorly understood processes act on diverse terrain and materials. The proposed SOS alternatives would superimpose varying operational controls on this river system. Given the level of complexity, the best approach to understanding the impact of SOS alternatives is to simplify the treatment of variables and processes existing in the basin to a level at which cause and effect can reasonably be established. By concentrating this investigation on the reservoir environment, as discussed in Chapter 2, coverage of both geographic area and physical processes can be limited to those likely to be affected by the proposed alternatives.
Once the geographic focus was established, a study strategy was formulated that first examined the literature for processes that dominate in the reservoir environment. Secondly, these processes were reduced (when possible) to their cause and effect in view of the proposed SOS alternatives. Third, geographic areas likely to be affected were distinguished. Where possible, quantitative impacts of the selected processes were estimated. Finally, for each of the SOS alternatives and each of the affected areas, the relative magnitude and extent of these impacts were estimated.
This section provides a review of the processes and variables that affect the reservoir environment and their causal relation to the SOS alternatives. Chapter 4 discusses each SOS alternative in relation to the processes presented here and the geographic areas discussed in Chapter 2.
3.1 THE RESERVOIR ENVIRONMENT
Before examining the alternatives, the behavior of reservoirs and the reservoir environment are examined in the context of historical operations.
1995
Unlike alluvial rivers which flow through broad floodplains, the Columbia and Snake Rivers cut through bedrock canyons. Consequently, there is little to no influence of pool level variations on the upstream river valleys or the upstream tributaries. Bedrock channels are not free to adjust to pool level variations due to the relative competence of the rock. Therefore, drainage basin physiography is outside the influence of the reservoir operations being considered in the SOR. However, the physiography (shoreline geology, relief, erosional processes) of the reservoir environment itself is directly affected by SOS alternatives and determines the magnitude of resultant impacts. The characteristics of the reservoir environment are discussed in Section 3.2.
Reservoirs differ in several respects from natural lakes. First, reservoirs superimpose water on soils and landforms formerly adjusted to erosion under terrestrial conditions. Second, because reservoir shorelines are superimposed upon pre-existing river valley topography, reservoirs typically have greater shoreline development (ratio of shoreline length to water surface area) than natural lakes. Third, reservoirs usually are deepest at the dam, whereas lakes are generally deepest in the middle. Finally, reservoirs used for flood storage or hydroelectric pooling are typically subject to large and comparatively rapid fluctuations in water levels, which are uncommon in natural lakes.
3.1.1 Reservoir Variables
Variation of reservoir environment and operation affects the erosional processes active on and above the shoreline as well as sedimentation within the reservoir. Shoreline orientation, geology, and climate are independent variables with respect to the processes operating on the reservoir environment, while pool level fluctuation controls the magnitude of the processes and hence erosion and sedimenta-
FINALEIS 3-1

3
tion for the reservoir. Differences in shoreline orientation, geology, and local climate (weather) will vary between reservoirs and affect the magnitude of erosion for that reservoir, although general processes will be similar for reservoirs in similar climates.
Pool Level Fluctuations
Pool level fluctuation increases the area exposed to terrestrial and shoreline wave erosion. Drawdown and filling curves for reservoirs are generally smooth, but are occasionally interrupted. Variations in these curves are a result of variations in runoff and the demand for electricity. Static lake levels concentrate wave erosion at a given elevation on slopes along the reservoir, whereas rapid drawdown may increase erosion as a result of groundwater and mass movement processes. Any drawdown below normal operating pool exposes non-vegetated shoreline, consisting usually of fine-grained deposits, making them subject to erosion by rainsplash and overland flow.
Shoreline Orientation
The shoreline orientation can effect the erosion occurring in the reservoir environment due to the influence of the dominant wind directions on shoreline wave erosion. Shorelines oriented directly downwind of the average wind direction may exhibit accelerated erosion relative to other shoreline orientations. High shoreline-length to lake-surface-area ratios in reservoirs result from shorelines with many bays and promontories. These promontories and shorelines facing dominant winds are subject to greater wave erosion than bays or leeward shores (Lawson, 1985). The length of reservoir shoreline of a certain orientation is controlled primarily by the overall orientation of the reservoir and the original river valley that it fills. North and east facing shores are also subject to greater freezing and thawing, which can be an important process of shoreline erosion (Reid et aI., 1988).
Shoreline Geology
Bedrock and surficial geology determine the erosional susceptibility of materials in the reservoir environ-
3-2 FINALEIS
Geology Appendix
ment. Erodibility, in turn, is dependent upon the grain size and cohesiveness of the materials. Drainage basin geology determines the particle size available for erosion and transport to the reservoir, while shoreline surficial deposits and bedrock control the processes occurring at the shoreline. In this section, types of shoreline materials and their effect on shoreline erosion are examined.
Igneous and metamorphic bedrock and talus form stable shorelines due to the large size of these materials and their resistance to erosion. Less-resistant sedimentary rocks such as sandstone and mudstone are more susceptible to weathering, but still resist erosion.
The various types of surficial deposits are more susceptible to erosional processes acting on reservoir shorelines. The geotechnical properties of colluvium, combined with its location on steep valley walls, make it potentially unstable. When disturbed, however, colluvial deposits are generally thin and of limited areal extent, reducing the possible extent of erosion. Till exhibits considerable variation in sedimentologic and geotechnical properties. In general, subglacial (lodgement) till is more consolidated, homogeneous, and resistant to erosion than supraglacial till. Alluvial fan deposits are found where the main river's tributaries enter a reservoir. They are generally stable because of their coarse texture. However, alluvial fans are susceptible to initial incision (down-cutting) by the tributary stream, followed by bank failure and channel widening when reservoirs are operated below normal pool levels. Depth of incision is generally limited to lowest pool level. Debris cones formed by smaller, ephemeral streams with steep gradients generally have a larger particle size and are more resistant than alluvial fans to the processes of wave and overland flow erosion. Glacial outwash, typically composed of cohesionless sand and gravel, is subject to entrainment, transport, and redistribution by the processes affecting the reservoir environment.
Landslide deposits exhibit wide variation in stability. Their variable composition reacts differently to erosional processes. Overland flow and wave erosion affect the smaller particles. Accelerated sliding
1995

Geology Appendix
may be enhanced by rapid, extended drawdown that removes the supportive force of water from the slide base. Variable pool levels can cause bank failure as wave and overland flow erosion remove toe support from slides.
Alluvium deposited on low-relief floodplains and terraces is variable in composition and resistance to erosion. Fine-grained material deposited and distributed along reservoir banks over years of normal operation is relatively stable in its undisturbed state. Drafting below normal pool levels exposes these non -vegetated sediments to waves and overland flow erosion. Low-permeability deposits impede the drainage of groundwater as pool levels are lowered; increasing pore-water pressure reduces the shear strength of these materials and makes them extremely susceptible to bank blowouts, piping, sapping, and mass movement. Steeply sloping terrace risers are very susceptible to erosion but generally are not widely distributed.
The generally fine grained sediment deposited within the deeper, normally subaqueous parts of the reservoir would only be subject to erosion during extreme drawdown events. However, due to the fine-grained nature of these deposits, they are highly susceptible to wave and overland flow erosion. Once mobile, they can be transported out of the reservoir due to their low settling velocities.
Stratigraphic relationships between various sediments complicate the stability of a given shoreline. For example, where till and outwash deposits overlie impervious lacustrine or compact subglacial till, groundwater saturation of the overlying strata may result in mass failures, particularly when reservoir bank erosion has undercut these deposits.
Climate
The climate of a region is an important element of the reservoir system, as it determines the weather that drives many of the shoreline erosion processes. Storms, with their accompanying winds and rainfall, directly influence waves and overland flow erosion. The intensity and distribution of precipitation events drives overland flow erosion. Prolonged strong winds from a single direction can pile up water at a
1995
3
windward shore, effectively raising the lake level at that location and increasing wave energy acting on the shore.
The local climate controls antecedent soil moisture, which influences erosion by reducing particle resistance to entrainment and thereby accelerating surface erosion (Stolte, et aI., 1990). Soil moisture also provides the medium for freeze-thaw detachment to occur. Temperature affects freeze-thaw and the distribution of ice cover, which inhibits reservoir waves. Ice cover can directly cause erosion in some reservoirs when ice runs up on a shoreline or when the lake level falls; in such cases ice often collapses, taking soil and vegetation with it.
3.1.2 Reservoir Processes
Erosion processes affecting the reservoir environment include waves, reservoir currents, freeze-thaw, hillslope, groundwater, and overland flow. Total erosion is determined by reservoir operation, the magnitude of each process, characteristics of the reservoir environment, and interaction between processes. For example, wave erosion may accelerate mass movement by undercutting or steepening the shoreline. In fact the interdependence of these processes, coupled with the sheer number of processes, may make it impossible to quantify erosion attributable to a single process.
The cyclic nature of drafting and filling in storage reservoirs imparts a periodicity to reservoir shoreline erosion. This cyclic pattern accentuates climatic conditions that produce larger storms during the summer months, which transport sediment accumulated by weathering during the fall and winter. Every spring and summer, shoreline bank material and colluvium is eroded from bluffs and beaches near the full pool elevation. The eroded material is carried to lower depths by waves as the reservoir level falls in autumn and winter. The normal fall and winter drawdown exposes additional nearshore areas to mechanical freeze-thaw weathering. Continued large fluctuations in reservoir level prevent stable shoreline profiles from developing (Lawson, 1985). Shoreline erosion in run-of-river operations is generally much less than in storage
FINALEIS

3
reservoirs, due to the much smaller range of pool elevations.
Wave Erosion
Of the processes acting on shorelines at normal pool levels, waves are the predominant force eroding reservoir bank sediments (Kondratjev, 1966; Savkin, 1975; Adams, 1978; Shur et aI., 1978; Reid, 1984; and Reid et aI., 1988, among others). The elevation of the pool controls where waves and their erosive force intersect the reservoir shore (see Figure 3-1) and, therefore, is the principle variable in shoreline erosion (bank recession) (Reid, 1984; Reid et aI., 1988). Waves influence other shoreline erosion processes, such as mass movement and groundwater movement, by undermining slopes and saturating bank materials.
Waves are produced by wind and boats. The energy of wind waves is related to wind direction, speed, duration, and the length and width of the unobstructed space the wind blows across (i.e. fetch and fetch width, respectively). Reservoir pool level can influence the fetch and fetch width across which waves develop and therefore is positively related to the erosive potential of waves. Waves typically develop and subside rapidly in response to wind (Savkin, 1975). Topography influences wind strength and direction, as winds accelerate and are directed through river valleys; open broad reservoirs are more conducive to wave development than narrow, more confined reservoirs. Boat wave size is directly related to the speed and draft of the boat. Large, heavy, fast boats produce the largest waves.
Reservoir Currents
Reservoir currents originating as streamflow transport fine material (not deposited on fan deltas of tributaries) to lower portions of the reservoir or through the reservoir. Suspended sediment transport and deposition depends on the velocity of the flow through the reservoir. If current velocity exceeds the settling velocity of a particle size, then particles of that size will pass through the reservoir. Reservoir deposition occurs when the settling velocity for a particle size exceeds the transporting velocity.
3-4 FINALEIS
Geology Appendix
With all things being equal, current velocity and hence travel time through a reservoir determines the size and amount of sediment deposited in a reservoir. The strongest currents in a reservoir can generally be expected to occur in the thalweg of the pre-existing river channel. This relation will change with time as reservoir sedimentation fills in the channel, leveling the reservoir bottom. Dam conditions, such as spillway and gate outlet location and operation schedule, influence the location, magnitude, and timing of reservoir currents. Reservoir drawdown is expected to increase current velocity, thereby decreasing the travel time of water and sediment through the reservoir and promoting greater transport of suspended sediment (both pre-existing and induced by erosion during drawdown) through the reservoir. The transporting capacity of reservoir currents cannot be generically characterized because it varies with mUltiple factors affecting the reservoir operation, sediment and water input, and erosion processes.
The erosive capacity of reservoir currents is minimal during normal operations. Locally, other processes may interact to initiate density currents that erode and transport sediment into deeper sections of the reservoir. This redistributes sediments within the reservoir, as little or no new sediment is introduced. When pool levels are rapidly lowered, current velocities may increase and change from laminar to turbulent flow. This may increase the sediment transport and erosive capacity of a flow and entrain reservoir sediments. Reservoir currents reach a maximum velocity at natural river levels, where channel and stream bank erosion dominate. The fine-grained, unconsolidated nature of reservoir deposits make them highly susceptible to all erosive processes.
Freeze-Thaw
Freeze-thaw is another important process of shoreline and drainage basin erosion that produces materials for transport by other mechanisms. Freezethaw occurs both daily and seasonally. Expansion and contraction of water in sediments during freezing and thawing disaggregates soil particles, reducing their compaction, consolidation, and shear strength (Lawson, 1985). During spring thaw, melting of one
1995

o
\"""""
o
A, Ru<noir at_ pool B, Drawdown to _, do ... alIoviol Im.1ope. C. Water down to level of old river lennce.
Lev ..
lJWee
Loyee
·'_Inclplent skimp / /
/
0 / OrIginal stJf!aces
/ " .... /
.... /
/ /
.... .... / ....
.... " .... "
" 0 "
.... I .... I .... I
I <\ I .... I I .... .... \ I.
.... - ---
D. Rc:sen'oir II. muimam drawdown; aJampinl occm1 on _eep tcrrKe risers. £. CkICCr tchcnuIlie or wavo<ut tcrnoes. F. D~ showinl gtOll.c:triaJ approximation ofmaltJialrtmovcd by .... veeros;on.
Figure 3-1. Schematic Diagram Showing Wave Erosion During Drawdown.

3
zone in a sediment column above a still -frozen layer may result in mass movement of the upper thawed unit. Fine, clay- rich soils, such as lacustrine deposits and subglacial till , are most susceptible to freeze-thaw failure . Within a reservoir catchment, freeze- thaw mechanical weathering of soil increases the ava ilability of sediments for transport by over· land flow, especially in semi-arid areas where biological and chemical weathering are reduced by moisture conditions.
Shores with northerly aspects generally are more likely to undergo freeze-thaw, as they retain more moisture for freeze exparuion (Reid et aI., 1988). Low winter sun angles and deep valleys that lie in shadows during winter enhance this relationship. Sterrett and Mickelson (1981) found 87 percent of banks on Wisconsin's Great Lakes shorelines failed because of freeze-thaw related processes. Thn to twenty percent of all bank recession on Lake Saka· kawea, North Dakota was attributed 10 freeze-thaw (Reid et al., 1988). Gatto and Doe (1983) saw a strong correlation between rales of bank recession and the length of the freeze-thaw season.
Mass Movements
Reid et a!. (1988) noted that shoreline bank recession is ul timately caused by mass movement of sediment. which occurs after modification of beach profiles and materials by other processes. Mass movements include debris slides and flows in cohe· sionless sediments (e.g. outwash, alluvium, and most COlluvium) and slumps and flows in cohesive, finegrained sediments (e.g. glacial till, lacustrine deposits). These mass movements are influenced by excessive moisture conditions, which induce failure and facilitate transport by increasing the mass of the deposit while decreasing shear strength. Deposition of the material occurs when resistive forces exceed inertial forces. This occurs when the slumped material experiences dewatering or a reduction of gradient, or when it enters a reservo ir (Kachugin, 1970).
Landslides occur in all shoreline materials in response to conditions that exceed the threshold stability for that particular landform. Loading, by
FlNALEIS
Geology Ap~"dix
water or other material, and reduction of structural support, such as removal of the toe of a slope, generally trigger slides. Reservoir processes that remove structural support on a slope include wave action, excessive pore water pressure during drawdown, and erosion by channel widening.
Slope failures are common in reservoirs with both rapid and prolonged drawdowns (Lawson, 1985). Jones et a!. (1961) and Erskine (1973) noted a relation between rapid drawdown and increased mass movements in low- permeability bank sediments. Further, they suggested that this is related to movement of groundwater from the banks to the reselVoir, which resulted in instability of bank sedi· ments.
Groundwater
Groundwater plays an important role in reservoir shoreline processes. Lawson (1985) identified water level, composition of bank sediments, and groundwa· ter movement along shorelines as three factors contributing to sho reline erosion. Groundwater can recharge or drain a reservoir, depending on the local hydraulic gradient near the reservoir. This relation may reverse during the year due to climatic and operational controls. In situations where reservoirs lose water to the surrounding aquifer, groundwater movement has little influence on erosion except by reducing the total amount of water that could be used for erosion. More typically, though. groundwater flows into reservoirs. and can contribute to mass wasting during rapid drawdowns.
Groundwater can influence geotechnical properties of bank sediments and directly cause erosion by piping (Lawson, 1985). Sediment shear strength is reduced as excess groundwater increases pore pres· su re and seepage pressure. Groundwater seepage has been shown to enhance erosion of sandy material by decreasing its shear strength, and hence resis· lance to erosion by ove rland flow (Stolte et aI., 1990). Failure of banks by groundwater-related mass movements are most common where perme· able sediments are interbedded with impermeable ones and groundwater flow is complex; glacial sediments are characterized by complex groundwater now systems (Sterrett and Edil, 1982). Rapidly
/995
Geology Appendix
lowered pool levels result in high seepage pressures in groundwater perched above the falling lake. High seepage pressure can lead to reduced strength of bank materials. Blowout and bank collapse have been noted along river banks with fine grained material following rapid water level lowering. This process was noted during the March 1992 drawdown test of Lower Granite Reservoir (Corps, 1992).
Overland Flow Erosion
Overland flow occurs when the storm precipitation rate exceeds the infiltration rate of the surface material, resulting in runoff when ponding storage is exceeded. Flow is concentrated by microtopography, which increases flow depth, velocity, and turbulence. All of these increase the shear stress acting on the surface. Rill erosion occurs when the shear stress of the flow exceeds the resisting force of the surface material, creating small channels. Rill erosion occurs primarily by detachment from concentrated runoff (Meyer, 1986). Before rills form and between rills once they have formed, raindrop splash detaches and transports particles downslope into rills. Thin-film runoff with raindrop enhanced turbulence also occurs within this area, a process referred to as interrill erosion.
Rill erosion is accelerated by increased surface area, slope, and length of flow; rainfall intensity and duration; decreased vegetation; unconsolidated and detachable particles; high moisture; and seepage conditions. Interrill erosion is a function of rainfall intensity and duration, drop size, infiltration capacity, and the size and detachability of soil particles.
Channels and gullies are large, incised features that form as greater quantities of runoff are concentrated (by rills) and generally proceed upslope by knickpoint migration; they tend to exhibit channel widening by bank collapse (Harvey and Watson, 1986). Reservoir areas subject to these processes during precipitation events are exposed shoreline and the alluvial fans and fan deltas formed at tributary mouths. Gully incision is limited by reservoir level and intersection with bedrock.
Rill and in terrill erosion operate throughout drainage basins. Interrill erosion is independent of base
1995
3
level control, while sediment availability controls rill erosion. Channels and gullies are influenced by changes in base level but cannot migrate past base level controls such as bedrock or very coarse alluvium. Of the factors controlling overland flow erosion, pool level variation (which affects base level, surface area, sediment availability) is reflected in the reservoir environment and in small, adjacent alluvial basins.
Human activity can influence shoreline erosion by eliminating vegetation, displacing or compacting soil, and concentrating runoff. Overland flow of water on bluff faces and bank colluvium can cause erosion, especially on non-vegetated slopes composed of sediments with low cohesion (Lawson, 1985). Rilling and gullying are more active in highly impermeable sediments, whereas rain splash and sheet flow dominate in permeable soils (Lawson, 1985).
3.1.3 Erosion Response to Pool Level
Adjustment of Shorelines at Full Pool
The imposition of reservoir water onto sediments and landforms created in terrestrial environments represents an unstable configuration (Lawson, 1985). Raising of natural lake levels by dams initiates shoreline readjustment (erosion) (Lynott, 1989). Lawson (1985) noted differences between reservoir, lake, and ocean shore zones, and suggested that reservoir profiles reflect the immaturity of their shores. Bruun (1954) suggested ocean beaches represent part of a shore zone in dynamic equilibrium with environmental conditions. Beach zones developed along reservoir shores may also reflect a dynamic equilibrium between shorelines and environmental conditions (Kondratjev, 1966). Reservoir shores not in equilibrium with environmental conditions typically have steep bluffs and poorly developed beach zones, while severely eroding shores may have no beach zone (Lawson, 1985).
The time necessary to reach an equilibrium profile varies within a given reservoir, and within a given reach of shore (Lawson, 1985). Lawson (1985) notes that a lack of studies of reservoir shoreline erosion and the complex interaction of environmental factors and processes make it difficult to predict if and
FINALEIS 3-7

3
when equilibrium profiles will be attained. Nonetheless, Kondratjev (1966) suggested that this process takes from 5 -10 years, although a static reservoir level is necessary for beach zones to develop.
Construction of the Columbia River dam network altered the natural flow (in fact, this was a major justification for the dams) by placing water and sediment control structures on the mainstem. The free-flowing Columbia River had high flow peaks and elevated sediment transport in response to spring snowmelt runoff and extreme precipitation events.
Since dam construction, peak flows have been reduced and sediments trapped in reservoirs. This artificial rise in local base level has caused the development of alluvial fans and deltas at the mouths of tributaries and on the mainstem rivers. Decreased sediment production in areas now flooded is offset by placing some landforms in unstable conditions; e.g., valley sideslopes formed and maintained by hillslope processes are now out of equilibrium with reservoir shoreline processes (wave erosion). The equilibrium of the Columbia River system is no longer a continuum throughout the basin. What exists now is a series of local base level controls ( dams), to which the nearby tributaries and upstream mainstem river sections respond. Equilibrium, whether dynamic or static, may not be achieved again until the reservoirs fill with sediment.
Erosion Below Full Pool
Although erosion of reservoir shores is most severe and costly in terms of habitat and facility losses when reservoirs are at full pool, erosion and sediment transport also occur below the highest reservoir shoreline. Previous studies have not focused on the processes, nature, or severity of erosion in the reservoir drawdown zone.
Drawdown below normal operating pool level is analogous to base level reduction in fluvial systems. Many experimental and field studies have focused on the impact of lowering base level on river morphology, sediment transport and deposition, and drainage basin evolution (Schumm, 1987). Briefly, base level (or pool level) reduction increases over-
3-8 FINALEIS
Geology Appendix
land flow, wave erosion and freeze-thaw by exposing additional shoreline to these processes. Lowering base level directly accelerates incision in alluvial material, with resultant knickpoint migration and channel widening by collapse. Wave erosion is complexly affected by base level reduction as waves encounter fine sediment that is normally below the zone of wave activity (Figure 3-1). However, wave energy is reduced as reservoir surface area declines when pool level is lowered. The geometry of the individual reservoir controls wave generation to a large extent. Mass movement is accelerated by removal of the buoyant force of water and increased pore water pressure. Rapid drawdown de-stabilizes banks and slopes, causing sapping, slumps, and slides. Repeated drawdowns below normal operating levels delay development of equilibrium reservoir profiles (lag beaches that protect against erosion) and contribute to accelerated reservoir erosion.
Landforms most sensitive to erosion below full pool include terrace edges and valley walls. Steep slopes on these landforms that once held thick accumulations of unconsolidated sediments have been stripped of much of their original soil cover and are now covered with loose coarse lag deposits in the drawdown zones. Below normal operating levels, these landforms do not have this coarse armoring, and thus are less resistant to shoreline processes.
The steep, former valley sideslopes are now transport areas for the material eroded from shorelines above and below full pool. Erosion and transport of these sediments occurs as the reservoir level fluctuates and influences shoreline erosion at full pool. When the normally rapid filling or drawdown is interrupted by periods of static lake elevation, wave erosion cuts strand lines into unconsolidated material and accelerates the movement of the eroded material to deeper parts of reservoir.
Another effect of lowering the base level of tributary streams is sapping. Sapping occurs when the banks of a tributary are undercut by groundwater moving through and exiting them at the base (Kachugin, 1970). In the reservoir environment, sapping occurs when the pool level is lowered, leaving saturated but permeable sediments above the mainstem river. Sapping may occur on the banks of the mainstem
1995

Geology Appendix
itself, but slumping seems to predominate there . On tributaries to the mainstem, incision of the delta sediments may initiate sapping, as groundwater begins flowing through the more penneable layers to the incised channels. Fine particles are washed out, removing support for the sediments above them. This occurred on Alpowa Creek during the 1992 drawdown test (Figure 3-2). While limited to those tributaries with broad deltas, sapping may still be a significant contributor to erosion.
3.1.4 Sedimentation
Reservoirs are sediment traps, capturing all but the finest particles entering the reservoir. Reservoir sedimentation is an expected process that ultimately reduces the effectiveness of the reservoir. The Columbia River system reservoirs are filling in with sediment at differing rates. For example, it is estimated that Lower Granite Reservoir has accumulated 40 million cubic ya rds (30.6 million m3) of sediment so far during less than 20 years of operation.
Reservoir sedimentation is controlled by the erosion and delivery of sediments from the drainage basin upstream to the reservoir. Upstream and drainage basin production of sediment influences the particle size of the sediment delivered to reservoirs., while fluid properties of velocity, temperature, and sediment concentration influence transport and deposition in the reservoirs. Reservoir operations generally do not drastically alter sediment delivery to reservoirs. Operations redistribute materials already in the reservoir environment. If operations increase flow velocity through reservoirs, then some stored sediment would be flushed from the reservoir. Downstream reservoirs would receive this additional sediment, which could accelerate sedimentation if their operations are not adjusted to allow for sediment passage.
Deposition of coarser particles within a reservoir is concentrated at tributary mouths in fan deltas, where the ve locity and transporting capacity of the now are reduced as it enters the still water of the reservoir. Finer particles may be transported further into the reservoir and settle in the deeper sections near the dam. This general trend of down-reser-
1995
3
voir fining is apparent in most reservoirs (Gottschalk, 1964). Waves are very effective at redistributing sediment delivered or eroded from shorelines to deeper sections of the reservoir.
3.2 STUDY PROCESS
This section describes the procedures used to link the processes described above to the existing surface and subsurface reservoir environment in light of the proposed SOS alternatives. The discussion summarizes the respective approaches taken for erosion and sedimentation issues and for groundwater.
3.2.1 Erosion and Sedimentation
As discussed above, reservoir pool elevation is the element of each SOS alternative that variably affects erosion, sedimentation, and groundwater. In general this influence is restricted to near-shore areas and alluvial floored tributaries. The 50S alternatives can generally be broken down into two groups based on their effects on the reservoir environment. The first group of alternatives (SOSs 1 through 4) would generally maintain pool levels within or near nonnal operation ranges. As such, these alternatives would not impose radica11y different stresses on the reservoir shorelines and would be expected to have minor impacts. The second group (SOSs 5, 6, 9a, and 9c) involves mainstem reservoir drawdown outside of normal operating levels to increase now velocity of water through the river system. These alternatives would be expected to have major impacts on the reservoir environment.
In general, the alternatives deemed to have the potential for the most significant impacts were studied more intensively than those involving minor operational changes. Little was known about potential impacts of certain operations, and the alternatives containing those operations were treated in a qualitative way. Empirical evidence of impacts was available for other opera tions. The analysis of these options was more quantitative.
A useful indicator of erosion intensity is the total pool elevation range (PR). While local geology and reservoir geometry greatly influence the relationship of PR to total erosion, PR does help indicate trends in erosion that can be expected at a given reservoir. As indicated in the previous discussion of reservoir
FINALE1S 3-9

3
Figure 3-2.
Geology Appendix
Photo of Lower Granite During Maximum Drawdown, March 1992 at about RM 131.
3-10 FlNALEIS 1995
=
1
Geology Appendix
erosion and sedimentation, pool level fluctuations influence most of the processes acting on the shoreline. In addition, changes in PR tend to outlast effects of other changes related to pool levels. For instance, if the PR is reduced by 30 percent and the average annual pool elevation is decreased, the surface area above the average annual maximum level reached would increase, and would be exposed to more surface erosion (overland flow, rilling, gullying). However, the resulting erosion would be limited by prior removal of detachable particles (when waves could attack the shore at these elevations), and by re-establishment of vegetation. In addition, wave erosion tends to produce greater volumes of sediment than surface erosion. Thus, the net effect would be an overall decrease in shoreline erosion.
Affected Environment
Geologic and hydrogeologic studies of the basin, its provinces, and the specific project locations were reviewed to determine the nature of the existing environment. These studies primarily include U.S. Army Corps of Engineers (Corps) and Bureau of Reclamation (Reclamation) documents on their respective projects. The available studies represent somewhat dated literature, and they do not provide a complete and up to date inventory of all landslides and eroding or potentially eroding areas. The SOR is a programmatic review, however, and does not require a full, site-specific inventory and assessment of potential effects. The objective for the baseline studies relative to erosion and sedimentation was to provide a general and reasonably current overview of bedrock and surficial geologic conditions for the system.
Impact Analysis
Literature review was also a key part of the impact analysis. Th understand the erosion and sedimentation processes involved, the literature was searched for pertinent studies on the effects of water regulation on river and reservoir banks. Because pool level is the main link between shoreline erosion/mass wasting, water table fluctuation, and dam operation, the SOR hydroregulation model results provided the
1995
3
basis for assessing the nature of pool level fluctuations under the proposed alternatives. The assessment of the effects of SOSs 1 through 4 is largely qualitative. Mass wasting, for instance, can only be assessed as to the likelihood it will occur, i.e., will the likelihood increase, decrease, or remain about the same as under current operations. For some areas, however, it was possible to estimate the rate of expected shoreline retreat based on existing measurements.
A more detailed analysis was appropriately pursued for SOSs 5, 6, 9a, and 9c. Based on prior assessments of river system operations, the study team recognized that the drawdown alternatives held the potential for significant changes in erosion and sedimentation. In addition, the SOR water quality analysis required specific estimates of sediment contribution with these alternatives, as inputs for model analysis of water quality parameters. Therefore, the geology and soils study process included a quantitative assessment of erosion and sedimentation under drawdown conditions.
The March 1992 drawdown test results provide an empirical study of reservoir drawdown that is well suited for analysis of the effects of larger-scale drawdowns in the same river reach. Extensive data on the nature of the reservoir sediments in Lower Granite and Little Goose exist, and the 1992 drawdown showed which processes affected the shoreline and to what extent. Although the mechanisms of all of the processes are not completely understood, the extrapolation of the impacts from the 1992 test to the proposed SOS drawdown scenarios is the best available method to predict potential shoreline impacts.
The study team developed a shoreline erosion model to assess the major processes involved in shoreline erosion and reservoir sedimentation. These included mass wasting, wave erosion, overland erosion, and incision. The universal soil loss equation was used to estimate surface erosion. The amount of mass wasting, wave erosion, and incision were calculated based on the results of the 1992 drawdown.
There are no detailed studies of shoreline behavior during drawdown, and the model relied heavily on
FINALEIS 3-11

3
interpretation of aerial and ground photographs of the 1992 drawdown area. The model focused on Lower Granite because more information is available for that reservoir than others. The surface area was estimated using the pre-dam river terrace topography. Armored areas, such as riprap and coarse - grained alluvial fans, were subtracted from the total estimated area exposed. Slumping/sapping was estimated using data from the 1992 drawdown test. Geometry of slumps was estimated using photos and knowledge of the behavior of slumped materials. Total slumped material was estimated for the 1992 drawdown test and adjusted for drawdown level and shoreline geometry. 'Itibutary erosion was similarly estimated, using aerial photos and groundbased photos. Volumes of eroded materials were estimated for each major tributary using channel geometry. These estimates were adjusted for pool levels in SOS 5 and SOS 6, since both are lower than the maximum drawdown in the 1992 test. Wave erosion was estimated using the geometries of wave-cut terraces along the reservoir shoreline. Several classes of exposed areas were developed based on slope and geomorphic character. The volumes were multiplied by the number of terraces at various sites of uniform slope, and adjusted for the slope as well. The estimates were extrapolated for areas that would be exposed under SOSs 5 and 6.
Estimates for each erosion process were calculated for three different rates; low, moderate, and extreme. Because the 1992 test occurred during unusually calm conditions, the estimated wave erosion was assumed to represent a low erosion scenario. Surface erosion, mass wasting, and incision were also considered to represent the low end of the possible erosion range. For the moderate scenario, weather conditions during the test were compared to average conditions for that period and correspondingly adjusted. Adjustments were also made for the timing and duration of the proposed drawdowns.
Erosion estimates for the other three lower Snake reservoirs (Little Goose, Lower Monumental, and Ice Harbor) were made using the average erosion
3-12 FINALEIS
Geology Appendix
per mile under the moderate erosion scenario on Lower Granite and multiplying by the mileage along those reservoirs. This estimate was adjusted for amount of available sediment, noting that the dam construction sequence went progressively upstream in a relatively short period. This means that the other dams did not have very much time to accumulate thick sediments; most sediments have been trapped by Lower Granite. Some reservoirs, though, have major tributaries draining highly erosive land (the Palouse region), so further adjustments were made to account for these major sources of sediment.
More details of the model, with the assumptions and uncertainties, are presented in Appendix M, Water Quality, Thchnical Exhibit G. Model results are summarized in Sections 4.6 and 4.7 of Appendix L.
3.2.2 Groundwater
A comprehensive literature search was conducted to obtain information on groundwater wells and usage in the vicinity of reservoirs affected by the SOR. In addition, the U.S. Geological Survey in Washington, Idaho, and Montana and the Idaho Department of Water Resources were contacted to obtain well information. No comprehensive reports exist that catalogue wells in the study area. Data resources are typically non -automated and scattered among various local, state, and Federal agencies.
To gain some understanding of potential groundwater impacts, information from water resources personnel was used to assess the general location of zones of significant groundwater usage near reservoirs. Groundwater conditions under the proposed alternatives were estimated based on general aquifer characteristics and empirical studies, where possible, and on parallel material from the 1992 Options Analysis/EIS and the Supplemental EIS (SEIS). Impacts to groundwater and wells were assessed generically in most cases, although the 1992 Lower Granite drawdown test results include information for that specific project area. The assessment of impacts to groundwater should therefore be regarded as qualitative, and having a high degree of local variability.
1995
Ceol0S>' Appendix
3.3 RELATIONSHIP TO OTHER STUDIES
The study team responsible for soils, geology, and groundwater interacted with several other SOR groups during the course of the study. In general, this involved other SOR elements that desired information on erosion and sedimentation as inputs to impact analysis for other resource areas. Information exchange relating to water quality, air quality, and recreation is summarized below.
3.3.1 Water Quality
Shoreline erosion adds suspended and dissolved sediment to the reservoir. This translates into increased turbidity, a major water quality concern. In addition, chemical contaminants attached to reservoir sediments could enter the water column and affect water quality if reservoir operations resuspend the sediments.
To support the water quality studies, the geology/ soils study team conducted an analysis to estimate the amount of shoreline erosion that would occur during reservoir drawdown on the lower Snake. These results were fed into the water quality model analysis and were specifically used to determine turbidity downstream. The shoreline erosion results are also reported in this appendix and used to determine some of the impacts of SOSs 5 and 6.
3.3.2 Air Quality
Geology and soils are usually not related to air quality issues. In the normal drawdown zone, most fines that would otherwise be exposed to eolian (wind transport) processes are winnowed out. Blowing dust may persist at some storage reservoirs, depending on the composition of the shoreline materials. In addition, events such as annual drawdowns of some run-of-river projects (as in SOS 5 and 6) would expose significant areas of unconsolidated fine materials and create potential windblown dust problems. Contaminants that attach to fine sediment particles might also become airborne due to exposure to wind, representing another soils-related air quality issue.
The geology/soils and air quality study teams shared information and coordinated approaches to impact
1995
3
analysis in response to these areas of overlapping issues. Both analyses required estimates of reservoir subsurface area exposed under different operating conditions. The air quality group developed these estimates and shared the results with other parties. The geology/soils team obtained and applied grainsize data for reservoir sediments, for use in the shoreline erosion model analysis. This information was shared with the air quality team, which required data on sediment composition to develop quantitative results for dust generation. Both teams also shared meteorological data, which were used as inputs to the shoreline erosion and air quality modeling processes.
3.3.3 Recreation
Geologic and soil conditions can have a direct impact on the recreation potential of the reservoir environment. They determine the nature of the shoreline, which is the most intensively used portion of the reservoir. Rocky, bedrock, or muddy shorelines may not be conducive to some recreation activities. Suitability for other recreational activities changes as shorelines develop. Furthermore, high levels of turbidity may lower the aesthetic appeal and sport fishing potential of a reservoir, thus decreasing its recreational value.
Addressing these issues will require the Recreation Work Group to obtain and apply information on existing conditions and projected impacts from the geology/soils study team. However, this element of the recreation analysis involves assessment of user responses to various physical conditions associated with system operations. The Recreation Work Group sponsored a survey of users, and for which results are just becoming available. Incorporating information on shoreline materials and erosion with user response data, therefore, represents a future activity that is not yet reported in the SOR documents.
3.3.4 Cultural Resources
Erosion and sedimentation patterns can greatly affect artifact exposure and context. Historic or pre-historic features that are currently submerged are generally not subject to vandalism or theft.
FINALEIS 3-13
3
Changing the operation of reservoirs may erode the sediment that has blanketed such features, hence exposing them to view. In addition, the locational context of such features may be modified through wave action, soil displacement, and stream incision.
The Cultural Resources appendix (D) examines the general effect of shoreline (wave) erosion on zones with high potential for artifact. This appendix considers the effect of slumping/sapping, incision,
3--14 FINALEIS
....... ------
Geology Appendix
and overland erosion, in addition to wave erosion. It is important to note that the effect on specific zones along a reservoir may be more or less severe than the effect on the total area exposed by reservoir operation. Thus the results of the Cultural Resources model of shoreline erosion may not always appear to be in agreement with the results of the model used in this study. However, any differences are due to the site-specific nature of the cultural resources model.
---

Geology App<ndix 4
CHAPTER 4
ALTERNATIVES AND THEIR IMPACTS
4.1 GENERAL DESCRIPTION OF ALTERNATIVES
Seven alternative System Operating Strategies (50S) were considered in the Draft EIS. Each of the 7 SOSS contained several options. bringing the total number of aJtematives considered to 21. This Final EIS also evaluates 7 operating strategies, with a total of 13 alternatives now under consideration when accounting for options. Section 4.] of this chapter describes the 13 a1tematives and provides the rationaJe for including these a1tematives in the Final EIS. Operating elements for each alternative aTC summarized in 'Dible 4-1. Later sections of this chapter describe the effects of these alternatives on geology.
The 13 final alternatives represent the results of the third analysis and review phase completed since SOR began. In 1992, the agencies completed an initial effort, known as "Screening" which identified 90 possible alternatives. Simulated operation for each alternative was completed for fIVe water year conditions ranging from dry to wet years, impacts to each river use area were estimated using simplified analysis techniques, and the results were compared to develop 10 "candidate SOSs." The candidate SOSs were the subject of a series of public meetings held throughout the Pacific Northwest in September 1992. After reviewing public comment on the candidate strategies, the SOR agencies further reduced the number of SOSs to seven. These seven SOSs were evaluated in more detail by performing 50-year hydroregulation model simulations and by
determining river use impacts. The impact analysis was completed by the SOR workgroups. Each sas had several options so, in total, 21 alternatives were evaluated and compared. The results were presented in the Draft EIS, published in July, 1994. As was done after Screening, broad public review and comment was sought on the Draft EIS. A series of nine public meetings was held in September and
1995
October 1994, and a fonnal comment period on the Draft EIS was held open for over 4 1/2 months. Following this last process, the SOR agencies have again reviewed the list of alternatives and have selected 13 alternatives for consideration and presentation in the Final EIS.
Six options for the alternatives remain unchanged from the specific options considered in the Draft EIS. One option (SOS 4c) is a revision to a previously considered alternative, and the rest represent replacement or new alternatives. The basic categories of sass and the numbering convention remains the same as was used in the Draft EIS. However, because some of the alternatives have been dropped, the fmal sass are not numbered consecutively. There is one new SOS category, Settlement Discussion Alternatives, which is labeled SOS 9 (see Section 4.1.6 for discussion).
The 13 alternatives have been evaluated through the use of a computerized model known as HYDROSIM. Developed by BPA, HYDROSlM is a hydroregulation model that simulates the coordinated operation of all projects in the Columbia River system. It is a monthly model with 14 total time periods. April and August are split into two periods each, because major changes can occur in streamflows in the first and second half of each of these months. The model is based on hydrologic data for a 50-year period of record from 1928 through 1978. For a given set of operating rule inputs and other project operating requirements, HYDROSIM will sim ulate elevations, flows, spill, storage content and power generation for each project or river control point for the SO-year period. For more detailed information, please refer to Appendix A, River Operation Simulation.
The following section describes the fi nal alternatives and reviews the rationale for their inclusion in the Final EIS.
FlNALE1S 4-1

4 Geology Appendix
Table 4-1. 50S Allernalive-1
Summary of SOS
SOS 1 SOS 2 SOS 4 Pr".ESA Operation Current Op("latlOns Stab I!' S!oragr PrOject
Op('r;'ltlon
SOS 1 represents system operallons before chang.s were madli BI. r. lull of the ESA ~sting of Ihl" Snake RIYer Almon .odta. 50S 1. rep!". senti operations from 1983 t!waugh the 1990-91 operaling)'8lll'. InftuCII'IC*I by NOtthwelt Power AcI:; SOS Ib reproeents how lhe syalem would opEK81e w~hcM the Waler Budget and ,elided operatiOOll to bene1it anadromous ftah. Short-term opera-110M would be conducted 10 meet power demands wtlile Ulllfying nonpow. requiremen1s.
SOS 2 fe~edS operation 01 the system wkh interim ftow Improvemef1t m .. l1'_ in response to the ESA salmon IIsmgs. bls COI'WIstent with the 1992-93 opef~ deso"ibed in lhe CoIps" 993llterlm CoIt.mbla and Snake RiYef Flow Improvement MBasur. Supplemental EIS. SOS 21;: rapreMnta the opet'8!lng dectsion m ..... reaulloflhll993SuppI. menial ElS end Is the no action alternarlYe for the SOS. Relal:iw 10 SOS 'a, prlm..-y changN ara additional fklw augmentll1lon In the Columbia and Snake AIYetI and modified pool Ievel8I11 lower Snake and John Oay reservoirs during Juve· nile _man migration. SOS 2d repr ..... operllliona of Ihe 1994-98 BIoIogk;IiI Opinion IAued by NMfS, with aOdltlonal1low aumertatlon me. IUlea c:ompaled 10 SOS 2c.
50s 4 would coordlnale operalion at storage reservoirs 10 ber'IIII'~ realNltion, f.dent fish, wIkIltI, and _dromous fish, 'fI'hI" minimizing Impacts to power 9I1d flood control. Reser''''*' would be managed to apedtIc elevations on. monthly basis; tney would be kept full Iongef, while l1li11 pl'OYIding 'P'r.g t\OWS t:Jr fish and ~ tor ftood control. l"he 00-1 II 10 minimize reMl'llOir ftuctU81ionll whll. mwlog closer to nettul low conditions. sas 4c ahempts to accommoCate anadrofl'lOU$ I\$h needI by ehaping mllirJllem flows 10 beneIit m~ ~ would modify the flood conlrol Cipefalions III Grand Coulee.
Acttons by Project
UBBY
4-2
50S I 50S 2 50S -I
Ij!li!~': ",:" 805-1.:5 ,1" ,"<:1 • Minimum prO/lid now 3 kef9
• No reflllt_gets
• Summer drd limit of 5-IOfHt
FlNALEIS
I!~ " '!nSoSU, :;, ':: jil!i • Provide flow augmentation fot INIImon and stLXgeDn wilen Jan. to July foreeaat Is greater than e,5 MAf
• Meet sturgeon flows of 15, 20, and 12.5 km In May, June, andJu~, r. spealYely,ln alIeea13 ouI of 10 ,_.
• Meet apecltlc eHtYa\Ion targets as IndlcaIecI by Integlllted Aula CtA'Ves (lACs) ; lACs a.re build on storage contIni III the end of the PfeviOUll yaM, determination of the app!'oprllIIe yN' wilhln the Cfitk:aI period, .-,cj ""'"' forecasts begllYIIng In JM.ltrty
• IRCaIMMllf to keep reservoir U (2,<4591eet) June-Sept; minimum annual.leYation ranges !rom 2,39910 2,321 teet, depending on otitic. V-1ieI:.-mINllIon
• IHet variable allI'g8Cn flow tatgetl81 Soma ... Fel'l'y!bIng May 2S-Auguat t 6 period; flow targets peak lUI high as 35 km In lhe wenest years
1995
•

Gro/Of:! Appendix
Table 4-1 . SOS Alternative-1
SOS 5 would aid jl.NOl"llte salmon boi 1nereulng river wIociIy. The b6 lower Snake Rivet proleda woukj haYe new 0lA1Bt. InBlaJled, aIICM'Ing the leaervoira to be drawn down to near the original rlller eleVa· tlon. The ' natural r iver" operation would be done for 4 1/2 months In SOS 5b and yeal'ofOUnd In SOS 5c. John Day would also be operaled at MOP for 4 rnorwhs. and flow augrnerUtion m ___ on
the Cdumb181 River portion 0/ the besln would conti,.. _ In SOS 2c.
Operate on system propor. tIonaI draft_In SOS 1.
IiJliillll!!ffi!!l!!i!lli~'Htiiiii Operate on *)'Ilem proper. IlonaJdraft as In SOS 1.
1995
SOS 81rr.<01Yea drawing down lower Snake RI\IeI' protects to IIxed eIevatJona below MOP 10 aid _dromou. fish. SOS fib ~ lor fixed dr.wowna lor III leu Ioww Snake projed6 for 4 1/2 months; SOS ad d~ doWn Lowel GranKe only lor 4 1/2 mmhs. John 0 .... would also be operated at MOP for 4 months, and flow augmentation maasur .. on the CoIunbia River portion ollhe beP'I would continue .. In $OS 2<.
Oper.e on ayM:em propot. Ilona! draft • In SOS 1.
I
filiJifl!!l1JJji2l!!\!"ffiBlijjllil Operala on aystam propor· tIonaI dral! 85 In SOS 1.
SOS 9 repr_nta opertlflonlJ suggested I:¥ the; USFWS, NMFS, the stale 1Isher1es agendea, Native Amencan Vibes, andlhe Federal opefal· Ing agencies during the IMIttlemenl dlscuulona In Ie· span_IO the IOFG v. NMFS court proceedings. ThIs alter· !\at"'" has three option .. SOS. 9a. 9b, and 9c, that repteeent different 5CeOaI108 to Pfovlde IncrNMd I Ner veIocttle8 tor anadromous fish boi establishIng ftow larQlb cuing ml!7ation and 10 cany out oIhar IIdIona to benIJf. ESA· Isted &peelea. The Ihfee optJone are termed the Detailed Fishery Operlltlng Plan (98), AcIopItve ManaQement (9b), and !he Balanced 1m· pam Operation (9<:) .
IS\lli1;~!f '_" ,: + .. j • Oper •• on mlrtnum flow
up to flood control rule curves V-ofoond, except during !low lIUgITlentetlon period
• Provide lIutgeon flow reo Iea8e8 AprHwg. to achIeVe up 10 35 kc18 at Bonn.r·. Ferry with appropriate ramp up and rwnp down ,."
I !t~ilib¥ 'aQI _tb j~;::;';: -ill • Operete on minimum fkMt up 10 flood conttoI rule curves ye!!ll·round, except during flow augmentation
• PrOYide ,tll'geon flow , •• 1e1H. aim liar to SOS 2d
• Can cliett to elevation 2,435 by end 01 July to meet flow I • ..,.
I " +c","j~"", '/ • Oper .. e 10 the Inleg,.ad Rule Curve, end provide lIurgeon now re ...... a.1n SOS4c
1 It " 0.304a m...-
4
SOS PA represents the oper. lion recommended boi NMFS and the USFWS Bioi0gicai OpInions iSsued March " 1995. ThIs SOS supports r. OO\I'8ry of ESA·Wated apeciea bV Blorlng water dur ing the Iail and winter 10 meet spring and summer fICM' targets, and protect. other 11I8OUrC8S by Mtling summer d,aft Ilmh to manage n8Q81lve effKI" by prOYiding IIood protectkln, and 17)' prOYtdlng tor reaeone.ble power gener8lUon.
I: :;g:!E~~'IQi M:: > y< :.:1 • Operal:e on mntmum flow up to flood control rule CU'VG8 be· gInning In Jan., except durIng flow augmentlltion perkld
• SII",e to achieve IIood cootrol elevallorw.ln Oec. In all yew. and bV AprIl 15 In 75 percent of yeers
• ProY\de Blurgeon flows of 25 kc1a 42 days In June and Jufy
• ProYI6e auIflcIent fkMt. to achieve 11 kcflI flow at Bonner'. Ferry lor 21 daya &1. ter maximum floW period
• Oraft 10 mHl1tow targets, to a mInimum end of Aug . • Iev. lion of 2,439 feet , unleu deeper dra1l, needed to meet sturgeon flows
FINALEIS

4 Geology Appendix
Table 4-1. 50S Allernalive-2 Action. by Project
5051 5052 SOS.J
HUNGRV HORSE
ALBENI FALLS
Normal 1983-1991 storage Pfoject _ .... • No mlllllmum now restrlc110n fJom mld·OClIO mlo-NOY.
• No draft Ilmlt: no refill target
Operate on system proportional drllft as In 50s Ie
IFtiimmmm;**2d';i!'!:iiiiihiii411 Operet.oo sylllem proportion. dran Mln80S 1.
• Meet lpecIfic elevation targete ulndir:aled by Inlegraled Rule Curves (IRCI). NrlI"10 operalon for UbbV • lACe Mek 10 keep ree«\iOlr tun (3,580 feel) JlI'Mt-5ept.; minimum annIJai elevation ranges from 3,520 to 3,450 feel, depending on critical year
SOS1 5052 50S.)
r H n. ;11;; 808, 11 ';:::;ffi~~Effi]
Normal 1983-1991 storage pt'oject oper.lliona
No feti. targe!
KAF .. ' .2:M million oubIc moIerS
FINALEIS
F#ci+ ::iiihSOl20 ";P'" n;;;.1 Operale on system proportional draft ulnSOSt.
<>perate on system proportional draft .. lnSOS1.
I .. ,. ". _ '" ··-.CC'iiiCI ,.m!:!::;::: "w .il1:#Jtt Elevation largete eslablished lor each month, 1J8f18I'a/ty 2.056 feel Oct- March, 2,058 to 2,082.518111 ApfIJ-May, 2,082.5'" (ful~ JUM, 2,000 1M' Jllty-$ept. (lIlA higher II runoff high) ; Od.-Merch drawdown to 2,051 leel ~.ry ath ,-
MAF .. 1.2:W billion oubIc meter.
1995
•

Geology Appendix 4
Table 4-1. 50S AllernOlive-2
50S 5 50S 6 50S 9 50S PA
!" i1Jilil::H~¥.'.;: !ii¥i1 Operate on system prop!)(Ilona! drafl as In SOS 1a
Operate on sySlem proportional dl'efI as in SOS 1a
I ","" "'" ' "m''' I ' *;fb:m,:;(~""'"jf7!!_ilii
• Operete on minimum «ow up to 11000 control rule curves year-round. except during now augmentation period
JS:w: ·;,:.'U&O$'.:frii{6.Viq [ l;m:d".- .· ". , .. , _,fW!fili j
• Operate on minimum now up to flood conlrol rule curves year-round, except during flow augmentation
• Can draft to meet ftow targets, to a minimum end-<ll-Juty elevatlon 013,535 feet
• Operate to the Integrated Rule Curves as In 50S 4c
• Operata on minimum flOW' up to flood control rule curves year-round. except during flow augmentatlon period • Strive to achieve flood conIrol ellwatlons by April 15 In 75 percent of the years • Draft to meet flow targets, to a minimum enel-ol-August elevation 013,540 feel
50S 5 50S 6 50S 9 SOS PA
Operate on system propor_ Operate on system propor_ Oper8le on mlnlmLn 1\oW up tiona! tITan as In 50S 1 a 110001 drafl as In 50S l a \0 flood control rule curves
yaar-round, except during flow
f§mtmtJl@~@tti;Wfj l Inlit'lillil¥.;SOS Nlh,hj'''lrmJ augment8llon period
Operate on system propor- Operate on system propor-Ilonal draft as in 50s 1 a tiona! dudl as In 50s 1 a
1~_28_
1995
• Operate on minimum flow up 10 flood control rule curves year-round, except during flow augmentation period
• Can draft to meet target flows, to a minimum end-otJuly elevation 012.060 feet
• Elevation targeta established for each month, generally no lower tnan 2.056 feel Dec.AprM, no low. then 2,OS71Mt end 01 May, full (2,082.5 foot) June--Aug., 2,058 fHt Sept.-Nov.
1 ft_ 0.3048"""",,,
• Operato to hood conIrol eIevaUons by April 151n 90 percent of tna years
• Operale 10 nelp moot now targets, but do not draft below fult pool through Aug.
FINALEIS

4 Geology Appendix
Table 4-1 . SOS Alternativ~ Actions by Project
GRAND COULEE
PRIEST RAPIDS
50S 1 50S 2 50S 4
Itts§];rili4ili:tsos 'it.(: 0i ~dlWilltill:1 • Operate to meet Water Buclgel tar· ge! flowa of 134 kcfs III Priest Rapid$ in May II
• Moot min imum e!evation of 1 ,240 feet In May
• No refill target a/ 1,240 teel ln May
• Maintain 1,285 leet June-$ept; minimum 1,220 leet feBt of year
• NI;I May-June flow larget
If1514tffiHfu2$tis :2c. ~1 :~gFtI¥U • Storage of water for flow augmentation from January through April
• Supplemenlat releases (In c0njunction with upstream projects) 10 provide up 10 3 MAF addHlonaJ (above Waler Budget) now augmentation In May and June, based on sliding scslelor runoff forecasts
• System flood control space shifted from Bi"owniea, OwOfshak
• Operata to ef'ld.ol.month elevation targels, as follows:
1,288 Sap.-Nov
1,287 Dec.
1,270 Jan.
1,260 Feb.
1,270 "0<-1,272 Apr. 15
1,275 Apf. 30
1,280 "oy 1,288 Jun.-Aug.
• Contribute, in conjunction with upstream storage projecls, up 10 4 MAF for acIdlIlonai now augmenlallon
• Operate In summer to provide now augmentation walef aod meet down· stream flow targets, but dfart no lowerlhan 1,280 leet
• Meet flood COnlroi rule curves only when Jan.-June runoff for8-cast exceeds 68 MAF
SOS 1 SOS 2 SOS :l
• Meet May-June floW targets JJ
• Maintain minimum nowl to meet Vemne Bar Agreemeol"
• No May f\ow tarQ8t
• Meet Vernita Bar AgreMlent
Operate as InSOS la Operll. as ... SOS ,.
flfJ!liFE~H!ilifJii:il Operate alln SOS la
11 Aow~ .... ~ --0- Mth --...t.-.d hoIidey IbM no __ .,.., 80 ~ f:A fl-.0YIiII" ~:I dep. 2J 55 kcfa cUi"" '-"Y Iocod hour-. October 1:1i 10 November 30; ~um Instan1Ineoua fIDw 70 k .. [loocember 10 April
KAF .. 1.234 mllioro oubIa m.... MAF .. 1.234 bi:lian cd»o m ...
F1NALEIS 1995
•
•
•
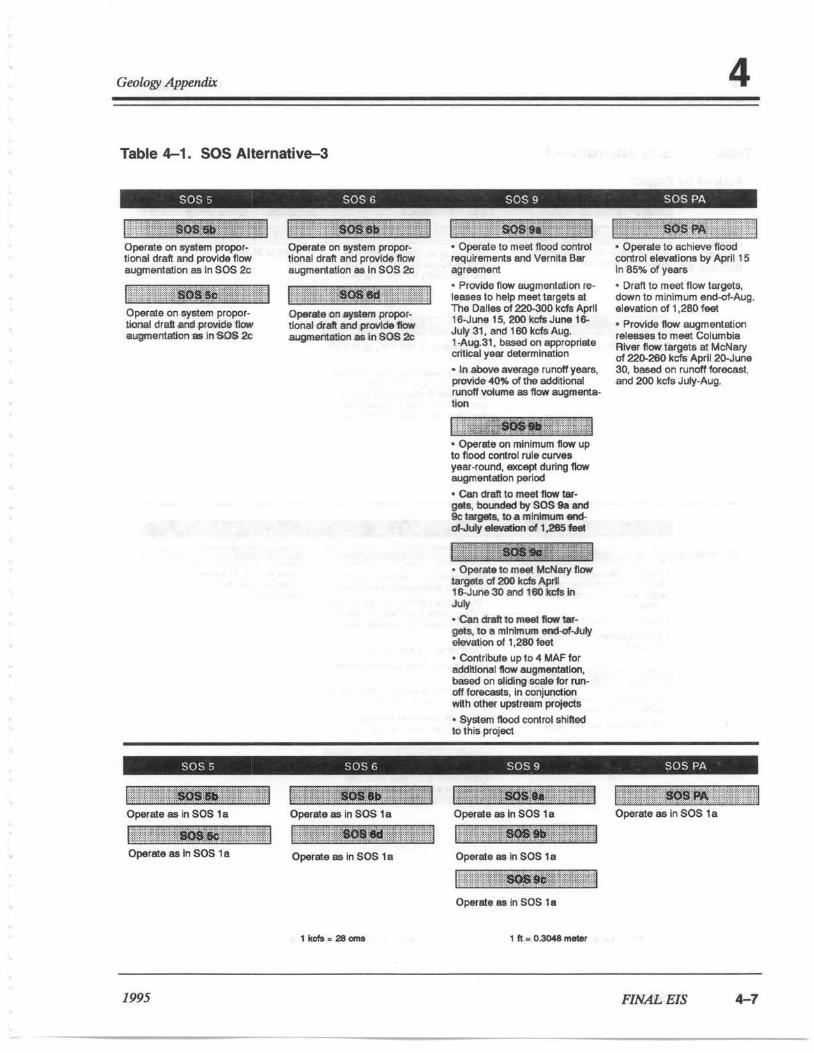
Geology Appendix 4
Table 4-1. SOS Alternative-3
SOS "> SOS 6 50S 9 SOS PA
Operate on system proportknaI draft.-nd provide flow augmentallon _ ln$OS 2c
I ~E01~.8!la"15':j1l a Operate on system propor_ tional draft and provide flow augmentation as In SOS 2c
li ;illffiH4~,~ ri¥lt~~!'H Operale on aystem propor· tlonal draft and prOllidtilloW augmentation _In SOS 2c
<it ' ' : ~ , ? , " 8>'"flfitd l :Ct" .. , , ,,~.$Q$;'.L~w ' ,. "\ c _
• Operate to meet 1I00d control requlremerts and Vernita Bar agreement
• Provide flow augmoolalion releeseslo help meet targets at The oalt .. 01220-300 kcfs April 16·June 15, 200 kcfs June 18-Ju.,. 31 , and 160 kcfs Aug. l -Aug.31. based on appropriate crillcal year determination
• In above aVlII"age runoft' years, provide 40"- of 1M additional runoff voMJme as !low augmentation
1,;j~M!i51lEi:tI • Operate on minimum lIow up to flood control rule CUIV8tl year-round, except during flow lllU9"'entation period
• Can dra1llo meet flow tar· gels, bolbHId by $OS 9a and 9c targets, to a minimum ..... oI..JuIy eIevaIIon d 1,285 feet
1 :::;lfi,W~illl '!mil • Oper .. to meet McNary now targstG of 200 kcfe AprIl 18..June 30 and 1 eo kct8 In Ju~
• can cntt to meet tIcM targels, 10 e minimum encI-of.JuJy elevation 011,280 teet
• Comrlbule up to" MAF for additional !low augmenta1ion, based on aliding scate for runott forecasts, In conjunction wIIh other upstfum protects
• System 1'IoocI control shifted to this pojact
t,lliIT@iil' .... diL<~" [,,,,~.;...;.. .. ""_; W.$, ~.;,~«w.;.J • Operate to achieve flood control elevallom by Aprt! 15 In 85% of years
• Oren to meet flow targets, down to minimum eoo-of-Aug. el .... atlon of 1,280 lee1
• Provide !low augmenlalion releases to meet Columbia River flow targets at McN8ry of 220-260 kc1s AprII 2O-June 30, based on runolt forecasl , and 200 kcls July-Aug.
50S 5 50S G 50S 9 SOS PA
blftji~~f!? 1~H Operate a& In 50S la Operate as In 50S 18 Open!!e a& In 50S 1 a Operate as In 50S 18
li,[l!!W,~jj,i!lI~i!l! 1 19!!!!BF?i!li!il!tc!i¥~~J11 I r~~!i*t~~~!l!z!Ii!l Operate uln 50S 1a Operate as In 50S 18 Operate as In SOS 18
lI,br~~'!iOI!i'~jjii1!.~ Operate 81 in SOS Ie
1 It _ 0 .304& rn.-
1995 FlNALE1S 4-7

4
Table 4-1. SOS Alternative-4
Actions by Project
Geology Appendix
50S 1 50S 2 50S ..
SNAKE RIVER ABOVE Normal 1990-91 operations; 1"10
BROWNLEE WaJllf Budget ~ Release uplo 427 KAF (190 KAF AprN 18-J1SIEI15: 137 KAF Aug. ; 100 KAF Sept.j l or 1Iow augmBrl:a!Jon
Same 89 SOS la • Release up 10 427 KAF, as In SOS
'" • A~. additional wale, obtained by purchaM 01 othllr mNl1S.,d shaped pel' Raclamallon releases and Brownl_ drllft requirement,; arnulation l1811Umed 927 KAF avail.bIo
Seme as sas , .
50S 1 50S 2 50S ..
BROWNLEE IUILlilllililiiiiiIMGr&R • orllft aa needed (up 10 110 KAF In May) for Wirier Budget. baNd on target flows of 85 kc1a at LaNeI' Granite
o Operate per FERC IIceo8e
• Provide system "oed concrol SlOI'.... poco
• No mIIXImLMTI flow res\riclion from mid-Del. to m l(t.NQv,
• No titan limit; no re1lll tllfget
FlNALElS
Same as $OS I. excep! fof addf. tlonal1low augmenlallon as 1d1oWs:
• Draft up 10 137 KAF In July, bU: nee drafting below 2,0871eel; renll from the Snake RIver above Brownlee .... ....... • Oran up to 100 KAF In Sept.
• Shift system flood contral to Grand eou .. • P rOYlde 9 kcta or 1_ n November; fill Pfoject by end CJI month
• Maintain November monltiy_age flow December Itwough April
Sam.- as SOS 2&, plu. paM eddj. t lonal1low augmentlllion re1eages from upstream projects
l!lr~ll!tl!!l\lli!ljJ Same 81 sas ' .except slightly dlfterenl ftood control rule eurvee:
1995
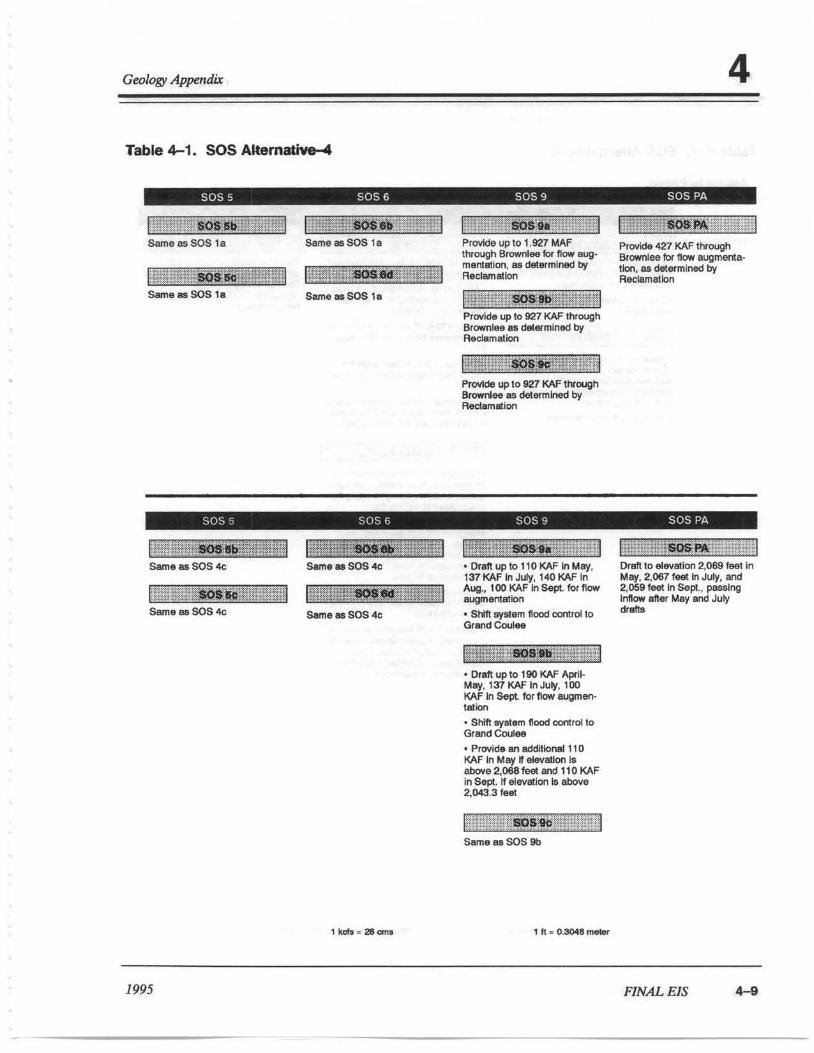
•
Geology Appendix 4
Table 4-1. SOS Alternalive-4
50S 5 SOS 6 50S 9 50S PA
Same. 50S 1. s.me.SOS 1.
Same as $OS 4c: Same. SOS 4c:
[§j!ij\;ill~H1!TI~§q l!jjjjjllilji!ggw¥Mi] Same lIS $OS 4c Same _ SOS 4c
I kcb . 280m.
1995
Prcr.1de up to 1.927 MAF through Brownlee for ttow augmenl8lion. 88 delermlned I:¥ Reclamation
~'Il!.~!OO Provide up to 927 KAF through Brownlee aa determined by R&elamation
lilllll!m!!!t.-9;'li!iill!!la PrOY\de up to 927 KAF tlWough Brownlee as del8I'mned by Reclamation
liHmliM!liJiimliiiIDl • Draft up to 110 KAF In May. 137 KAF In Juty. 140KAF In Aug., 100 KAF In Sept. for f low augmentation
• Shift syBlem flood control to G,,"'" CoUee
• Draft up to 190 KAF AprIlMay. 137 KAF InJu~. 100 KAF In Sept. for flaw augrT181'1-... "'" • Shltt: system flood oontrol lO Gland Coul ..
• PIOYIde an addilionalll0 KAF In May I elevallon Is aboYe 2,068 feet and 110 KAF In Sept. If elevation 18 aboVe 2,043.3 feel
Sarna al $OS 9b
, It . 0 .3048_
Provide 427 KAF through Brownlee for flow augmentation, 88 determined by R&CIam8llon
Draft to air/.ion 2,069 feet in May, 2,067 feel In July, and 2.0591eet In Sept .• passlng Inflow after May and July
"' ....
F1NALE1S 4-9

4 Geology Appendix
Table 4-1. SOS Allernaliv~
Action. by Project
50S 1 SOS 2 50S 4
OWORSHAK Illi,Ni§iii1Hi,\!o's;ijijt,jJji!E;!ilmY
4-10
• Dran up to 600 KAF In May to rneel Water Budgetlarg&! flows 01 85 kcts at Lower Granite
• Provide system l lood corlIrolslorage space
• Meet minimum projllCl flows (2 kcts , a_cepllOf 1 kcts in August); summer dJatt limits; maximum dischafge requirement Oct. to Nov. (1.3 kcb plus inflow)
• No Water Budge! releases
I«F . 1.23<1 million cut>;o motors
FINALEIS
Same as SOS l a, plus the following aupplemertal releasee:
• 900 KAF or more Irom April 16 to J"ne IS, depending on runoff lore· cast at Lower Granlle
• Up 10 470 KAF above 1.2 kcfs mini· mum release from June 1610 Aug. 31
• Maintain 1.2 kcls dis<:herge Irom Oct. th rough Apr il, uI'Il_ higher Iequired
• Shift system IIood COnlroilO Grand Coulee Aprihluly if runoff forecasts al Dworshak are 3.0 MAF or less
• Operale on 1.2 kc1s minimum discharge up 10 flood control ruto curve, e)CcepI when providing lIow augmen· tRlion (April 10 to July 31)
• P/Oykle flow 8I.IQITler481ion 011.0 MAF plus 1.2 kcts minimum discharge, or 927 KAF and 1,2 kcfs, from AprUlo-June 20, based on runoff forecasts, to meet Lower Granite now lerget of 85 kcfs
• Provide 470 KAF from June 21 to July 31 10 meel Lower Grenite 'low larg81 01 50 kcfs
• Drelt to t,520 feel elter volume Is expended, il Lower Gr8llile flow 181'gel Is no! met; If 'Iolume is nOl expended, drelt below 1,520 feel until volume 1$ expended
EIe'lllllon largels emeblished IOf each month: 1,5991801 Sepl.-Oct. ; ~ood control rule CUf'les Nov. ·Apr~ : 1,595 'eel May; 1,599 'eot June-Aug.;
MAF ~ 1.234 billion cUlic metcn
1995 ,

Geology Appelldix 4
:rable 4-1. 80S Allemlll __
SOS 5 SOS 6 SOS 9 SOS PA
iuil{idJ!4-$OI1Iti3f iit'H\fWM • Operme 10 local flood control rule curve
• No proportional drafllor
"""" • Shift system llood control to lower Snake projfICIS
• PrDYIde Wt!II.ef Budget 1Iow augmantalloo aa In SOS I a
• Oraft10 refl/llower Snake proJods II nall. ... llnflow Is In_. • Op .... e 10 1Iood control during spring
• Re1II In June or J~ and malntaln Ihrougfl Aug1.161
• Draft for pow. produdlon ...... faJl
/995
Iiillt+i.!HiOJt1i!'E!!ill Same as SOS 5b
l.ill~@t:iilliiJ SameuSOS 5b
1?l!'mii'J!l!l ll9s.o;iI#JelJ'\l • Remove from proporllonal draflfor power • Operate to l<X:aIflood control rule CUNes, with syat00l1lood control shifted to Grand eou .. • MBlnlain flow 81 1.2 km minimum discharge, except tor 1I0Dd coolrol or flow 1Wgm1rilltion discharges
• Operate 10 mfItJI Lower Granite flow targets (81. spillway crest) ~ 74 kcfs AprIl I S-June 30, 45 kcfs July, 32 kcfsAugust
• Similar 10 80S Sa, exoept operate to meal now largels 81 Lower Granite ranging from 85 to 140 kefs AptII I8-Jtne 30 and 50-55 kcts In July
• Can draft 10 mHl: flow targall 10 a min. end-of"uly elevation of 1,490 fgeI
IEI¥ll!Ilfijij!/iE • Similar to 50S 9a, except operalelo mHl:lower Granite fIowlarget (at Ipiliway crest) of 83 kcfs AprII"une
• Can draft to meet flow targets 10 a min. end-of"uly eleVation of 1.520 feet
, tt .. 0.3048 molar
If.¥!iiftrd:; ~ .. ~, , '"" :- -n-~~tWl , ~"L?>80$,PA.""."2l
• Operate 00 minimum floW-up to flood control rule CUNe year-round, except during flow eugmentatloo period
- Draft 10 meal flow targots, doWn 10 min. end-d-Aug. eIovation 01 1,520 1881
- Sltdlng.scaIe Snake RiY8f !low targets at lowef Granite of 85 10 100 kcfs AprI 1O-June 20 and 50 to 55 km June 2'-Aug. 31, based on runoff Iorecasts
FINALEIS 4-11
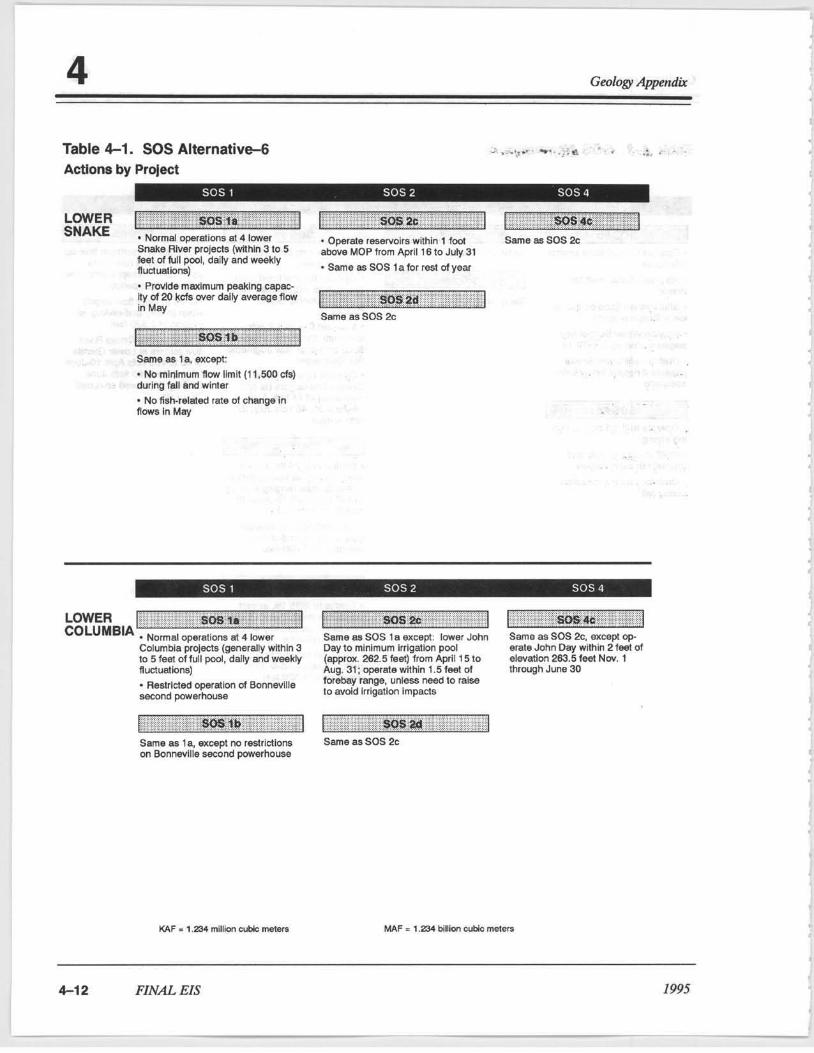
4 Ge%gy Appetrdix
Table 4-1. 50S Allernalive-6 Actions by Protect
.....
50S 1 50S 2 50S 4
LOWER SNAKE
Him; !p2:!i;~sosji§1,"'lt4::i!1 I:'!ili'iii!!'i'!!sos "~b~ifi!l"ii!! 1 [ 'i:!i):ifii'iS<fij;~!lik'!l!i~im • Normal operations at 4 lower • Optlfale festIfYoirs within 1 loot Same as SOS 2<: Snake Alver proJects {within 3 to 5 above MOP from Aptl116 10 July 31 feet 01 lUll pool, dally and weekly ftucluationsj • Same lIS SOS 1 a for rest of year
• Provide maximum peaklno capacIty of 20 kcts r:Nor dally _age flow in May
I f;k1iHili@l~sos;:fi~l¥~:;;tJ Same 8$ la, tUtept:
• No minimum lIow limit (1 1,500 ete) dur ing fall end winte r
• No fiw-relaled fBle of change in nows In May
SOS 1 SOS 2 SOS 4
LOWER Ill! Hiiirmm:,SOIi )" 'jFFi¥''''-M COLUMBIA . Normal opera1iooa III 4 lower
Columbia protects (generally within 3 to 5 faet offutt pool. dally and weekly ftucluatlone)
4-12
• Restricted operation 01 Bonneville IIaCOnd powerhouse
Same 88 la, except no restrictions on Bonnevi lle second powerholJ5e
KA.F _ 1.234 million <:Ubic: IYIIiItenI
FlNALEIS
I !r!lii!j:!ft:j,SOS " i'll"'" ,~,g¥1 SumeasSOS Ie except: lowefJohn Day to minimum Irrigation pool (apprO)(, 262.5 feet) from April 1510 Aug. 31 : operate wilhln 1.5 feet 01 forebay rMge, unless need 10 re!se 10 avoid Irrlgallon Impods
!:g::111itJi:1{1'$O§:W ;1~21E;!ii :;:~I Samo "5 SOS 2c
Some as SOS 2c, excepl op&fiIle John D~ with in 2 feet 01 eIe'IIatlon 263.5 11H11 NOY. f lhlOUgh June 30
MAF • 1.234 bjl ion eutoic moIOfS
1995
J

•
Geology Appendix 4
Table 4--1. SOS AllernativtHi
SOS 5 SOS 6 50S 9 SOS PA
Ig~~'tml • Dratl 2 leet per day Bt8fl/ng Feb. 18
• Opel'ate III natural rIveIl8"IeI, approx. 95 to :1 15 ft OOIow full pool. Api IS-Aug. 31 ; drawclown leVels by project as lonaws. In !eet
Lower Granite 623
Uttle Goose 524
L Monumental 432 Ice Hartior 343
• Operate within 3 10 5 11 of full pool rest at year
• RefiM from f'Il(wai flows and storegereIeeHs
I_~--Same as SOS Sb, except drawdowns are permanent 00<:$ natural river levels leached; no refill
Sama all SOS 2, excepl operate John Day within 1.5 feet above alaYatlon 2!!i11aat (MOP) from May 1 through Aug. 31; earna all SOS 2c rast of yaar
Same as 50S 5b
1995
IlfrJllm"'m;J!@ijjiYIiI • Orllft 2 fHl per day starting APflll
• Opel'al. 33leet below fIA pool AprI11B-Aug. 31 ; drawdown levels by projecl as follows, In feel:
Lower Gran~. 705 UtIle Goose 805
L Monumern.l 507 Ice Harbor 407
• Operala 0Y8f S-foot loreb8y rW\ge once dr_· down elevallon reached
• Re1IM1rom nalural1kwrls and stOfago r-...n • Same as SOS hunt
"'" ~ • OrBll l ow..- Granite 2 feet per day star1ing AprIl 1
• Operate Lower Granite near 705 fI tor 4 1/2 monthe, April IS-Aug. 31
Samaas SOS 5
1 kcfs .. 28 CIM
fllrtlililll!iTIEif~rw<!li.1 • Operate 33leet below rug pool (see SOS Sb) Aprill ·Aug. 31 to meet L Granite "ow largets (see 0w0r8hak); same as 50S 1. rest of year
• Spill 10 achieve 80180 FPE up to lotal dlS60lYeci gas cap of 120% dally average: &pili cap 60 kefe 81 all project.
!li~_!!!i)_!1lliiiI • Operal. at MOP, with 1 foot fleXIbility ApfIll-AuQ. 31: same ltI SOS 1 a rest of year
• Spill to eel'll_ 90/90 FPE up to Ictal dissolved gas cap of 120% daly average; spill caps range from 18 kcts at L Monumenlal 10 30 kcfll aI L Granite
.!illlh'llMJ~1 • Operate 35 to 451eet below full pool AprIl l-June 15 to meal L Granite flow targets (He Dworshlll!), reOt bot June 30; same as SOS 1a rest ofyoar
• SpIll to eehleve 90180 FPE, as In SOS9b
• Same as SOS 5, except operats John Day w~hln 1 fooC abova elevation 257 feet AprIl 15-Aug. 31
• McNary flow targets as tSesa1bed for Grand Coulee
• Spilito IItChI_ 8OJ8O FPE, upto 100ai dlQO/vecI gas cap of 120% daly average, all derived by sgenclea
• Same as SOS 2, excapl operate John Day III minimum lITigation pool or 262.5 teet with 1 foot 01 f\axlbillty from April 16-Aug. 31
• McNary !low targets III desa1bed for Grand Coulee
• Spill 10 achlava 80/80 FPE, up to total cIIssoIved gas cap of 120% dslly average, a. d6rtved by Corps
1 !illlF'4ii!il~~·ij§jillil!li:'ii1 Same as SOS 9b. excepl operate John Dayal minimum operaUng pool
1 fI.o..3IMe_
• ()pefate at MOP with 1 foot nexlbll~y belween Apr~ 10-Aug. 31
• Refil ttvee lower Snake RlviIr pools efler Aug. 31, Lower GraMe after NOY. 15
• Spill to achieve 80% FPE up to total dIsaolved gill cap of 1 1~12·nour~; apIII caps r.-.ge from 7.5 kct. at L Morunen131 to 25 kcfs alice Harbor
Pool opetallon8 same as 50S 21::, except operate John Day at 257 teet (MOP) yearround, wMh 3 feet 01 flexibility March-Od. and 5 feet 01 flexibility NOY._Feb.
• Spil lo achl_ 80% FPE up to Ictal dissolved 9U cap of 115% 12-hour _ege; apIIl caps range from 9 kefs I!l John Day 10 90 kcf!i at The Dalles
F1NALE1S 4-13

4
4.1 .1 50S l-P'IHOSA Operation
This alternative represents one end of the range of the SOR strategies in terms of their similarity to historical system operations. This strategy reflects Columbia River system operations before changes were made as a result of the ESA listing of three Snake River salmon stocks. This SOS has two options:
• SOS 1a (Pre-Salmon Summit Operation) represents operations as they existed from 1983 through the 1990-91 operating year, including Northwest Power Act provisions to restore and protect fish populations in the basin. Specific volumes for the Water Budget would be provided from OWorShak and Brownlee reservoirs to attempt to meet a target flow of 85 kcfs (2,380 ems) at Lower Granite Dam in May. Sufficient flows would be provided on the Columbia River to meet a largel flow of 134 kcfs (3,752 ems) al Priest Rapids Dam in May. Lower Snake River projects would operate wilhin 3 10 5 feet (0.9 to 15 m) of full pool. Other projects would operate as they did in 1990-91, with no additional water provided from the Snake River above Brownlee Dam.
• SOS Ib (Optimum Load -Following Operation) represents operations as they existed prior to changes resulting from the Northwest Power Act. It is designed 10 demonstrate how much power could be produced if most Oow-related operations to benefit anadromous nsh were eliminated including: the Water Budget; fish spill requirements; restrictions on operation of Bonneville's second powerhouse; and reftll targets for Libby, Hungry Horse, Grand Coulee, Oworshak, and A1beni Falls. It assumes that transportation would be used to the maximum to aid juvenile fish migration.
4.1.2 50S 2-Current Operations
This alternative reflects operation of the Columbia River system with interim flow improvement measures made in response to ESA listings of Snake
.... ,. FINALEIS
Geology Appendix
River salmon. It is very similar to the way the system operated in 1992 and reOects the results of ESA Section 7 consultation with NMFS then. The strategy is oonsistent with the 1992-93 operations described in the Corps' i993 interim Columbia and S11llke Rivers Flow improvement Measures Supplemen· tal EIS (SEIS). SOS 2 also most closely represents the recommendations issued by the NMFS Snake River Salmon Recovery 'learn in May 1994. Compared to SOS 1, the primary changes are additional flow augmentation in the Columbia and Snake Rivers and modified pool levels at lower Snake and John Day reservoirs during juvenile salmon migration. This strategy has two options:
• SOS 2( (Final SEIS Operation- No Action Alternative) matches exactly the decision made as a result of the 1993 SEIS. Flow augmentation water of up to 3.0 MAF (3.7 billion m3) on the Columbia River (in addition to the existing Water Budget) would be stored during the winter and released in the spring in low-runoff years. Dworshak would provide at least an additional 300 KAF (370 million m3) in the spring and 470 KAF (580 million m3) in the summer for flow augmentation. System flood control shifts from Dworshak and Brownlee to Grand Coulee would occur through April as needed. It also provides up to 427 KAF (527 million ml) of additional water from the Snake River above Brownlee Dam.
• SOS 2d (1994-98 Biological Opinion) matches the hydro operations contained in the 1994-98 Biological Opinion issued by NMFS in mid-1994. This alternative provides water for the existing Water Budget as well as additiona1 water, up to 4 MAF, for flow augmentation to benefit the anadromous flSh migration. The additiona1 water of up to 4 MAF would be stored in Grand Coulee, Libby and Arrow, and provided on a sliding scale tied to runoff forecasts. Flow targets are established at Lower Granite and McNary.
In cases such as the SOR, where the proposed action is a new management plan, the No Action A1terna-
1995

Geology Appendix
tive means continuing with the present course of action until that action is changed (46 FR 13027). Among all of the strategies and options, SOS 2c best meets this definition for the No Action Alternative.
4.1.3 SOS 4-8table Storage Project Operation
This alternative is intended to operate the storage reservoirs to benefit recreation, resident fish, wildlife, and anadromous fish while minimizing impacts of such operation to power and flood control. Reservoirs would be kept full longer, but still provide spring flows for fish and space for flood control. The goal is to minimize reservoir fluctuations while moving closer to natural flow conditions. For the Final EIS, this alternative has one option:
• SOS 4c (Stable Storage Operation with Modified Grand Coulee Flood Control) applies year-round Integrated Rule Curves (IRCs) developed by the State of Montana for Libby and Hungry Horse. Other reservoirs would be managed to specific elevations on a monthly basis; they would be kept full longer, while still providing spring flows for fish and space for flood control. The goal is to minimize reservoir fluctuations while moving closer to natural flow conditions. Grand Coulee would meet elevation targets year-round to provide acceptable water retention times; however, upper rule curves would apply at Grand Coulee if the January to July runoff forecast at the project is greater than 68 MAF (84 billion m3).
4.1.4 SOS 5-Natural River Operation
This alternative is designed to aid juvenile salmon migration by drawing down reservoirs (to increase the velocity of water) at four lower Snake River projects. SOS 5 reflects operations after the installation of new outlets in the lower Snake River dams, permitting the lowering of reservoirs approximately 100 feet (30 m) to near original riverbed levels. This operation could not be implemented for a number of years, because it requires major structural modifications to the dams. Elevations would be: Lower Granite - 623 feet (190 m); Little Goose - 524 feet
1995
4
(160 m); Lower Monumental - 432 feet (132 m); and Ice Harbor - 343 feet (105 m). Drafting would be at the rate of 2 feet (0.6 m) per day beginning February 18. The reservoirs would refill again with natural inflows and storage releases from upriver projects, if needed. John Day would be lowered as much as 11 feet (3.3 m) to minimum pool, elevation 257 feet (78.3 m), from May through August. All other projects would operate essentially the same as in SOS la, except that up to 3 MAF (3.7 billion m3)
of water (in addition to the Water Budget) would be provided to augment flows on the Columbia River in May and June. System flood control would shift from Brownlee and Dworshak to the lower Snake River projects. Also, Dworshak would operate for local flood control. This alternative has two options:
• SOS Sb (Four and One-half Month Natural River Operation) provides for a lower Snake River drawdown lasting 4.5 months, beginning April 16 and ending August 31. Dworshak would be drafted to refill the lower Snake River projects if natural inflow were inadequate for timely refill.
• SOS Sc (Permanent Natural River Operation) provides for a year-round drawdown, and projects would not be refilled after each migration season.
4.1.5 SOS 6-Flxed Drawdown
This alternative is designed to aid juvenile anadromous fish by drawing down one or all four lower Snake River projects to fixed elevations approximately 30 to 35 feet (9 to 10 m) below minimum operating pool. As with SOS 5, fixed drawdowns depend on prior structural modifications and could not be instituted for a number of years. Draft would be at the rate of 2 feet (0.6 m) per day beginning April 1. John Day would be lowered to elevation 257 feet (78.3 m) from May through August. All other projects would operate essentially the same as under SOS la, except that up to 3 MAF (3.7 bil-lion m3) of water would be provided to augment flows on the Columbia River in May and June. System flood control would shift from Brownlee and Dworshak to the lower Snake projects. Also, Dwor-
FINALEIS 4-15

4
shak would operate for local flood control. This alternative has two options:
• SOS 6b (Four and One-half Month Fixed Drawdown) provides for a 4.5 -month drawdown at all four lower Snake River projects beginning April 16 and ending August 31. Elevations would be: Lower Granite -705 feet (215 m); Little Goose - 605 feet (184 m); Lower Monumental - 507 feet (155 m); and Ice Harbor - 407 feet (124 m).
• SOS 6d (Four and One-half Month Lower Granite Fixed Drawdown) provides for a 4.5-nlOnth drawdown to elevation 705 feet at Lower Granite beginning April 16 and ending August 31.
4.1.6 SOS 9-Settlement Discussion Alternatives
This SOS represents operations suggested by USFWS and NMFS (as SOR cooperating agencies), the State fisheries agencies, Native American tribes, and the Federal operating agencies during the settlement discussions in response to a court ruling in the IDFG v. NMFS lawsuit. The objective of SOS 9 is to provide increased velocities for anadromous fish by establishing flow targets during the migration period and by carrying out other actions that benefit ESA-listed species. The specific options were developed by a group of technical staff representing the parties in the lawsuit. The group was known as the Reasonable and Prudent Alternatives Workgroup. They developed three possible operations in addition to the 1994-98 Biological Opinion. This strategy has three options:
• SOS 9a (Detailed Fishery Operating Plan [DFOP]) establishes flow targets at The Dalles based on the previous year's end-ofyear storage content, similar to how PNCA selects operating rule curves. Grand Coulee and other storage projects are used to meet The Dalles flow targets. Specific volumes of releases are made from Dworshak, Brownlee, and upper Snake River to try to meet Lower
4-16 FINALEIS
Geology Appendix
Granite flow targets. Lower Snake River projects are drawn down to near spillway crest level for 4 1/2 months. Specific spill percentages are established at run-of-river projects to achieve no higher than 120 percent daily average total dissolved gas. Fish transportation is assumed to be eliminated.
• SOS 9b (Adaptive Management) establishes flow targets at McNary and Lower Granite based on runoff forecasts. Grand Coulee and other storage projects are used to meet the McNary flow targets. Specific volumes of releases are made from Dworshak, Brownlee, and the upper Snake River to try to meet Lower Granite flow targets. Lower Snake River projects are drawn down to minimum operating pool levels and John Day is at minimum irrigation pool level. Specific spill percentages are established at run-of-river projects to achieve no higher than 120 percent daily average for total dissolved gas.
• SOS 9c (Balanced Impacts Operation) draws down the four lower Snake River projects to near spillway crest levels for 2 1/2 months during the spring salmon migration period. Full drawdown level is achieved on April 1. Refill begins after June 15. This alternative also provides 1994-98 Biological Opinion flow augmentation (as in SOS 2d), IRC operation at Libby and Hungry Horse, a reduced flow target at Lower Granite due to drawdown, limits on winter drafting at Albeni Falls, and spill to achieve no higher than 120 percent daily average for total dissolved gas.
4.1.7 SOS PA-Preferred Alternative
This SOS represents the operation recommended by NMFS and USFWS in their respective Biological Opinions issued on March 1, 1995. SOS PA is intended to support recovery of ESA -listed species by storing water during the fall and winter to meet spring and summer flow targets, and to protect other resources by managing detrimental effects through maximum summer draft limits, by
1995

Geology Appendix
providing public safety through flood protection, and by providing for reasonable power generation. This SOS would operate the system during the fall and winter to achieve a high confidence of refill to flood control elevations by April 15 of each year, and use this stored water for fish flow augmentation. It establishes spring flow targets at McNary and Lower Granite based on runoff forecasts, and a similar sliding scale flow target at Lower Granite and a fixed flow target at McNary for the summer. It establishes summer draft limits at Hungry Horse, Libby, Grand Coulee, and Dworshak. Libby is also operated to provide flows for Kootenai River white sturgeon. Lower Snake River projects are drawn down to minimum operating pool levels during the spring and summer. John Day is operated at minimum operating pool level year-round. Specific spill percentages are established at run-of-river projects to achieve 80-percent FPE, with no higher than 115-percent 12-hour daily average for total dissolved gas measured at the forebay of the next downstream project.
4.1.8 Rationale for Selection of the Final SOSs
Thble 4-2 summarizes the changes to the set alternatives from the Draft EIS to the Final EIS. SOS 1a and 1b are unchanged from the Draft EIS. SOS 1a represents a base case condition and reflects system operation during the period from passage of the Northwest Power Planning and Conservation Act until ESA listings. It provides a baseline alternative that allows for comparison of the more recent alternatives and shows the recent historical operation. SOS 1b represents a limit for system operation directed at maximizing benefits from development-oriented uses, such as power generation, flood control, irrigation and navigation and away from natural resources protection. It serves as one end of the range of alternatives and provides a basis for comparison of the impacts to power generation from all other alternatives. Public comment did not recommend elimination of this alternative because it serves as a useful mile-
1995
4
post. However, the SOR agencies recognize it is unlikely that decisions would be made to move operations toward this alternative.
In the Draft EIS, SOS 2 represented current operation. Three options were considered. 1\vo of these options have been eliminated for the Final EIS and one new option has been added. SOS 2c continues as the No Action Alternative. Maintaining this option as the No Action Alternative allows for consistent comparisons in the Final EIS to those made in the Draft EIS. However, within the current practice category, new operations have been developed since the original identification of SOS 2c. In 1994, the SOR agencies, in consultation with the NMFS and USFWS, agreed to an operation, which was reflected in the 1994-98 Biological Opinion. This operation (SOS 2d) has been modeled for the Final EIS and represents the most "current" practice. SOS 2d also provides a good baseline comparison for the other, more unique alternatives. SOS 2a and 2b from the Draft EIS were eliminated because they are so similar to SOS 2c. SOS 2a is identical to SOS 2c except for the lack of an assumed additional 427 KAF of water from the upper Snake River Basin. This additional water did not cause significant changes to the effects between SOS 2a and 2c. There is no reason to continue to consider an alternative that has impacts essentially equal to another alternative. SOS 2b is also similar to SOS 2c, except it modified operation at Libby for Kootenai River white sturgeon. Such modifications are included in several other alternatives, namely SOS 2d, 9a, 9c, and the Preferred Alternative.
SOS 3a and 3b, included in the Draft EIS, have been dropped from consideration in the Final EIS. Both of these alternatives involved anadromous fish flow augmentation by establishing flow targets based on runoff forecast on the Columbia and Snake Rivers. SOS 3b included additional water from the upper Snake River Basin over what was assumed for SOS 3a. This operation is now incorporated in several new alternatives, including SOS 9a and 9b. Public comment also did not support continued consideration of the SOS 3 alternatives.
FINALEIS 4-17

4 Geology Appendix
Table 4-2. Summary of Alternatives in the Draft and Final EIS
Draft EIS Alternatives
SOS 1 Pre-ESA Operation SOS la Pre-Salmon Summit Operation SOS Ib Optimum Load Following Operation
SOS2 SOS2a SOS2b
SOS2c
SOS3 SOS3a SOS3b
Current Practice Final Supplemental EIS Operation Final Supplemental EIS with Sturgeon Operations at Libby Final Supplemental EIS Operation -No-Action Alternative
Flow Augmentation Monthly Flow Thrgets Monthly Flow Thrgets with additional Snake River Water
SOS 4 Stable Storage Project Operation SOS 4al Enhanced Storage Level Operation SOS 4a3 Enhanced Storage Level Operation SOS 4bl Compromise Storage Level Operation SOS 4b3 Compromise Storage Level Operation SOS 4c Enhanced Operation with modified
SOS5 SOS5a SOS5b
SOS6 SOS 6a SOS6b
SOS6c
SOS6d
SOS7 SOS7a SOS7b SOS7c
Grand Coulee Flood Control
Natural River Operation 1\vo Month Natural River Operation Four and One Half Month Natural River Operation
Fixed Drawdown 1\vo Month Fixed Drawdown Operation Four and One Half Month Fixed Drawdown Operation 1\vo Month Lower Granite Drawdown Operation Four and One Half Month Lower Granite Drawdown Operation
Federal Resource Agency Operations Coordination Act Report Operation Incidental Thke Statement Flow Thrgets NMFS Conservation Recommendations
Bold indicates a new or revised SOS alternative
4-18 FINALEIS
Final EIS Alternatives
SOS 1 Pre-ESA Operation SOS la Pre-Salmon Summit Operation SOS Ib Optimum Load Following Operation
SOS2 SOS2c
SOS2d
Current Practice Final Supplemental EIS Operation -No-Action Alternative 1994-98 Biological Opinion Operation
SOS 4 Stable Storage Project Operation SOS 4c Enhanced Operation with modified
Grand Coulee Flood Control
SOS 5 Natural River Operation SOS 5b Four and One Half Month Natural River
Operation SOS Sc Permanent Natural River Operation
SOS 6 Fixed Drawdown SOS 6b Four and One Half Month Fixed Drawdown
Operation SOS 6d Four and One Half Month Lower Granite
Drawdown Operation
SOS9 SOS9a SOS9b SOS9c
Settlement Discussion Alternatives Detailed Fishery Operating Plan Adaptive Management Balance Impacts Operation
SOS Preferred Alternative
1995

Geology Appendix
SOS 4 originally included 5 options in the Draft EIS. They were similar in operation and impact. In SOS 4a and 4b, the primary feature was the use of Biological Rule CUives for Libby and Hungry Horse reservoirs. SOS 4c also included these rule cUives but went further by optimizing the operation of the other storage projects, particularly Grand Coulee and Dworshak. For the Final EIS, the SOR agencies have decided to update the alternative by substituting the IRC for the Biological Rule Curves and by eliminating SOS 4a and 4b. The IRCs are a more recent, acceptable version of minimum elevations for Libby and Hungry Horse. Significant public comment in support of this alternative with IRCs was received. Similar to SOS 2 above, SOS 4a and 4b were not different enough in operation or impacts to warrant continued consideration.
The Natural River (SOS 5) and the Spillway Crest Drawdown (SOS 6) alternatives in the Draft EIS originally included options for 2 months of drawdown to the appropriate pool level and 4 1/2 months of drawdown. The practicality of 2-month drawdowns was questioned during public review, particularly for the natural river. It did not appear that the time involved in drawing down the reservoirs and later refilling them provided the needed consideration for other uses. Flows are restricted to refill the reservoirs at a time when juvenile fall chinook are migrating downstream and various adult species are returning upstream. The 2 1/2 month drawdown strategies (SOS 5a, 6a, and 6c) have been dropped from the Final EIS. However, 2 1/2 month spillway crest drawdown at all four lower Snake projects is still an element in SOS 9c, so the impacts associated with this type of operation are assessed in the Final EIS.
A new option was added to SOS 5, namely SOS 5c. This option includes natural river drawdown of the lower Snake River projects on a permanent, yearround basis. The Corps received comment on this type of alternative during the review of Phase I of the SCS, a reconnaissance assessment of potential physical modifications for the system to enhance fish passage. Many believe the cost for such modification would be less than that required for periodic, temporary drawdowns, which would require special-
1995
4
ized facilities to enable the projects to refill and operate at two different pool elevations.
SOS 7 Federal Resource Agencies Operations, which included 3 options in the Draft EIS, has been dropped from the Final EIS and replaced with an alternative now labeled as SOS 9 that also has 3 options. SOS 7a was suggested by the USFWS and represented the State fishery agencies and tribes' recommended operation. Since the issuance of the Draft EIS, this particular operation has been revised and replaced by the DFOP (SOS 9a). The SOR agencies received comment that the DFOP was not evaluated, but should be. Therefore, we have included this alternative exactly as proposed by these agencies; it is SOS 9a. SOS 7b and 7c were suggest~d by NMFS through the 1993 Biological Opinion. ThIS opinion suggested two sets of flow targets as a way of increasing flow augmentation levels for anadromous fish. The flow targets came from the Incidental Thke Statement and the Conservation Recommendation sections of that Biological Opinion. The opinion was judged as arbitrary and capricious as a result of legal action, and these operational alternatives have been replaced with other alternatives that were developed through settlement discussions among the parties to this lawsuit. SOS 7b and 7c have been dropped, but SOS 9b and 9c have been added to represent operations stemming from NMFS or other fishery agencies. In particular, SOS 9b is like DFOP but has reduced flow levels and forgoes drawdowns. It is a modification to DFOP. SOS 9c incorporates elements of operation supported by the State of Idaho in its "Idaho Plan." It includes a 2 1/2-month spillway crest drawdown on the lower Snake River projects and several other elements that attempt to strike a balance among the needs of anadromous fish, resident fish, wildlife and recreation.
Shortly after the alternatives for the Draft EIS were identified, the Nez Perce 'fribe suggested an operation that involved drawdown of Lower Granite, significant additional amoUllts of upper Snake River water, and full pool operation at Dworshak (i.e., Dworshak remains full year round). It was labeled as SOS 8a. Hydroregulation of that operation was completed and provided to the Nez Perce 'fribe. No technical response has been received from the Nez
FINALEIS 4-19

4
Perce 1Hbe regarding the features or results of this alternative. However, the elements of this operation are generally incorporated in one or more of the other alternatives, or impose requirements on the system or specific projects that are outside the range considered reasonable. Therefore, this alternative has not been carried forward into the Final EIS.
The Preferred Alternative represents operating requirements contained in the 1995 Biological Opinions issued by NMFS and USFWS on operation of the FCRPS. These opinions resulted from ESA consultation conducted during late 1994 and early 1995, which were a direct consequence of the lawsuit and subsequent judgement in Idaho v. NMFS. The SOR agencies are now implementing this operating strategy and have concluded that it represents an appropriate balance among the multiple uses of the river. This strategy recognizes the importance of anadromous fish and the need to adjust river flows to benefit the migration of all salmon stocks, as well as the needs of resident fish and wildlife species at storage projects.
4.2 SOS 1: PRE-ESA OPERATION
Many observers view SOSs 1a or 1b as a "normal" system operation that provides a frame of reference for more recent or potential future operating changes. SOS 1a represents operations that occurred from around 1983 to 1991, while SOS 1b represents the pre-1983 operation that maximizes power production within normal reservoir operations. Both options correspond to actual conditions that the reselVoir environment has experienced over several years, and can be considered to reflect a "control" level of operations effects. As historical options, they have produced some level of adjustment with the reservoir shoreline. The operation of reservoirs under SOS 1a or Ib would cause continued erosion, mass wasting, sedimentation, and groundwater fluctuations that would be within normal and historical limits.
4.2.1 Shoreline Erosion and Mass Wasting
Bank erosion can have severe consequences on the designed reservoir purposes, including water supply,
4-20 FlNALEIS
Geology Appendix
irrigation, flood control, navigation, hydropower generation, recreation, and wildlife habitat (Hagan and Roberts, 1972; Hodgins et aI., 1977 (in Gatto and Doe». Loss of land along the shoreline is the most evident impact. Structures along the shoreline can be damaged too, as has been documented on reservoirs across the country (Allen and Wade, 1991). The loss of wildlife habitat can be offset by creation of new habitat, such as bank swallow habitat (Beckett, 1978). This occurs through loss of vegetation as well as loss of land.
Erosion -caused sediment is often deposited in the immediate vicinity of the shoreline. This may have several impacts, including increased turbidity and dissolved solids, which in turn affect the amount of light reaching benthic and planktonic animals and plants (Geen, 1974; Barko, 1981). Fish may suffer due to siltation of spawning gravels, disruption of normal reproduction, gill abrasion, and decreasing feeding ability due to decreased visibility. Increased turbidity can lead to decreased aesthetic value of a reservoir, through the suspended sediment itself or by the increased nutrients in the water, which can
. lead to increased algae. Coarse sediments can harm or kill shallow benthic animals and plants by changing the benthic habitat (Avakyn, 1975; Cooper and Bacon, 1980).
Bank erosion can change the effective storage capacity of a reservoir. Total pool storage is decreased by sediment influx from the banks (Van Everdingen, 1967). Furthermore, the increase in surface area from bank recession increases the loss to evaporation, which can change water quality (Baxter and Glaude, 1980).
Under historical pool fluctuations and outflows, the historical patterns of erosion and mass wasting would likely continue. Some areas would experience diminished effects with time, while others would see persistent stability problems. Unexpected increases in erosion might occur in response to external events (e.g., extreme precipitation) or to exceedance of intrinsic thresholds operating in the drainage basin or reservoir environment (e.g., tributary channel shifting and incision due to elongation of its delta), but these are difficult to predict.
1995

Geology Appendix
The lowest existing rates of shoreline erosion are probably on the run-of-river operations on the lower and middle Columbia and the lower Snake. Pool level fluctuations have been minimal and a zone of beach has been able to develop in many places. Minor landslides could be expected to continue, as on Lake Umatilla (Gustafson, 1992). Elevation patterns for these reservoirs would be identical in SOS 1a or 1b for average, wet, and dry years.
Storage projects would continue to experience significant shoreline erosion. Chief among these would be Grand Coulee. Grand Coulee would have an annual draft of about 60 feet (18.3 m) under both options, and the hydroregulation model shows almost identical monthly elevations under both options. Peaking operations would continue to undermine steep banks and expose a wide zone of the shoreline to wave erosion.
There are at least 82 active slides around Lake Roosevelt (Reclamation, 1992); "active" is defined as having moved in the past 10 years. In addition, there are numerous less-active slides. Between 1941 and 1954, approximately 500 landslides occurred along Lake Roosevelt (Jones et aI., 1961). The authors demonstrated a clear relation between PR and landslides, noting that as PR increased, so did the number of landslides. Since there are large sections of shoreline showing no signs of reaching equilibrium profiles, recent levels of landslide activity could be expected to continue for decades under SOS 1.
The effects of landslides along Lake Roosevelt have generally been limited to loss of land. Reclamation has undertaken a program of acquiring or leasing lands that are subject to mass wasting. This has resulted in substantial costs for the maintenance program.
Another effect of the high landslide activity has been that the reservoir is filling with sediment more rapidly than expected. While the total volume of landslide material has not been estimated, significant infilling of the reservoir has occurred in some areas, such as Reed Terrace. The shoreline stabilization efforts instituted in the past might diminish the rate of future sedimentation.
1995
4
Although few studies of the shorelines of Hungry Horse and Libby exist, these reservoirs also experience significant shoreline erosion, due to their large fluctuation in pool elevations and the composition of their shoreline materials. Much of the shoreline at Hungry Horse is in glacial till and alluvium, and significant evidence of erosion can be observed around the reservoir. Draft and refill patterns at Hungry Horse would be identical under SOS 1a and 1b, during the average water year.
Relative to Grand Coulee, however, erosion at Hungry Horse is minor. The total volume of landslides appears to be much less and, considering the large storage capacity of Hungry Horse, the effect on the lifespan of the project is negligible. Furthermore, the reservoir is located in a national forest, so acquisition of private lands has not been necessary.
Under historical operations, minor erosion and mass wasting would continue, with slight shoreline retreat in areas experiencing significant mass wasting. The only significant impact would be increased, localized turbidity during major storms and landslides, which could affect shoreline fish habitat.
Lake Koocanusa has experienced significant shoreline retreat and erosion during its lifespan. In the upstream reaches, in particular near the town of Rexford, aerial photo analysis shows erosion of as much as 10 feet (3 m) per year between 1972 and 1988. Some agricultural land has been lost. The volume of landslide material is unknown; however, its effect on siltation at the reservoir is probably negligible, given the high volume of sediment influx in the Kootenai River.
The shoreline along Lake Koocanusa is very susceptible to the freeze-thaw process due to its relatively high elevation (nearly 2,500 feet [762 m]). Erosion and mass wasting would continue at moderate rates under SOS 1a or lb.
End-of-the-month elevations at Albeni Falls would be the same for both SOS 1a and lb. Continued shoreline erosion and bank recession would occur under these options. The reservoir has experienced as much as 5 feet (1.5 m) of shoreline retreat during a 12-year period (Gatto and Doe, 1983). This is due
FINALEIS 4-21
4
to wave action and partly to freeze-thaw processes due to the relatively high elevation (about 2,000 feet [610 m D and cool climate of the area. The resultant shoreline erosion has caused a number of lawsuits due to private land lost. Additional acquisition of land by the government may be necessary.
Future operation under SOS la or lb would continue the historical pattern of erosion and mass wasting. Some shoreline retreat, attributable to wave erosion, would continue at Lake Pend Oreille. Based on the erosion rate reported in the one applicable prior study, the average rate of shoreline retreat would likely be about 0.4 feet (0.12 m) per year. Localized conditions such as bedrock ledges could limit or prevent further shoreline retreat in some areas. Comparable information on erosion rates is not available for the other storage reservoirs. Most of the erosion in these reservoirs occurs in the drawdown zone below the full-pool elevation and is not readily evident or easily studied. Mass wasting, which is more evident, would likely continue at the same or slightly decreasing rate.
Dworshak would experience identical pool level changes under both SOS la and lb during average and wet years. During dry years the only difference would be in August, when the pool elevation would be about 1,560 feet (475.5 m) with SOS lb and 1,420 feet (432.8 m) with SOS la. Drafting would occur more rapidly during dry years at the end of August under option lb, indicating greater potential for slope failure along the reservoir shores. Because this would occur only during dry years, the overall increase in shoreline erosion would be relatively small.
The initial period of operations at Dworshak resulted in documented slides along about 13 miles (8 km) of shoreline (Gatto and Doe, 1983), which is about 10 percent of the total shoreline length. The authors believed that daily fluctuations in pool level of up to 5 feet (1.5 meters) during drafting and refilling periods contributed significantly to landslides. Similar patterns of mass wasting would continue under SOS la or SOS lb.
4-22 FINALEIS
Geology Appendix
The total volume of landslides around Dworshak Reservoir is small relative to Grand Coulee. The amount of decrease in reservoir lifespan is probably negligible. Thus, the only tangible effects of shoreline erosion would be localized increases in turbidity during storms and landslides.
Brownlee experiences significantly less draft than other reservoirs. The annual draft would remain the same under SOS la or lb. Brownlee has experienced significant mass wasting and erosion (BPA, 1985) under historical operations. This would continue at the same rate or a somewhat decreased rate. The overall impact would generally not be significant. One exception is the potential for a landslide blocking the Powder River (BPA, 1985). This would create a lake upstream, inundating the floodplain.
Available information indicates that the run-ofriver projects have generally experienced only minor amounts of shoreline erosion and mass wasting. This is primarily the result of relatively stable pool levels, and because riprap shoreline armoring has been placed in many locations that would otherwise be subject to erosion or mass wasting. Among the run-of-river projects, several low-angle slides have been documented at John Day (Gustafson, 1992), but shoreline erosion does not appear to be significant. Current erosion and mass wasting patterns, such as the minor landslides at John Day, would continue at the run-of-river projects under SOS la or lb.
4.2.2 Sedimentation
Reservoir sedimentation, being predominantly controlled by catchment processes, would be affected slightly by this alternative. Present reservoir sedimentation rates would continue and reflect the magnitude of erosion and transport occurring in the catchment. Wave erosion would continue to be the dominant contributor to sediment redistribution in the reservoirs. However, because option lb would increase the drafting rate at Dworshak during some years, a slight increase in turbidity would occur, adding slightly more sediment downstream at Lower Granite.
1995

Geology Appendix
Under SOS 1a or 1b, long-term adjustment to reservoir and shoreline processes would continue and slowly decrease in magnitude as shorelines approach equilibrium profiles. This process varies greatly. At a minimum, with static shorelines, it would take 5 to 10 years (Kondratjev, 1966). With fluctuating shorelines, even if the annual fluctuation is only a few feet, adjustment would take much longer. It is difficult to quantify this length of time without detailed, site-specific surveys of shoreline materials, wind, and boat activity at each reservoir. Shorelines of storage reservoirs take longer to adjust due to their variable pool levels.
4.2.3 Groundwater
Under options 1a and 1b, groundwater fluctuations near system reservoirs would remain within historical limits. These fluctuations are slight variations of the water table near run-of-river projects (lower and middle Columbia, lower Snake). Greater fluctuations of the water table would likely occur near storage reservoirs (Hungry Horse, Libby, Albeni Falls, Dworshak, Grand Coulee, and Brownlee). These fluctuations vary in nature depending on the reservoir and surrounding aquifers, but have been occurring since the dams began operating. At reservoirs situated in permeable, unconsolidated material, such as Hungry Horse, the water table fluctuates directly with the reservoir level (Simms and Rorabaugh, 1971).
Under both options, spring and early summer water table levels near Libby Dam would be a maximum of 50 feet (15.2 m) higher than under SOS 2c. At Hungry Horse, the water table would be only a few feet higher during this time. Near Dworshak, February water table levels would be a maximum of 60 feet (18.3 m) lower than under SOS 2c, while spring water levels around Grand Coulee would be somewhat lower.
Water table fluctuations would be greatest near the reservoir shorelines in all cases, and would rapidly decrease in magnitude away from the reservoir. Water and pressure levels in wells that are very close to these reservoirs could be reduced somewhat on a seasonal basis.
1995
4
4.3 SOS 2: CURRENT OPERATIONS
4.3.1 Shoreline Erosion and Mass Wasting
For most reservoirs, current operations instituted in response to the ESA listings are the same as or a minor departure from historical operations. Therefore, erosion and sedimentation would remain within historical ranges systemwide and for most of the projects. In other cases, long-term continuation of current operations would cause differences from historical conditions, as summarized below.
Because of their small fluctuations in pool elevation, the Bonneville, The Dalles, and McNary run-ofriver projects would have minimal shoreline erosion with both SOS 2 options, and would be at about the same rate as under previous operational plans (SOS 1a). Lowering the pool at John Day to near elevation 262.5 feet (80 m) for several months each year could accelerate movement of an existing landslide west of Alderdale on the north shore (Gustafson, 1992). It would also cause a short-term increase in surface erosion from the newly - exposed areas. Isolated, sporadic mass movements would continue on other reservoirs. On the lower Snake reservoirs, up to 5 feet (1.5 m) of shoreline would be continually exposed during late spring and summer, as a result of operating near minimum operating pool (MOP). This would make the unconsolidated sediments in these areas temporarily subject to storms, and thus wave and overland flow erosion. This would result in a minor, short-term increase in overall erosion at these projects.
Storage reservoirs experience much greater amounts of shoreline erosion and mass wasting than run-ofriver reservoirs. Total annual drafting would remain within the historical range on all reservoirs. However, drafting would be at a somewhat faster rate at certain times of the year particularly at Libby. The hydroregulation model results indicate the drafting rate would average 0.7 feet/day (0.2 m/day) from February to March with SOS 2c; this rate is slightly faster than at any time during the average water year under the previous operating pattern. As a result of more rapid drafting, the time it takes the shorelines of the reservoir to reach the equilibrium profile
FINALEIS 4-23

4
would be increased somewhat with long-term operation under SOS 2c.
Current operations (SOS 2c) continued over the long term would accelerate erosion slightly at Brownlee relative to historical conditions, due to a minor increase (less than 10 feet [3.04 mD in PRo The slight increase in the rate of drafting might also lead to a minor increase in mass wasting. Overall, however, shoreline erosion at the storage projects would remain within historical ranges. Shoreline erosion at Hungry Horse and Grand Coulee would decrease slightly, while erosion at Dworshak could decrease significantly.
With the exception of Grand Coulee and Brownlee, storage reservoir operations and resulting impacts would be essentially the same under SOS 2d as SOS 2c. At Grand Coulee, the SOS 2d would decrease PR by 5 feet (1.5 m). This would decrease shoreline erosion slightly by exposing significantly less material. At Brownlee, two small additional draft/refill cycles would occur each year, with an 8-foot (2.4-m) draft/refill in July and a 22-foot (6.7-m) draft/refill in October. This could increase shoreline erosion and mass wasting significantly. The shoreline would be subjected to much more wave action and slumping.
4.3.2 Sedimentation
A slight increase in reservoir sedimentation and transport of suspended material out of the reservoir environment might accompany the minor acceleration of erosion with this alternative. Reduced travel time (greater velocity) through reservoirs would reduce the amount of particulates that might settle out. Unless travel times were reduced throughout the river system, any decrease in sedimentation in a single reservoir could be negated by increased sedimentation in downstream reservoirs where operations were not altered. This situation could occur in McNary, where operations would be unchanged but velocity through the lower Snake River projects upstream could increase somewhat. This may be viewed as a reservoir-by-reservoir redistribution of sediment.
4-24 FINALEIS
Geology Appendix
Generally, only minor increases in sedimentation (redistribution) would occur with this alternative. Localized degradation of the river channel might occur if the travel time reduction goal is met. Any additional sediment escaping reservoirs would be only in the silt and clay sizes, and would result in a slightly higher turbidity in late spring. This operation would have a negligible impact on systemwide sedimentation.
However, at Brownlee, under SOS 2d, an increase in sedimentation related to shoreline erosion would occur.
4.3.3 Groundwater
Local groundwater gradients near affected reservoirs would respond to reservoir pool fluctuations associated with SOS 2. Groundwater conditions would remain within historical ranges for run-ofriver dams. The aquifers surrounding storage reservoirs would experience slightly greater fluctuations in levels during the spring and summer months than under previous operations, particularly at Libby and Brownlee. Although Dworshak pool elevations would fluctuate greatly (up to 155 feet [47.2 m] total yearly, as in the past), the surrounding rocks are mostly consolidated and have a low conductivity. Therefore, except in delta areas, the aquifer surrounding the reservoir would not respond quickly or completely to changes in pool level.
Both options would have the same effects on lower Snake River reservoirs, which would operate within 1 foot (0.3 m) above MOP during late spring and summer. The difference between MOP and full pool is small (3 feet [0.9 m] for Ice Harbor and Lower Monumental,S feet [1.5 m] for Little Goose and Lower Granite). Because this is such a small change, and because the affect on the water table would decrease rapidly away from the reservoir shoreline (Corps, 1992), the effect of SOS 2 on groundwater in the lower Snake River reach would be negligible.
Only wells very close to the reservoirs would be affected, and these would only experience a few feet of water level drop during the late spring and summer. It is unlikely that any wells would go dry under
1995
Geology Appendix
SOS 2, as the wells most likely are screened across a depth interval large enough to accommodate existing water table fluctuations.
Similarly, only groundwater wells very close to John Day Reservoir would be affected by the maximum 5.5-foot (1.7-m) drop relative to typical maximum summer elevations. These wells might suffer a slight decrease in production. It is unlikely that they would go dry, because the resultant change in water table would be within historical conditions under which the wells have been operated.
4.4 SOS 4: STABLE STORAGE PROJECT OPERATION
4.4.1 Shoreline Erosion and Mass Wasting
In general, SOS 4 would result in a system -wide decrease in erosion and mass wasting compared to current or past operating patterns. This would be particularly true for the storage reservoirs, where the depth of annual drafts would generally be reduced and pools would be subject to less fluctuation.
SOS 4 would generally reduce shoreline erosion and mass wasting.
At Libby, the annual draft would be reduced by over 50 percent. This would result in a significant decrease in shoreline erosion and mass wasting potential. The pool elevation would not go below about 2,393 feet (729.4 m) with this option.
At Albeni Falls, the total draft in most years would decrease from about 11 feet (3.4 m) to 5 feet (1.5 m); every sixth year the pool would be drafted to previous levels. Overall, shoreline erosion and mass wasting potential would be somewhat reduced compared to historical conditions.
At Grand Coulee, winter drafting would start in January, and achieve lowest pool elevation by March instead of late April. The pool level would have a total yearly change of 28 feet (8.5 m) on average. The reservoir shorelines would continue to experience mass wasting and wave erosion, but not as much as under current operations, which involves a 50-foot (15.2-m) average annual draft. A short
1995
4
cycle of refilling/drafting would be added in March. However, its impact on shoreline erosion would be minimal, as this fluctuation would average only 5 feet (1.5 m). Pool levels would be similar to present conditions during summer and fall.
Brownlee Reservoir would experience erosion and mass wasting impacts within the historical range.
Dworshak pool fluctuations would generally be decreased. This would decrease erosion and mass wasting potential slightly.
Lower Snake and Columbia River reservoirs would generally be operated in SOS 4c as they are currently, and therefore the impacts would be the same as under SOS 2c. The exception is John Day, which would be operated slightly lower (about 1 foot [.3m]) than historically, causing a temporary decrease in shoreline erosion. The effect on mass wasting and erosion potential would be negligible.
4.4.2 Sedimentation
Based on the shoreline erosion and mass wasting conclusions presented in Section 4.5.1, identifiable changes in sedimentation patterns would likely be limited to minor decreases in sedimentation at Libby and Hungry Horse. The total sediment input would not decrease, but the yearly redistribution of delta sediments lower in the reservoirs would be reduced, due to the decrease in total yearly drafting. Over the long term, this effect could increase the life spans of the reservoirs somewhat.
Downstream of Hungry Horse, the minor increase in spring outflows could cause minor degradation in some reaches of the Flathead River. Outflows from Libby would be altered somewhat, but would remain within the magnitude of flows experienced under historical operations.
Spring outflows at Dworshak would be twice as great as under historical conditions for a typical year. This would result in incision and/or lateral erosion of material deposited in the reach between Dworshak Dam and Lower Granite Reservoir since Dworshak was completed. The erosion would likely be shortlived, and would result in increased sedimentation of
FINALEIS 4-25

4
Lower Granite for the first few years of the new operation. Sedimentation would then gradually decrease, approaching historical conditions.
4.4.3 Groundwater
Operating the system according to SOS 4c would have little effect on groundwater in most locations and would reduce groundwater fluctuations near some projects. Fluctuation in the water table near Hungry Horse would be reduced by up to half. The water table near Libby (Lake Koocanusa) would experience significantly less fluctuation. Effects on aquifers in glaciofluvial deposits around Lake Roosevelt would be limited to a slight shift in the timing of seasonal fluctuations. A slight decrease in the amount of drafting at Albeni Falls and Dworshak would lead to smaller fluctuations in aquifers hydraulically connected to these reservoirs. Groundwater conditions near the run-of-river projects would be essentially the same as at present.
4.5 SOS 5: NATURAL RIVER OPERATION
As discussed in Chapter 3, reservoir shoreline erosion and mass wasting were studied in coordination with the water quality analysis. SOS 5 differs significantly from the previous alternatives in the magnitude and location of change in reservoir operation. Natural river operation would expose almost 20 years of accumulating sediments to erosion and would cause a large pulse of water to flow down the lower Snake and Columbia Rivers in the spring.
4.5.1 Shoreline Erosion and Mass Wasting
Erosion in the lower Snake reservoirs would be extensive with SOS 5. Overland flow erosion, wave erosion, mass wasting, and tributary incision would increase as pool levels decreased, due to the increase in surface area exposed. Most reservoir sediment previously deposited on the shorelines would eventually erode. The amount of sediment that would be eroded from Lower Granite alone during the first year is estimated at about 900,000 cubic yards (688,140 m3) with SOS 5b. In comparison, the current average annual influx of sediment to Lower
4-26 FINALEIS
Geology Appendix
Granite is 3 million cubic yards (2.3 million m3)
(personal communication, Les Cunningham, Hydrologist, Corps of Engineers, Walla Walla District, 1993).
The shoreline erosion model analysis predicted that the most significant source of erosion would be waves, followed in order by slumping, incision, and surface erosion. This is consistent with results from the March 1992 drawdown test, during which there were no significant storm events yet waves still managed to cut small terraces in the unconsolidated sediments.
Incision of tributary deltas would accelerate as pool levels were lowered with SOS 5. On tributary fans, incision, headwall advance, and channel widening by bank collapse would add substantial eroded material to the natural river channel. nibutaries, either through baseflow or storm runoff, would incise through the unconsolidated reservoir sediments. Incision might cut through pre-reservoir coarse sediments, as it did during the 1992 drawdown test. This might be a result of the saturation of these materials, which makes them less cohesive and more subject to erosion.
Channel erosion in the reservoir sediment would work its way upstream. Knickpoint channel incision could cause significant impacts to structures along the reservoirs by migrating to the foundations of bridge abutments or embankments. The areas subject to the greatest amounts of incision would be the tributary areas, such as Alpowa Creek on Lower Granite, Deadman Creek on Little Goose, and the Palouse and Thcannon Rivers on Lower Monumental.
Drawdown would reduce the pool level faster than groundwater could drain from surrounding areas. This would create pore water pressures that could exceed the shear strength of bank material and result in the liquefaction of sandy materials and slumping and sliding in finer materials. This process would vary with the character of the deposit and the rate of drawdown. The 1992 drawdown test of Lower Granite showed that this process damaged structures, such as road and railroad embankments, levees, and docks and other port facilities along the reservoir. Slumping would occur in surficial deposits (both pre- and post-reservoir) and in fill. Slump-
1995

Geology Appendix
ing could damage some reservoir facilities, and might be accelerated by storm events.
Under typical climatic conditions, shoreline erosion with SOS 5b would decrease rapidly after the third year. Predicted total erosion would be 520,000 cubic yards (245,000 m3) after the third year and 240,000 cubic yards (183,500 m3) after the sixth year. Sediment input from the shoreline would continue at a low rate for several decades after that. The amount of sediment passing the dam each year would eventually be approximately equal to the sediment input from upstream.
SOS 5c would result in a similar pulse of sediment for the first year, followed by a rapid decline in erosion. Since the pool level would not rise again after the drawdown, no further wave erosion would take place, so the first year's erosion would be somewhat less than under SOS 5b. Additionally, most slumping and sapping would occur during the first two years, and the shorelines would gradually stabilize. Surface erosion could be significant during the first and second wet seasons following drawdown. However, revegetation efforts could ameliorate most of the surface erosion after the first wet season. Overall, the total shoreline erosion under SOS 5c is estimated to be significantly less over the long term than under SOS 5b, although the short term effects include major erosion and sedimentation compared to current operations.
Although the specific quantitative analysis was carried out for Lower Granite Reservoir, these results can be broadly extrapolated to the other lower Snake dams. The main difference between Lower Granite and the other dams is that the Clearwater and Snake River deltas in Lower Granite are much larger than the deltas at the lower three dams. Lower Granite has been trapping sediment above the other reservoirs during much of their operation, and the Clearwater is much larger than the tributaries entering the other Lower Snake River projects. Thus, more sediment would be mobilized from Lower Granite than the other dams. The Palouse River embayment on the Little Goose reservoir would also be a major producer of sediment.
1995
4
Based on the amount of sediment eroded per mile, the other three reservoirs would contribute about 2.5 million cubic yards (1.9 million m3) of sediment during the first year under option 5b. This number should be viewed as a conservative maximum, as the sediment volume available is actually much less due to the trapping of sediments by Lower Granite Dam. Erosion would be significantly less under option 5c. Annual erosion from the three other reservoirs would decrease more rapidly than at Lower Granite. Within 5 to 15 years, the amount eroded would decrease to the yearly influx of sediment to the reservoirs.
The 1992 drawdown test showed that levee embankments were generally not susceptible to damage from lowered pool levels (Corps, 1993). Their construction prevents differential stress from building up across their width. Road and railroad embankments are more susceptible to movement, however. During the 1992 test, extensive movement occurred, as evidenced by cracks in pavement up to 15 inches (380 mm) wide, raised areas, and guardrail displacement. More widespread damage would occur with a natural river drawdown, although the severity of damage would probably not be much greater than in 1992. Railroad embankments also would suffer. Some track misalignment occurred in 1992, slowing train traffic for a period. Damage would most likely be widespread under SOS 5, as the entire length of train tracks along the lower Snake would be subject to differential settlement. Embankment damage would be similar under both 5b and 5c, as the damage would most likely occur during initial drawdown.
During 1992, extensive mass wasting occurred at the Port of Clarkston, Red Wolf Marina, Nisqually John Landing, Offield Landing, Port of Wilma, and other places, mostly on the south shore of Lower Granite and Little Goose Reservoirs. More activity could be expected at these and additional locations under SOS 5b or 5c. Damage could be more extensive under SOS 5b due to the longer period of exposure, and the increased chances of a large storm occurring during a drawdown. Repairs to roads, embankments, marinas, and port facilities would likely be expensive. Damage to embankments and port
FINALEIS 4-27

4
facilities would also occur on the other lower Snake reservoirs.
Under SOS 5b, on an annual basis, erosion would peak each year at the beginning of drawdown, taper off toward the middle, and then rise slightly as the reservoirs refilled. Sediment redistribution would occur as coarser particles moved lower in the reservoirs. Mter repeated drawdowns, a coarse lag deposit would develop on some of the Snake River shoreline as transportable particles were removed. Lag deposits would be most developed in the alluvial fan areas of small tributaries, which are numerous along the lower Snake River. Such annual effects would not occur under SOS 5c, after the first few years.
Compared to current operations, the only other reservoir affected under SOS 5 would be John Day. The expected impact to the John Day project would be minor. A study conducted by Gustafson (1992) indicates that there is "a very low probability of serious [stability] problems occurring during prolonged drawdown to 257 feet (78.3 m)." The rate of movement of the "slide #1" on the Washington side would increase slightly; this could damage Washington State Route 14, which passes near the top of the slide. Gustafson also indicates that drawdown to 257 feet (78.3 m) would not cause significant shoreline erosion.
Conditions at the storage reservoirs under SOS 5 would generally be similar to those reported for SOS 1. Compared to historical conditions, differences among the storage projects would generally be in the range of 5 to 10 feet (1.5 to 3 m). PR at Dworshak would be 20 feet (6.1 m) lower, and would decrease erosion and mass wasting potential.
4.5.2 Sedimentation
SOS 5b or 5c would likely cause significant changes in sedimentation in the lower reaches of the Columbia River system. The U.S. Geological Survey collected data on sediment transport and deposition resulting from the drawdown test of Lower Granite Reservoir in March of 1992. Appendix M of the drawdown report (Corps, 1992) details the methods used to collect these data.
4-28 FINALEIS
Geology Appendix
The results of this test were used to qualitatively determine the impacts of SOS 5 on the quantity and nature of sedimentation in the reservoir system. It is expected that most sedimentation would result from incision of the mainstem delta and subsequent downstream deposition of the material. The 1992 drawdown test revealed that most sediment from the Snake-Clearwater delta area moved only a short distance downstream before being redeposited. Under the natural river operation, most of the sediment currently in storage in the Snake River reservoirs would be flushed out of the Snake River. Much of the material would be deposited in the Columbia River (McNary Pool) just downstream of the confluence with the Snake. A large delta of coarser material would likely form here, while the finer particles would be routed downstream. These would include particles in the fine sand, silt and clay size ranges. Much of this would settle out within the McNary Pool. The effect of this sediment would be to increase the rate of deposition in the McNary Dam reservoir. In addition, it could constrict navigation channels in the Columbia River near the Snake River confluence, and necessitate additional dredging to maintain the channel.
A maximum of 3.7 million tons of sediment during the first year, and 9.6 million tons or 5.4 million cubic yards (4.1 million m3) total during the first 6 years, would be deposited in McNary. This represents only about 14 percent of the total estimated sediment available in the lower Snake River reservoirs, there would still be 36 million cubic yards (27.5 million m3) available after the first 6 years, as the erosion rate would rapidly taper off after the first year.
In addition to moving sediment that has accumulated over the years, SOS 5b would affect the transport of sediment in the lower Snake River on an annual basis. Most of the annual sediment influx to the lower Snake River reservoirs normally enters in the spring and early summer. With SOS 5b, most of this sediment would not be deposited in the lower Snake reservoirs. Because the drawdown would take place during a typically high period of sediment influx, the yearly influx of sediment to the reservoir would be reduced to almost nothing during the first
1995

Geology Appendix
few years. The sediment that did get deposited would likely be flushed by the drawdown occurring the following year. With continued annual drawdowns, there would likely be no net sedimentation within these reservoirs. Thus the lower Snake River reservoirs would no longer prevent the bulk of the annual sediment load from reaching the lower Columbia River reservoirs. Fine suspended sediment would be flushed downstream as flow velocities increased, increasing turbidity throughout the lower Columbia River (see Appendix M, Water Quality, for information on turbidity impacts). Over the long term, this would greatly extend the life spans of the four lower Snake River dams and decrease the life span of McNary (or increase the need for dredging).
Sedimentation patterns would also be dramatically altered under SOS 5c. Lower Granite would no longer be a sediment sink. Sediment redistribution patterns would be similar to SOS 5b during the first year. Following the first year, sediment would be
4
flushed down the Snake River to McNary dam. McNary would trap most of the sediment coming from the Snake. Sedimentation would drop within a few years to near background levels, however (excluding sediment from the Upper Snake projects).
4.5.3 Groundwater
Groundwater well data collected in the 1992 drawdown test were used to evaluate the impact of the drawdowns on local water tables. The results of the 1992 test show that some wells in the immediate vicinity of Lower Granite Reservoir experienced the same amount of drawdown as the point of the reservoir closest to them, while wells located more than about 0.5 mile (.08 km) from the reservoir did not experience any effects from the drawdown. The wells affected by the 1992 drawdown are listed in Thble 4-3. These wells are hydraulically connected to the reservoir, some more directly than others. There are few if any functioning wells near the other three lower Snake River reservoirs.
Table 4-3. Groundwater Wells Near Lower Granite Reservoir.
Wells not affected by drawdown 11N/45E - 24L01
11N/45E - 24L02
lIN/46E - 29Q01
lIN/44E - 15E01
Wells that fluctuated directly with the reservoir, 35N/06W 14DAA1
5- to 12-foot drops 35N/06W 12CCA1
36N/06W 35ADB2
lIN/45E - 17E01
lIN/45E - 21B01
Wells that fluctuated directly with the reservoir, 36N/06W 25CDA1
15- to 30-foot drops 11N/45E - 20101D2
11N/45E - 13R01
lIN/45E - 18R01
lIN/45E - 19B01
11N/45E - 19101
lIN/45E - 02M01
1995 FINALEIS 4-29

4
Based on proximity to reseIVoirs and depth of the aquifer, groundwater wells along the other three reseIVoirs were categorized into two groups-those that would be strongly affected by drawdown and those that would experience only minor effects. It is possible that some wells in the former group (19 wells total) would go dry, and some in the latter group (7 wells) would experience decreased yield. Under SOS Sb, this would occur during a season when water is in high demand, so that alternative water sources may need to be provided. Under SOS Sc, wells designed after Lower Granite was filled and connected to the alluvial aquifer would be permanently altered. Alternative sources of water would have to be found.
Based on the 1992 test results, SOS S would cause groundwater levels to drop significantly in wells within at least 0.5 mile (0.8 Ian) from the lower Snake River reseIVoirs. Because the natural river drawdown would be much deeper than the 1992 drawdown, it is likely that more distant wells would be affected, possibly as far away as 1 mile (1.6 Ian). Under SOS Sb, the water levels would most likely rise as the reseIVoirs refilled, with no net long-term decrease of the water table. However, for SOS Sc, the water table near the reseIVoir would be permanently lowered, fluctuating slightly with seasonal changes in river levels.
Groundwater effects elsewhere in the system from SOS S would be essentially the same as those described previously for SOS 1, with the exception of John Day. Under both options, the John Day drawdown of 8 feet (2.4 m) below normal pool level could be expected to decrease the production of some wells in the Boardman, Oregon, area. However, the designed pumping rate is less than the available water discharge for this pool elevation (CH2M Hill, 1992). Using the yield-drawdown graph provided by Ranney Method Western Corporation (CH2M Hill, 1992), the curve for river stage 2S8 feet (78.7 m) intercepts the design yield of 6,030 gallons/ minute (27,413 liters/minute) at pumping elevation 236 feet (72 m), well above the minimum pumping elevation 01" 230 feet (70.1 m). Thus, the Ranney well would not be affected because of the limitation
4-30 FINALEIS
Geology Appendix
of its pump. However, other wells in the area that have high design yields relative to their pumping elevation may be affected. There are some 2,000 wells in the Lake Umatilla area (Corps, 1994). These include numerous wells in the Irrigon, Oregon area, and in the vicinity of Boardman. Some wells in the Umatilla area could be affected, although it is less certain how much, due the proximity of Umatilla to the McNary impoundment.
4.6 SOS 6: FIXED DRAWDOWN
This alternative is similar to SOS S except that the effects would not be as drastic because the depth of drawdown would be much less. While SOS S applies to all four lower Snake River reservoirs, SOS 6 has one option involving all four reservoirs and one option involving just one reservoir, Lower Granite. Impacts in the former case would predictably be much greater than the effect of drawing down only one reservoir.
Compared to historical conditions, the direct effects of SOS 6 would be limited to the lower Snake River projects and John Day. Operations and impacts at John Day would be the same as described in Section 4.5 for SOS S.
4.6.1 Shoreline Erosion and Mass Wasting
Erosion with SOS 6b would be extensive and would be much greater than during the 1992 Lower Granite drawdown test. This is because the drawdown would be for a longer time and would involve all four lower Snake River reservoirs. Wave erosion below normal operating pool levels would initially be extensive, with the amount of erosion dependent upon weather conditions during the 1S-day drafting period. Storms would accentuate wave effects. As the reservoir area decreased, wave energy would decline.
Nevertheless, wave attack on bank sediments would be severe once the reservoirs reached their fixed drawdown levels. Wave erosion would not cease at full draw down, but would continue as waves eroded into the new shoreline and moved toward an equilibrium profile. The amount of erosion would be about half of the erosion estimated for SOS Sb.
1995

Geology Appendix
The degree of impact under SOS 6b would not be as great because the depth of drawdown would be approximately 33 feet (10 meters) per dam, as opposed to about 100 feet (30.5 meters) with the natural river operation. Nonetheless, SOS 6 would still cause major increases in erosion and mass wasting. SOS 6b would mobilize about 1.5 million cubic yards (1.14 million m3) of sediment during the first year at Lower Granite alone, which is half as much sediment as produced under SOS 5b. Similarly, the yearly rate of erosion after 6 years would be less than half of that under SOS 5b, being approximately 500,000 cubic yards (382,000 m3). The rate is significantly less because most sediment would be retained within each reservoir. Based on the amount eroded per mile of reservoir, the other projects would contribute approximately 4.2 million cubic yards during the first year.
Overland flow erosion would be significantly less than with the natural river options, as only about half as much surface area would be exposed with SOS 6b and 6d. Erosion from incision would also be significantly less, as the base level would be at least 60 feet (18.3 m) higher than the natural river options. Because the amount of erosion would be much less than the annual sediment influx, SOS 6 would cause continued erosion of the shoreline, primarily in the form of wave and surface erosion, for decades.
Slumping would generally be limited to surficial deposits, due to their lack of consolidation. Slumping would be expected to cause some damage to road and railroad embankments and port facilities, and could be accelerated by storm events. Slumping would be most prominent in the upstream portions of the reservoirs. However, it would not be as severe as under the natural river alternative, because the depth of draw down would be much less.
The impacts of SOS 6d on erosion would essentially mirror those of SOS 6b, but would be limited to Lower Granite and its vicinity. The estimated volumes of sediment mobilized in Lower Granite would be 390,000 cubic yards (298,194 cubic meters) for SOS 6d. Little Goose would trap most of the sediment passed through Lower Granite.
1995
4
4.6.2 Sedimentation
Sedimentation would have a pattern similar to SOS 5, but would be distributed differently in time and space. Less sediment and finer sediment would be flushed out of the Snake River. Coarser sediment (i.e., gravel) would not reach the Columbia, as it would merely be moved from the shorelines and the deltas to lower elevations in each of the lower Snake River reservoirs. McNary Dam would trap most of the sediment flushed from the Snake River.
Option 6d would result in increased sedimentation in Little Goose Reservoir only, decreasing its life span significantly. Navigation could be affected by the increased sedimentation under both options.
4.6.3 Groundwater
Groundwater levels would drop in wells within about 1 mile (1.6 km) of the shoreline of the affected lower Snake River reservoirs under SOS 6. The decline in water level would be temporary; the water table in these wells would probably return to the typical levels as the reservoir(s) refilled. Under the 4.5 -month options, a wider radius of wells would be affected, perhaps as far away as 1 mile (1.6 km). Some wells might go dry, depending on their depth. Alternative sources of water might have to be found, given that the drawdowns would take place during the high water use season. Wells in the Lewiston! Clarkston area would be affected with SOS 6d. Wells screened in the Pasco Gravels along Lake Umatilla would be affected as under SOS 5.
4.7 SOS 9: SETTLEMENT DISCUSSION ALTERNATIVES
This strategy has three significantly different options. SOS 9a uses drawdown to near the spillway crest on the Lower Snake River projects and establishes flow targets at the Dalles. SOS 9b establishes flow targets at McNary and Lower Granite based on runoff forecasts, and uses releases from Dworshak, Brownlee, and the Upper Snake projects to meet these flow targets. SOS 9c, like 9a, lowers the Lower Snake River projects to near the spillway crest during the spring and early summer, and uses flow augmentation based on the 1994-1998 Biologi-
FINALEIS 4-31
4
cal Opinion, with integrated rule curve operation at Libby and Hungry Horse. Within each subsection, option 9a will be discussed first, followed by options 9b and 9c.
4.7.1 Shoreline Erosion and Mass Wasting
Under SOS 9a, pool fluctuation would be reduced at Libby by 40 feet (12.2 m) and at Hungry Horse by 22 feet (6.7 m), or 33 and 28 percent, respectively. This would cause a significant decrease in the amount of shoreline erosion and mass wasting. Over time, some areas currently seasonally inundated would become vegetated and would not be subject to wave action.
At Brownlee, annual pool fluctuation would increase by 3 feet (0.9 m), though this would not result in a detectable increase in shoreline erosion. However, an extra filling/release cycle would cause a significant increase in shoreline erosion and mass wasting, and could nearly double the amount of erosion and mass wasting each year.
PR at Dworshak would increase somewhat, from 71 feet (21.6 m) to 86 feet (26.2 m). This would result in a moderate increase in shoreline erosion and mass wasting, due to the additional shoreline exposed to wave action. Increased potential for slumping could occur in some areas where the colluvial soil layer is relatively thick. In addition, since the lowest pool elevation reached would be over 10 feet (3.0 m) lower on average than under current operations, the sediments deposited at this level would be subject to wave erosion, resulting in a short-term increase in shoreline erosion during April.
On the lower Snake River projects, the effects would be similar to those under SOS 6b, with significant erosion and mass wasting. At Lower Granite alone, approximately 1.5 million cubic yards (1.15 million cubic meters) of sediment would be mobilized during the first year. After six years, the sediment eroded would be approximately 500,000 cubic yards (382,000 cubic meters). Based on the total erosion per mile, with adjustment for sediment-filled embayments, the other lower Snake River projects would contribute approximately 4.2 million cubic yards (3.2 million cubic meters) of eroded sediment during the first
4-32 FINALEIS
Geology Appendix
year. Overland flow erosion would not be as severe as under SOS 5, and incision would be significantly less. Slumping would also be significantly less.
Erosion and mass wasting at Grand Coulee would be similar to current operations, except that PR would be slightly higher. The increase in shoreline erosion and mass wasting would be negligible.
Albeni Falls would experience a slight decrease in erosion due to a small decrease in PRo This would decrease the total area of shoreline subjected to erosion and mass wasting.
At John Day, effects would be essentially the same as under SOS 5, with a slight increase in PRo Movement of "slide #1" (Gustafson, 1992) could occur, but shoreline erosion would remain generally within historical ranges.
Under SOS 9b, PR at Libby would decrease by 20 percent, resulting in a small reduction in shoreline erosion and mass wasting. However, because the elevation of the pool would be significantly higher during most of the year than currently, more shoreline erosion and mass wasting would occur higher on the shoreline of the reservoir. It is difficult to estimate what the net change in erosion and mass wasting would be during the first few years of operation. Over the long term, shoreline erosion and mass wasting would decrease slightly.
At Hungry Horse, the effects on PR would be the same as under SOS 9a, and would lead to a generally lower rate of shoreline erosion. The average pool elevation would be significantly higher (about 30 feet [9.1 m]) during the spring than under current operations. This could cause more mass wasting along the shoreline, when the groundwater elevations surrounding the reservoir are generally high.
On the Lower Snake River projects, the effects would be the same as under current operations, with generally minimal erosion and mass wasting.
At Grand Coulee, the PR would be slightly reduced under SOS 9b, and the effects would be similar to those under SOS 2d, with a slight decrease in shoreline erosion and mass wasting.
Brownlee would experience a lower PR, but would have an extra refilling/release cycle, which would
1995

Geology Appendix
lead to a net increase in shoreline erosion and mass wasting. At Dworshak, a similar situation would occur, with a major refilling/release cycle added. This would result in a significant increase in shoreline erosion and mass wasting, since the shoreline would on average be exposed to twice as much wave action and mass wasting.
John Day would have the same operations and thus the same effects as under current operations.
Under 9c, Libby would experience a significant decrease in shoreline erosion and mass wasting. The PR would decrease by 36 percent. The higher elevation of the pool during the early spring could lead to an increase in mass wasting during the higher groundwater table in that time of year. However, the decreased fluctuation in the pool level is significant enough that a net decrease in erosion and mass wasting would probably result. Hungry Horse would have a similar situation. The PR would be reduced by 20 percent, but the higher pool levels during the spring could offset the associated decrease in mass wasting. The net effect would be a decrease in shoreline erosion but little or no change in mass wasting.
As under SOS 9a, Albeni Falls would experience a slight decrease in shoreline erosion and mass wasting, due to the small decrease in PRo
On the four lower Snake River projects, the 40 foot (12.2 m) drawdown that would be required would result in significant increases in shoreline erosion and mass wasting. Based on the erosion estimated for the 100- and 30-foot (30.5 - and 9.1-meter), 2.5 month drawdowns under SOS 5 and 6, the total erosion for the first year at Lower Granite under SOS 9c is estimated at 1.3 million cubic yards (994,000 cubic meters) under typical conditions, for all four reservoirs. The patterns of erosion and mass wasting would be similar to those under SOS 6, with a peak each year at the beginning of drawdown, a tapering off during the middle of drawdown, and a slight rise during refilling of the reservoirs. Slumping would be generally limited to surficial deposits, and would cause some damage to road and railroad embankments and port facilities. Slumping would be
1995
4
most prominent in the upper portions of the reservoir, where the unconsolidated sediments susceptible to slumping are thickest. Based on the total erosion per mile of reservoir, the other lower Snake River projects would contribute approximately 3.6 million cubic yards (2.75 million cubic meters) of eroded sediment during the first year. Erosion and mass wasting would decrease rapidly within a few years after the initial drawdown, but would reach a constant level due to the wintertime accumulation of additional sediment.
At John Day, effects would be essentially the same as under SOS 5, with a slight increase in PRo Movement of "slide #1" (Gustafson, 1992) could occur, but shoreline erosion would remain generally within historical ranges.
4.7.2 Sedimentation
Under SOS 9a, sedimentation from shoreline erosion and mass wasting would decrease significantly at Libby and Hungry Horse. This sediment source may be relatively minor, however, compared to erosion of the deltas fonned by the mainstem rivers on these projects. Sedimentation from shoreline erosion and mass wasting would decrease slightly at Albeni Falls but would increase significantly at Brownlee and Dworshak. Grand Coulee would experience sedimentation similar to that under current operations.
On the four lower Snake River projects, sedimentation would be similar to that under SOS 6b, with major redistribution of sediments within the reservoirs, particularly with the coarser fraction in Lower Granite. Some fine sediment would remain suspended and enter the Columbia River. The Water Quality Appendix estimates how much would reach Lake Walulla. Sedimentation could be of sufficient magnitude to affect shipping lanes, especially in Lower Granite and Little Goose. Sedimentation of embayments and tributary deltas would be effectively slowed, as the channel would erode each year down through the accumulated sediments.
Sedimentation on the remaining run-of-river projects would remain within historical ranges.
Under SOS 9b, sedimentation from shoreline erosion and mass wasting would decrease slightly
FlNALEIS 4-33

4
at Libby, Hungry Horse, Albeni Falls, and Grand Coulee. At Brownlee and Dworshak, it would increase significantly due to the extra release/refilling cycle. More sediment from the eroding shoreline would settle out on the reseIVoir bottom.
On the four lower Snake River projects, sedimentation would remain within historical ranges and would be dominated by the sedimentation at the delta in Lower Granite.
Under SOS 9c, sedimentation from shoreline erosion and mass wasting would decrease significantly at Libby, and slightly at Hungry Horse and Albeni Falls. At Grand Coulee, sedimentation would remain within historical ranges.
Sedimentation from shoreline erosion and mass wasting would increase significantly at Brownlee due to the extra release/refilling cycle, since more sediment would be generated from the shoreline. Dworshak would not experience a detectable change in sedimentation from shoreline erosion and mass wasting.
At the lower Snake River projects, as under SOS 9a, significant sedimentation effects would occur, although sedimentation would be somewhat higher. Shipping lanes could be affected in Lower Granite and Little Goose, although erosion of the delta would account for more sediment than erosion of the shorelines.
Since John Day would be lowered by 9 feet (2.7 m), some sediment would be generated from erosion of the near-shore sediment. This sediment would settle out mostly near the shoreline at the lowest pool level, 257 feet (78.3 m).
4.7.3 Groundwater
Groundwater fluctuations, related to pool level fluctuations, would be affected in areas close to the reservoirs. At Libby and Hungry Horse, groundwater fluctuations would decrease near the reservoir, and the water table would rise, as the average elevation of the reservoirs would be significantly higher than under current operations.
4-34 FlNALEIS
Geology Appendix
Under all three options, groundwater fluctuations at Grand Coulee would decrease very slightly, and water table elevations would be slightly lower near the reservoir during the summer.
At Dworshak, groundwater fluctuations would increase under SOS 9a, although there are few wells in the immediate vicinity to be affected. Under SOS 9b and 9c, groundwater fluctuations would decrease near the reservoir.
At Brownlee, the range of groundwater fluctuation would be similar to that under current operations for all SOS 9 options. However, more fluctuation would occur with an extra cycle of release/refilling. In addition, the summer pool elevations would be 8 to 30 feet (2.4 to 9.1 m) lower than under current conditions, and thus near-shore wells could be significantly affected. This effect would occur only in late August and September under SOS 9a.
At the lower Snake River projects, options 9a and 9c would affect groundwater levels significantly. The effects would be similar to those under SOS 6b, although under SOS 9c, the water table would be lowered more and more wells would potentially would be affected. Wells in the Lewiston/Clarkston area within 0.5 mile (0.8 km) of the reservoir shoreline would be most affected, and the water table near the shoreline could drop. Some wells might go dry, depending on their location and depth. Thble 4-3 shows which wells would be slightly or strongly affected. The effect of the drawdown would diminish rapidly away from the reservoir shorelines. Given the results of the 1992 drawdown test, most wells would recover quickly after refilling in June. During the drawdown, alternate sources of water might have to be found.
The water table near Lake Umatilla would be affected slightly by the 9 foot (2.7 m) drop in pool level under options 9a and 9c. The effects would be similar to those under options 6b and 6d, except that the water table would be low during April and May through August. Although the Ranney well at Boardman would not be affected, other wells in the area could experience diminished capacity, and alternate sources of water might have to be found.
1995

Geology Appendix
4.8 SOS PA: PREFERRED ALTERNATIVE
This alternative would use flow targets at McNary and Lower Granite and would lower the John Day and lower Snake River projects to MOP during the spring and early summer. No major drawdowns would be involved.
4.8.1 Shoreline Erosion and Mass Wasting
Under this option, shoreline erosion and mass wasting would decrease at Libby and Hungry Horse. On average the PR would be reduced by 25 percent at Libby and by 29 percent at Hungry Horse. At Hungry Horse, the average end-of-the-month pool elevation would be 7 to 40 feet (2.1 to 12.2 m) higher than under current operations. During late spring and early summer, when groundwater levels are higher due to snowmelt, the shoreline would be subject to more wave attack. This could increase the potential for slumping along the shoreline, since the higher groundwater at that time of year would tend to make unconsolidated material less cohesive. However, the reduction in PR is large enough that the net effect would be a decrease in overall shoreline erosion.
Conditions at Albeni Falls would be similar to those under current operations.
Grand Coulee and Brownlee would experience a slight reduction in PR, but a reduction in shoreline erosion and mass wasting would not be noticeable.
At Dworshak, a 17 percent increase in PR would occur, increasing shoreline erosion and mass wasting slightly.
At John Day, a temporary increase in erosion and mass wasting would occur as the pool level is lowered to 257 feet (78.3 m). Movement of "slide #1" (Gustafson, 1992) could occur, affecting nearby Washington State Route 14. Since the pool would be kept at this level year-round, eventually erosion and mass wasting would return to within historical ranges or slightly lower, as there would be fewer total miles of shoreline exposed to wave action. The shoreline above 257 feet (78.3 m) would be subject to surface erosion and incision by tributaries, but would gradually become revegetated. Mitigation could include
1995
stabilization or reseeding of unstable or highly erodible areas.
4.8.2 Sedimentation
4
Under the preferred alternative, sedimentation from shoreline erosion and mass wasting would increase slightly at Dworshak, but would decrease slightly at Libby, Hungry Horse, Grand Coulee, and Brownlee. At John Day, a pulse of sedimentation would occur during the first few years following lowering of the pool level. Gradually, sedimentation from shoreline erosion and mass wasting would return to within historical ranges.
Since the PR at the lower Snake River projects would be the same as under current operations, no change in sedimentation from shoreline erosion would occur.
4.8.3 Groundwater
Significant changes in groundwater levels or fluctuations would occur only at Libby, Hungry Horse, Dworshak, and John Day.
Groundwater fluctuations at Libby and Hungry Horse would decrease near the reservoirs. At Hungry Horse, the higher annual average pool elevation would lead to higher groundwater levels in the alluvium and colluvium adjacent to the reservoir shoreline. Since there are no wells near Hungry Horse, there would be no immediate effect on groundwater supply.
At John Day, numerous wells would be affected by the permanent lowering of the pool elevation to 257 feet (78.3 m). Wells using the Pasco Gravel aquifer would be directly affected, resulting in either a loss of capacity and increased pumping costs, or loss of water supply altogether. Some wells using aquifers in the Columbia River basalts could also be affected. Since there are approximately 2,000 wells near Lake Umatilla, the cumulative effect on water supply could be significant. Alternative sources of water would have to be found for some well users. As under SOS 5 and 6, the Ranney well at Boardman would not be affected since the design capacity would be less than the potential yield at this pool elevation (CH2M Hill, 1992).
Groundwater effects on other projects would remain within historical ranges.
FINALEIS 4-35/(4-36 blank)

Geology Appendix 5
CHAPTERS
COMPARISON OF ALTERNATIVES
5.1 SUMMARY OF IMPACTS
All of the SOS alternatives would have significant absolute impacts on geology, soils, and groundwater. Thble 5 -1 is a listing of the alternatives and a brief summary of their impacts. With or without changes in operation, the impacts of the dam and reservoir system on the dynamic equilibrium of the river would continue for hundreds, possibly thousands of years. Flow regimes have been significantly altered and sediment transport has been greatly restricted.
To provide context for the assessment, operational impacts of the respective alternatives were compared to baseline conditions. In terms of geologic processes, baseline conditions are those that evolved under historical operations for the system, as best represented by SOS lb. The rate of change in these conditions has been modified slightly at some projects (primarily Dworshak and Grand Coulee) since 1983, through operating patterns represented by SOS la, and subsequently by SOS 2c. While the actions included in SOS 2c have generally been in effect since the 1992 operating year, these operations are not drastically different from SOS la, and as yet have not likely caused any identifiable change in baseline conditions.
SOS alternatives 1, 4c, 9b, and the preferred alternative would have little impact on the shorelines of the lower Snake River reservoirs, because they would be operated much as they are today. SOS 1 represents typical or normal reservoir operations over approximately the past 20 years. Because the river system has had some time to adjust to this regime of operation, SOS 1 would involve relatively stable conditions and minor incremental impact in the short term. The river system would adjust to the modified regime of SOS 3 or 4 over time, and eventually their impacts would decrease.
1995
Continuing current operations on a long-term basis would result in a minor increase in landslide activity and/or shoreline erosion at Brownlee, but would decrease these processes at Hungry Horse, Dworshak, and Grand Coulee.
SOS 4c would involve little or no change in impact levels at the run-of-river projects and would generally have net positive impacts at the storage projects. Shoreline erosion would decrease at Hungry Horse and Albeni Falls. SOS 4bl and 4b3 would also decrease erosion and mass wasting at Libby and Dworshak.
SOS alternatives 5, 6, 9a, and 9c would have much greater impacts on both the Columbia and Snake Rivers than other alternatives, contributing additional sediment on the order of millions of tons per year over current levels. The most significant impacts on shorelines and groundwater would be on the lower Snake River. Of the many options involving drawdown, SOS 5b and 5c would have the greatest short-term impact on shoreline erosion, mass wasting, sedimentation, and groundwater. SOS 6b and 6d would also lead to sustained high levels of erosion and sedimentation, albeit lower than with SOS 5. A key difference between SOS 5 and SOS 6 is that with the natural river operation (SOS 5), sediment would be flushed out of the Snake River faster.
SOS 5 would increase the life span of the four lower Snake River reservoirs almost indefinitely, by flushing accumulated sediments from these reservoirs. This would eliminate the need for most dredging to maintain navigation when reservoirs were filled under SOS 5b. SOS 6 would increase the life span of the reservoirs as well, although they would still eventually silt up. Long-term dredging requirements would decrease significantly.
FINALEIS 5-1

5 Geology Appendix
Table 5-1. Summary of Impacts of SOS Alternatives
SOS 1: Pre-ESA Operation
la Pre-Salmon Summit Erosion, mass wasting, and sedimentation would be within historical operating ranges. Absolute effects would continue to be significant, but diminishing with time.
Ib Optimum load-following Similar to la, except slightly more erosion and mass wasting. Absolute effects would continue to be significant, but diminishing with time.
SOS 2: Current Operations
2c SEIS operation-no action Similar to SOS 1, but with increased shoreline erosion of Brownlee alternative Reservoir due to additional drafting. Impact would still be minor.
Short-term increase in erosion along lower Snake and John Day Reservoirs.
2d 1994-98 Biological Opinion Effects similar to 2c, except at Brownlee, where a significant increase in shoreline erosion and mass wasting, and associated sedimentation, would occur.
SOS 4: Stable Storage Project Operation
4c Enhanced storage level with Minor decrease in erosion and mass wasting at Hungry Horse, Libby, modified Grand Coulee flood and Grand Coulee; same as 2c for other reservoirs control
SOS 5: Natural River Operation
Sb 4.5-month natural river Major increase in erosion and sedimentation by all shoreline operation processes on the lower Snake, declining with time as sediment
availability decreases and sediment is redistributed. Eroded fine- grained materials would move out of lower Snake reservoirs, increasing reservoir life. Structural damage to shoreline facilities expected due to repeated nature of drawdowns. No upstream effect expected. Downstream operations affected by increased sediment transport and deposition in McNary project. Water table significantly lowered in the immediate vicinity of the Snake River; some wells might go dry seasonally. Slight increase in erosion at John Day. Storage projects affected generally as in SOS 1, except minor decrease in erosion and mass wasting at Dworshak.
Sc Permanent natural river Impacts similar to SOS Sb for the first few years. Less overall operation shoreline erosion and mass wasting would occur than under SOS 5b,
since the reservoir would not be refilled yearly. Significant surface erosion of reservoir sediments would occur unless mitigated. Permanent lowering of the water table would occur in the Lewiston - Clarkston area.
5-2 FINALEIS 1995

Geology Appendix
Table 5-1. Summary of Impacts of SOS Alternatives. - CO NT
SOS 6: Fixed Drawdown
6b 4.5-month fixed drawdown
6d 4.5-month Lower Granite drawdown
Large increase in erosion, mass wasting, and sedimentation on the lower Snake. Maintenance of near-constant pool level would increase wave erosion impacts relative to SOS 5. Suspended sediment transported out of reservoir would settle in downstream reservoirs, while some sediment flushing would occur in operating reservoirs. Channel incision into deltas would redistribute coarse sediment lower in the reservoirs, enhancing navigability of delta segments. Water table lowered significantly, although not as much as under SOS 5. Fewer wells likely to be significantly affected. Slight increase in erosion and seasonal lowering of the water table near John Day. Storage projects affected as in SOS 5b.
Same as 6b, but with most impacts limited to Lower Granite and its vicinity. Groundwater effects same as 6b, but limited to Lower Granite area.
SOS 9: Settlement Discussion Alternatives
9a Detailed Fishery Operating Plan
9b Adoptive Management
9c Balanced Impacts Operation
SOS PA: Preferred Alternative
1995
Significant decrease in erosion and mass wasting at Libby and Hungry Horse. Major increase in erosion, mass wasting, and sedimentation, and a lowering of groundwater on the lower Snake River projects. Effects at John Day similar to SOS 5.
Shoreline erosion and mass wasting would decrease slightly at Libby, Hungry Horse, and Grand Coulee. These processes would moderately increase at Brownlee and Dworshak. Lower Snake River projects would be affected as under SOS 2c.
Significant decrease in shoreline erosion, mass wasting, sedimentation, and groundwater fluctuation at Libby and Hungry Horse. Major increase in erosion, mass wasting, sedimentation, and groundwater fluctuation on the lower Snake River projects. Slight increase in erosion and increase in groundwater fluctuation at John Day.
Decrease in shoreline erosion, mass wasting, sedimentation, and groundwater fluctuation at Libby and Hungry Horse. Slight increase in these processes at Dworshak. Effects at John Day similar to SOS 5.
FINALEIS
5
5-3

5
SOSs 5, 6, 9a, and 9c would be the only alternatives to significantly affect water tables near reservoirs. SOS 5b and 5c would have greatest effect, due to the length and magnitude of drawdown with these options.
The preferred alternative would decrease shoreline erosion and mass wasting at Libby and Hungry Horse, increase these effects at Dworshak slightly, but would not significantly affect the lower Snake Projects.
5.2 CUMULATIVE IMPACTS
Assessing cumulative impacts is a key requirement of NEPA compliance. Impacts of system operations on the physical resources affected could be cumulative in several ways. They could accumulate over time; erosion and sedimentation impacts might be insignificant in anyone year, but they might be additive over multiple years and represent significant longterm impacts. There can also be interaction effects among individual types of operations impacts, or between operations impacts and independent factors affecting the river system. The impacts of the SOS alternatives must therefore be assessed within the context of other reasonably foreseeable events that could increase or decrease the significance of expected impacts on geology, soils, and groundwater. The temporal and interactive (synergistic) aspects of the projected impacts are summarized in the following discussions.
5.2.1 Temporal Cumulative Impacts
The effects of the SOS alternatives would decrease significantly over the course of 20 years. The impacts of SOSs 1, 2, 4, 9, and PA would be fairly minor in the first year. In the following years, there would be an incremental decrease in impacts, as shorelines developed lag deposits as new drawdown zones were cleared of fine sediments.
The drawdown alternatives (SOSs 5,6, 9a, and 9c) would also exhibit a rapid decrease in the amount of erosion over the first 6 years (Figure 5 -1). After 6 years, erosion would approach a constant level. Continued operation of the natural river alternatives would result in no net sedimentation in the lower
5-4 FlNALE1S
Geology Appendix
Snake River, as mentioned in Section 5.1. For the SOS 6 options, sediment input would also decrease rapidly, but not enough to flush out all of the annual sediment influx coming down the Snake. SOS 5d would have most of its impact the first year, with erosion and mass wasting rapidly decreasing to background levels.
5.2.2 Synergistic Impacts
The effects of the alternatives need to be considered in terms of the overall geologic/geomorphic picture, particularly if any thresholds might be crossed by increased sedimentation or erosion. Other activities that could affect the reservoir environment include additional landslide inputs, additional groundwater effects, and increased sedimentation.
If wet, stormy conditions prevailed during the first years of drawdown operations, erosion and sedimentation could be much more severe. Figure 5-1 shows three scenarios for shoreline erosion, based on deviations in weather patterns (see Appendix M, Water Quality, for detailed discussion). Estimated sediment quantities for the high-erosion scenario (wet, stormy conditions) are generally more than three times the quantities for the low-erosion scenario, and are nearly double the estimates for the moderate conditions (which were reported in Chapter 4).
A number of landslides along the Columbia River are known or thought to be the result of increased infiltration of water due to irrigation (National Park Service,1992). It is conceivable that lower pool elevations at times of the year where irrigation is heavy could exacerbate the landslides. The degree of effect is difficult to estimate. The study by Jones et al. (1961) indicates that higher water tables could increase the affected area at some existing landslide areas by as much as 200 percent. They also suggest that the area around Libby Dam could be affected in this way, while the National Park Service report indicates Lake Roosevelt could be a potential impact area. The impacts of increased landslide activity could include loss of farmland structures, and road and railroad damage.
1995

." ..... ~ t-t'l -'"
., 2500000 "E ca >-
~ 2000000 :l U ~
~ G) 1500000
"'C o -w -i 1000000 E :g G)
(J) 500000 ;;;
~ 0
~ .2 .0 on
G) .s:::; ~ - Ol ~ .2
.s:::; CI> 0
"'C .0 on 0 on E .0 on
CI> .s:::; ~ G) .s:::; - .2' - .2' as .2 ~ - .s:::; s;; CI> .0 CI> "0 .,
CD "0 .0 0 on 0 CD E E 0 .0 on CD
Alternative/scenario
Figure 5-1 . Total Sediment Eroded, by Alternative, for First Six Years - Lower Granite.
~ .2 "0 CD
• year 1
o year 2
• year 3
• year 4
Iiiii! year 5
f:t] year 6
2 ~ CI> "0 0 E "0 CD
.s:::;
.2>
.s:: "'C CD

5
Additional groundwater effects could include shifting
of groundwater divides. System operations could cause such shifts if pools were lowered during an already dry year. If contaminated groundwater
exists within the vicinity of the river, the contamina· tion could move toward or reach the reservoirs.
Based on existing urban/industrial development patterns, the only location where this could poten
tially happen would be the Lewiston-Oarkston area on Lower Granite Reservoir.
Prevailing weather conditions would a1so interact with system operations effects on groundwater levels. Wells affected by drawdowns or increased
storage project drafting would be more likely to go dry if the area were experiencing a drought.
Increased sediment yield from outside sources could
affect the erosion and deposition patterns in mainstern rivers. Long-tenn increases in sediment contribution to the rivers could result from increased
agriculture or changes in agricultural or other land management practices. With the increased flows or velocities that would result from most of the SOS
alternatives, the chance of this sediment being trapped would diminish. In particular, SOS 5 would nearly eliminate the sediment trapping ability of the reservoirs. In addition, increased urbanization could
locally increase runoff response, and cause incision of tributary streams. This could result in pulses of sedimentation that, combined with increased sedi
mentation from reservoir operations, could conceivably exceed a biological threshold. (Potential turbid
ity levels associated with the SOS alternatives are addressed in Appendix M, Water Quality.)
Under SOS 5, as noted above, a large delta would ronn at the mouth of the Snake River near Pasco. Besides potentially blocking shipping lanes, the delta
would alter the capacity of the channel to pass flood waters. Consequently, it is possible that the effects
of a large flood could be distributed over a wider area. Investigation of this potential effect would require hydrologic analysis of the Columbia-Snake River confluence area.
FINALEIS
Geology Appendix
5.3 MITIGA110N OP110NS
All of the SOS alternatives call for continued operation of the dams on the Columbia River system. As a result, all would cause significant amounts of erosion, mass wasting, and sedimentation. The difference between alternatives in these processes are small relative to the baseline impact of what reservoirs do the river system. Therefore, mitigation measures can be considered for every alternative. Mitigation measures should be designed to stabilize the shoreline environmenl This is more easily done on run-of-river projects than on storage projects. In addition. storage projects inherently have more impacts. The result is that there are unavoidable and irretrievable losses associated with storage projects. These are addressed in the next section.
Baseline shoreline erosion, mass wasting. and sedimentation would be reduced under most of the alternatives. In effect, this would mitigate some of the effects of historica1 operations. 1b a degree. the effects of those alternatives that accelerate these processes could be mitigated. Erosion and mass wasting have been occurring at various locations throughout the river system for many years and agencies have been responding to these impacts. Continuation, expansion, and enhancement of present erosion control practices should decrease the projected impacts for these alternatives.
Monitoring shoreline erosion is the basic tool for preventing it. While some reservoirs have regular erosion and mass wasting inspections, many do not. Monitoring identifies critical locations and may draw attention to potential areas of severe erosion. Monitoring is cheaper in the long run than fixing the consequences of erosion or mass wasting after the fact. Part of the mitigation for all alternatives should be the institution of yearly landslide and erosion monitoring on reservoirs that do not currently have it.
Physical treatments, such as slope removal and installing retention walls and revetments, could be used to diminish impacts in areas where property is threatened. Crittcal areas such as active landslides
1995
!

Geology Appendix
could also be protected by adding rock walls. These walls would not only protect the toes of slides from waves, but also serve to buttress them against future movement. This practice is common in shoreline protection (Davidson, 1992; City of Seattle, 1990). This could apply to all alternatives.
Additional treatments include a variety of wave dissipation structures, many of which are described in Davidson (1992). These include log booms, pontoons, log mats, and A-frame booms. Other offshore, non-floating breakwaters are made of stacked sand- or concrete-filled bags, stone structures, and gabions (rock-filled mesh boxes). All of these have been used in shoreline erosion control, although much of the use has been along marine shorelines. Floating breakwaters are more suited to shorelines that fluctuate, because the booms stay with the water level. However, most floating breakwaters are not designed for shorelines that fluctuate more than 20 feet (6 m). Most storage projects involved in the SOR have much greater fluctuation than that, even under SOS 4. In these situations, floating breakwaters would be used for protection at or near full pool. Hence, while critically eroding areas above the full pool can be mitigated, it is not feasible to protect areas significantly below this level from wave or surface erosion.
Fixed breakwaters are only suitable for reservoirs with small pool level fluctuations, such as run-ofriver projects. Due to their expensive nature, erosion control structures such as these would be used only in areas of the most critical importance, such as vital or rare habitat, or in situations where historical or otherwise important structures are threatened.
Biotechnical stabilization methods are also available. These methods can be used in severely eroding areas or areas with shallow landslides. The techniques include willow wattling, using cigar-shaped bundles of freshly cut willow sprigs (Comes and McCreary, 1986). Another technique involves regrading the bank and insta]]ing alternating sequences of Jive branches and fiJ] material (see Leiser, 1992). A diverse array of combinations of biotechnical and mechanical stabilization exists (Goldsmith and
1995
5
Bestman, 1992; Allen and Klimas, 1986). In severely eroding areas, both types of stabilization may be necessary. Given the large areas involved and the cost of the stabilization, these techniques would have to be selectively placed in only the most critical areas. Each site would have to be evaluated to determine which method is appropriate. Properly installed and maintained shoreline revegetation/stabilization programs have been very effective. These techniques would apply to all alternatives.
For the alternatives that involve drawdown (SOSs 5, 6, and 9), riprap protection would be needed on the upstream side of each embankment of the dams involved (Corps, 1991). The quantity of riprap could be quite large depending on the alternative. For SOS 5, riprap would have to be extended from the current wave protection zone to the lowest parts of the dam on all four lower Snake reservoirs. This represents a huge quantity of riprap. An alternative to using riprap would be to install grouted geotextile blankets. Mitigation for either option under SOS 5 would be the most expensive of any of the alternatives. SOS 6 would also require dam embankment protection, but only to the level of the drawdown, and not to the base of the dam. Option 6d would require embankment protection on Lower Granite only.
The drawdown alternatives represent such a severe alteration of the reservoir system that much of their impact cannot be prevented. Some potential options include armoring sensitive areas with riprap,although this would damage aquatic habitat. Railroad and highway embankments deemed sensitive should be monitored during drawdowns. These could be reinforced, if necessary. Much of the damage to these facilities may not be preventable, and may be only correctable after initial drawdown.
Interruption of water supply due to lowering of the groundwater table during drawdown could be mitigated by supplying groundwater users with alternative sources of water. In some areas, it could be difficult to find replacement sources of water. Water could be diverted from nearby surface water sources, or trucked in from other wells or surface sources.
FINALEIS 5-7

5
5.4 IRREVERSIBLE AND IRRETRIEVABLE IMPACTS
While some mitigation techniques can be applied to the projects, only a minor amount of the effects can be prevented. For instance, at Lake Roosevelt, it is not feasible to stabilize every landslide, since there are so many. Reclamation has developed a program of property acquisition to avoid the most financially tangible impact, the loss of private property. More subtle losses, such as loss of fish and wildlife habitat, receive lower priority because they are less easily prevented.
The long-term effects of reduction in sediment transport, aggradation of tributaries, and soil loss cannot be mitigated because the dams themselves are the cause. However, SOS 5c would return the lower Snake River to natural conditions year round. Thus, it is the only alternative that would eliminate the impact of some of the dams themselves. Areas
5-8 FINALEIS
Geology Appendix
already inundated by the reservoirs, particularly the storage reservoirs, are unavoidably affected and the losses associated with them are irretrievable. The only additional unavoidable impacts, over and above the baseline conditions, are those impacts associated with drawdown.
The lower Snake River system would be dramatically altered under SOSs 5, 6, 9a, and 9c. Most of the erosion and mass wasting that would occur under these alternatives would be unavoidable. Large areas of aquatic habitat and some terrestrial habitat would be irretrievably lost. Additionally, high turbidity is unavoidable. Sedimentation downstream of the drawdown reservoirs would be unavoidable. Benthic organisms in Lake Wallula would be buried by sediment under SOS 5, although this might be a temporary effect. Under SOS 6, 9a, and 9c, sediment would primarily be redistributed within each reservoir, which would destroy aquatic habitat in the upstream reaches of each reservoir.
1995

Geology Appendix 6
CHAPTER 6
LIST OF PREPARERS
The Geology Technical Appendix was prepared by Foster Wheeler Environmental Corporation (formerly Enserch Environmental), a consulting firm under contract to BPA. Individuals who contributed
to the report are listed in Thble 6-1. Contributors are listed by name, education, years of experience, experience and expertise, and role in technical appendix preparation.
Table 6-1. Bonneville Power Administration List of Preparers
Name EducationIYears of Experience and Role In Experience Expertise Preparation
Linda Burbach 15 Years NEPA compliance Contract management public involvement and review
Table 6-2. Foster Wheeler Environmental List of Preparers
Name Education/Years of Experience and Role In Experience Expertise Preparation
Garrett Jackson M.S., Geosciences Geomorphology Shoreline erosion Geomorphologist B.S., Geosciences Soil-vegetation associations Groundwater
7 Years Mapping stream channels
Geologic hazard evaluation
Robert Rogers M.S., Geology Geomorphology Reservoir processes Geomorphologist 6 years Geology Shoreline erosion
Bruce Stoker M.S.E., Civil Engineering Hydrology Technical review and
Geomorphologist M.S., Remote Sensing/Geology Sediment transport supervision B.S., Geology Slope stability
16 Years Geology
Stacie Seaver B.A., English-Technical Technical editing Technical editing Technical Editor Communications Document production Document production
4 years
1995 FINALEIS 6-1

6 Geology Appendix
Table 6-2. Enserch Environmental List of Pre parers - CONT
Name Education/Years of Experience and Role In Experience Expertise Preparation
Lynn Scaves A.S. Business Graphic design Graphics Graphic Artist 12 years Desktop publishing
Computer"ijenerated graphics
Chris Lawson M.A., Geography Multidisciplinary Project management Resource Planner B.S., Geography environmental and and review
16 years planning studies NEPA compliance
&-2 FINALEIS 1995

Geology Appendix 7
CHAPTER 7
GLOSSARY
Alluvial Fan: A low, outspread, gently sloping fan shaped stream deposit where the gradient of the stream suddenly decreases
Alluvial River: A river that occupies a broad flood plain over which the depth of alluvium deposited by the river equals or exceeds the depth to which scour takes place in time of flood.
Alluvial Terrace: A stream terrace composed of unconsolidated alluvium.
Alluvium: A general term for unconsolidated, sorted to semi-sorted material deposited by a stream or other body of running water during comparatively recent geologic time
Aquifer: Body of rock sufficiently permeable to conduct ground water in economic quantities to wells and springs
Avulsion: Sudden cutting off of land by a flood or by an abrupt change in the course of a stream.
Basalt: General term for a dark-colored, mafic volcanic rock.
Base Flow: Sustained or fair-weather flow of a stream
Base Level: The lowest level toward which erosion progresses; esp. the level below which a stream cannot erode its bed
Batholith: A large discordant plutonic (igneous intrusive) mass that has greater than 40 sq. mi. of surface exposure and no known floor.
Catchment: The area contributing flow to a given stream.
Cenozoic: Era of geologic time, from the beginning of the Tertiary period to present; about 65 million years ago to present
1995
Colluvium: A general term applied to loose, heterogeneous, and incoherent mass of soil and rock material deposited by rainwash, sheetwash, or creep, usually at the base or sides of hills.
Conglomerate: A coarse-grained, clastic sedimentary rock composed of fragments greater than 2 mm in a fine-grained matrix.
Debris Flow: A moving mass of rock fragments, soil and mud, with more than half the particles being larger than sand size.
Degradation: The wearing down or away of the earth's surface by the natural processes of weathering or erosion, e.g., the deepening by a stream of its channel.
Disaggregation: Separation or reduction of an aggregate into its component parts.
Drainage Pattern: The configuration in plan view of the natural stream courses in an area
Dynamic Equilibrium: Condition of a system in which there is a balanced inflow and outflow of materials.
Entrainment: The process of picking up or carrying along.
Eolian: Pertaining to wind; esp. of loess and sand dune deposits and their wind-formed sedimentary structures.
Ephemeral Stream: A stream that flows briefly in response to precipitation in the immediate area.
Flow Breccia: A breccia (angular conglomerate) formed at the same time with the movement of a lava flow.
Gabbro: A group of dark colored, basic intrusive igneous rocks.
Glacial Outwash: Stratified detritus removed from a glacier by meltwater streams.
FINALEIS 7-1

7
Granite: Broadly applied, any crystalline, quartzbearing plutonic rock; specifically refers to plutonic rocks with quartz constituting 10 to 50 percent of the felsic components and the alkali feldspar/total feldspar ratio restricted to the range of 65 to 90 percent.
Granitoid: A term for plutonic rocks with quartz composition between 20 and 60 percent that includes granite, tonolite, and granodiorite
Granodiorite: A plutonic rock containing between 20 and 60 percent quartz and with the alkali feldspar/ total feldspar ratio restricted to the range of 45 to 10 percent.
Greenstone: A field term for any dark green, altered or metamorphosed basic igneous rock.
Head Scarp: The steep surface on the undisturbed uphill side of a landslide.
Infiltration Capacity: The maximum or limiting rate at which soil can absorb precipitation.
Interill: The area between rills acted on by rain splash and thin film runoff erosion.
Intrusion: The process of emplacement of magma in pre-existing rock.
Jurassic: Second period of the Mesozoic era (after the 1tiassic and before the Cretaceous) between 190 and 135 million years ago.
Lacustrine: Pertaining to a lake or lakes
Laminar Flow: Water flow in which the stream lines remain distinct and flow direction remains unchanged with time.
Limestone: A sedimentary rock composed predominately of the mineral calcite. Many are the result of marine organic activity and contain fossils.
Liquefaction: In a cohesionless soil, the transformation from a soil to a liquid as a result of increased pore pressure and reduced effective stress.
Lodgement Till: Glacial deposit produced at the base of, and/or overidden by glaciers; very dense.
7-2 FINALEIS
Geology Appendix
Loess: A widespread, homogeneous, porous, finegrained blanket deposit consisting of silt, generally believed to be windblown dust of Pleistocene age.
Main Stem: The principle coarse of a stream.
Mantle: The zone of the earth below the crust and above the core.
Mass Wasting: General term for downslope transport of rock and soil material due to gravitational stress and not transported in another medium such as water or ice.
Mesozoic: An era of geologic time from the end of the Paleozoic to the beginning of the Cenozioc, 225 to 65 million years ago.
Metamorphism: The mineralogic, chemical and structural adjustment of rock to temperature, pressure, and chemically active fluids below the surface zone of weathering and under different conditions from which the rocks originated.
Microtopography: Topography on a small scale.
Knickpoint: Any interruption or break in slope, esp. a point of abrupt change or inflection in the longitudinal profile of a stream. Channel incision often migrates upstream, forming a knickpoint at the present upstream extent of incision.
Paleozoic: Era of geologic time from the end of the Precambrian to the beginning of the Mesozoic, 570 to 225 million years ago.
Peridotite: General term for a coarse-grained plutonic rock composed predominately of olivine and possibly other mafic minerals
Physiography: A description of the surface features of the earth, as bodies of air, water and land.
Piping: Erosion by percolating water in a layer of subsoil, resulting in the formation of narrow conduits (pipes) through which soil material is removed.
Plastic Flow: A permanent change in the shape of a solid that is not initiated by rupture.
Pleistocene: An epoch of the Quaternary period following the Pliocene epoch of the Tertiary and proceeding the Holocene epoch of the Quaternary period,
1995

Geology Appendix
beginning 2 to 3 million years ago and continuing until about 10,000 years ago.
Pliocene: An epoch of the Tertiary period following the Miocene and before the Pleistocene.
Pluton: An igneous intrusion
Pore-pressure: Pressure exerted by water in the interstitial spaces of soil.
PR: Total pool elevation range.
Precembrian: All geologic time before the beginning of the Paleozoic about 570 million years ago.
Quaternary: Second period of the Cenozoic era following the Tertiary period, beginning 2 to 3 million years ago and continuing to present.
Rill: Small channel eroded in soil by water detachment
Sandstones: A medium-grained, clastic sedimentary rock composed of an aggregate of sand-sized particle visible to the unaided eye.
Sapping: Process of erosion of a cliff base by the wearing away of softer layers, generally by groundwater movement resurfacing and causing slope collapse.
Saprolite: A soft, earthy, typically clay-rich, thoroughly decomposed rock.
Schist: A strongly foliated metamorphic rock that can be split into thin flakes or slabs.
Scoriaceous: Volcanic texture, typically in basalt, in which the rock is composed predominately of vesicles (holes).
Sedimentary: Pertaining to sediment or formed by the deposition of sediment.
Shale: A laminated, fine-grained sedimentary rock, formed from the compression of mud, clay or silt, whose gains are not normally visible to the unaided eye.
Shear Strength: The internal resistance of a body to shear stress.
1995
7
Slate: A compressed, fine-gained metamorphic rock, probably formed from shale, that can be split into slabs and thin plates.
Slump: Landslide characterized by shearing and rotation of a land mass about a curved slip surface.
Soil Creep: The gradual, steady downhill movement of soil on a slope.
Stratovolcano: A volcano constructed of alternating layers of lava and pyroclastic deposits.
Subaqueous: Conditions, processes, or deposits that occur under the surface of a body of water.
Subglacial Till: Till formed or accumulated on the bottom of a glacier.
Supraglacial Till: Till carried upon or deposited from the top surface of a glacier.
Surficial: Pertaining to processes and deposits on the surface of the earth.
Tailrace: Outlet structure at a dam.
Talus: Coarse rock fragments lying at the base of a cliff or steep rocky slopes.
Tephra: General term for all pyroclastic (hot material ejected from a volcano) material.
Thalweg: The line connecting the lowest or deepest points along a stream bed or valley.
Till: Unsorted, unstratified drift, generally unconsolidated, deposited by a glacier.
Thff: General term for all consolidated pyroclastic (hot material ejected from a volcano) rocks.
Thrbidity: The state of reduced clarity of a fluid due to the presence of suspended matter.
Thrbidity Current: A bottom -flowing current laden with suspended sediment, moving swiftly down a subaqueous slope, which is set up and/or maintained in motion by stirred - up sediment that gives the current a greater density than that of the surrounding water.
Thrbulent Flow: Water flow in which the flow lines are confused and heterogeneously mixed.
FINALE1S 7-3
7
Varve: A sedimentary bed deposited in a still body of water over a year's time, often paired when associated with glacial lake deposits reflecting a seasonal variation.
Weathering: Destructive processes occurring at the surface of the earth involving physical and chemical deterioration without significant transport of materials.
7-4 FlNALEIS
Geology Appendix
1995