Colour Guide - Joint Office of Gas Transporters gas... · Colour Guide Effective from 1 April 2015...
19
Effective from 1 April 2015 Notice of Gas Transmission Transportation Charges
Transcript of Colour Guide - Joint Office of Gas Transporters gas... · Colour Guide Effective from 1 April 2015...

Colour Guide
Effective from 1 April 2015
Notice of Gas
Transmission
Transportation Charges

2
Introduction
NTS Charges to Apply From 1 April 2015
This notice is issued in line with National Grid’s Gas Transporters Licence in respect of the NTS (“the
Licence”) and our obligations contained in the Uniform Network Code, which requires National Grid to
provide at least two months notice of changes to its gas transportation charges. This notice details
changes that will apply from 1 April 2015 and follows the ‘indicative notice’ published on 30 October
2014.
This notice is structured as follows:
TO Charges
TO Entry and Exit Commodity
DN Pension Deficit
NTS Metering Charges
SO Charges
SO Entry and Exit Commodity
St Fergus Compression
Connected System Exit Points Administration
Tools and Supporting Information
Appendices
National Grid sets its charges to recover the price controlled allowances set by Ofgem. The current
price control RIIO-T1 applies from 1 April 2013 and runs until 31 March 2021.
Charging Base
As in previous years we have used the ‘Gone Green’ scenario from the forecast Demand Statements
published by National Grid, which assumes that the environmental targets set by the government are
met i.e. 15% of all energy from renewable sources by 2020, greenhouse gas emissions meeting the
carbon budgets out to 2027, and an 80% reduction in greenhouse gas emissions by 2050. For
2015/16 the charging base (gas flows) is forecast to decrease by about 5% compared to the forecast
for 2014/15. This includes a 3% reduction in general demand and an increase in shorthaul volumes
which reduces the charging base over which normal commodity rates apply.
For a set target revenue recovery, charges are increased with a reduced charging base. Our
assumptions will be revisited before we confirm the October 2015 charges.

3
TO Charges
TO Allowed Revenues
TO allowed revenue (which is shared 50:50 between entry and exit activities) has increased from the
2014/15 level of £702m to £749m for 2015/16, an increase of £47m (7%). The details behind this
increase are given below:
Our Base Price Control Revenue has increased by £23m. This is principally made up of an
£18m change to our base revenue which is derived from the application of the inflation rates to
a £5m change in the underlying base allowance in 2009/10 prices. Other items include, a £3m
change in the TO MOD term which adjusts for a number of items through an annual iteration of
Ofgem’s Price Control Financial Model, and a £2m increase in the TRU term to reflect the
difference between a forecast RPI and the actual.
Pass through items have been adjusted to reduce revenue by £7m to £12m. This includes an
adjustment to the funding of independent systems (SIUs) following a Licence modification
which allows Scotia Gas Networks to recover the additional costs in securing supplies of LNG
from the Avonmouth facility for the winter of 2012/13, following the closure of Glenmavis LNG
facility. The value of this is £5.78m (2009/10 prices) and applies for 2015/16 only.
National Grid has a Licence Condition relating to a National Innovation Competition (NIC) which
allows for the funding of innovative low carbon or environmental projects. Ofgem has issued a
direction (the Funding Direction) that sets the total amount that can be recovered from, or
returned to, GB customers through NTS charges to cover Gas NIC Funding. The Funding
amount directed for 2015/16 is £5.7m, a reduction of £9.5m on last year’s value.
The output incentive revenue adjustment, which was zero last year, is £3m in 2015/16.
The under recovery (K) from 2013/14 carries forward with a 2 year lag to 2015/16. The value of
the TO K is £37m under recovery which is equivalent to an increase in Allowed Revenues of
£37m. The under recovery split between Entry and Exit for charge setting is £34m and £3m,
respectively.
Distribution Networks (DN) Pension costs, which are charged directly to the respective DN have been
revised and will be £48.8m in 2009/10 prices. Including inflation this equates to £59.8m for 2015/16,
a £17.3m increase from 2014/15.
The net effect on collectable income from TO charges is an increase of £29m compared to 2014/15.
A summary table of Allowed Revenues is shown in Appendix 1 of this document.

4
TO Charges
NTS TO Entry Commodity Charge
The NTS TO Entry Commodity charge levied on entry flows will increase to 0.0451 p/kWh from its
current rate of 0.0431 p/kWh and an average rate for 2014/15 of 0.0382 p/kWh, representing an
increase of 5% and 18% respectively. The increase in this rate is primarily due to the increase in the
revenue that we are seeking to recover from TO Entry charges.
NTS TO Exit Commodity Charge
The TO Exit Commodity charge will decrease from its current rate of 0.0200 p/kWh to 0.0198 p/kWh,
a decrease of 1% and an increase on the 2014/15 average of 0.0188 p/kWh due mainly to reduced
volumes.
NTS Exit Capacity charges
NTS Exit Capacity charges are normally updated once a year effective from October.
In order to calculate the indicative TO Exit Capacity Commodity rate to account for changes to revised
TO allowed revenue, a revised set of ‘indicative’ TO Exit Capacity charges for 2015/16 have been
calculated and used in the charge setting process. For reference these can be found in Appendix 2,
however, they do not replace those that were published on 1 May 2014 and utilised for user
commitment in the 2014 Exit Capacity Application Window.
DN Pension Deficit Charge
The DN Pension Deficit charges are shown in Table 1 below.
Table 1 DN Pension Deficit charge
1 April 2015
Distribution Network Monthly Charge £ per Annum £m
East of England 911,521 10.94
London 531,406 6.38
North West 625,962 7.51
West Midlands 451,978 5.42
North of England 580,575 6.97
Scotland 400,918 4.81
South of England 928,541 11.14
Wales and the West 555,990 6.67

5
TO Charges
Metering Charges
Meter maintenance charges will rise at the rate of inflation as in previous years. The rates are shown
in Table 2 and Table 3.
Table 2 Meter Maintenance - High Pressure Metering Installations (>7 barg)
Capacity
(scmh) < 10,192 >=10,192<14,906 >=14,906<25,878 >=25,878<36,866 >=36,866<63,524 >=63,524
£ per annum
Maintenance £13,709.31 £14,546.20 £16,451.95 £17,123.37 £18,798.22 £24,280.85
Pence per
day
Maintenance 3,755.98 3,985.26 4,507.38 4,691.33 5,150.20 6,652.29
Meter maintenance - Other NTS Meters types
Table 3 Volume converters (Correctors)
Pence per day £ per annum
Provision 44.4919 £162.40
Installation 17.9352 £65.46
Maintenance 40.4250 £147.55
A summary of TO Commodity charges can be found in Appendix 3.
Capacity
(scmh)
NTS Rotary Meter
≥792 <1,358
Turbine <283
£ per annum
Maintenance £350.52 £843.02
Pence per
day
Maintenance
96.0320 230.9656

6
SO Charges
SO Allowed Revenues
The SO allowed revenue has decreased by £52m from the 2014/15 level of £340m to £288m (-15%). Compared to 2014/15 October charge setting, the main changes are:
External costs have been forecast to increase by £3m to £117m. This is a reduction of £12m
compared to the indicative forecast. This is due to a reduction in the forecast of the price of
gas and a fall in the latest forecast of unaccounted for gas.
Base Revenue is forecast to reduce by £20m due mainly to a revised SO MOD term (-£13m)
and a reduction in legacy revenue drivers (-£8m). The SO MOD value adjusts for a number of
items through an annual iteration of Ofgem’s Price Control Financial Model and was confirmed
by Ofgem in November last year.
There have been several adjustments due to lower costs than our Licence allowances. In total
the balance of cost adjustments and incentive revenues which are carried forward from
2013/14 is -£24m.
A £10m over recovery (SOK) carried forward from 2013/14 reduces the SO allowed revenue in
2015/16 by £10m.
With a reduction in forecast revenue being collected from other SO income of £7m, the net effect on
collectable income from SO charges is a decrease of £45m compared to 2014/15.
NTS SO Commodity Charges
The NTS SO Commodity charge, as applied to both entry and exit flows, is 0.0169 p/kWh compared
to the current rate of 0.0185 p/kWh and an average rate for 2014/15 of 0.0195 p/kWh.
Other Charges
The St Fergus Compression charge levied at the Total Oil Marine sub-terminal at St. Fergus will
increase from the current rate of 0.0169 p/kWh to an April 2015 level of 0.0175 p/kWh. This
compares to an average rate of 0.0171 p/kWh during 2014/15. The charge is set based on the
assumption that it will be applied for the full financial year but will be reassessed in October
2015.
The Connected System Exit Points Administration charge is will reduce to 0.0910 p/day (or
£0.33 pa) per supply point in April 2015.
A summary of the SO charges can be found in Appendix 3.

7
Supporting Information
Supporting Information
Guidance and supporting charge setting information will be made available on the National Grid
website at http://www2.nationalgrid.com/uk/Industry-information/System-charges/Gas-
transmission/Tools-and-Models/. There will be an opportunity to discuss these changes at a
subsequent NTS Charging Methodology Forum (NTSCMF), details of which can be found at
http://www.gasgovernance.co.uk/ntscmf.
Getting in touch
If you have any suggestions on how we could improve our charge setting information provision to
better suit your needs or have any questions relating to these charges please contact Colin Williams
(01926 655916) or Karin Elmhirst (01926 655540) or email the charging team at
For an overview of our commitment to customers, please see:
http://www2.nationalgrid.com/uk/Services/Transmission-customer-commitment/

8
Appendix 1
Allowed Revenues
2014/15 2015/16 2015/16
at Apr 15 Indicative at April 15
TO Maximum Allowed Revenue 702 748 749
SO Maximum Allowed Revenue 340 300 288
NTS TO Entry Commodity 246 272 274
NTS TO Exit Commodity 118 117 118
NTS SO Commodity (Entry & Exit) 249 215 203
St. Fergus Compression 12.7 13.8 13.4
9
Appendix 2
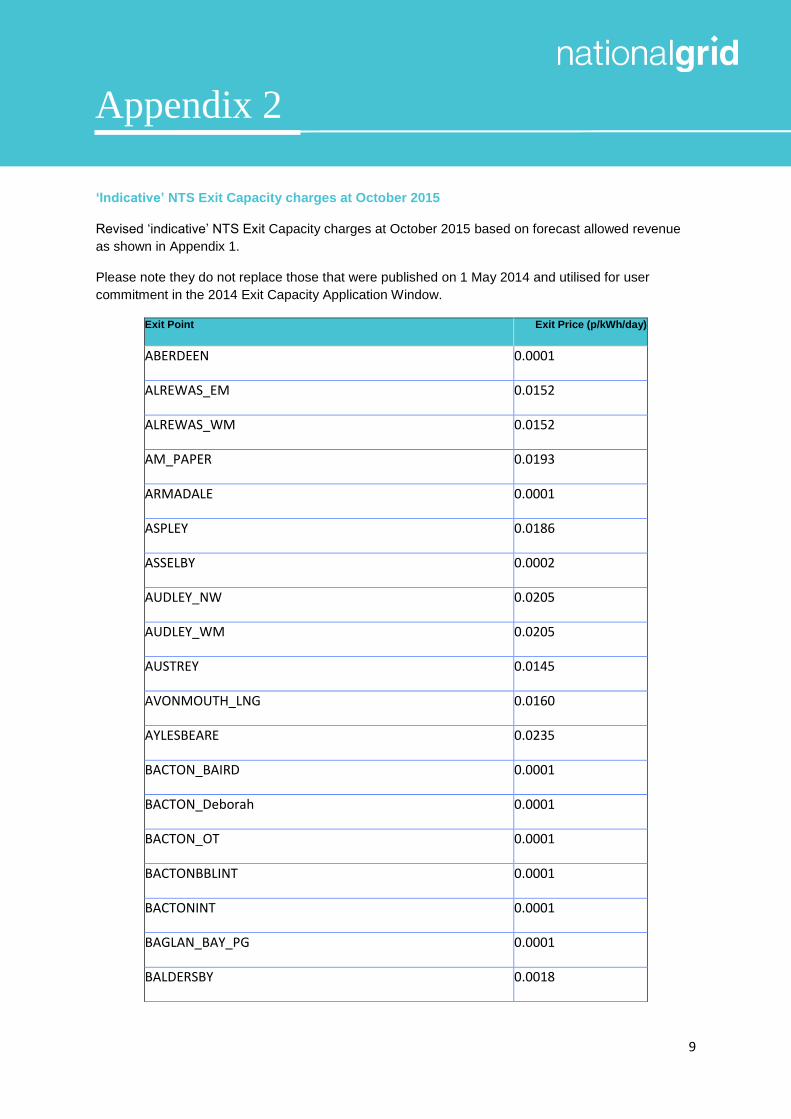
‘Indicative’ NTS Exit Capacity charges at October 2015
Revised ‘indicative’ NTS Exit Capacity charges at October 2015 based on forecast allowed revenue
as shown in Appendix 1.
Please note they do not replace those that were published on 1 May 2014 and utilised for user
commitment in the 2014 Exit Capacity Application Window.
Exit Point Exit Price (p/kWh/day)
ABERDEEN 0.0001
ALREWAS_EM 0.0152
ALREWAS_WM 0.0152
AM_PAPER 0.0193
ARMADALE 0.0001
ASPLEY 0.0186
ASSELBY 0.0002
AUDLEY_NW 0.0205
AUDLEY_WM 0.0205
AUSTREY 0.0145
AVONMOUTH_LNG 0.0160
AYLESBEARE 0.0235
BACTON_BAIRD 0.0001
BACTON_Deborah 0.0001
BACTON_OT 0.0001
BACTONBBLINT 0.0001
BACTONINT 0.0001
BAGLAN_BAY_PG 0.0001
BALDERSBY 0.0018

10
Appendix 2
Exit Point Exit Price (p/kWh/day)
BALGRAY 0.0001
BARKING_PG 0.0107
BARROW_BAINS 0.0087
BARROW_BS 0.0087
BARROW_GATEWAY 0.0087
BARTON_STACEY_(MRS) 0.0223
BATHGATE 0.0001
BILLINGHAM_ICI 0.0001
BISHOP_AUCKLAND 0.0001
BISHOP_AUCKLAND_TEST_FACILITY 0.0001
BLABY 0.0113
BLACKROD 0.0172
BLYBOROUGH 0.0022
BP_GRANGEMOUTH 0.0001
BP_SALTEND_HP 0.0001
BRAISHFIELD_A 0.0241
BRAISHFIELD_B 0.0241
BRIDGEWATER_PAPER 0.0249
BRIGG_PG 0.0033
BRIMSDOWN_PG 0.0113
BRINE_FIELD_PS 0.0001
BRISLEY 0.0001
BROXBURN 0.0001

11
Appendix 2
Exit Point Exit Price (p/kWh/day)
BRUNNER_MOND 0.0230
BURLEY_BANK 0.0041
BURNHERVIE 0.0001
CALDECOTT 0.0086
CAMBRIDGE 0.0067
CARESTON 0.0001
CARRINGTON_PS 0.0224
CAYTHORPE_(MRS) 0.0001
CENTRAX 0.0263
CHESHIRE_(MRS) 0.0223
CHOAKFORD 0.0296
CIRENCESTER 0.0116
COCKENZIE_PS 0.0001
COFFINSWELL 0.0265
COLDSTREAM 0.0001
CONNAHS_QUAY_PS 0.0253
CORBRIDGE 0.0023
CORBY_PS 0.0090
CORYTON_PG 0.0104
CORYTON_PG_2 0.0104
COTTAM_PG 0.0022
COWPEN_BEWLEY 0.0001
CRAWLEY_DOWN 0.0226

12
Appendix 2
Exit Point Exit Price (p/kWh/day)
DAMHEAD_CREEK 0.0082
DEESIDE_PS 0.0253
DIDCOT_PS 0.0181
DOWLAIS 0.0001
DRAKELOW_PS 0.0147
DROINTON_OT 0.0165
DRUM 0.0001
DYFFRYN_CLYDACH 0.0001
DYNEVOR_ARMS_LNG 0.0001
EASINGTON&ROUGH_TERMINAL 0.0001
EASTON_GREY 0.0122
ECCLESTON 0.0241
ELTON 0.0001
ENRON_(BILLINGHAM) 0.0001
EVESHAM 0.0082
EYE 0.0056
FARNINGHAM 0.0109
FARNINGHAM_B 0.0109
FIDDINGTON 0.0068
GANSTEAD 0.0001
GARTON_(MRS) 0.0001
GILWERN 0.0003
GLENMAVIS 0.0001

13
Appendix 2
Exit Point Exit Price (p/kWh/day)
GLENMAVIS_LNG 0.0001
GOOLE_GLASS 0.0008
GOSBERTON 0.0034
GRAIN_GAS 0.0082
GREAT_WILBRAHAM 0.0056
GREAT_YARMOUTH 0.0001
GUYZANCE 0.0001
HARDWICK 0.0142
HATFIELD_MOOR_(MRS) 0.0013
HATFIELD_POWER_STATION 0.0004
HAYS_CHEMICALS 0.0217
HILLTOP_FARM 0.0216
HOLEHOUSE_FARM_(MRS) 0.0216
HOLMES_CHAPEL 0.0218
HORNDON 0.0107
HORNSEA_(MRS) 0.0001
HUMBLETON 0.0001
HUME 0.0001
ICI_RUNCORN 0.0250
ILCHESTER 0.0187
IMMINGHAM_PG 0.0001
IPSDEN 0.0178
IPSDEN_2 0.0178

14
Appendix 2
Exit Point Exit Price (p/kWh/day)
KEADBY_BS 0.0021
KEADBY_PS 0.0021
KELD 0.0098
KEMIRAINCE_CHP 0.0246
KENN 0.0247
KINGS_LYNN_PS 0.0022
KINKNOCKIE 0.0001
KIRKSTEAD 0.0011
LANGAGE_PG 0.0296
LANGHOLM 0.0034
LAUDERHILL 0.0001
LEAMINGTON_SPA 0.0111
LITTLE_BARFORD_PS 0.0099
LITTLE_BURDON 0.0001
LITTLETON_DREW 0.0130
LOCKERBIE 0.0024
LONGANNET 0.0001
LOWER_QUINTON 0.0094
LUPTON 0.0127
LUXBOROUGH_LANE 0.0110
MAELOR 0.0235
MALPAS 0.0226
MAPPOWDER 0.0210

15
Appendix 2
Exit Point Exit Price (p/kWh/day)
MARCHWOOD 0.0244
MARKET_HARBOROUGH 0.0099
MATCHING_GREEN 0.0102
MEDWAY_PS 0.0083
MELKINTHORPE 0.0089
MICKLE_TRAFFORD 0.0239
MILFORD_HAVEN_REFINERY 0.0001
MILWICH 0.0172
MOFFAT 0.0011
NETHER_HOWCLEUGH 0.0003
PANNAL 0.0046
PARTINGTON 0.0224
PARTINGTON_LNG 0.0224
PAULL 0.0001
PEMBROKE_PG 0.0001
PETERBOROUGH_PS 0.0060
PETERHEAD_PG 0.0001
PETERS_GREEN 0.0103
PETERS_GREEN_SOUTH_MIMMS 0.0103
PHILLIPS_SEAL_SANDS 0.0001
PICKERING 0.0014
PITCAIRNGREEN 0.0001
PUCKLECHURCH 0.0140

16
Appendix 2
Exit Point Exit Price (p/kWh/day)
RAWCLIFFE 0.0004
ROCKSAVAGE_PG 0.0250
ROLLS_WOOD 0.0001
ROOSECOTE_PS 0.0087
ROSS_SW 0.0036
ROSS_WM 0.0036
ROUDHAM_HEATH 0.0015
ROYSTON 0.0077
RUGBY 0.0124
RYE_HOUSE_PS 0.0118
SALTEND 0.0001
SALTFLEETBY 0.0001
SALTWICK_PC 0.0009
SALTWICK_VC 0.0009
SAMLESBURY 0.0156
SAPPIPAPERMILLCHP 0.0161
SEABANK_LDZ 0.0162
SEABANK_POWER_phase_II 0.0160
SEABANK_POWER_phase1 0.0140
SELLAFIELD_PS 0.0132
SEVERNSIDE_ICI 0.0159
SHORNE 0.0097
SHOTTON_PAPER 0.0252

17
Appendix 2
Exit Point Exit Price (p/kWh/day)
SHUSTOKE 0.0158
SILK_WILLOUGHBY 0.0025
SOUTRA 0.0001
SPALDING_PG 0.0038
SPALDING_PG_2 0.0038
ST_FERGUS_BS 0.0001
ST_FERGUS_OT 0.0001
STALLINGBOROUGH 0.0001
STAYTHORPE 0.0055
STRANRAER 0.0011
STRATFORD_UPON_AVON 0.0096
STUBLACH 0.0223
SUTTON_BRIDGE 0.0043
SUTTON_BRIDGE_PS 0.0041
TATSFIELD 0.0128
TEESSIDE_BASF 0.0001
TEESSIDE_HYDROGEN 0.0001
THORNTON_CURTIS_(KILLINGHOLME) 0.0001
THORNTON_CURTIS_LDZ 0.0001
THRINTOFT 0.0011
TILBURY_PS 0.0100
TOW_LAW 0.0019
TOWTON 0.0027

18
Appendix 2
Exit Point Exit Price (p/kWh/day)
TUR_LANGTON 0.0101
WALESBY 0.0001
WARBURTON 0.0221
WEST_BURTON_PS 0.0023
WEST_WINCH 0.0023
WESTON_POINT 0.0250
WETHERAL 0.0061
WHITWELL 0.0099
WILLINGTON_PS 0.0163
WINKFIELD_NT 0.0201
WINKFIELD_SE 0.0201
WINKFIELD_SO 0.0201
WYRE_PS 0.0168
YELVERTON 0.0001
ZENECA 0.0001

19
Appendix 3
Summary of Commodity Charges
The table below summarises the changes to the Commodity charges being made in April 2015. A
comparison between the average Commodity rate during 2014/15 and the indicative rates for 2015/16
is also provided.
Charge p/kWh Oct-14 Average
1
April 2015 Indicative
April 2015 Final
(Current) 2014/15
NTS TO Entry commodity
0.0431 0.0382 0.0443 0.0451
NTS TO Exit commodity
0.0200 0.0188 0.0195 0.0198
NTS SO commodity (Entry & Exit)
0.0185 0.0195 0.0177 0.0169
St. Fergus Compression
0.0169 0.0171 0.0181 0.0175
1 Calculated from the forecast annual revenue collectable from the charge and the relevant forecast
annual chargeable volumes